The Wellbeing of Children and Young People - EAST GIPPSLAND REPORT 2018 - Save the ...
←
→
Page content transcription
If your browser does not render page correctly, please read the page content below
The Wellbeing of Children
and Young People
EAST GIPPSLAND REPORT 2018
2 | The Wellbeing of Children and Young People
LIST OF CONTENTS

1.      Acknowledgements                                                                                                                               1
2.      Foreword                                                                                                                                       2
3.      Why the Children’s Wellbeing Initiative?                                                                                                       3
4.      Introduction to the Data                                                                                                                       5
5.      Executive Summary                                                                                                                              7
6.      East Gippsland - Community Profile                                                                                                             9
7.      Domains of Wellbeing for children and young people                                                                                           14
        Domain 1: Developing Well                                                                                                                    14
        Domain 2: Safe and Secure                                                                                                                    19
        Domain 3: Happy and Healthy                                                                                                                  23
        Domain 4: Engaged, Learning and Achieving                                                                                                    31
        Domain 5: Active Citizens                                                                                                                    39

8.      Next Steps                                                                                                                                   45
9.      Acronyms                                                                                                                                     46
10.     References                                                                                                                                   47

Save the Children Australia acknowledge the traditional custodians of the land on which we live and work, the Gunai/Kurnai people and pay our
deepest respects to elders past, present and future.

Photography: Thanks to Sarah Bell for generously providing photography and Marcel Verkaart (Youth Ambassadors photo) and headspace
(Bairnsdale) for sharing their photos. Thank you to all the children, young people, families and community members who allowed their images to be
used in this document.

This publication is copyrighted. No part may be reproduced by any process except in accordance with the provisions of the Copyright Act 1968.
This report is for information purposes only. It has been provided on the basis that readers will be responsible for making their own assessments of the
matters discussed. All representations, statements and information should be verified and independent advice obtained before acting on any information
contained in or in connection with this report. While every effort has been made to ensure that the information is accurate, Save the Children Australia
will not accept any liability for any loss or damage which may be incurred by any person acting in reliance upon the information.

                                                                                                                   East Gippsland Report 2018 | 3
ACKNOWLEDGEMENTS

The Wellbeing of Children and Young People East Gippsland Report 2018 has been enabled by the
backing of The R E Ross Trust, Helen Macpherson Smith Trust and Gippsland Lakes Community
Health. This support extends to the work of the Children’s Wellbeing Initiative — East Gippsland
at Save the Children. The previous State of East Gippsland’s Children and Youth Report (Good
Beginnings, Australia, 2013) was funded by The Ian Potter Foundation, The R E Ross Trust and
Gandel Philanthropy. We acknowledge this support, as well as funding from The Ian Potter
Foundation for the initial development of the Children’s Wellbeing Initiative in East Gippsland.
The Wellbeing of Children and Young People East Gippsland Report 2018 was developed by Rachel Bell and Rachael
Dooley — the Children’s Wellbeing Initiative staff at Save the Children — with support from Linda Wilkinson from
Kaleidoscope Projects and Research, and assistance from the Gippsland East Local Learning and Employment
Network (LLEN). Thanks to the Youth Ambassadors and Headspace (Bairnsdale) for sharing stories of their work in
the community. Thanks to Cate Newcomen or her hard work in producing the the previous report and for providing
feedback on this report. A special thank you to Darryl Andy and Lynette Solomon-Dent for sharing their reflections
and wise words.

We would also like to acknowledge the support of additional previous funders: Australian Government’s Department
of Social Services (DSS), Gippsland Primary Health Network, East Gippsland Primary Care Partnership and East
Gippsland Shire Council. In addition, the Communities for Children program at Uniting Gippsland — funded by the
Australian Government — have provided support for a range of partnership actions in priority areas of the Children’s
Wellbeing Initiative over the last three years.

Thanks to the Children’s Wellbeing Collective members, working group members, partners, parents and volunteers for their
time and commitment to improving outcomes for children in East Gippsland. Save the Children Australia acknowledges
all the leaders in East Gippsland who are working towards improved outcomes for children and young people.

Lastly, a big thank you to our current funding partners for their support: The R E Ross Trust, Helen Macpherson
Smith Trust, Victorian Department of Health and Human Services, Gippsland Lakes Community Health and Save the
Children Maffra branch who make focus on the wellbeing of children and young people in East Gippsland possible.

1 | The Wellbeing of Children and Young People
FOREWORD

It is with great pleasure that I write the foreword to The Wellbeing of Children and Young People –
East Gippsland Report 2018.
This report is a follow-up to State of East Gippsland’s     The five priority areas include:
Children & Youth Report, the first snapshot produced           1. Children with additional needs
in 2013 by Good Beginnings Australia – which                   2. Children’s social & emotional wellbeing
Save the Children merged with in 2015.
                                                               3. Family violence prevention
The first report, developed through a range of                 4. Substance abuse prevention
consultations across the region, told a local story of         5. Service access.
wellbeing. It provided a measurement of how children
in East Gippsland were faring at the time – where the       The Wellbeing of Children and Young People –
region was doing well and where it required further         East Gippsland Report 2018 highlights there are some
attention. It also provided a framework to track            positive shifts for children in the region. It is promising
progress and a tool for future planning to ensure the       to see improvements in the areas we are working in,
best outcomes for the future adults in the region.          however it would be premature to attribute these
                                                            changes directly at the Children’s Wellbeing Initiative
The response to the 2013 report was the establishment       at this point. The outcomes of the Children’s Wellbeing
of the Children’s Wellbeing Initiative – East Gippsland,    Initiative are long-term. The report points to some
a program using a collective impact framework to            significant challenges for the community to tackle.
improve children’s wellbeing. With leadership from          These challenges – requiring collaborative action and
the Children’s Wellbeing Collective – a partnership         effort – include school readiness, breastfed babies
of organisations from the community, health and             to six-months and beyond, family violence, and the
education sectors – the program aims to strengthen and      number of children and young people who experience
build collaborative community responses to the needs of     bullying and are a victim of crime. Whilst there are
children and youth in East Gippsland.                       promising outcomes to date and we have made
                                                            progress in filling data gaps, we still need to access
Save the Children is extremely proud to lead this
                                                            data at a local level to track intermediate changes.
work. To harness community resources to improve
environments for children and families in the region –      Every organisation and community member in East
so they can grow up healthy, happy and safe with a          Gippsland has a role to play in turning these challenges
prosperous future.                                          around – combining efforts to create positive change and
                                                            really focus on the wellbeing of children and young people.
The Children’s Wellbeing Initiative facilitates community
                                                            I look forward to seeing what we can achieve together.
responses in five priority areas. These have been
developed based on population level data, feedback          Save the Children is committed to producing this report
from services and families, and research about risk and     every five years to review progress and to continue
protective factors for children and young people.           to shine a light on the wellbeing of children and young
                                                            people. I am pleased to present the 2018 report, and look
                                                            forward to the next one – to reporting on the progress
                                                            made in improving the wellbeing of children and young
                                                            people in East Gippsland.

                                                            Paul Ronalds
                                                            CEO Save the Children Australia

                                                                                        East Gippsland Report 2018 | 2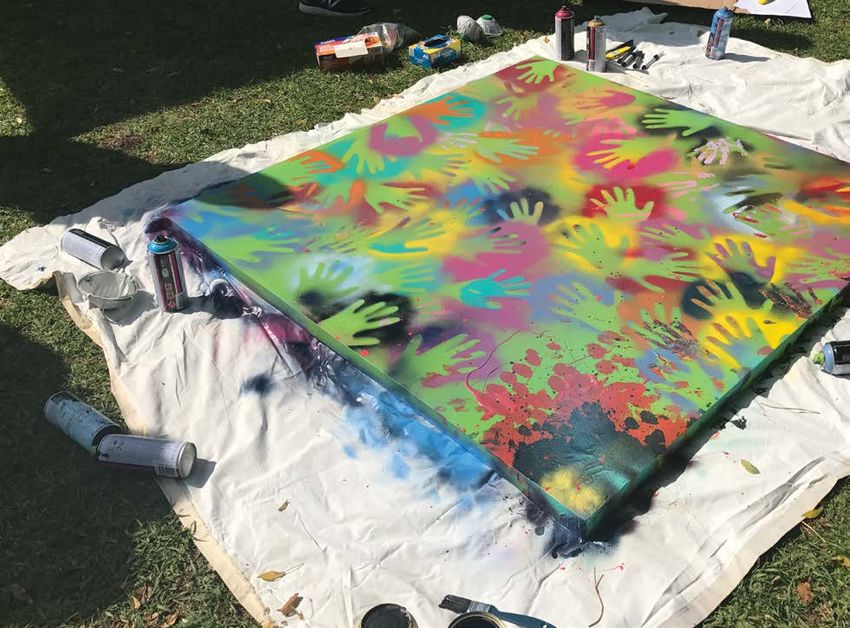
WHY THE CHILDREN’S WELLBEING INITIATIVE?

The Children’s Wellbeing Initiative- East Gippsland is the community response to the State of East
Gippsland’s Children & Youth Report (Good Beginnings Australia, 2013). Furthermore, a range of
literature highlights the importance of children’s wellbeing and has informed the program logic and
development of the Children’s Wellbeing Initiative. The research focuses on two areas: why efforts
are channelled towards children’s wellbeing, and how the Children’s Wellbeing Initiative is informed
by collective impact frameworks (stakeholders working together) and systems thinking (how many
parts and issues in the community are linked and influence each other).
Emerging research shows the importance of supportive environments for children from pregnancy to age six to enable
wellbeing. Moore (2014) states that a different approach is needed to address early childhood vulnerability due to the
complexity of addressing poor outcomes for children. In addition to this, research regarding risk and protective factors
for children and young people indicates factors which influence wellbeing at multiple levels: child, family, and the
community (Toumbourou, Olsson, Rowland, Renati, & Hallam, 2014).

This research is further reinforced by a body of literature that points to the need and value of early intervention and
prevention for improved outcomes for children and young people (Grey, 2014; Moore and West, 2016). This reinforces
the ethics of improving environments for children from a human rights perspective and an economic perspective
(Bartik, 2011).

Secondly, the Children’s Wellbeing Initiative is informed by collective impact, systems theory and complexity concepts.
Collective impact is a planned development with a central premise of stakeholders pledging to collectively work
together in an ongoing way to tackle social problems through changing behaviours (Garber and Adams, 2017).
Five elements of collective impact have been dentified; "a common agenda, shared measurement systems, mutually
reinforcing activities, continuous communication, and backbone support organisations” (Kania and Kramer in Garber
and Adams, 2017). There are examples of collective impact approaches leading to continued improvements. This
has seen an increase in the approach being used to address community issues to address community issues (Walzer,
Weaver and McGuire, 2016).w

The program logic for the Children’s Wellbeing Initiative has been derived from the research regarding the importance
of early childhood development and the effectiveness of using a collective impact framework to address complex
community issues. Because of the complexity of the issues of addressing children’s wellbeing, the Children’s Wellbeing
Initiative has also drawn on systems theory to assist in engaging community and understanding complex issues, such
as family violence.

The Children’s Wellbeing Initiative embraces the following practice approaches (principles for
Save the Children Australia):
   1. Strengths-based;
   2. Place-based and locally-led and owned;
   3. Sustainable with community capacity building;
   4. Child-focussed, family centred;
   5. Culturally safe & competent;
   6. Trauma informed;
   7. Inclusive & collaborative;
   8. Evidence-informed & outcomes based.

3 | The Wellbeing of Children and Young People
The following outlines the role Save the Children has in the Children’s Wellbeing Initiative:
   •   Collecting data and reporting on the wellbeing of children and young people every four years;

   •   Producing annual reports for the collective, stakeholders and community;

   •   Coordinating stakeholder engagement and facilitating partnerships;

   •   Supporting priority areas and actions.

The Children’s Wellbeing Initiative at Save the Children gives leverage to the priorities identified by the Children’s
Wellbeing Collective (CWC). The CWC is a partnership of organisations from across the community, health and
education sectors working together to build and strengthen collective actions in priority areas. The CWC have
updated the East Gippsland Early Years Plan and developed short-term action plans. A review of the work of the
CWC found that 80% of actions identified were completed by partners.

The following outlines the long-term, intermediate and short-term outcomes that the Children’s Wellbeing Initiative
and the Children’s Wellbeing Collective are working towards

Long-term outcomes (in the East Gippsland Early Years Plan):

    1. Our children are healthy, developing well, and safe and secure;
    2. Our families are able to meet the needs and promote the development of their children;
    3. Our communities are accepting and supportive of all families;
    4. Our services are cooperative, integrated, inclusive and deliver high quality.

Intermediate outcomes (in the Children’s Wellbeing Collective Action Plan):

    1. Children with additional needs get what they need to support their development;
    2. Families are able to support children’s social and emotional wellbeing;
    3. Strengthen families to prevent alcohol and drug abuse;
    4. Strengthen families to demonstrate respectful relationships;
    5. Family Ready Agencies / Organisations improve access and support for families.

Short-term outcomes:

    1. Improved capacity to respond to priority areas;
    2. Engagement in priority areas by stakeholders;
    3. Increased knowledge for improved practice in priority areas;
    4. Increased knowledge and information for parents and carers.

                                                                                             East Gippsland Report 2018 | 4
INTRODUCTION TO THE DATA

This report presents a snapshot of the                     Hearing the stories of families, children and young
Wellbeing of Children and Young People East                people helps to present a holistic understanding of what
                                                           is actually going on. This is something to be considered
Gippsland in 2018.
                                                           when looking at the data and we hope that this report
The first report, State of East Gippsland’s Children &     can stimulate storytelling in respective communities.
Youth Report (Good Beginnings Australia, 2013) was         This report presents the 'what?' We need to ensure
developed with feedback from the community about           that we also hear the 'why?' when working in East
what key indicators tell us about the wellbeing of         Gippsland’s communities. The work of the Children’s
children and young people. These indicators were           Wellbeing Initiative and Collective has a focus on
identified by over 60 key stakeholders and community       moving from the 'what' to the 'why?' We address the the
members from across the region in 2012. From this          question of 'how' in partnership with communities.
process, 24 indicators were identified over five domains
                                                           To compare East Gippsland with other communities,
representing the journey from birth to 24 years. The
                                                           we use Victorian State data and Australia-wide.
five wellbeing domains are: 1. Developing Well; 2. Safe
                                                           Where we are doing well compared with Victoria or
and Secure; 3. Happy and Healthy; 4. Engaged, Learning
                                                           wider Australia there is a blue tick; where we need
and Achieving; and 5. Active Citizens. These domains are
                                                           to improve there is a red cross. We have used blue
aligned with The Nest — a national plan for child and
                                                           or red arrows to indicate whether we have improved
youth wellbeing.
                                                           or declined over time. A yellow equals sign indicates
The Nest Action Agenda is Australia’s first evidence-      that we have stayed about the same, or the difference
based framework for national child and youth wellbeing     is not statistically significant. A number of data gaps
(0-24 years). It focuses across six wellbeing domains:     identified in the 2013 report have been amended in this
1) Loved and Safe; 2) Material Basics; 3) Healthy;         report, however some still remain.
4) Learning; 5), Participating; and 6) Positive Sense
                                                           The data is reported in figures and also in words.
of Culture & Identity. The Nest aims to align efforts
                                                           Behind the words and figures are children, young
to improve the wellbeing of children and youth aged
                                                           people and families. Each one with their own
0-24 years across Australia. It collectively identifies
                                                           experience, background, culture and values. Each one
the outcomes that we want to achieve for children
                                                           equally as important as the other. We need to bear in
and youth; the most effective prevention-focused and
                                                           mind that the measures in this report are part of the
evidence-based ways to achieve these; and how we
                                                           story and not the whole story.
can best align our collective efforts to achieve them
(Australian Research Alliance for Children and Youth,      The measures used in this report reflect systems
ARACY, 2014).                                              developed by Western culture. We need to bear this
                                                           in mind thinking about Aboriginal and Torres Strait
The majority of data presented in this report is
                                                           Islander children, young people and families. Culture
regularly updated data that is readily available in the
                                                           is such an important consideration in how our lives
East Gippsland local government area (LGA). Looking
                                                           operate and how we see the world. We need to think
at local data over time paints a picture of what is
                                                           about how we capture the strengths, knowledge and
happening for children and young people. A significant
                                                           culture of Aboriginal Elders, community and children in
amount of the data is quantitative. Whilst numbers are
                                                           this story.
important, the other aspect to the data is qualitative.

     NEED TO                                                                                        DATA GAP
                       DOING WELL         IMPROVEMENT        DECLINE        ABOUT THE SAME
     IMPROVE                                                                                       IDENTIFIED

5 | The Wellbeing of Children and Young People
East Gippsland Report 2018 | 6
EXECUTIVE SUMMARY

The Wellbeing of Children and Young People East Gippsland Report 2018 highlights that there
are some positive shifts in the population level data for children in East Gippsland. It also provides
additional data at a Local Government Level (LGA) for East Gippsland which points to challenges
for the community to tackle. Changes to data-gathering means making a direct comparison with
the previous report is not possible.

Areas in which East Gippsland Children and                    In comparison with the previous report, there have
Young People are doing well, compared to the                  been some statistically significant improvements in
state average:                                                the Australian Early Development Census (AEDC)
                                                              data for East Gippsland from 2012 to 2015. Significant
DOING WELL                                                    decreases have occurred in the percentage of children
Compared to the Victorian average:                            who are developmentally vulnerable in physical health
                                                              and wellbeing (although still higher than Victoria as a
   •   High percentages of children are having their
                                                              whole) and in terms of emotional maturity. There has
       MCH checks at nearly all ages
                                                              also been a significant decrease in the percentage of
   •   Higher numbers of Aboriginal and/or Torres Strait      children from 2012 to 2015 who are developmentally
       Islander children at all ages are having MCH checks    vulnerable on two or more domains (out of five
   •   A high percentage of children in far East Gippsland    domains) and this is now similar to State-wide figures.
       are receiving their MCH three-years-and-six-
       months check                                           IMPROVING
   •   Children’s emotional maturity at school entry          While still below the Victorian average, these
       level has improved                                     areas are showing improvements over time:

   •   There is a slightly higher proportion of five to          •   While children’s physical health and wellbeing, social
       13-year-old children who did 60 minutes of                    competence, communication skills and general
       physical activity every day                                   knowledge when starting school has improved
   •   In East Gippsland and Wellington Shires there is              from 2012-2015, there are still more children in East
       a higher proportion of newborn to four-year-old               Gippsland who are developmentally vulnerable than
       children who are read to by a family member                   the Victorian average
       every day                                                 •   The number of 19-year-olds completing Year 12
   •   Aboriginal and/or Torres Strait Islander students             or equivalent is increasing
       in Year Three in East Gippsland are above                 •   The percentage of Aboriginal and/or
       Victoria’s average in numeracy (NAPLAN)                       Torres Strait Islander young people staying
   •   There are significantly higher rates of young                 at school from Year Seven to Twelve appears to
       people with an apprenticeship or traineeship                  be increasing and warrants further investigation
                                                                     to confirm this
   •   The rates of young people in employment after
       Year 12 is double the rate for those State-wide           •   More young people who leave school are
                                                                     experiencing a successful transition to
   •   The unemployment rates of young people aged 15
                                                                     education, training or employment
       to 19 years old are significantly less than Victoria
   •   There is a higher percentage of residents in East
       Gippsland who remained at the same address
       both one year ago and five years ago compared
       with Victoria-wide

7 | The Wellbeing of Children and Young People
OUR CHALLENGES DATA GAPS FILLED
Compared to Victorian averages, we face Since the previous report in 2013, data is now
the following challenges for children and available for some of the identified data gaps;
young people: • Children are eating well – data was sourced
• The percentage of children arriving at school from the Victorian Child Health and Wellbeing
who are developmentally vulnerable in: physical Survey (accessed from VCAMS)
health and wellbeing, language and cognitive • Children who have good oral health – data
skills, communication skills and general was sourced from Bairnsdale Regional Health
knowledge starting school are higher Service and the School Entrant Health Questionnaire
• The number of babies being breastfed at six- (accessed from VCAMS) to provide a snapshot
months-old is significantly lower • Number of young people impacted by mental
• The percentage of four-year-olds attending health issues – data was sourced from the
kindergarten has been decreasing since 2011, Communities that Care- East Gippsland Youth
this requires further exploration as outlined in Survey (Cooney, Smith & Toumbourou, 2015) and
indicator 16 the Middle Development Index highlighted concerns
• The number of family violence incidences are about coping, emotional control and overall wellbeing
higher, along with a high number of children and • Substance misuse – families and young people.
young people who are present at family violence Data was sourced from the Communities that Care-
incidences East Gippsland Youth Survey (Cooney, Smith &
• The number of children and young people who Toumbourou, 2015). Data from the Department of
are a victim of crime continues to be much higher Education (2016, SEHQ) indicates a percentage of
alcohol and drug related problems in families
• The rates of children who report being bullied in
Year Five to Nine are much higher It has been valuable to have access to the
Communities that Care – East Gippsland Youth Survey
• The percentage of children at high risk of
(Cooney, Smith & Toumbourou, 2015) and the
emotional and behavioural difficulties is greater
Middle Development Index trial results. This data
• Parents who have concerns about oral health helps to tell the story of what is happening for young
are higher, children in East Gippsland have higher people as it presents a sample of their experiences
rates of teeth decayed, missing or filled and living in East Gippsland
the proportion of children who have visited the
dentist is now lower than the Victorian average • Families support their children’s learning
• There is a higher percentage of children who Parents reading to their children for Outer Gippsland
have additional needs (East Gippsland and Wellington Shires) Data was
sourced from the Victorian Child and Adolescent
• The rising number of child protection
Monitoring System (VCAMS). Whilst this is broader than
substantiations needs attention
East Gippsland it helps to give an idea of how many
The following compares a sample of East parents read to children aged under five-year-olds.
Gippsland students with Australian students
and shows that: OUR DATA GAPS
• Year Eight East Gippsland students report a The following are data gaps that still remain for
significantly higher level of depressive symptoms the twenty-four indicators:
compared with the same group Australia-wide • Parents attending parent education and/or
• Students report a decline in coping with stress support programs
from Year Six to Ten • East Gippsland residents who remained
• Compared with students across Australia, in public housing
Year Eight East Gippsland students report • Number of Aboriginal and/or Torres Strait
significantly lower levels of emotional control Islander children attending four-year-old
• East Gippsland students report significantly kindergarten
higher rates of lifetime and recent alcohol use
East Gippsland Report 2018 | 8EAST GIPPSLAND - COMMUNITY PROFILE
The following provides a picture of the community environment in which our children and young
people grow up. The environment in which children experience life has a lasting impact on their
capacity and wellbeing.
The Landscape
East Gippsland Shire is located in the eastern corner of Victoria, up to 550 kilometres from Melbourne. It covers
21,051 square kilometres and is the second largest municipality in Victoria. The main towns of the Shire are:
Bairnsdale, Lakes Entrance, Orbost, Paynesville, Omeo and Mallacoota. Bairnsdale has the largest population
and is also the regional retail and service centre. The geography of the area is complex, featuring large areas of
national park and state forest, an extensive coastline and productive farmland. Mountains, rivers and lakes are
barriers to easy travel.
Distance between major towns in kilometres:
LAKES SWIFTS
BAIRNSDALE CANN RIVER OMEO ORBOST MALLACOOTA
ENTRANCE CREEK
Bairnsdale . 174 35 131 97 100 250
Cann River 174 . 139 272 77 241 76
Lakes
35 139 . 139 62 105 215
Entrance
Omeo 131 272 136 . 195 31 348
Orbost 97 77 62 195 . 164 153
Swifts Creek 100 241 105 31 164 . 317
Mallacoota 250 76 215 348 153 317 .
The unique geography and overall size of East Gippsland
makes transport an on-going issue for families and children
to travel easily around the region. This in turn creates
challenges in accessibility to critical services such as health
care, education and employment. Whilst some improvement
to transport access has occurred over the last few years,
particularly with extra services per day from Orbost to
Bairnsdale, those in remote areas still have limited or no
access to public transport.
9 | The Wellbeing of Children and Young PeopleThe Population
In 2016 there were 45,040 people residing in East Gippsland. The population of East Gippsland has increased nearly
seven percent between 2011 and 2016 – an increase of 2844 people. Children and young people under 25-years-old
make up 25% of the total East Gippsland population in 2016, a two percent decrease. The older cohorts, those over
65, have increased by 4000 people to make-up 45% of the population.
Aboriginal and/or Torres Strait Islander people make up nearly three percent of the East Gippsland population or
1288 people. This can be compared with the Victoria wide average of nearly one percent. The total Aboriginal and/or
Torres Strait Islander population is comprised of 54% of children and young people under 25. Those over 65-years-old
make up just six percent of the total Aboriginal and/or Torres Strait Islander population.
0-4 5-14 15-19 20-24 25-34 35-44 45-64 65 + TOTAL
Total population 2228 4924 2292 1822 3817 4278 12978 12697 45040
Aboriginal and/or Torres
145 321 131 95 140 113 267 83 1288
Strait Islander population
Source: ABS Census 2016, East Gippsland Community Profile.
East Gippsland Report 2018 | 10Main Population Centres:
MAIN POPULATION CENTRES BY AGE 0-4 5-9 10-14 15-19 20-24
Bairnsdale (total population 7580) 447 426 387 431 460
Orbost (total population 2227) 100 152 134 120 76
Lakes Entrance (total population 4810) 220 231 238 242 182
Paynesville (total population 3840) 125 148 137 150 99
Omeo (total population 406) 27 18 23 15 16
Swifts Creek (total population 278) 9 26 17 19 7
Mallacoota (total population 1063) 34 37 55 42 15
Source: ABS Census 2016, Quick Stats, State Suburbs Collection.
The population in Bairnsdale, Lakes Entrance, Paynesville
Omeo
and Mallacoota increased between 2011-2016, while in
Swifts
Omeo, Orbost and Swifts Creek, populations have declined. Creek
Bruthen
Major Aboriginal and/or Torres Strait Islander population Orbost
Cann
centres are Orbost, Bairnsdale, Lakes Entrance, Lake Tyers, Lakes
River Mallacoota
Entrance
Nowa Nowa and Cann River (Source: ABS Census 2016, Bairnsdale
Quick Stats, State Suburbs Collection). Paynesville
Projected Population
60,000
AGE GROUP 2021 2026 2031
0-4 2179 2324 2445 Total
50,000
5-9 2357 2446 2599
10-14 2742 2562 2669 40,000
Population
15-19 2563 2697 2520
30,000
20-24 2146 2182 2270
25-34 2146 2182 2270
20,000
35-44 4084 4460 4852 65+
45-54 5709 5565 5781 10,000
55-64 7182 7180 7069
0-10
65+ 13471 13205 16524 0
2021 2026 2031
Total 47118 49647 52150
Year
Source: DEWLP, Victoria in Future 2016.
The population projections indicate an increase in the number of newborn to nine-year-olds over the next 15 years,
and a significant increase in the number of elderly people 65 and over. The total population of East Gippsland is
projected to increase by 16% by 2031.
11 | The Wellbeing of Children and Young PeopleSocio-Economics Families
The ABS Socio-Economic Indexes for Areas (SEIFA) In 2016, East Gippsland had 3866 couples with children,
measure different aspects of social and economic and 1721 one-parent families. One-parent families
conditions in areas of Australia. Indicators used make up 14.5% of families, an increase from just
include low income, low educational attainment, under ten percent in 2011. One-parent families make
high unemployment, and jobs in relatively unskilled up 23% of Aboriginal and/or Torres Strait Islander
occupations. The lower the index number, the higher the households, which has decreased from 29% since 2011.
level of disadvantage. Note: At the time of publication, East Gippsland has more than double the teenage
the updated SEIFA index data was not available (due fertility rate than the Victorian average (Sources:
for release March 2018). The following data is from Need Assessment, PHN, ABS Census 2016 Quick Stats,
the 2011 Census. The municipality of East Gippsland Community Profile East Gippsland LGA and Indigenous
has an index of 958.2 which places it among the most Profile, East Gippsland).
disadvantaged 21% of municipalities in the state. It ranks
it as number 17 in the level of disadvantage among the Educational Attainment
municipalities of Victoria. As a comparison, Regional Educational attainment is an important social
Victoria has an index of 977.7, and Victoria as a whole determinant of health and a strong indicator of future
1009.6. Within the East Gippsland region there are economic and social success for both individuals and
varying levels of SEIFA index figures. communities.
The median household income per week in East In East Gippsland, 50.3% of people aged over 15 years
Gippsland is $935, compared with $1216 for Victoria as have attained Year 12 or higher, compared with 63.8%
a whole. The median individual income per week in East across Victoria. In East Gippsland, 36.6% of Aboriginal
Gippsland is $506, compared with $644 across Victoria. and/or Torres Strait Islander people have attained Year
The median individual income for Aboriginal and/or 12 or higher, compared with 42.2% across Victoria (ABS
Torres Island people in East Gippsland is $368 (ABS Census 2016).
Census 2016).
The unemployment rate in East Gippsland was nearly
six-and-a-half percent in 2016, indicating an increase
of one percent since 2011. The unemployment rate for
Aboriginal and/or Torres Strait Islander people is 19.5%,
an increase of three percent since 2011. There are 17.3%
of children under 15 in jobless families, compared to
Gippsland at 16.6% and Victoria-wide at 12.7%. Over
10% (10.8%) of people aged 16-64 years receive the
disability support pension. This is higher than Gippsland
at nearly nine percent and Victoria at just over five
percent. (Needs Assessment, PHN, ABS Census 2016,
Quick Stats Community Profile East Gippsland LGA and
Indigenous Profile, East Gippsland).
East Gippsland Report 2018 | 1213 | The Wellbeing of Children and Young People
INDICATORS OF WELLBEING FOR CHILDREN AND YOUNG PEOPLE

The following section presents 24 indicators for children and young people across five domains:
Developing Well, Safe and Secure, Happy and Healthy, Engaged, Learning and Achieving and Active Citizens.

DOMAIN 1: DEVELOPING WELL
There are four indicators under the domain of developing well:

          1.1. Children are developing well as they start school;
          1.2. Children are visiting a Maternal Child Health Nurse;
          1.3. Parents are attending parent education and/or support program; and
          1.4. Babies are fully breastfed.

1.1. Children are Developing Well as They Start School
Research tells us clearly that the early years of children’s lives are critical for their development and growing up well.
The Australian Early Developmental Census (AEDC) is one measure to see how children are growing across five
developmental domains in their first year of school.

Emerging trends in developmental vulnerability for East Gippsland, showing change in percentage (2009 to 2015):

                          30                                             Vulnerable on one or more domain(s)
 Percentage vulnerable

                          25                                             Vulnerable on two or more domain

                                                                         Emotional maturity
                          20
                                                                         Social competence
                          15
                                                                         Physical health & wellbeing
                          10                                             Communication skills & general knowledge

                           5                                             Language & cognitive skills (school-based)
                               2009              2012           2015
                                                 Year
Source: AEDC, Department of Education, 2016.

                                                                                        STATISTICAL           2015
                                 AEDC DOMAIN                 2012         2015         SIGNIFICANCE        VICTORIA
                                                                                        No significant
                Vulnerable on one or more domains(s)         23.3%     21.2%                                 19.9%
                                                                                          change
                                                                                          Significant
                         Vulnerable on two or more domains   13.6%     10.1%                                 9.9%
                                                                                           decrease

There has been a significant decrease (from 13.6% to 10.1%) from 2012 to 2015 in the percentage of children who are
developmentally vulnerable on two or more domains. There has been a slight reduction in the percentage of children
who are vulnerable on one or more domains from 23.3% to 21.2%. Overall this tells us that there are improvements,
but there are still over 30% of children that are vulnerable on one, two or more domains and this impacts on how they
will do at school (Source: AEDC, Department of Education, 2016).

                                                                                                   East Gippsland Report 2018 | 14
INDICATORS OF WELLBEING FOR CHILDREN AND YOUNG PEOPLE
Proportion of children in East Gippsland who are ‘developmentally vulnerable’ in the following domains:
The figures below show each area of the AEDC developmental domains that children are assessed on in their first
year of school and the percentage of children that are developmentally vulnerable in each area. This table shows
that there has been a statistically significant decrease in two of the five domains: physical health and wellbeing and
emotional maturity. Whilst it is promising to see these improvements, the number of children who are developmentally
vulnerable or developmentally at risk require continued focus and collective efforts.
STATISTICAL 2015
AEDC DOMAIN 2009 2012 2015 SIGNIFICANCE VICTORIA
Physical health and wellbeing
Measures children’s physical readiness for the Significant
12.9% 12.1% 8.8% 7.9%
school day, physical independence and gross and decrease
fine motor skills
Social competence
Measure children’s overall social competence, No significant
14.4% 9.0% 8.6% 8.7%
responsibility and respect, approach to learning change
and readiness to explore new things
Emotional maturity
Measures children’s pro-social and helping
Significant
behaviours and absence of anxious and fearful 15.5% 9.1% 6.4% 8.0%
decrease
behaviour, aggressive behaviour and hyperactivity
and inattention
Language and cognitive skills
Measures children’s basic literacy, interest in No significant
10.2% 7.4% 9.2% 8.0%
literacy, numeracy and memory, advanced change
literacy and basic numeracy
Communication skills and general
knowledge
No significant
Measures children’s communication skills 12.3% 10.2% 9.0% 7.6%
change
and general knowledge based on broad
developmental competencies and skills
15 | The Wellbeing of Children and Young PeopleDEVELOPING WELL
Proportion of children whose parents report one or more concerns with speech or language upon entry to primary school:
The following data was not available for the previous report and paints a picture of how children are beginning their
school lives rather than providing a direct comparison.
2015
AEDC DOMAIN 2012 2013 2014 2015 VICTORIA
East Gippsland 18.9% 13.5% 19.8% 14.3% 14.1%
From 2012 to 2015 the percentage of children whose parents report one or more concerns with speech or language
upon entry to primary school has varied considerably. High rates of concern were reported in 2012 and 2014 when
18.9% and 19.8% of children had one or more concerns with speech or language as reported by their parents. The
proportion of children in both 2013 and 2015 was lower, at 13.5% and 14.3% respectively and this is close to the rates
reported across Victoria.
1.2. Children are Visiting a Maternal Child Health Nurse
Maternal & Child Health services monitor and encourage the development and wellbeing of children and provide
support to parents who in turn support their children before they attend school. In East Gippsland, Maternal & Child
Health (MCH) is delivered by Gippsland Lakes Community Health (GLCH) for East Gippsland main centres and high
country and Orbost Regional Health (ORH) for the Far East area (Orbost, north of Orbost, surrounding areas, Cann
River and Mallacoota).
The data below for East Gippsland shows the high rate of home visits to families:
2015
YEAR 2013 EG 2014 EG 2015 EG VICTORIA
Infants receiving MCH home visiting –
101.4% 100.2% 100.4% 100.9%
EG/Victoria
Source: AEDC, Department of Education, 2016.
The above data indicates that MCH is seeing all families in the region in addition to families who have moved into the
area. This is why some of the rates are over 100% both for East Gippsland and for Victoria-wide.
2015
YEAR 2013 2014 2015 VICTORIA
Children having their four-month assessment 102.4% 74.4% 102.4% 69.9%
Children having their 12-month assessment 86.0% 93.8% 88.6% 57%
Children receiving their three-years-and-six-
92.6% 84.6% 71.1% 42.8%
months check
Source: Maternal & Child Health Services Annual Report 2012-2013, 2013-2014, 2014-2015 South Eastern Victoria Region, Maternal & Child Health
Services Annual Report 2015-2016 State-wide and Department of Education and Training.
East Gippsland’s rate for the three-years-and-six-months-old checks was significantly higher than those across
Victoria in 2013 and 2014. This rate dropped from 79.5% in 2014, to 63.5% in 2015. The reason for this decrease is
possibly the removal in 2015 of the Healthy Kids Check and incentives by the Australian Government.
East Gippsland Report 2018 | 16INDICATORS OF WELLBEING FOR CHILDREN AND YOUNG PEOPLE 17 | The Wellbeing of Children and Young People
DEVELOPING WELL

Aboriginal & Torres Strait Islander Children:

                                                                                                                                      2015
                        YEAR                                       2013                     2014                     2015          VICTORIA

   Children having their four-month assessment            102.4%                    74.4%                   102.4%                   69.9%

   Children having their 12-month assessment                86%                     93.8%                    88.6%                    57%

   Children receiving their three-years-and-six-
                                                           92.6%                    84.6%                    71.1%                    57%
                  months check

Source: Maternal & Child Health Services Annual Report 2012-2013, 2013-2014, 2014-2015 South Eastern Victoria Region, Maternal & Child Health
Services Annual Report 2015-2016 State-wide

The four-month, 12-month and three-years-and-six-months check
                                                                                                      Questions for follow up:
for Aboriginal and/or Torres Strait Islander children are all above the
Victorian state average. Note: the rate above 100% may be due to the                                  What are parents looking for
mobility of the Aboriginal population, with an increase of new families                               in regards to education and
moving into the area.                                                                                 support?
                                                                                                      What best supports the
1.3. Parents are Attending Parent Education and/or Support                                            challenging and changing role
This was a data gap in the 2013 report. There is data for some local                                  of being a parent?
parent education sessions provided by the Communities for Children
program at Uniting in 2017. A total of 137 parents attended these
sessions. For future reports, it would be useful to have a picture of the
attendance and outcomes over time of parent education sessions.

1.4. Babies are Fully Breastfed
There is significant evidence demonstrating the health and wellbeing benefits for breastfed babies.

Babies breastfed in 2013-2014 to 2014-2015:
                             EAST GIPPSLAND                        EAST GIPPSLAND                    EAST GIPPSLAND               VICTORIA
  AGE OF BABY                   2011/2012                             2013/2014                         2014/2015                 2014/2015

   Three-months              50%                                49.8%                               48.2%                            51.4%

    Six-months               15%                                17.2%                               13.2%                             34%

Source:Victorian Child and Adolescent Monitoring System (VCAMS), Indicator 2.1: proportion of infants breastfed

The rates of breastfeeding in East Gippsland are significantly lower than across Victoria for babies at six-months-old.
Rates of breastfeeding for three-month-old babies is slightly lower than the State average.

                                                                                                             East Gippsland Report 2018 | 18
INDICATORS OF WELLBEING FOR CHILDREN AND YOUNG PEOPLE
DOMAIN 2: SAFE AND SECURE
There are three indicators under the domain of Safe and Secure:
2.1. Children are Feeling Safe at Home;
2.2. Children are Feeling Stable and Secure;
2.3. Children and Young People are Safe From Injury and Harm
2.1. Children are Feeling Safe at Home
Growing up feeling safe and secure is important for children’s development. The growing brain of a child is significantly
impacted when it is exposed to traumatic events like family violence. Children experiencing respectful, equal
relationships are more likely to develop well and thrive at school.
Number of recorded Incidents of Family Violence per 100,000 people for East Gippsland and Victoria-wide:
East Gippsland
Recorded incidents per 100,000 polulation
2500
Victoria
2000
1500
1000
2012-13 2013-14 2014-15 2015-16 2016-17
Year
Source:VCAMS, Crime Statistics Agency.
Number of family violence incident reports 2016-17:
The data indicates that reports increased from 835 in 2012-13 to 1020 in 2015-16. In 2016-17 the rates decreased to 924.
East Gippsland has the second highest rate of family violence incidents in Gippsland and the sixth highest in the state.
These incidents are converted per 100,000 people which can be seen above, highlighting that East Gippsland has a
much higher family violence incidence rate per 100,000 people compared with State-wide.
Proportion of children and young people present at reported family violence incidents in East Gippsland and Victoria:
2012-13 2013-14 2014-15 VICTORIA
East Gippsland 35.1% 37.7% 39.9% 34.5%
Source:VCAMS, Crime Statistics Agency.
In East Gippsland, 39.9% of family violence incidents reported to police had at least one child present, which is higher
than the Victoria-wide rate of 34.5%. This is a slight increase from the previous report: in 2011-2012, 39% of recorded
incidences had children and young people present (VCAMS, Crime Statistics Agency).
19 | The Wellbeing of Children and Young PeopleSAFE AND SECURE
Higher rates for East Gippsland are also found in the School Entrance Health Questionnaire (SEHQ) for the percentage
of children that have witnessed violence:
EAST GIPPSLAND REGIONAL VICTORIA VICTORIA
Child witness to violence 6.8% 5.3% 3.3%
Source: Department of Education and Training, 2016, School Entrance Health Questionnaire (SEHQ).
Young people are feeling safe and secure at school:
The Communities That Care (CTC) program in East Gippsland schools collected data from young people in regards
to anti-social behaviour, family and school life and attitudes to alcohol and drugs (Communities That Care - East
Gippsland Youth Survey, 2015). This data provides a picture of how safe and secure young people are feeling at school.
It shows that 26% of Year Six students and 37% of Year 10 students reported recently being bullied. A higher rate for
Year Eight students was reported at 56% of students being bullied recently (this compares to 40% for other Year Eight
students across Australia). The percentage of Year Eight students reporting reporting that they had recently bullied
others is particularly high at 28%, considering that the Australia-wide rate is 12%. Students who bullied others in Year
6 and Year 10 were lower at 16% and 17% respectively (Cooney, Smith & Toumbourou, 2015).
In addition to the CTC Survey data, there is also information from the Victorian Child and Adolescent Monitoring
System (VCAMS) in regards to the percentage of children in primary school and high school who have reported being
bullied. The rates rates of reported bullying in East Gippsland are higher than those across Victoria.
East Gippsland Report 2018 | 20INDICATORS OF WELLBEING FOR CHILDREN AND YOUNG PEOPLE
Proportion of children who reported being bullied in Proportion of children who report being bullied in years
Year Five and Six:: 7-9:
2014 2015 2014 2015
East Gippsland 19.8% 17.9% East Gippsland 31.2% 18.4%
Across Victoria 15% 15% Across Victoria 29.4% 18%
Source: VCAMS. Source: VCAMS.
The percentage of children and young people in East Gippsland who have reported being bullied is consistently higher
than the Victorian average.
Child Protection Reports (0-17 years):
Child Protection reports are generated when a child has come to the attention of Child Protection authorities within
the Victorian Department of Health and Human Services (DHHS). Substantiated reports are those where reported
incidents have been verified. Data is also collected where there has been a further report (re-notification) within a
12-month period indicating the reported abuse has continued. The rates reported in 2013 were for children up to eight-
years-old. The following data is for children aged up to 17-years-old from 2014-2015 until 2016-2017. Overall, these
rates are increasing and this highlights a need for greater support for families.
Research highlights that as a community we invest significant resources into
Child Protection, yet we don’t invest much into better support for families.
21 | The Wellbeing of Children and Young PeopleSAFE AND SECURE
Child Protection Reports:
2014-15 2016-17
Number of child protection report
208 310
substantiations
Number of child protection report
substantiations for Aboriginal and 81 110
Torres Strait Islander children
2015-16 2016-17
Proportion of child protection
64% 65%
re-reports
Proportion of child protection
re-reports for Aboriginal and/or Torres 80% 69%
Strait Islander children
Source: Victorian Department of Health and Human Services (DHHS).
2.2. Children are Feeling Stable and Secure
Data on East Gippsland residents who remained in public housing in the previous report, was not available for this
report.
Rental stress is common in East Gippsland, with 30% of low income households reporting this. In comparison,
Gippsland as a whole sees 28% of low-income households reporting rental stress, and Victoria-wide this is at 25%
reported (Needs Assessment, GPHN). compared to Gippsland (28%) and Victoria (25%) (Needs Assessment, GPHN).
However, a higher proportion of residents were at the same address a year ago and five years ago, both compared
with 2011 and with against Victoria generally. (ABS Census, 2016).
Proportion of people at the same address one year ago and five years ago:
SAME ADDRESS EAST GIPPSLAND ACROSS VICTORIA
One year ago 87% 76%
Five years ago 60.6% 50.7%
Source: ABS Census, 2016.
2.3. Children and Young People are Safe From Injury and Harm
The following table provides the number of children and young people aged up to 17-years-old per 1000 who are
a victim of crime. The following table shows that rates have increased, dropped and increased again. Rates are
much higher in East Gippsland than for across Victoria. In the previous report, this data was available as an overall
percentage, rather than per 1000. This also reflected higher rates in East Gippsland than for Victoria as a whole.
Number of those aged between 0-17 per 1000 who were a victim of crime:
YEAR EAST GIPPSLAND ACROSS VICTORIA
2014-15 18.4% 9.6%
2014-2013 16.1% 9.7%
2013-2012 18.1% 10.1%
Source: VCAMS, Crime Statistics Agency.
East Gippsland Report 2018 | 22INDICATORS OF WELLBEING FOR CHILDREN AND YOUNG PEOPLE
DOMAIN 3: HAPPY & HEALTHY
There are five indicators under the domain of Happy and Healthy:
3.1. Children are Physically Active;
3.2. Children are Eating Well;
3.3. Children have Good Oral Health;
3.4. Children and Young People are Emotionally Well;
3.5. Children and Young People with a Disability Requiring Assistance.
3.1. Children are Physically Active
This was a data gap in the previous report. There is now information available from the Victorian Child Health and
Wellbeing Survey for the Outer Gippsland area (East Gippsland and Wellington Shires).
The proportion of children in East Gippsland aged five to 13-years-old in 2013 who completed 60 minutes of physical
activity every day is 64.5%. This is higher than the rate for children across Victoria, which is 62.2% (VCAMS, the
Victorian Child Health and Wellbeing Survey- VCHWS).
Data is also now available from the Communities That Care program regarding young people aged 13 to 17-years-
old in East Gippsland. The data shows the number of young people who meet the Australia’s Physical Activity and
Sedentary Behaviour Guidelines. These guidelines recommend that young people are physically active for at least an
hour a day and limit screen time to a maximum of two hours per day (Cooney, Smith & Toumbourou, 2015).
The proportion of East Gippsland students surveyed for meeting the physical activity guidelines, they are physically
active for more than an hour a day and do not sit for long periods of time:
YEAR EIGHT – YEAR EIGHT –
YEAR SIX YEAR 10
EAST GIPPSLAND ACROSS AUSTRALIA
23% 10% 17% 16%
Source: Cooney, Smith & Toumbourou, 2015.
The proportion of East Gippsland students surveyed who meet the sedentary behaviour guidelines, they have no more
than 2 hours of screen time:
YEAR EIGHT – YEAR EIGHT –
YEAR SIX YEAR 10
EAST GIPPSLAND ACROSS AUSTRALIA
57% 34% 48% 37%
Source: Cooney, Smith & Toumbourou, 2015.
Of note is that Year Eight students in East Gippsland report lower levels for reaching Australia’s Physical Activity and
Sedentary Behaviour Guidelines, compared with Australia-wide students which is at 17% and 48% for physical activity
and sedentary behaviour respectively (Cooney, Smith & Toumbourou, 2015).
23 | The Wellbeing of Children and Young PeopleHAPPY AND HEALTHY
3.2. Children are Eating Well
This was a data gap in the 2013 report. In 2014, the Victorian Child Health and Wellbeing Survey (VCHWS) provided
tAcross Victoria, this is 10.6% and for Outer Gippsland (East Gippsland and Wellington Shires), it is 12.4%.
The Communities That Care Report (Cooney, Smith & Toumbourou, 2015) highlights the proportion of East Gippsland
Students who meet the daily dietary guidelines for fruit and vegetable intake and whether students have breakfast every day.
This shows that a high number of young people in East Gippsland are not having breakfast, that there is a low level
of daily vegetable intake, despite a higher number of Year Eight students in East Gippsland eating the recommended
amount of fruit at 38% compared with Year Eight students across Australia at 23% (Cooney, Smith & Toumbourou, 2015).
Percentage of East Gippsland Students meeting the daily dietary guidelines for fruit and vegetable intake and eating
breakfast everyday:
YEAR EIGHT – YEAR EIGHT –
YEAR SIX YEAR 10
EAST GIPPSLAND ACROSS AUSTRALIA
Students who eat the daily
35% 38% 23% 28%
recommended amount of fruit
Students who eat the daily
18% 21% 34% 22%
recommended amount of vegetables
Students who eat breakfast 47% 39% 51% 32%
Source: Cooney, Smith & Toumbourou, 2015.
3.3. Children who have Good Oral Health
This was reported as a data gap in the 2013 report.
Additional information shows that in 2013-14, the children
who attended Bairnsdale Regional Health Service dentists
aged six-years-old had an average of 4.09 decayed, missing
or filled teeth, compared to 2.37 across Gippsland and 2.28
for Victoria as a whole. In 2015-2016, six-year-olds had, on
average, 3.07 decayed, missing or filled teeth, compared with
a 2.20 Victoria-wide average.
East Gippsland and Victoria Average of Teeth that were
decayed, missing or filled 2015 to 2016:
3.5 East Gippsland
Victoria
3.0
Number of teeth
2.5
2.0
1.5
1.0
0.5
0.0
0 to 5 6 7 to 8 9 to 11 12
Age
Source: Bairnsdale Regional Health Service, 2015-2016.
East Gippsland Report 2018 | 24INDICATORS OF WELLBEING FOR CHILDREN AND YOUNG PEOPLE
The following data has been gathered through the School Entrant Health Questionnaire, completed by parents when
their children start school. It predominantly represents children aged around five-years-old entering their prep year.
Proportion of children reported to have visited a dentist in the past year:
2012 2014 2016
East Regional Across East Regional Across East Regional Across
Gippsland Victoria Victoria Gippsland Victoria Victoria Gippsland Victoria Victoria
57% 51.8% 48.5% 55.2% 54.9% 50.3% 53% 59.2% 54%
Source: Victorian Department of Education and Training (DET), School Entrant Health Questionnaire 2012, 2014 and 2016.
In East Gippsland a higher proportion of children attended the dentist in the year prior to starting school than those
in either regional Victoria or Victoria generally. This has slightly decreased from 2012 by nearly two percent.
Number of children with parental concern regarding their oral health:
2012 2014 2016
East Regional Across East Regional Across East Regional Across
Gippsland Victoria Victoria Gippsland Victoria Victoria Gippsland Victoria Victoria
15.5% 14.6% 14.4% 18.0% 14.7% 14.5% 15% 13.6% 13.8%
Source: Victorian Department of Education and Training (DET), School Entrant Health Questionnaire 2012, 2014 and 2016.
More parents of children starting school in East Gippsland have expressed concern about their child’s oral health,
including teeth and gums, than in regional Victoria or Victoria as a whole. This has increased from 2012 by two-and-
a-half percent (Victorian Department of Education and Training (DET), School Entrant Health Questionnaire 2012,
2014 and 2016).
3.4. Children and Young People are Emotionally Well
The School Entrant Health Questionnaire data shows that children in East Gippsland are more likely to exhibit
emotional or behavioural difficulties well above the Victorian average. The following shows the percentage of children
with high risk of emotional problems. The rate has decreased (or improved) since 2013 however it increased in 2016
and is still higher that the Victorian average (Victorian Department of Education and Training (DET), School Entrant
Health Questionnaire 2013, 2014, 2015 and 2016).
The proportion of children at school entry at high risk of emotional & behavioural difficulties reported by parents:
YEAR EAST GIPPSLAND ACROSS VICTORIA
2013 7.9% 4.4%
2014 7.7% 4.6%
2015 5.8% 4.6%
2016 8.8% 4.8%
Source:Victorian Department of Education and Training (DET), School Entrant Health Questionnaire 2013, 2014, 2015 and 2016.
25 | The Wellbeing of Children and Young PeopleHAPPY AND HEALTHY
“Experiences in the middle years, ages six to 12,
have critical and long lasting effects. They are
powerful predictors of adolescent adjustment
and future success. During this time, children
are experiencing significant cognitive, social and
emotional changes that establish their lifelong
identity and set the stage for adolescence and
adulthood. The overall health and well-being of
children in their middle years affects their ability
to concentrate and learn, develop and maintain
friendships, and make thoughtful decisions.”
- MDI Report, East Gippsland 2016
East Gippsland Report 2018 | 26INDICATORS OF WELLBEING FOR CHILDREN AND YOUNG PEOPLE
Proportion of children at school entry whose parents report concerns with their behaviour and emotional wellbeing at
school entry:
YEAR EAST GIPPSLAND ACROSS VICTORIA
2013 15.1% 13.3%
2014 15.3% 13.5%
2015 12.3% 13.0%
2016 16.3% 12.6%
Source:Victorian Department of Education and Training (DET), School Entrant Health Questionnaire 2013, 2014, 2015 and 2016.
The Middle Development Index (MDI) on highlighting the protective factors and assets that
are known to support and optimise development in
A number of schools in East Gippsland have participated middle childhood.
in the Middle Development Index (MDI) feasibility
trial in 2016 and 2017. This measure is designed to be The five areas are: Social and Emotional
cohesive with the AEDC and can be aggregated at a Development, Physical Health and Wellbeing,
local community level to provide decision makers with Connectedness, Use of After-School Time and
normative data. School Experiences.
As a component of comprehensive child development The Wellbeing Index for Far East Gippsland includes
monitoring it may be linked to other health and questions from social and emotional development areas
education data sources (e.g. AEDC, School Entrant including: optimism; self-esteem; happiness; absence of
Health Questionnaire) to better understand sadness; and general wellbeing. This index shows that
developmental trajectories as well as social context 37% of children that participated feel they are thriving,
factors that are most likely to enhance or impede 25% of children reported medium wellbeing and 38%
children’s health and wellbeing. reported feeling low in wellbeing. This compares with
the other areas that participated in the MDI (a total
The MDI is a self-report questionnaire that asks children of 2489 children in Victoria), which found that 45%
in Year 4 and Year 7 about their thoughts, feelings and are thriving, 23% report medium wellbeing and 33%
experiences in school and in the community. The MDI have low wellbeing (Middle Development Index - MDI -
uses a strengths-based approach to assess five areas Report, East Gippsland 2016, Department of Education).
of development that are strongly linked to children’s
wellbeing, health and academic achievement. It focuses
Wellbeing Index for Far East Gippsland:
50
East Gippsland
40
Across Victoria
Percentage
30
20
10
0
Thriving Medium Wellbeing Low in Wellbeing
Source: Middle Development Index (MDI) Report, East Gippsland 2016, Department of Education.
27 | The Wellbeing of Children and Young PeopleYou can also read