Gender Diversity in Corporate Boards: Evidence From Quota-Implied Discontinuities - DISCUSSION PAPER
←
→
Page content transcription
If your browser does not render page correctly, please read the page content below
// NO.21-023 | 03/2021

DISCUSSION
     PAPER
   // O LG A K U Z M I N A A N D VA L E N T I N A M E L E N TY E VA

Gender Diversity in Corporate
Boards: Evidence From
Quota-Implied Discontinuities
Gender diversity in corporate boards:
Evidence from quota-implied discontinuities
Olga Kuzmina Valentina Melentyeva
New Economic School and CEPR ZEW and University of Mannheim
This version: January 2021
Abstract
Using data across European corporate boards, we investigate the e¤ects of quota-induced
female representation on …rm value and operations, under minimal identi…cation assumptions.
We consider sharp increases in the share of women on boards that arise due to rounding
whenever percentage-based regulation applies to a small group of people. We …nd that having
more women on corporate boards has large positive e¤ects on Tobin’s Q and buy-and-hold
returns. This result is in stark contrast with previous empirical work that …nds large negative
e¤ects. The reason for this discrepancy is that these papers considered …rms with di¤erent
pre-quota shares of women to be good counterfactuals to each other. In our data, we see
that such …rms had grown di¤erently already before the regulation. Thus, assuming they
are good comparables would result in a negatively biased estimate of the e¤ect. Instead, we
use quasi-random assignment induced by rounding and …nd that promoting gender equality
is aligned with shareholder interests. This positive e¤ect is not explained by increased risk-
taking or changes in board composition, but rather by scaling down ine¢cient operations and
empire-“demolishing”.
Keywords: Gender diversity, women on boards, gender quota, performance
JEL codes: J16, G34, G38, D22
For their many suggestions, we would like to thank Ashwini Agrawal, Dmitry Arkhangelsky, Oriana Bandiera,
Janis Berzins (discussant), Anna Bindler, Vicente Cuenat, Daniel Ferreira, Maria Guadalupe, O¼guzhan Karakaş,
Egle Karmaµziene (discussant), Adrien Matray, David Matsa, Daniel Paravisini, Steve Pischke, Vikrant Vig, as
well as the seminar participants at the CEPR WE_ARE series, ECONtribute, the London School of Economics,
University of Cambridge – Judge Business School, EBRD, University of Bristol, and the participants of the 2020
American Economic Association meeting in San Diego, the 2020 European Economic Association Meeting, the 2020
German Economic Association Meeting, the 2020 Paris December Finance Meeting. Email for correspondence:
okuzmina@nes.ru; http://pages.nes.ru/okuzmina. Address: 45 Skolkovskoe shosse, Moscow 121353, Russia.
11 Introduction
Gender equality, and its main business-world facet – increasing female representation in boards of
directors, – has become the agenda of policy makers across the world. “The Big Three” institutional
investors (BlackRock, State Street, and Vanguard) also recently launched campaigns to promote
gender diversity on corporate boards (Gormley, Gupta, Matsa, Mortal, and Yang, 2020). However,
the seminal papers by Ahern and Dittmar (2012) and Matsa and Miller (2013) demonstrate that
the e¤ects of gender quota on …rm value and performance are large and negative. These results
raise a major policy dilemma: should gender equality be imposed at the expense of shareholders?
In this paper, we use a novel discontinuity-based identi…cation strategy to show that in the Euro-
pean countries that introduced percentage-based regulation, promoting gender equality is aligned
with shareholder interests. This means that this policy dilemma does not exist, and institutional
investors’ money is smart. We further demonstrate that these positive e¤ects mainly come from
less empire-building activity on the part of women directors.
Estimating the causal impact of gender diversity on …rm value is challenging. Early studies
(Carter, Simkins, and Simpson, 2003) show a positive correlation between female directors and
…rm value, but Adams and Ferreira (2009) and Adams, Hermalin, and Weisbach (2010) identify
several sources of endogeneity in the context of corporate boards. In a search for causal estimates,
previous empirical work has largely relied on either the assumption that private …rms are similar on
unobservables to public …rms (such as in Matsa and Miller, 2013), or that …rms with di¤erent pre-
quota shares of women are otherwise comparable to each other (such as in Ahern and Dittmar, 2012,
and including the most recent work by Bertrand, Black, Jensen, and Lleras-Muney, 2019, Hwang,
Shivdasani, and Simintzi, 2019, and Eckbo, Nygaard, and Thorburn, forthcoming, among others).1
But is the cure always better than the disease? Ferreira (2014) argues that such identi…cation
assumptions may be problematic. We show empirically that indeed …rms that had more female
directors at the time the regulation was announced had been growing faster prior to the regulation
than …rms with fewer women, in our sample of European public …rms. We demonstrate that this
implies that using past female share as part of the identifying variation would produce an overly
negative estimate of the e¤ect of female directors on …rm value. To overcome this bias, we o¤er
a new identi…cation strategy that is inspired by Angrist and Lavy’s (1999) Maimonides’ rule and
exploits discontinuities that naturally arise due to rounding whenever a percentage minimum is
1
While the …rst two papers use pre-quota share directly as the instrument, the latter two calculate the di¤erence
between the fraction of female directors required by the quota and that of the current board, and that also mechanially
depends on how many female directors the …rm already has.
2applied to a small-sized group of people.
Speci…cally, we note that any percentage quota applied to a relatively small-sized group of
individuals produces sharp increases in the actual minimum share of women that is to be achieved.
This happens because women come in whole numbers. For example, with a quota of 25%, a board
of size 4 has to have at least one woman, making it exactly a 25% as the minimum to be achieved.
However, a board with 5 members has to have at least two women, i.e. 40%. Such a sizeable
di¤erence from what the quota prescribes means that …rms with 5 board members will respond
disproportionately more than …rms with 4 members to the same percentage regulation, purely due
to rounding, as long as board size is not perfectly ‡exible.
We consider board sizes measured before the exact percentage to be achieved is announced, hence
it is not known to the …rm ex ante which board sizes will fall around this discontinuity. For example,
for a 25% quota the close board sizes are 4 and 5, while for a 40% quota they are 5 and 6, and for a
33% quota – 6 and 7, etc. This ensures that the ex ante sorting of …rms into the board sizes relevant
for the particular percentage announced in a given country is likely to be random. Public …rms
within such narrowly-de…ned boards sizes form our close comparables. We further strengthen the
argument by making the comparisons within a di¤erence-in-di¤erence framework, so as to account
for any time-invariant di¤erences between boards of slightly di¤erent sizes. Finally, we generalize
this setting to multiple discontinuities within a country (i.e. also comparing 8- to 9-member and
12- to 13-member boards, in case of a 25% quota), to di¤erent percentages across countries (i.e.
comparing 5- to 6-member boards, and 7- to 8-member boards, in countries where a 40% quota is
introduced), and to di¤erent countries that introduced the same percentage in di¤erent years (i.e.
comparing a 40% by 2015 mandate in Spain to a 40% by 2017 mandate in France). In our preferred
and most saturated speci…cations, we can even identify the e¤ects out of relative intensities, such
as comparing the di¤erence in performance between …rms with 5 and 4 members within the same
industry (which are predicted to have a 15% di¤erence in minimum female share) to the di¤erence
in performance between …rms with 9 and 8 members within the same industry (which are predicted
to have only a 8.3% di¤erence in minimum female share). The results are robust.
One limitation of our approach is that the ability to provide causal estimates under minimal
possible identi…cation assumptions comes at a cost of sample size requirements. Despite that, in our
sample that covers more than 60% of all BoardEx-Eikon public …rms in the countries considered,
we are able to demonstrate that the main e¤ects are similar for all countries together, as well as for
many individual countries separately (such as the UK, France, the Netherlands, etc.).
3We …nd a large and positive e¤ect of the share of women in boards on Tobin’s Q across European
countries: a 10pp increase in the share of women increases Tobin’s Q by 2.1 units, which is about 1.2
within-…rm standard deviations of this variable. This positive e¤ect is also present when we look at
individual countries where our instrument provides enough variation to have a signi…cant …rst stage.
Additionally, the ultimate measure of investor performance – the buy-and-hold returns – turns out
to be about 1.6-3.8% higher in the annually compounded equivalent for …rms that end up with a
higher female share due to rounding. We show that these higher returns are not explained by higher
loadings on common risk factors. Interestingly, investors do not seem to anticipate these positive
long-run e¤ects: when we adapt our methodology to an event-study framework, the immediate
abnormal returns for …rms with di¤erent minimum shares of women are not statistically di¤erent
from each other.
To explore the mechanisms behind these e¤ects, we …rst look at board composition. We …nd
that average board quality, as measured by average age, experience, network size, quali…cations,
and independence does not change. However, we do see a slight increase in average board meetings
attendance, consistent with previous literature (Adams and Ferreira, 2009). While board meetings
attendance contributes to the overall e¤ect on value, its magnitude is too small to explain it fully.
We proceed by decomposing the overall e¤ect on Tobin’s Q into the market-value and book-value
components, and observe that the former primarily drives the e¤ect. As our further analysis shows,
this is not an artefact of a change in capital structure, or an increase in dividend payout, but rather
the result of less empire-building activity. Speci…cally, we show that all size-related variables (assets,
sales, employment) are disproportionately lower for …rms with more female directors. Interestingly,
we observe that …rms with more women are less likely to incur merger-related expenses and are to
invest in purchases of …xed assets. In the context of overcoming the agency costs that lead to empire-
building, these …ndings are very much in the spirit of women being tougher monitors as in Adams
and Ferreira (2009). The dramatic drop in sales, however, drives some short-run decreases in ROA.
Nevertheless, they are not accompanied by any decrease in pro…t margins or labor productivity
and wages, implying that …rms still make the same pro…t out of each unit sold and worker quality
does not deteriorate. Taken together and recalling that the long-run market reaction is positive,
the evidence suggests that …rms with more women are scaling down the ine¢cient operations in the
process of empire-"demolishing".
Our main contribution is twofold. Methodologically, we o¤er an empirical approach that enables
studying the e¤ects of any universal percentage-based regulation, under the minimal possible iden-
4ti…cation assumptions. Our identi…cation strategy has its highest power when applied to relatively
small-team settings, and as such it can be used in many settings outside of corporate …nance and
the context of gender. In political economy settings, for example, one could consider regulation ap-
plying to members of the Cabinet or members of the European parliament (but not e.g. members of
Congress, which are too numerous to provide any meaningful discontinuities). It is also adaptable
to other empirical setups, whenever close counterfactuals are of interest (such as in event studies).
Substantively, we apply this strategy to revisit the main empirical results from the literature on
gender diversity in corporate boards, and show that the "common wisdom" of large negative value
e¤ects of female directors reverses. Our paper contributes to the literature studying the quota-
imposed e¤ects of gender diversity on …rm performance. Besides Ahern and Dittmar (2012) and
Matsa and Miller (2013), the recent evidence on Norway is more mixed: Eckbo et al. (forthcom-
ing) …nd zero e¤ects, while Nygaard (2011) …nds heterogeneous e¤ects depending on information
asymmetry. For Italy, Ferrari, Ferraro, Profeta, and Pronzato (2016) …nd no di¤erences in per-
formance, but some positive e¤ects on stock prices. The …rst US-based studies by Hwang et al.
(2019) and Greene, Intintoli, and Kahle (2020) …nd negative market reaction to the introduction
of gender quota in a sample of Californian …rms. Besides internal validity, our paper speaks to-
wards external validity: rather than looking at one speci…c country or state, we consider virtually
all European countries that introduced percentage quotas for public …rms, both mandatory and
voluntary. Finally, we propose a novel mechanism of female directors a¤ecting …rm value through
empire-"demolishing".
More broadly, our paper is part of a larger literature on corporate board structure, such as
board diversity (see a survey by Ferreira, 2010), board representation (Jäger, Schoefer, and Heining,
forthcoming), gender di¤erences across directors (Adams and Funk, 2012), gender spillovers (Matsa
and Miller, 2011), and gender and team performance in general (see some experimental evidence
in Hoogendoorn, Oosterbeek, and van Praag, 2013). Our paper’s …nal contribution to this broader
literature is to highlight another implication of our empirical strategy. As we show, the mere
existence of a signi…cant …rst stage implies a speci…c average way of adjusting to the regulation:
we show that …rms mostly comply by switching male directors for female directors, rather than
altering board size to make it easier to comply. Such a "sticky" board size implies that the costs of
switching directors are perceived to be lower than those of altering board size, for an average …rm.
While board size and its determinants have been extensively explored (see e.g. Coles, Naveen, and
Naveen, 2008, and Lehn, Patro, and Zhao, 2009), to the best of our knowledge sticky board size is
5also a novel …nding. It is important because it implies that such percentage-based regulations may
have additional unintended e¤ects by making …rms shift away from their optimal board size.
The paper is organized as follows: Section 2 describes the empirical strategy; Section 3 discusses
the data and provides summary statistics; Section 4 shows the …rst-stage results and validates the
instrument; Section 5 presents the main results on the e¤ects of female representation on value;
Section 6 explores the mechanisms behind the e¤ects; Section 7 concludes.
2 Empirical Strategy
To illustrate the idea behind our instrument, let’s suppose that a …rm faces a quota of 25% of women
on the board (the speci…c number is used for illustration purposes). Does it mean that every …rm
that is compliant with this quota will have to have at least 25% women? Well, it turns out that
most …rms will actually have to have a percentage much higher than 25%, even if they want to
only marginally comply with the 25%-quota. And the simple reason for that is that women (and
men too) come in whole numbers. So a board of 2 directors will have to have at least 1 woman,
making it a 50% share of women overall, while a board of 5 members will have to have at least 2
women, making it a 40% share of women. Only a board that is an exact multiple of 4 will have to
have exactly 25% as the minimum to comply with the quota. Given how reluctant …rms may have
been in becoming compliant, even the di¤erences in these minimum requirements induced by the
same quota will likely produce enough powerful variation for us to identify the e¤ects of interest.
Overall, a …rm with board size b, facing a quota q would need to have a minimum of
int((b 1) q) + 1
;
b
where int(a) is the integer part of a real number a, making this minimum a sawtooth-like
function of the board size, such as the one in Figure 1 (drawn for the 25% case for concreteness).2
This pattern produces some natural discontinuities in the minimum required share of women,
which is what we use in conjunction with our instrument. It is essential that we never use the
contemporaneous board size when constructing the instrument (since it is likely to be endogenous),
but rather the original board size that existed before the quota and its exact percentage were
announced. Additionally, since …rms of very di¤erent board sizes are likely to be fundamentally
di¤erent, we want to isolate the closest possible comparisons. To do that we investigate only
2 roundup(bq)
This can be equally spelled as b , where roundup is the upward-rounding function.
6the upward parts of this sawtooth-like pattern (this is analogous to Angrist and Lavy’s, 1999,
"discontinuity sample", highlighted in red in Figure 1). While any of the neighboring board sizes
would be close enough comparables in terms of minimizing omitted variable bias concerns, the
treatment is highest precisely at these jumps. Thus, using the close board sizes at these jumps,
essentially leads to the highest signal-to-noise ratio. It additionally allows us not to rely on any
additional functional form assumptions and extrapolation on how female presence and our variables
of interest depend on the board size itself.
Our simplest possible instrument in this framework, Righti ; is then the dummy that takes a
value of 1 for …rms that were located just to the right of the kink in the discontinuity sample (i.e.
5, 9, 13, etc. in the case of 25% quota), in the year before the quota was announced, and a value of
0 for …rms located just to the left of this kink (i.e. 4, 8, 12, etc. in the case of a 25% quota), and
missing for all other values.3
To give an example of the identifying variation, let’s consider for simplicity just one country,
e.g. the United Kingdom (which is where most of our observations will come from anyway), which
in 2011 published a recommendation by Lord Davies (2011) to incentivize larger …rms to have at
least 25% of women on boards by 2015. Our discontinuity sample in the UK will thus consist of
…rms that in 2010 (a year before the announcement) had 4, 5, 8, 9, 12, 13, etc. board members
(highlighted in red in Figure 1). We will be making all of our comparisons within each of these red
pairs, and to do that, we use the kink-speci…c …xed e¤ects, kc , that capture separate intercepts for
…rms that have 4 and 5 board members, vs …rms that have 8 or 9 board members, vs …rms that
have 12 or 13 board members, etc. Due to these …xed e¤ects, we compare …rms only within each
kink, but not across. Hence, none of our results can be explained by potential di¤erences across
…rms with larger vs smaller boards (see e.g. Yermack, 1996). It is also important to note that
…rms naturally sort into these original board sizes before the actual percentage of the quota gets
revealed, which even further reduces any concerns for selection of …rms into speci…c board sizes (e.g.
multiples of 4 vs one more member). Our main argument will thus be that this pre-existing sorting
of …rms within a kink, e.g. into whether to have 8 or 9 board members (and conditional on other
things that we control for later), is likely to be close to random. This will be further weakened in
3
This most intuitive instrument has a much less intuitive mathematical formula that we only provide here for
completeness:
i0 ) qc )+1
0 if int((bi0bi01) qc )+1 < int((bbi0 +1
Righti = 2) qc )+1 int((bi0 1) qc )+1
;
1 if int((bi0
bi0 1 < bi0
where bi0 is the board size of …rm i in the year before the quota was announced (this year is country-speci…c), and
qc is the country-speci…c quota.
7the more saturated speci…cations.
One might argue that …rms to the right of the kink mechanically have one more board member
within each bin (as 5>4 and 9>8), and this might have its own e¤ect on the dependent variables even
in the absence of any quota (hence violating the exclusion restriction), we weaken the identi…cation
requirements further and move to a di¤erence-in-di¤erences setup, …nally estimating the …rst stage
speci…cation as follows:
Shareit = P ostct Righti + kct + sct + i + ! it ; (1)
where Shareit is the proportion of women on the board of …rm i in year t, P ostct is the country-
speci…c dummy variable that takes the value of 1 for the years after compliance, and 0 for the years
before announcement, Righti is the instrument as de…ned above, kct are the kink-speci…c …xed
e¤ects (described above and kept country- and also year-speci…c, so as to absorb any country-year
variation as well), sct are the industry-year …xed e¤ects (also speci…c to the country)4 , i are …rm
…xed e¤ects, and ! it is the error term.
This move to di¤erence-in-di¤erences helps to address potential pre-existing di¤erences in the
value of the company or other dependent variables for boards of di¤erent sizes. Additionally, it
allows to absorb any non-linear relationship between Share and board size that may exist even in
the absence of a quota, under the assumption that the form of this non-linear relationship is similar
before and after the reform. It is worth noting that our setup is di¤erent from the usual use of
DID in the quota setup (as in Ahern and Dittmar, 2012, and Matsa and Miller, 2013) in at least
two important dimensions. First, the way how we construct counterfactual …rms is di¤erent: we
consider …rms with very close ex ante board sizes, rather than …rms with di¤erent ex ante shares
of women or public and private companies, as these other papers. And second, because we have
a meaningful and observable …rst stage, we don’t have to guess when the shock happens.5 In our
setup we can …rst explore the dynamics of the …rst stage and observe when …rms start responding to
the instrument, and then consider the second stage only where the instrument provides a powerful
enough variation. As we will see further, the cross-sectional di¤erences in Share start kicking in
signi…cantly after compliance years, so we set P ost to be 1 during the years post-compliance, and
4
These are not necessary for identi…cation and do not a¤ect …rst-stage results. We add them in all …rst-stage
speci…cations since they will be included as controls in the second stage for our dependent variables (Tobin’s Q and
others).
5
This is perhaps one reason why di¤erent authors have disagreed on the timing of the Norwegian shock. While
the share of women steadily rose from 2001 to 2009, papers have employed 2002 as the cuto¤ year (Eckbo et al,
forthcoming), 2003 (Ahern and Dittmar, 2012), 2004 (Bertrand et al, 2019), 2005 (Nygaard, 2011), and 2006 (Matsa
and Miller, 2013).
8to 0 – during the years before announcement. The middle years are not used in the main part of
the analysis, since empirically the …rms do not respond to the instrument during these years.6
The implicit assumption in the …rst-stage equation (1) above is that the e¤ect on Share of being
to the right of the kink is the same at di¤erent kinks. This is …ne, as long as we believe that that
the e¤ect mostly comes from having one more woman (rather than the percentage share itself),
and it is constant across kinks. But if not, then we want to identify from the relative sizes of these
jumps as well. We therefore proceed to de…ning our second instrument, which was already graphed
in Figure 1 for the UK, in the following way:7
int((bi0 1) qc ) + 1
M inSharei = ;
bi0
This allows us to proceed to our fullest speci…cations, where we estimate the …rst stage of our
main equations of interest as follows:
Shareit = P ostct M inSharei + kct + sct + i + it : (2)
In essence, we want to exploit the fact that the minimum share M inSharei is disproportionately
larger between …rms with 5 and 4 board members (40%-25%=15% di¤erence) compared to that
between …rms with 9 and 8 board members (33.3%-25%=8.3% di¤erence), and as such Shareit is
also expected to rise more on average in the former case than in the latter. This presents a very tight
identi…cation, under the minimal assumptions that are ever possible in the setting of a universal
percentage quota.
As we will be measuring the e¤ects over time, we cluster errors at the …rm level to account for
arbitrary autocorrelation within …rms and heteroskedasticity. However, it is important to emphasize
again that the identifying variation is mostly cross-sectional, which means that we do not have to
explicitly rely on timings associated with the quota (speed of compliance, when to de…ne pre vs
post, etc.), which some authors (e.g. Ferreira, 2014, and Eckbo et al., forthcoming) have argued
might present a problem in terms of coincidences with various macro events and the associated
di¤erential impact of these events across …rms with di¤erent shares of women. This reinforces the
importance of bringing the comparison …rms as close to each other as possible and then let the data
6
In reality this speed of compliance may also be speci…c to the country, but we choose to be as agnostic as possible.
Our argument on "shopping" for the …rst stage mirrors the optimal selection of instruments, as long as identi…cation
assumptions are maintained (see e.g. Paravisini et al, 2014).
7
Our instrument is di¤erent from the Shortfall instrument, introduced by Eckbo et al (forthcoming) in that
Shortfall uses the ex ante share of women on the board as part of its construction. We discuss why instruments
based on ex ante shares of women are likely to produce overly negative e¤ects on value in Section 4.2.3.
9tell us when the change happens. This is precisely what we do and estimate (1) and (2) on the data
3 years before the quota announcement (P ostct = 0) and 3 years after the quota compliance year
(P ostct = 1), skipping the intermediary years altogether.
A natural question is why being on the right of the kink before the quota can at all predict
the share of females after the quota when …rms have so many di¤erent ways of adjusting board
composition to satisfy the quota? For example, those 9s that really don’t want to have 33.3%, can
just reduce the board size to 8 to attain the required minimum of 25%. If all …rms to the right
adjust like that, then will be close to zero. Furthermore, if …rms instead adjust only by adding
new female members until quota is satis…ed, then those on the right may even end up with a lower
share than those on the left (e.g. among …rms with zero females that adjust by adding new members
only, 4s will need 2 extra women for an average of 2=6 = 33:3% and 5’s will also need 2 extra women
for an average of 2=7 = 28:6%, so that the di¤erence-in-di¤erence coe¢cient is 4:76%). Only if
…rms exchange males for females at least to some extent would be positive (as it is in the extreme:
40% for 5-member boards and 25% for 4-board members, DID is +15%). However, how …rms really
adjust is ultimately an empirical question, and ex ante our identi…cation strategy does not assume
anything about their behavior.
This means three important things for us. First, from a purely econometric side, all other ways
of adjusting, except exchanges, will bring closer to zero (or even negative), reducing the power of
the …rst stage, and making it harder for us to track any changes in Shareit at all (and later in the
dependent variables of interest). Second, if we do …nd a positive and signi…cant (which we do),
this means that the predominant way of adjusting to the quota is actually exchanging males for
females. This is an important empirical observation about board size being so sticky that all other
ways of adjusting are more costly, at least on the margin. And third, di¤erent countries may have
di¤erent ways of adjusting due to a variety of institutional and cultural reasons, suggesting that if
we were to consider individual countries one-by-one, we may …nd a di¤erent across countries. To
sum up, our identi…cation strategy does not assume that all …rms adjust by exchanging males for
females, but empirically explores whether this is on average true or not, and then uses this empirical
fact to track changes in the variables of interest.
103 Data and Summary Statistics
The results of our paper are based on two sets of data. We use an unbalanced panel of listed com-
panies across European countries from BoardEx to obtain the director-level information on gender,
age, number of quali…cations, network size, role (independent or not), and other characteristics,
and average them at the …rm level. We then merge this dataset with …nancial data on public
companies from Eikon. The exact set of countries is comprised of the United Kingdom, France,
Italy, Belgium, Spain, the Netherlands and Norway. These are the countries that introduced formal
(through quotas) or informal (through advisory recommendations) regulations on gender diversity
that satisfy the following criteria: 1) this regulation contains a speci…c minimum percentage that
has to be achieved (otherwise, we would not be able to exploit our discontinuity-based instrument);
2) it applies to a vast majority or even all public …rms (rather than some narrowly-de…ned group,
such as only state companies, – otherwise the power of the …rst stage will be low in case we don’t
measure …rms subjected to regulation very precisely); 3) it has a compliance date of no later than
2017 (otherwise we will not have enough observations to measure the outcomes); and 4) there are
at least 20 …rms in the discontinuity sample (otherwise, our multiple-…xed-e¤ects speci…cations
would not be estimated; however, this is not a hard constraint, as it rules out only Iceland with
its 3 …rms in the discontinuity sample).8 The period of study varies depending on the country and
the respective year when the regulation was introduced and covers all years from 3 years before
quota/regulation …rst announcement to 3 years after and including the compliance year (or to 2019,
whichever is earlier). The complete coverage of countries with a short description of regulation and
the relevant years is presented in Table 1.
As expected due to BoardEx coverage, most of our sample (slightly less than 60%), comes from
the United Kingdom. We will therefore present all the analysis both for the UK alone, as well as for
all countries together. The counts in Table 1 show the number of …rms in the discontinuity sample
as of the year before the regulation announcement. For example, there were 445 public …rms in
the UK in 2010 that had board sizes that are either exact multiples of 4, or had one more board
member. The second largest country is France with 144 …rms in 2009 in the relevant discontinuity
sample (which for a quota of 40% covers many more board sizes). On the other hand, there were
only 20 …rms in the relevant discontinuity sample in Norway and 29 in the Netherlands. Since we
8
We do, hovewer, have to exclude Germany, because listed companies above 2,000 employees (precisely the ones
subject to the 30% gender quota after 2016) have to have either 12, or 16, or 20 supervisory board seats, depending
on the number of employees (Co-determination Act, 1976). As such, there are no comparable …rms within any
discontinuity bin.
11also perform our analysis for the UK alone, and our results are very similar, they are not driven by
any of these countries having very small sets of …rms.
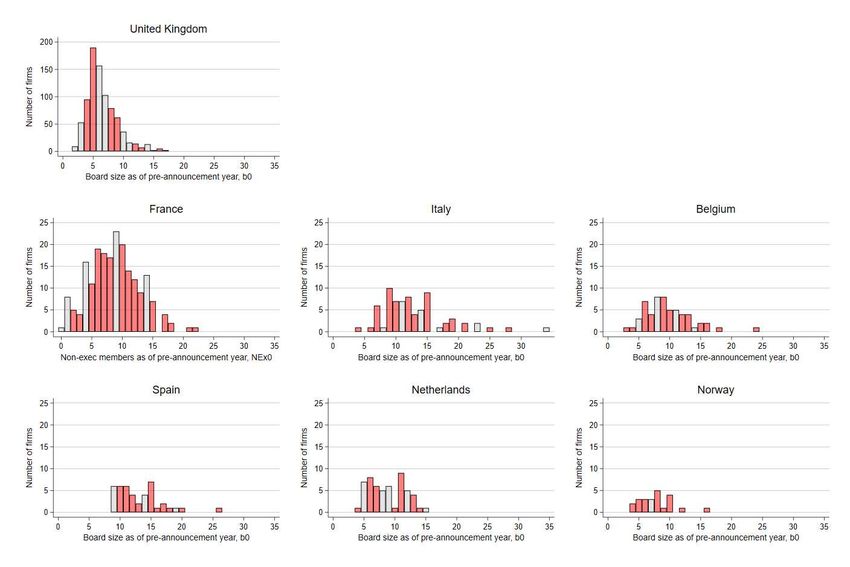
In Figure 2 we further show the exact distribution of pre-announcement-year board sizes, by
country, with red (dark) bars representing the discontinuity sample, and the grey (light) bars
representing all other boards sizes not used in the analysis, across BoardEx-Eikon listed …rms. We
also do not consider (almost mechanically) very small boards of fewer than 4 members in the year
before the quota announcement. Since French quota applies to non-executive members, the relevant
discontinuity samples are based on the ex ante number of non-executive directors, rather than total
board size. Depending on the exact quota percentage, which de…nes the board sizes to be included
in the discontinuity sample, and the distribution of …rms across board sizes, our sample covers from
54% of these …rms in the UK, to 71% in France, and above 70% in most other countries, for a total
of about 60% of all BoardEx-Eikon public …rms in these countries. In the unreported results, we
also show that variable distributions in the pre-announcement year are similar in the discontinuity
sample and out of it, within each country, which is expected given the way it is constructed. This
also speaks to the generalizability of our results to boards of di¤erent sizes. In what follows, we
refer to the discontinuity sample as the sample.
Table 2 presents summary statistics for the main variables of interest, with all continuous vari-
ables winsorized at 1% tails. For comparability reasons, we present the statistics for the post-
compliance period only. Companies in our sample have on average 23 bn Euro total assets (0.6 bn
in the log form) and an average market capitalization of 4.5 bn Euro (0.4 bn in the log form). The
average board size is equal to 8, both before the announcement of the regulation and also after,
suggesting that on average …rms do not reduce the number of board seats in order to avoid hiring
an extra women and that board sizes are generally sticky. Firm boards have about 21% females
post-compliance, compared to about 6% before the announcement. The former is somewhat smaller
than any of the quotas considered, since not all regulation is mandatory, and not for all …rms in
the sample. The main instrument (predicted minimum share of women, M inSharei ) averages to
36% and summarizes the average quota-implied share of women in the discontinuity sample. As
expected, about half of the …rms are located to the right of the kink.
Following prior research on …rm value and governance, we compute Tobin’s Q as our main
measure of …rm value (Yermack, 1996; Adams and Ferreira, 2009; Ahern and Dittmar, 2012). It
is de…ned as the sum of total assets and market equity less common book equity divided by total
assets, and averages to 1.9 in the post-compliance period. About 19% of …rms’ capital comes from
12debt (as normalized to assets), and 74% of …rms pay dividends. Average return on assets is slightly
negative and amounts to -1%. On average companies’ revenue is 0.3 bn per year, and they hire
about 1700 workers, for an average labor productivity (revenue per worker) of 270 thousand Euro
per worker, with an average wage of about 30 thousand Euro per worker (all values computed based
on the log-form averages). There are slightly fewer observations available for other indicators. For
the UK …rms we also compute loadings on the 4 risk factors, as provided by Gregory, Tharyan, and
Christidis (2013), as well as buy-and-hold returns.
Finally, the average age of a director in the sample is 58 years, s/he has on average 1.7 quali-
…cations, a network size of about a thousand people, and has served in the company for around 8
years; about half of directors are independent.
4 First-Stage Results
4.1 The e¤ect of the instrument on the actual share of women
The …rst empirical test of interest is the one that shows that the instruments (being to the right of
the discontinuity, Righti , or the predicted minimum share of women, M inSharei ) have a signi…cant
and direct impact on the actual share of women, Shareit . This is a necessary condition for further
exploration of the e¤ects of women on corporate outcomes in the IV framework. As discussed
above, if …rms on average adjust in a di¤erent way than substituting women for men, the …rst-stage
coe¢cient would be close to zero (or even negative). This ultimately becomes an empirical question,
which we now explore. To summarize, we …nd that the instrument does predict di¤erences in female
shares, and with a positive sign, implying that on the margin, …rms adjust as prescribed by the
instrument. In particular, they do not on average choose to change their board sizes to comply with
the quota exactly, suggesting that the costs of adjusting board sizes are large enough.
We estimate (1) and (2) and report the results in Table 3. For illustrative purpose, in columns 1
to 3 we also consider post-announcement vs pre-announcement periods (when dummy P ostct takes
the value of 1 for the years after the announcement, and 0 for the years before the announcement),
while columns 4 to 6 are estimated on our main post-compliance vs pre-announcement period. Panel
A shows the results for the United Kingdom, which constitutes the majority of our observations,
and Panel B tracks all countries together.9 Column 1 uses the simplest possible setup and estimates
9
In all speci…cations throughout the paper, we drop a few …rms that already had a higher share of women than
the quota, before the quota was announced. Dropping these few una¤ected …rms naturally increases the power of
the …rst stage. The results are, however, similar if these few …rms are kept, and are available upon request.
13(1) using the data from the …rst kink only (i.e. boards of 4 and 5 in the UK). The largest jump
in the minimum share occurs at this kink, so the e¤ect on Shareit is expected to be the largest.
The coe¢cient of 0.02 implies that there is a 2 pp di¤erence in the share of women on average
in the years post-announcement, compared to pre-announcement, between …rms that used to have
4 and 5 board members before announcement. We see that while this e¤ect is signi…cant at the
5% level, the instrument is not exceptionally strong (with an F-statistic of 4.5), suggesting that
compliance doesn’t fully pick up in the …rst years after the announcement. We therefore move to
the post-compliance period, where all …rms have had enough time to follow the regulation. As we
see in column 4, the similar di¤erence is already 0.065 and signi…cant at the 1% level. If all …rms
complied exactly with this voluntary regulation in all years and did not change their board sizes,
then this magnitude would be 0.15 (the di¤erence between 40% and 25%). However, as noticed
before, none of this is assumed in the identi…cation, and it is only important that this instrument
does provide a signi…cant explanatory power. The economic magnitude of this coe¢cient suggests
that …rms do comply to a large extent even with the voluntary quota in the UK (and among …rms
in the FTSE100 compliance rates are the highest at more than 60%). Column 5 repeats the same
exercise for …rms in all kinks and the magnitude of the coe¢cient expectedly drops, since the jumps
become smaller and smaller, while the instrument is still signi…cant at the 1% level.
In column 6, we turn to using intensities as in (2), where we can fully account for the relative size
of the kinks, and this is where the most interesting observation on the economic magnitude comes
from. One can think of it as a weighted average of how well …rms comply with the instrument. If
everybody would satisfy just the minimum required share, as prescribed by the instrument, then
the coe¢cient would have been exactly 1. However, arguably, some …rms would prefer to change the
board size in the opposite direction (driving the magnitude closer to zero, as discussed above), some
would not comply because they are not required to (again, making the coe¢cient closer to zero),
and some may react more strongly and hire a higher percentage than the minimum predicted by
the instrument (increasing the magnitude). As such, the obtained coe¢cients represent a weighted
average of all these types of behavior.
In Panel B we consider all …rms in our sample together (appropriately accounting for all …xed
e¤ects that are now country-speci…c, as explained in Section 2). As the dynamics of compliance
(including the time between announcement and compliance) and the stickiness of boards are likely
to be very di¤erent across countries, the economic magnitudes may naturally change, but they
don’t, and the coe¢cients remain very signi…cant, all at least at the 1% level. The …rst-stage F-
14statistic becomes larger than in Panel A in all post-compliance speci…cations. It is notable that after
accounting for all …rm heterogeneity and industry-year …xed e¤ects, M inSharei can still predict
the actual share of women quite precisely even across all countries. This is notable because higher
quota percentages in other countries also imply that the kinks are located much closer to each other
(e.g. 5 vs 6, and 7 vs 8 in case of a 40% quota), and as such there is much less variation left when
these …rms are compared to each other within such narrowly-de…ned kinks. Still, we see that our
instrument predicts the share of women very well.
4.2 Validating the instrument
4.2.1 Pre-existing di¤erences and dynamics
We need to make sure that our instrument is not picking up some pre-existing trends across …rms
that may relate to future shares of women and future outcomes. We start by exploring visually the
dynamics of the …rst stage in Figures 3 and 4. We plot coe¢cients from a regression similar to (1)
and (2), where instead of P ostct we use the full set of dummy variables for years Dj (the year before
announcement, D0 , is excluded to avoid perfect multicollinearity and all coe¢cient magnitudes are
measured relative to this year). Speci…cally, we estimate:
Shareit = 4 D 4 Righti +:::+ 1 D 1 Righti + 1 D1 Righti +:::+ 8 D8 Righti + kt + st + i +! it ; (3)
Shareit = 4 D 4 M inSharei + ::: + 1 D 1 M inSharei +
+ 1 D1 M inSharei + ::: + 8 D8 M inSharei +
+ kt + st + i + it (4)
and plot the estimates of j with their 95% con…dence intervals over time. Since the period
between announcement and compliance years varies signi…cantly by country, for illustrative purposes
we plot the dynamics for the UK only and highlight 2011 and 2015 on the graph as the announcement
and compliance years, respectively. As we observe in Figure 3, the relative di¤erence between …rms
with closely-held board sizes, j, is statistically zero before announcement, not just in levels (which
is interesting), but also in trends (which is important in the DID setting). This di¤erence also rises
15steadily starting with the announcement and gets signi…cantly pronounced after the compliance
year, validating our primary focus on the post-compliance period. The dynamics are also similar
for the M inSharei instrument depicted in Figure 4.
4.2.2 Pre-existing trends
We now formalize the placebo pre-trend regressions. Speci…cally, we consider the di¤erenced
form of (1) and (2 ), which allows us to use as many years prior to quota announcement for each
country as are available in the data (capped at up to 10 years before announcement), and compare
the average long-run trends between …rms to the left and right of the kink, and …rms with di¤erent
values of the M inSharei instrument. We estimate:
Shareit = Righti + kc + ! it ; (5)
Shareit = M inSharei + kc + it : (6)
The results are reported in Appendix Table 1 for all countries together in columns 1 to 3 and
for the UK in columns 4 to 6. As expected, we see no signi…cant e¤ects in any of the speci…cations,
suggesting that there are no pre-existing di¤erences in trends between …rms to the left and right of
the kink.
We also replicate these regressions for our main second-stage dependent variable – Tobin’s Q
in Appendix Table 2, columns 1 to 3 for all countries together and 4 to 6 for the UK. Again, we
see no signi…cant di¤erences in past trends between …rms to the left and to the right of the kink.
While this is reassuring and suggests that there is no apparent pre-selection of …rms into boards of
di¤erent sizes, this is also somewhat expected from the way the instrument and the discontinuity
sample are constructed to start with.
4.2.3 Why instruments based on past female share cannot be applied
To …nalize this section, we want to explore why instruments based on pre-announcement shares
of women should not be applied in a di¤erence-in-di¤erences setting, at least in our sample. To do
that we also consider past trends in Tobin’s Q for …rms with di¤erent pre-announcement shares of
women. For illustrative purposes, we …rst divide …rms into those which have at least one female in
the year before announcement (W omani = 1, these are approximately 43% of all …rms) and those
which have no women before the quota is announced (W omani = 0, the remaining 57% of all …rms).
16As we see in Appendix Table 2, column 7 for all countries and column 9 for the UK, …rms with
at least one woman in the year before the announcement had statistically signi…cantly grown faster
in terms of Tobin’s Q already before the quota was announced, relative to those that had no women.
This is also true for the share of women as of pre-announcement year, Sharei (columns 8 and 10).
This means that a di¤erence-in-di¤erences setting that is based on assuming such …rms would have
had the same trends had the reform not happened, will likely …nd its identi…cation assumptions not
satis…ed. Speci…cally, if such an instrument were used to evaluate the e¤ects of the quota, and these
di¤erential trends continued to follow, then the reduced form of Tobin’s Q on P ostct W omani or
P ostct Sharei will produce an upward-biased coe¢cient.
The di¤erence-in-di¤erences coe¢cient of the …rst stage (Shareit on P ostct W omani or Shareit
on P ostct Sharei ), on the other hand, is by construction negative with these instruments. This
happens almost mechanically since to get to the same quota …rms with more women need to increase
their share by less than …rms with fewer women. These two observations mean that the IV coe¢cient
(the ratio of an upward-biased reduced form to a negative …rst stage) will be downward biased: more
negative if the reduced form is positive, or less positive if the reduced form is negative. Therefore,
using an instrument that is based on past shares of women will produce a biased and overly negative
view of the e¤ect of women directors on Tobin’s Q.
5 The E¤ect of Gender Diversity on Firm Value
5.1 The e¤ect of Gender Diversity on Tobin’s Q
5.1.1 Average e¤ect
We now employ our strategy to estimate the e¤ects of gender diversity on …rm performance and
other variables. We start by considering Tobin’s Q – the most common long-run measure of …rm
value – as the dependent variable and report reduced-form results (and IV-2SLS) in Table 4.
The reduced form corresponds to the following equations:
Yit = P ostct Righti + kct + sct + i + it (7)
Yit = P ostct M inSharei + kct + sct + i + it ; (8)
and the IV-2SLS is given by:
17Yit = Shareit + kct + sct + i + it ; (9)
where the instrument is either P ostct Righti (columns 1 and 2 – for all countries, and 4 and 5
– for the UK) or P ostct M inSharei (column 3 – for all countries, and 6 – for the UK), and all the
variables and …xed e¤ects are de…ned as above.
We include industry-country-year …xed e¤ects in all speci…cations (based on Eikon 52 industry
groups), to make sure the di¤erences in Q are not accidentally driven by non-random composition
of board sizes across di¤erent industries and shocks to them, as well as to explain more variation in
Tobin’s Q. The coe¢cient 1.011 in column 1 suggests that …rms to the right of the discontinuity (at
the …rst kink) have on average 1.011 units higher Tobin’s Q than those to the left of the discontinuity,
after quotas were introduced vs any potential di¤erence before. In column 2 we replicate this analysis
across all kinks and see similar results. In column 3, we move to the second instrument, M inSharei ,
which is based on intensities, and again we see very signi…cant reduced-form results.
Just below, we also report the corresponding IV-2SLS coe¢cients with their standard errors that
give the magnitude of the e¤ect, rather than just the sign, as well as robust weak-IV Anderson-Rubin
con…dence sets, which provide a more accurate p-values when F-statistics are not large (Andrews et
al., 2019). While the reduced-form coe¢cients are obviously di¤erent in magnitude, once we rescale
them into the actual magnitudes of interest – the IV-2SLS e¤ects of women on …rm value, – we see
similar magnitude across all three instruments. This is remarkable, given that they are based on
slightly di¤erent samples (largest kink vs all kinks) and slightly di¤erent identi…cation assumptions,
suggesting that this average positive e¤ect of women on Tobin’s Q is very robust. The preferred
IV-2SLS estimate of 20.76 in column 3 means that for a one within-…rm standard deviation in the
share of women (which is about 10 pp in our data), Tobin’s Q on average increases by 2 units (which
is about 1.2 within-…rm standard deviations of this variable). This suggests that women do have an
economically large e¤ect on Tobin’s Q, across European listed …rms. The Anderson-Rubin p-values
further con…rm that this e¤ect is signi…cant at the 5% level in all three speci…cations. In columns
4 to 6 we redo the analysis for the UK only, and the results are similar.
These large magnitudes are also sensible when discussed in the framework of heterogeneous
treatment e¤ects. If the e¤ects are heterogeneous, then our IV estimates correspond to …rms that
"comply" with our instrument, i.e. those that have more women only because they end up to the
right of the threshold and rounding is not in their favor. These are likely to be …rms with the
stickiest board sizes, i.e. …rms for which the costs of having more women are smaller (or non-
18existent) relative to the costs of changing the board size. It is thus expected that this type of
…rms may have quite high positive e¤ects of women directors.10 While it is inherently impossible
to observe which …rms are compliers to the instrument, we can calculate how many they are in our
sample. To do that, in unreported results, we estimate (7) for a complier-with-the-quota dummy
(i.e. having the share of women at or above the quota) directly.11 We observe that the percent of
instrument compliers varies from 13% across all countries and all kinks to 18% in the UK for …rms
at the …rst kink. This is similar to the percent of compliers that would be achieved if one used the
P ostct W omani instrument, discussed above, even in the full sample of all board sizes. This means
that instruments based on pre-existing heterogeneity of female shares are likely to neither produce
consistent estimates, as discussed in Section 4.2.3, nor apply to larger subsamples of …rms.
5.1.2 Individual country-level analysis
We now further decompose the overall average e¤ect from Table 4 to see if it is driven entirely
by the UK or if there is evidence from other countries as well. The very basic obstacle to analyzing
country-by-country is the individual-country-level …rst stage, as there are multiple reasons why it
may have di¤erent strengths across countries, especially given a small number of listed companies
in other countries. First, the regulation is di¤erent across countries in terms of how obligatory
compliance is de jure and de facto, i.e. whether the sanctions for non-compliance are signi…cant
enough to alter …rms’ behavior in the institutional environment of a speci…c country. Second, the
speed of compliance with the quota may be di¤erent, depending on how easy it is to change board
members, and how big the lag is between announcement and actual compliance date, both a¤ecting
the timing of the …rst-stage e¤ects. Finally, as discussed in Section 2, the exact way how …rms adjust
to the quota (by substituting women for men or hiring additional women until the quota is satis…ed
or a combination of the two) directly a¤ects the value of the …rst-stage coe¢cient. Given these
many obstacles, we can only explore the e¤ect of interest in countries or subsamples of countries
where the …rst stage proves signi…cant enough.12
To increase the power of the …rst stage at the individual-country level we estimate our main
equations of interest using post-compliance vs pre-announcement periods, for the …rst two kinks.
This focuses on the jumps with the highest magnitude and hence has the most power to detect
10
All previous IV-based work is of course also subject to such a LATE interpretation.
11
This is a virtue of having binary variables: in the Angrist and Pischke (2009) notation, this is a regression of the
endogeneous treatment indicator on the instrument, and it calculates the proportion of compliers to the instrument.
12
One may be tempted to simply explore the e¤ect of the instrument on Tobin’s Q (the reduced form), even if
that …rst stage is not powerful enough. However, this is not reasonable in our case, because even the sign of the
…rst stage is unknown (as it depends on the way …rms adjust to the quota). Hence there is no reason to expect any
speci…c sign from the reduced form either.
19enough variation in the female ratio. We report the results in Table 5, where Panels A and B
correspond to the Righti and M inSharei instruments, respectively. The coe¢cients within each
column refer to the results of separate regressions: the …rst stage in the …rst row, the reduced form
in the second row, and below we also report the the implied 2SLS estimate as well as the Anderson-
Rubin robust con…dence sets with p-values. In column 1 we consider all countries together, and in
column 2 – just the UK. We provide these for reference only to check that our main results from
Tables 3 and 4 are not a¤ected by this change towards a more powerful sample.
Now in column 3 we report the e¤ect on all countries except the UK. As we see, both the …rst
stage (0.683) and the reduced form (2.459) are signi…cant at the 5% level and have the expected
signs. However, the …rst-stage F-statistic of 6.86 is not high enough for 2SLS to provide any credible
inference, and the magnitudes of IV-2SLS cannot be directly compared (with weak instruments 2SLS
is biased towards OLS which is close to zero in our case). Therefore, we have to refer to Anderson-
Rubin con…dence sets and p-values that are robust to the presence of arbitrarily weak instruments
(Andrews et al., 2019). As we see, the 95% con…dence set does not include zero, meaning that the
e¤ect of female share on Tobin’s Q is also positive and signi…cant at the 5% level for all countries
other than the UK. This e¤ect is also robust to using the Righti instrument instead (Panel B).
Overall, we see that the e¤ect of female share on Tobin’s Q is pronounced both in the UK and in
all non-UK countries taken together.
Furthermore, there are three more individual countries for which the …rst stage coe¢cient turns
out to be signi…cant at least at the 5% level, and hence we can explore the e¤ects for them: these
are France, the Netherlands, and Norway (columns 4 to 6, respectively).13 As we see, all three
show positive e¤ects in the reduced form, with France and Norway being signi…cant at the 5% level,
while for the Netherlands the coe¢cient has a 10.6% p-value. A similar pattern is observed once
we consider AR con…dence sets. Both France and Norway show signi…cant positive e¤ects of female
directors on Tobin’s Q, while the e¤ect is positive but only marginally signi…cant for the Netherlands
(p-value of 10.6%). For the Netherlands and Norway, which have a relatively high F-statistic, we
can look directly at the implied IV-2SLS estimates, and it is interesting to see Norway having a
very similar magnitude to the one in the UK. For the Netherlands the magnitude is much lower,
but it is clearly not negative (rejected at the 10.6/2=5.3% signi…cance level). Finally, in column
7 we report the results for all other countries together, for completeness only: the …rst-stage F-
statistic of 0.01 prevents any separate inference for these countries, even though it is reassuring
13
For each other country considered individually, the …rst stage is not signi…cant even at 5%. Hence the second
stage cannot be identi…ed, as the AR con…dence sets would automatically include plus and minus in…nity.
20You can also read