Situation and Outlook for Primary Industries - December 2019 - MPI
←
→
Page content transcription
If your browser does not render page correctly, please read the page content below

Situation and
Outlook for
Primary Industries
     December 2019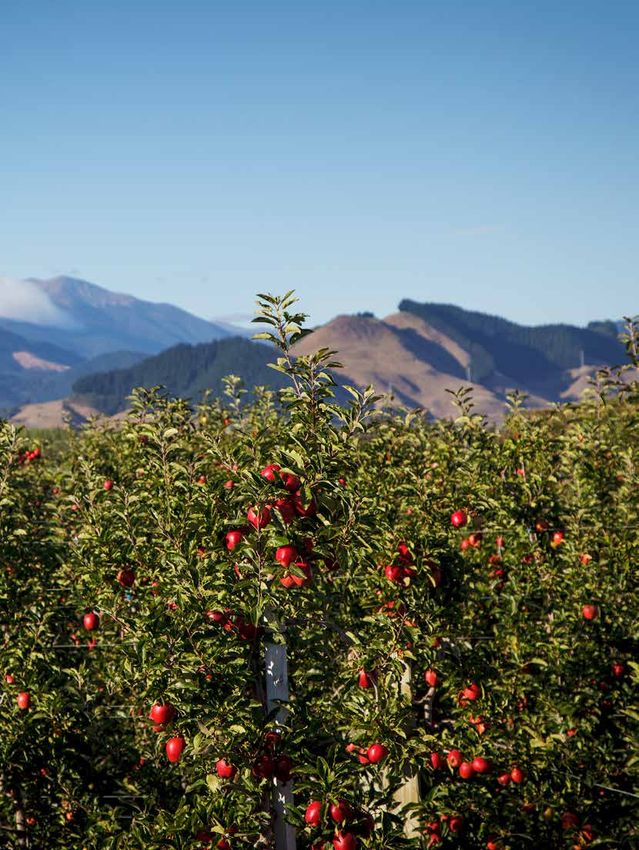
Contents
Acknowledgements
Natasha Abram, Paul Berentson, Annette Carey,              Overview                                                  4
Matt Dilly, Loretta Dobbs, Daniel Hamill,
Geoff King, Bijaya Poudyal, Robert Radics,
Claudia Riley, Wido van Lijf.
                                                           Dairy                                                   12
Cover photo: NZ Apples and Pears

Notes                                                      Meat and Wool                                           16
Annual figures are for the year ended June unless
otherwise noted. Currency figures are in
New Zealand dollars unless otherwise noted.
Some totals may not add due to rounding.                   Forestry                                                18
MPI welcomes feedback on this publication at
SOPI@mpi.govt.nz.
                                                           Horticulture                                            20
Publisher
Ministry for Primary Industries
Economic Intelligence Unit                                 Seafood                                                 24
Charles Fergusson Building, 34-38 Bowen Street
PO Box 2526, Wellington 6140, New Zealand
Tel: 0800 00 83 33
                                                           Arable                                                  26
This publication is available on the
Ministry for Primary Industries website at
www.mpi.govt.nz
                                                           Other primary sector                                    28
Further copies may be requested from
SOPI@mpi.govt.nz                                           exports and foods
ISBN No. 978-1-99-001724-7 (online)
ISBN No. 978-1-99-001725-4 (print)

Disclaimer
While care has been used in compiling this document, the Ministry for Primary Industries do not give any prediction, warranty
or assurance in relation to the accuracy of or fitness for any particular purpose, use or application of any information contained
in this document. To the full extent permitted by law, neither the Ministry for Primary Industries nor any of its employees shall
not be liable for any cost (including legal costs), claim, liability, loss, damage, injury or the like, which may be suffered or
incurred as a direct or indirect result of the reliance by any person on any information contained in this document.

This work is licensed under the Creative Commons Attribution 3.0 New Zealand licence. In essence, you are free to copy,
distribute and adapt the work, as long as you attribute the work to the Crown and abide by the other licence terms.
To view a copy of this licence, visit http://creativecommons.org/licenses/by/3.0/nz/. Please note that no departmental or
governmental emblem, logo or Coat of Arms may be used in any way which infringes any provision of the Flags, Emblems,
and Names Protection Act 1981. Attribution to the Crown should be in written form and not by reproduction of any such
emblem, logo or Coat of Arms. Photographs may not be reproduced without permission.
Minister's foreword
I am pleased to release the latest Situation and Outlook for
Primary Industries (SOPI) for December 2019. Primary sector
export revenue is expected to rise by 3.3 percent in the year
ending June 2020 and it’s forecast to further increase in 2021 as
our sectors continue to build on a number of years of stellar
growth.
When our primary sectors do well, New Zealand does well and
this Government wants to work alongside industry to develop
sustainable and valuable pathways forward.
New Zealand’s future wellbeing depends on an economy that is
both environmentally sustainable and delivering high value.
Growing food in the volumes and quality we’ve come to expect
depends both upon the availability of land and the quality of our soil and freshwater.
Many of New Zealand’s farmers and growers are modelling fantastic environmental practice,
and we need to work together across the food and fibres sector to lift everyone’s operations.
Best practice needs to become normal practice.
To support the sustainable growth of our primary sectors and the Government consulted to
protect our best land for growing a range of fruits, vegetables or fibre, or pasture for livestock,
on the proposal for a “National Policy Statement for Highly Productive Land”. In addition, to
improve water quality within a generation, we also consulted on the “Action for Healthy
Waterways” discussion document throughout New Zealand.
Our work is being further supported by that of the Primary Sector Council, which I appointed last
year to establish a shared vision for the future of our primary sector. Following 18 months of
extensive consultation, the Council will release its vision for the future of the sector.
We are continuing to explore a range of initiatives to support farmers and growers to respond to
regulatory changes and to improve wellbeing for rural communities. Innovation, from small
grassroots community projects to large-scale industry development, will continue to play an
important part.
We must continue to build the foundations now to deliver an enriched future for all
New Zealanders.

Hon Damien O’Connor
Minister of Agriculture

                                                                              SOPI
                                                                               SOPIDECEMBER  2019••11
                                                                                    DECEMBER2019
Director-General’s introduction
           As Director-General, it is my job to ensure that the MPI is in the
           best possible position to build the trust and confidence of
           New Zealanders in the important work that we do, and enable the
           primary industries to continue to
           thrive well into the future. Essential to that work is having
           up-to-date, reliable information on the challenges and
           opportunities facing New Zealand’s primary industry sectors.
           The December Situation and Outlook for Primary Industries
           (SOPI), produced by MPI’s Economic Intelligence Unit, outlines
           the current state of New Zealand’s primary industries and their
           prospects for growth over the next four years.
           The December report highlights the continued success of the
           primary industries, with export revenue forecast to reach $47.9 billion in the year ended June
           2020, up 3.3 percent on the previous year. Our traditional areas of strength continue to grow
           with dairy export revenue forecast to rise 8.4 percent to $19.6 billion for the year ending June
           2020. Meat and wool exports remain robust with export revenues forecast to reach $10.4 billion
           – up 2.5 percent. Some of our other star performers this quarter include horticulture with a
           4.7 percent rise in revenue forecast, driven by increases in kiwifruit, wine, apple and pear
           exports. Meanwhile seafood annual export earnings could surpass $2 billion for the first time,
           with growth forecast at 6.5 percent. Innovation continues to be a big factor in this growth, with
           processed foods such as dairy blends being particularly popular in our South Korean and
           Japanese markets.
           There have been plenty of gains for the primary industries over the last few months. We’ve made
           huge strides in market access this quarter, with the Regional Comprehensive Economic
           Partnership (RCEP) text agreed in November. RCEP participants take 62 percent of
           New Zealand’s primary sector exports, so it is a high priority for us to get the full agreement
           concluded and signed in 2020.
           MPI has also successfully established its new Agriculture and Investment Services branch,
           designed to partner with the sector on emerging issues and sponsor investment in ideas and
           innovation. We’re already starting to see how a joined up branch, focused on the needs of the
           agriculture sector, can have real benefits.
           An example of MPI’s support for innovation is through Sustainable Food and Fibre (SFF) Futures
           co-investment funding. With $40 million available each year from MPI, SFF Futures supports
           problem-solving and innovation in New Zealand’s food and fibre industries that will make a
           positive and lasting difference. It offers a single gateway to apply for investment, and provides
           grants of less than $100,000, right up to multi-million dollar, multi-year partnerships.
           We are here to back the Primary Industries to win and to support them in a changing world.

           Ray Smith
           Director-General, Ministry for Primary Industries

2 • MINISTRY FOR PRIMARY INDUSTRIES
New Zealand’s dairy export revenue is forecast to rise 8.4 percent to $19.6 billion for the
               year ending June 2020. Expectations of another strong production season, combined with
               robust global dairy prices and a weak outlook for the New Zealand dollar, are expected to
               support solid export revenue growth in the year ahead. For New Zealand’s dairy farmers,
Dairy
               this is expected to translate into higher farmgate milk prices, supporting robust sector
               profitability for the season ahead.

               The outlook for meat and wool exports remains robust with export revenues forecast to
               reach $10.4 billion for the year ending June 2020, 2.5 percent higher than the previous
               year. The positive outlook for the sector is being driven by high international meat prices
               as a result of African Swine Fever (ASF) reducing China’s pork herd and increasing
Meat & Wool    demand for imported protein. Strong schedule prices as a result of international demand
               have also helped maintain on-farm profitability.

               Forestry exports for the year ending June 2020 are forecast to fall 12.8 percent to
               $6.0 billion compared to the year ended June 2019 when prices and volumes were at
               record highs. This is $0.2 billion higher than the September forecast for year ending June
Forestry       2020 as log prices are recovering more quickly than expected from their sharp fall over
               June and July of this year.

               Horticulture sector revenue is forecast to rise 4.7 percent for the year ending June 2020
               driven by increases in kiwifruit, wine, and apple and pear exports. This will elevate the
               horticulture sector to be the third largest primary sector industry by value, edging ahead
               of the forestry sector. Kiwifruit exports are expected to rise by 8.6 percent to $2.5 billion,
Horticulture   while wine exports are predicted to rise by 1.8 percent to $1.8 billion, and apple and pear
               export revenue to rise by 7.2 percent to $0.9 billion.

               Seafood export earnings are forecast to grow 6.5 percent in the year ending June 2020 to
               $2.1 billion, the first time annual export earnings will surpass two billion dollars. This
               growth is expected to be underpinned by an increase in export prices and rising
               aquaculture production. Increasing demand from key markets along with limited supply
Seafood        growth, particularly of wild capture fisheries, is expected to keep prices high. The
               forecast growth in aquaculture production is expected to result in higher export volumes
               in the coming years.

               The 2019/20 year has begun positively with export revenue up 43 percent for the
               September 2019 quarter compared to September 2018 quarter, and a reasonable
               growing season to date in most areas. Export sales in all categories increased with
Arable         vegetable seeds the main contributor, up $16.4 million on the September 2018 quarter.
               As a result, arable export revenue is expected to rise 10 percent for the year ending June
               2020 to $260 million with slightly lower levels forecast for 2021.

               Export revenue for New Zealand’s other primary sector exports and foods is expected to
               increase to $3 billion for the year to June 2020, up 7.3 percent from 2019. This builds on
               the 5.3 percent growth for 2019. This growth is being led by the other products (such as
Other          dairy blends and soft drinks), innovative processed foods and live animals categories.
               Demand for these products is expected to continue to develop in coming years.

                                                                                        SOPI DECEMBER 2019 • 3
Overview
Primary industries export revenue 2015-21 (NZ$ million)
                                                                                                                            Actual                   Forecast

                                                         2015               2016                2017          2018           2019          2020          2021

         Dairy                                         14,050             13,289              14,638         16,655        18,107        19,630         19,450

         Meat and Wool                                  9,000               9,200              8,355          9,542        10,176        10,430         10,680

         Forestry                                       4,683               5,140              5,482          6,382         6,883         6,000          6,600

         Horticulture                                   4,185               5,000              5,165          5,392         6,111         6,400          6,530

         Seafood                                        1,562               1,768              1,744          1,777         1,963         2,090          2,210

         Arable                                           181                 210                197           243            236           260              255

         Other primary sector*                          2,417               2,714              2,639          2,709         2,852         3,060         3,140

                                        Total          36,079              37,323              38,220        42,700        46,329         47,870        48,865

                      % Change year on year              -6.8%             +3.4%               +2.4%        +11.7%          +8.5%         +3.3%         +2.1%

Source: Stats NZ and MPI.
* Other Primary Sector Exports and Foods includes live animals, honey, and processed food.

 Export revenue is forecast to reach $47.9 billion in the year                               countries is unlikely to reverse soon, so it is expected that
 ending June 2020, up 3.3 percent from the previous year.                                    the current run of high red meat prices will persist over at
 This forecast is $1.7 billion higher than the previous                                      least the next two years.
 forecast round, with upward revisions to dairy, meat and
                                                                                             Following a sharp fall in June, log prices are recovering
 wool, and forestry. A lot of these gains can be attributed to
                                                                                             faster than expected. However the flow on effect on export
 rising global commodity prices and the drivers behind
                                                                                             volumes is expected to restrict forestry sector export
 rising prices are likely to be sustained through 2020 and
                                                                                             revenues in the year ahead.
 2021.
 In particular, a weaker New Zealand dollar over the course
                                                                                             Variable weather impacting production
                                                                                             Following a hot dry summer and autumn, New Zealand
 of this year has helped support strong returns for
                                                                                             had the seventh warmest winter on record. A wet end to
 New Zealand exporters. Since June, the NZD/USD rate has
                                                                                             winter returned soil moisture levels to normal, but did not
 declined from 0.67 to 0.64 boosting commodity prices in
                                                                                             catch up the annual rainfall accumulations which
 NZD terms.
                                                                                             remained below normal in many regions. During spring
 For the dairy sector, following a period of initial early                                   the North Island received lower than normal rainfall and
 season weakness, commodity prices have been on the                                          higher than normal temperatures, resulting in lower soil
 rise. After a strong start, growing conditions across the                                   moisture levels than normal. In parts of the South Island,
 country have become more variable in spring, with                                           spring brought a lot of wet spells, making farm
 production of milk solids in the month of October falling                                   management challenging.
 behind last season’s exceptional result. This will feed into
                                                                                             A hailstorm in November caused considerable damage to
 an international market characterised by tight global
                                                                                             Canterbury cereal, seed and vegetable crops, while in
 supply. Due to strong demand out of Asia, this should
                                                                                             Hawke’s Bay an October hailstorm caused significant
 sustain continued price strength for the remainder of the
                                                                                             damage to early summer fruit crops. Heading into
 season. Red meat prices continue to exceed expectations
                                                                                             summer, the El Niño/Southern Oscillation is neutral and
 due to rising demand from China that is transforming
                                                                                             does not look like it will play a significant role. Over the
 global protein markets. The African swine fever (ASF)
                                                                                             3 months to February 2020, the National Institute for Water
 outbreak in China is the main driver of increased import
                                                                                             and Atmospheric Research predict near normal rainfall
 demand, and the drought in Australia has further reduced
                                                                                             and soil moisture levels.
 global beef and sheep meat supply. The situation in those

 4 • MINISTRY FOR PRIMARY INDUSTRIES
Rural confidence                                               implement and that farming systems will need to change
The positive export outlook and the flow on effects to         in some areas of the country.
farmer incomes appears to be starting to reflect in            The Zero Carbon Act, passed in November 2019, include
sentiment at the farm level. After a series of rural surveys   targets for agricultural methane emission reductions of
indicating declining rural confidence, ANZ’s November          10 percent by 2030 and 24-47 percent by 2050. The
Business Outlook has indicated that profitability              Government has also announced that it will enter into a
expectations in the agriculture sector have improved           world first programme of action with the agriculture sector
significantly in the past few months. While employment         aimed at introducing farm gate emissions pricing by 2025.
and export intentions are strong relative to other parts of
the economy, investment intentions remain weak,                Farm debt remains high, particularly in the dairy sector.
potentially weighed down by uncertainty associated with        Banks have been tightening lending policies over the past
the pace and scale of change of some environmental             year, and a RBNZ policy requiring banks to hold more
regulatory policy proposals.                                   capital may add to that trend. This could reduce farmers’
                                                               ability to borrow money to invest in environmental
In September 2019, the Government consulted on a               mitigations where required.
package of freshwater policy proposals. This Essential
Freshwater programme has three main objectives:                At the international level, key risks to the sector’s export
stopping further degradation and loss, reversing past          performance in the years ahead remain. Global economic
damage, and addressing water allocation issues. Some           growth is beginning to weaken, driven in part by the effects
farmers are concerned that these policies will be costly to    of increased geopolitical uncertainty and heightened trade
                                                               protectionism.

                                                                                                     SOPI DECEMBER 2019 • 5
Brexit                                                        have also had an impact on global prices. The avoidance of
Currently a major source of international uncertainty are     further tariff escalation or timely retraction of the current
the timing and terms of the United Kingdom (UK)’s             set of tariff measures may help lift confidence about
planned exit from the European Union (EU). The UK and         future growth prospects.
EU recently agreed to an extension of the Brexit date to 31   Regional Comprehensive Economic
January 2020.
                                                              Partnership (RCEP)
However, the concerns for New Zealand exporters are the       In November 2019, the RCEP completed negotiation of the
risk of supply chain disruption, the new trading              text of the agreement, and agreed virtually all market
environment that will emerge, and a possible decrease in      access issues between 15 of the 16 participating
UK consumer expenditure, especially if the UK were to         countries. RCEP comprises the 10 ASEAN countries
leave the EU without a deal in place.                         (Brunei, Cambodia, Indonesia, Laos, Malaysia, Myanmar,
                                                              Philippines, Singapore, Thailand, and Viet Nam) and six of
In an effort to mitigate these risks, MPI has continued to
                                                              its existing FTA partners – Australia, China, India, Japan,
work closely with other government agencies to ensure,
                                                              Korea, and New Zealand. The RCEP participants take
where possible, that trade disruption is minimised. In the
                                                              62 percent of New Zealand’s primary sector exports.
meantime, the existing conditions for primary sector trade
between New Zealand and the UK are expected to remain         With the text negotiations completed, negotiations on
the same during the extension period. Advice on the           market access will now continue with the aim of
implications of Brexit for primary industry exporters and     concluding and signing the full agreement in 2020.
what they can do to prepare can be found on MPI’s
                                                              While India still has some outstanding concerns, all RCEP
website.
                                                              participants are continuing to work with India to enable it
Other trade disruptions                                       to join the agreement in 2020.
Currently, a range of indicators is pointing to weaker GDP    The agreement is expected to increase New Zealand
growth for two of New Zealand’s key export trading            exporters’ security in the region, while protecting their
partners: the US and China. These two countries               competitive interests in countries which include seven of
accounted for 40 percent of New Zealand’s primary sector      New Zealand’s top 10 trading partners.
export revenues in the year ended June. Trade tensions

6 • MINISTRY FOR PRIMARY INDUSTRIES
Dairy’s growth and vulnerability

                          The New Zealand dairy industry has grown rapidly over the
                          past two decades, driven by land conversions and productivity
                          improvements. Since 2003, these shifts have resulted in:

                          20%
                          Increase in the
                                                                 25%
                                                                 Increase in
                                                                                                      58%
                                                                                                      Increase in
                          size of the total                      the size of the                      total milk solids
                          dairy platform                         national dairy                       production
                                                                 herd

                                                                                                             MILK

                           7.0                                                                                                          2.0

                                                                                                                                               Milk solids tonnes/hectares (millions)
Dairy cattle (millions)

                           5.0                                                                                                          1.2

                                              Dairy cattle population              Dairy production

                          Dairy Industry Growth 2003 – 2019

                           3.0                                                                                                          0.4
                                   2003                   2007                 2011                   2015                2019
                                                                                                                      Source: StatsNZ and DairyNZ

                                                                                      Dairy platform increase
                                                                                      The national total dairy platform has steadily
                                                                                      increased, rising significantly between 2006 and
                                                                                      2015, before stabilising at its current level of
                                                                                      1.744 million hectares, with much of this growth
                                                                                      being driven by dairy farm conversions.

                                                                                      Productivity drivers
                                                                                      In addition to growth in the total land area,
                                                                                      improvements and advances in herd genetics,
                                                                                      breeding techniques, on-farm management
                                                                                      practices, forages, and new technology
                                                                                      have driven consistent increases in on-farm
                                                                                      productivity for the dairy sector.

                                                                                                                                                                                        SOPI DECEMBER 2019 • 7
Financial                                               This increase in national dairy production
       vulnerability                                             has largely been funded with bank debt.
                                                                 On-farm bank debt has increased by
        of the dairy                                             $30.1 billion since 2003 and currently stands
                                                                 at $41.4 billion.

           sector

                                                                 267%
                                                                    increase since
                                                                        2003
              Agricultural industry bank debt 2003–2019

                 70

                                                                                    Dairy
                                                                                    farm
$NZ Billion

                 50
                                                                                    debt

                                                                       Other agricultural debt

                  0
                       2003            2007               2011            2015                   2019
Source: Reserve Bank of New Zealand

              How does this affect the financial
              vulnerability of the dairy sector?
          While use of debt to fund business and industry growth can play an important role in
          economic success, it appears that the level of financial risk associated with the recent
          expansion of New Zealand’s dairy production has increased significantly in recent years.

                                                             In the 2017–2018 season dairy farms
                                                             on average had a debt-to-asset ratio of
                                                             50.7 percent.
              Equity                                         However, many farms are holding high
                                                             levels of debt:

                                                             24 percent have            4 percent have
                Debt                                         ratios over                ratios over
                                                             70 percent; and            90 percent.

                  8 • MINISTRY FOR PRIMARY INDUSTRIES
The level of debt held relative to farm assets and production has
increased significantly across the sector.
$22.0
per kg
$23.6k
2019
Debt to production Debt per hectare
Relative to production, farm debt The average level of bank debt
levels have more than doubled
from $9.48 per kilogram of milk- $9.5 held per hectare has more than
tripled since 2003, rising from
solids in 2003 to $21.99 in 2019. per kg $7.7k $7,700 to $23,600 in 2018.
2003
Source: StatsNZ & Reserve Bank of New Zealand
In addition, the number and proportion of farms Distribution of dairy sector debt per kg of milk solids 2014 and 2018
holding high levels of debt have also increased. 2013/2014 2017/2018
In particular, the percentage of farms holding greater than 50%
Percentage of Dairy Farms
$30 of debt per kilogram of milk solids produced annually has
increased from 16 percent in 2014 to 30 percent in 2018.
Despite falling interest rates over recent years, the burden 25%
of servicing this elevated debt has increased. Since 2014,
the average annual cost of servicing this elevated debt has
increased by 11 cents to $1.22 per kilogram of milk solids
in 2018. 0%
$50
Source: DairyNZ
Debt to income ratio by sector 2018
Relative to its income, the dairy industry holds a
Dairy lot more debt than other agricultural producers.
In fact, despite having enjoyed relatively good milk price
pay-outs in recent years, the dairy industry still currently
Other agriculture holds 60 percent more debt compared with other agricultural
producers.
0 1.75 3.5
Ratio of debt to income
Source: Reserve Bank of New Zealand
Non-performing loans as a percentage of total sector debt
Early warning signs may now be beginning to 2015-2019
appear, with the number of farms experiencing Dairy Horticulture & Other Sheep & Beef
financial distress increasing in recent years.
3%
The ratio of non-performing loans in the dairy sector has
Non-performing loans
doubled over the past three years. Currently at 2.1 percent of
the dairy sector total, this figure is three times higher than
that of other comparable primary sector industries. 1.5%
0%
Jan 15 Oct15 Jul 16 Apr 17 Jan 18 Oct18 Jul 19
Source: Reserve Bank of New Zealand
SOPI DECEMBER 2019 • 9The high levels of debt currently held
Upcoming by vulnerable dairy farms may inhibit
their ability to successfully meet the
challenges challenges ahead and adapt to changes in
their operating environment.
Financial pressures associated with this highly indebted These new regulatory constraints may have the effect of
sector may constrain the ability of financially vulnerable limiting future intensification of farming practices and
farms to invest and adapt to the changes associated further growth in the national milking platform area.
with increased environmental and other regulatory The national milking platform area’s size, total dairy
requirements on the sector over the longer term. herd, and level of intensification are thus expected to
experience modest declines in the medium to long term.
These changes include As a result, further
investment in investment in on-farm
on-farm technology and productivity gains will need
infrastructure, to reduce to continue if the sector
the sector’s impact on is to achieve future
freshwater quality and industry growth.
climate change.
The appetite of banks to keep funding sector growth through the provision of credit is
decreasing. Evidence indicates that the banking sector is positioning itself with a more
conservative approach to dairy sector debt in its portfolios, reducing credit lines and requiring
active repayment of loans. This has the potential to increase the cash flow burden on many of
those farmers who are already facing squeezed margins.
In addition, for some financially distressed farmers, their options for addressing these
problems are becoming increasingly constrained by falling demand for dairy farm land and
signs that rural asset values may be falling.
The Government MPI’s Agricultural and Investment Services business unit is supporting work to increase
has introduced farm business resilience by linking farm advisers and accountants with farmers to enable
several initiatives better strategic and financial planning and create effective business cases where required.
to support the The farm debt mediation scheme recognises the pressure debt places on farmers and rural
primary sectors communities. The scheme will help farmers by addressing the power imbalance between
through these farmers and banks and providing a consistent platform for constructive discussions. The aim
upcoming is to improve outcomes for both farmers and banks through early engagement.
challenges. The Productive and Sustainable Land Use package promotes farm land-use practices that
deliver more value and improved environmental outcomes.
10 • MINISTRY FOR PRIMARY INDUSTRIESTop 10 Export Destinations
Dairy Forestry Seafood Other
Meat & Wool Horticulture Arable
China
USA
$14,377m
Japan $4,217m
$2,662m
UK
$1,174m
S. Korea
$1,357m
EU
$3,167m
Hong Kong
Taiwan
$1,087m
$1,155m
Malaysia Australia
$1,000m $4,553m
Dairy Meat & Wool Forestry Other
7,000 34% 4,000 4,000 51% 1,400
33%
6,000 31% 1,200
43%
5,000 3,000 3,000
1,000
4,000 19%
2,000 2,000 800
3,000 14% 13%
400
2,000 1,000 1,000 13% 11%
7% 9% 10%
5% 4% 4% 3% 5% 4% 4% 7% 6% 5% 200 7% 6% 5% 5% 5%
1,000 3% 3% 3% 3% 3% 2% 2% 1% 4% 2% 2% 2% 2% 2% 2% 1%
0 0 0 0
China
Australia
United States
Japan
Malaysia
P{Philippines
Indonesia
UAE
Thailand
Hong Kong
All other
China
United States
EU (excl. UK)
UK
Japan
Australia
Taiwan
Canada
South Korea
Indonesia
All other
China
Australia
South Korea
Japan
India
United States
Indonesia
Thailand
Taiwan
Vietnam
All other
Australia
China
Japan
Hong Kong
Singapore
South Korea
United States
UK
EU (excl. UK)
Canada
All other
Horticulture Seafood Arable All Exports
1,200 800 120 16,000
16% 35%
1,000 100 42% 14,000 31%
13% 13%13% 600 12,000 25%
800 12% 12% 80 10,000
600 9% 400 60 8,000
400 13% 12%12% 12% 40 17% 6,000
4% 10% 9%
3% 3% 200 8% 10% 4,000 7% 6%
200 2% 5% 20 6% 4% 4% 3% 3%
3% 3% 2% 2% 3% 3% 2% 2% 2,000 2% 2% 2%
1%
0 0 0 0
EU (excl. UK)
Australia
Japan
United States
China
UK
Taiwan
South Korea
Canada
Hong Kong
All other
China
United States
EU (excl. UK)
Australia
Japan
Hong Kong
Thailand
South Korea
Canada
Singapore
All other
EU (excl. UK)
Australia
United States
Japan
Switzerland
South Korea
South Africa
Chile
UK
China
All other
China
Australia
United States
EU (excl. UK)
Japan
South Korea
UK
Taiwan
Hong Kong
Malaysia
All other
SOPI DECEMBER 2019 • 11Dairy
New Zealand’s dairy export revenue is forecast to rise 8.4 percent to $19.6 billion for the year ending June
2020. Expectations of another strong production season, combined with robust global dairy prices, and a
weak outlook for the New Zealand dollar, are expected to support solid export revenue growth in the year
ahead. For New Zealand’s dairy farmers, this is expected to translate into higher farmgate milk prices,
supporting robust sector profitability for the season ahead.
Dairy export revenue 2015-21 (NZ$ million) Actual Forecast
Year to 30 June 2015 2016 2017 2018 2019 2020 2021
Whole milk powder 5,385 4,609 5,271 5,818 6,675 6,980 6,460
Butter, AMF, and cream 2,219 2,378 2,794 3,812 3,612 3,530 3,730
Skim milk & butter milk powder 1,762 1,347 1,385 1,228 1,323 1,720 1,630
Casein & protein products 2,129 1,834 1,735 1,601 1,574 1,810 1,740
Cheese 1,557 1,720 1,830 1,905 1,965 2,150 2,140
Infant formula 415 685 778 1,240 1,641 1,900 2,090
Other dairy products* 582 716 845 1,050 1,318 1,550 1,670
Total 14,050 13,289 14,638 16,655 18,107 19,630 19,450
% Change year on year -21.0% -5.4% +10.1% +13.8% +8.7% +8.4% -0.9%
Source: Stats NZ and MPI.
* Other dairy products include: liquid milk and cream, ultra-high temperature milk, yoghurt, and ice cream.
• Dairy production has made a positive start to the 2019/20 Figure 1: Dairy export volume growth has been mixed
season. Mild winter conditions have supported pasture for the first three months of the 2019/20 season
15 6.8% 15.1%
growth which, combined with increased winter milking, 11.8%
have boosted early season production. However spring
5
Expoprt volume (thousand tonnes)
growing conditions have been more variable in
September and October, with below average - 0.4%
- 3.0%
(5)
temperatures and wet conditions across some key - 20.1%
dairying regions. (15)
• This has resulted in total milk solids collections as at (25)
October tracking 0.4 percent higher than at the same
time last year. However, we do not expect production to (35) -39.6%
match the record levels achieved during the December
Whole Milk Powder
Butter & AMF
Liquid Milk & Other Products
Infant Formula
Cheese
Casein
SMP & BMP
2018 quarter and accordingly, are forecasting milk solids
production to be up only 0.2 percent for the 2019/20
season, compared to the previous year.
• Despite the strong start to the season, overall export
volume growth has been relatively mixed for the Change in dairy export volumes: September quarter 2019 compared to the same
September quarter, compared to the same period as last period in previous year.
year. Volume growth for whole milk powder (WMP), Source: Stats NZ.
butter, and liquid milk products were offset by falls in • As a result, global dairy markets have remained
skim milk powder (SMP) and casein products (Figure 1). relatively resilient in the face of slowing global growth
and the ongoing US-China trade dispute. In particular,
• Expectations of relatively flat New Zealand milk solids
despite slowing economic growth in China (the world’s
production growth this season will feed into a global
largest dairy importer) and a weakening in the
dairy supply chain that remains relatively constrained.
purchasing power of its currency, there appears to be
Modest milk production growth in Europe (up
resilience in the China’s household sector which is
0.3 percent) and the US (up 0.1 percent) over the year to
underpinning demand.
date, is being offset by weakness in Australia (down
6.9 percent) so far this season. • This has helped support prices for global dairy
commodities. Despite some initial weakness in dairy
prices for butter and cheese early in the season, Global
Dairy Trade auction prices have subsequently firmed in
September and October, with WMP prices now
3.9 percent higher and SMP prices 18.7 higher than the
start of the season (Figure 2).
12 • MINISTRY FOR PRIMARY INDUSTRIESFigure 2: Global commodity prices have risen since • Given the strong demand from key Asian markets and
September weak international supply growth, we are expecting
GDT Index (5 Nov global dairy markets to remain resilient and supportive
1100 2019) 8.1% higher
than 2018/19 of strong dairy prices over the short term. Combined
season average
with a soft outlook for the NZD, this is expected to
support an 8 percent growth in export revenues for
Global Dairy Trade Index
1000
New Zealand producers to $19.6 billion for the year
ended June 2020. In particular, we expect to see strong
900 GDT Index average
revenue growth in higher added value dairy products
for the 2018/19
Season
such as infant formula (forecast rise of 12.9 percent) and
liquid milk products (forecast rise of 15.1 percent) in the
800 year ahead, driven by continued volume growth into
China.
5/06/2018
3/07/2018
7/08/2018
4/09/2018
2/10/2018
6/11/2018
4/12/2018
2/01/2019
6/02/2019
5/03/2019
2/04/2019
7/05/2019
4/06/2019
2/07/2019
6/08/2019
3/09/2019
1/10/2019
5/11/2019
2018/19 Dairy Season 2019/20 Dairy Season
• These factors should support the profitability for
Global dairy trade index: June 2017 to November 2019. New Zealand’s dairy farmers in the current season.
Source: Global Dairy Trade. We have accordingly adjusted upwards New Zealand’s all
company average milk solids payout forecast (including
• Strong milk solids production supported by robust global
dividend) for the 2019/20 season to $7.25 per kilogram of
prices and a weakening NZD has translated into a
milk solids (Figure 4).
$261 million (8.4 percent) increase in export revenues for
the September quarter compared to the previous year.
Figure 4: Farmgate milk solids price outlook revised
Across our major markets, export growth into China, upwards from previous forecast
Indonesia, and Sri Lanka has been somewhat offset by a
significant fall in exports to the US. 9.00
8.41 Forecast
Farmgate payment (NZ$/kg ms)
7.25
• For China, our largest export destination, exports rose 6.72
7.00
6.36 6.28
9.1 percent to $993 million for the first three months of 6.00
the season, driven by volume growth in butter (up 4.77
4.35
18.3 percent), liquid milk products (up 12.6 percent),
improved prices for infant formula (up 11.2 percent) and 3.00
WMP (up 7.5 percent). However, this has been offset
somewhat by a 40 percent decline in SMP volumes
(Figure 3).
0.00
2014 2015 2016 2017 2018 2019e 2020 2021
Figure 3: Growth in export revenues to China and New Zealand all company average farmgate milk solids payment (including dividend),
Indonesia have been partially offset by declines to the year ended May 2014-21.
US Source: DairyNZ and MPI.
Hong Kong
Thailand
United Arab Emirates
Indonesia
Philippines
Malaysia
Japan
United States
Australia
China
(80) (60) (40) (20) 0 20 40 60 80
Export value (NZ$ million)
Change in dairy export revenues (Top 10 export nations): July-September 2019
compared to 2018.
Source: Stats NZ.
SOPI DECEMBER 2019 • 13ICE CREAM IN
NEW ZEALAND
The retail value of the New Zealand ice cream market is estimated at $419 million in
2019 and is expected to reach $533 million by 2024.
Home ice cream still leads the category, with bulk ice cream enjoying the highest rate of growth,
which totalled 5 percent in 2019. Single portion ice cream enjoyed faster growth compared with this
category in previous years. This was driven by impulsive supermarket and convenience store purchases
during summer, a trend that is expected to continue. Other significant market trends also shaping the
New Zealand industry are listed below.
56% 42%
Take-home Impulse ice
ice cream cream
(bulk dairy, multi- (single portion
pack dairy, ice dairy, single
cream desserts) portion water)
0.9%
Unpackaged
ice cream
KEY TRENDS
0.6%
Shift to premium products and Frozen yogurt
product innovation is driving
value and increased customer
interest.
Growth in health and wellness
product (e.g. with non-dairy, low
calories, high protein benefits).
Asia Pacific is a key export market,
with 42 percent of exports by value in
2018 going to China.
Rise in demand for unique flavors such
as “matcha” to cater specifically to the
Asian population
Mess-free, single-portion formats (cups,
bars) gaining traction as “convenience”
continues to gain importance
Innovation in visual and sensory features
of ice cream to target new social media
and “eat-with-your-eyes” focused
customers
14 • MINISTRY FOR PRIMARY INDUSTRIESKEY TRENDS
New Zealand ice cream exports to China
have experienced dramatic growth in
Global production of the last few years. This leap in growth
11.5 million tonnes in 2018 is in part driven by catering to the China
market demand for unique flavours
(as noted in the key trends).
Global market estimated at
GLOBAL MARKETS
$US77 billion in 2018
ASIA-PACIFIC ICE CREAM EXPORTS
30 China Japan Australia
Global market enjoying
an average growth rate
between 4.1 percent and (000,000)
15
4.9 percent
0
2010 2013 2016 2019
SOPI DECEMBER 2019 • 15Meat and Wool
The outlook for meat and wool exports remains robust with export revenues forecast to reach $10.4 billion for
the year ending June 2020, 2.5 percent higher than the previous year. The positive outlook for the sector is
being driven by high international meat prices as a result of African Swine Fever (ASF) reducing China’s pork
herd, increasing demand for imported protein. Strong schedule prices as a result of international demand
have helped maintain on-farm profitability.
Meat & Wool export revenue 2015-21 (NZ$ million) Actual
Forecast
Year to 30 June 2015 2016 2017 2018 2019 2020 2021
Beef & veal 2,980 3,096 2,706 2,943 3,324 3,560 3,570
Lamb 2,504 2,569 2,441 3,018 3,227 3,280 3,410
Mutton 418 419 417 575 576 560 600
Wool 805 760 522 543 549 490 490
Venison 174 182 162 196 186 180 190
Other meat* 466 503 513 543 610 600 660
Hides & Skins 570 509 416 396 354 330 330
Animal by-products 578 598 587 700 729 770 780
Animal fats & oils 118 125 156 147 115 120 120
Animal products for feed 216 247 273 332 376 400 400
Carpets & other wool products 172 192 163 148 130 130 130
Total 9,000 9,200 8,355 9,542 10,176 10,430 10,680
% Change year on year +10.3% +2.2% -9.2% +14.2% +6.6% +2.5% +2.4%
Source: Stats NZ and MPI.
* Other meat includes: edible offal, processed meat, and poultry.
• The impact of ASF outbreaks in China has changed the Chinese demand for prime cuts and manufacturing beef
face of global protein trade. China is the world’s largest has continued in the early season, creating competition
producer and consumer of pork, home to just over half of with the US, resulting in rising global beef prices.
the world’s pig population. Over 40 percent of China’s pig
herd is estimated to have been lost as a result of the Figure 5: Red meat exports shifting to Asia
disease. This gap in domestic protein production is being 8000
Asia Europe Middle East Oceania and Antarctica The Americas
met by increased imports of all meat products, not only 7000
pork.
6000
Export value (NZ$ million)
• Growing demand from China for New Zealand meat 5000
products as a result of ASF continues to support export 4000
growth and schedule prices. Since September 2017 3000
exports to China have grown from 20.8 percent to 2000
39.9 percent of New Zealand’s total beef and sheep meat 1000
exports (Figure 5). The shift in trade to China can also be 0
2010 2011 2012 2013 2014 2015 2016 2017 2018 2019
seen in an increase in the proportion of Chinese yuan
denominated trade for meat products. From October Beef exports by region 2010-2019, year ended June.
2018 to June 2019, 7.5 percent of beef and sheep meat Source: Stats NZ
trade was denominated in Chinese yuan, compared to
1.6 percent for the same period the previous year. • The changing consumption trend for beef in China
predates ASF as boneless beef exports to China have
• The value of beef and veal exports is surging due to been rising steadily since late 2015. This is alongside a
increased demand from China. Beef and veal exports are rising chilled beef trade to China which has nearly
forecast to reach $3.6 billion for the year ending June doubled in the past year from $32 million to $61 million.
2020, a 7.2 percent increase from the previous year. The
increase in revenue is predominantly driven by prices • New Zealand’s beef herd is expected to remain relatively
that are forecast to increase by 6.8 percent, while static with beef cattle numbers expected to be at
volumes are forecast to remain flat. This growth builds 3.66 million for the year ending June 2020. This is a
off the strong previous season that saw massive spikes 0.5 percent fall from the previous year of 3.68 million.
in demand in China for beef as a result of ASF. Growth in
16 • MINISTRY FOR PRIMARY INDUSTRIES• New Zealand’s sheep meat exports have also continued Figure 7: Schedule prices remain high early in the
to perform well with lamb and mutton exports expected season
to reach $3.3 billion and $560 million respectively for the 900 Cow
Lamb
year ending June 2020. Export quantities are expected to 800
Price (NZ$ per kg carcass weight)
Steers and Heifers
be flat, while prices are expected to increase as a result 700
Mutton
600
of ASF.
500
• The retention of lambs from last season has increased 400
the hogget population while ewe numbers are falling. 300
200
This is forecast to result in 2 percent fewer lambs being
100
born this coming year, assuming a similar lambing rate
0
to last season. Global sheep meat production is also
2011
2012
2013
2014
2015
2016
2017
2018
2019
constrained as Australia’s sheep flock shrinks from
drought creating upward pressure on prices. Schedule prices for steers and heifers, cows, mutton, and lamb: Year ending
December 2011 – 2019
Source: Beef and Lamb NZ
Figure 6: Strong wool export prices remain low while
fine prices remain variable • Schedule prices for livestock are at near record levels
24.00 Less than 24.5 microns
resulting in continued strong on-farm profitability
22.00 (Figure 7). Although a small drop is expected compared
Export price (NZ$/kg) (clean equivalent)
20.00
18.00 to last season as higher on-farm revenues are being
16.00 offset by rising farm expenditure. Beef and Lamb NZ
14.00
12.00 forecast earnings before interest, tax, and managers’
10.00
24.5 to 31.4 microns wages, are expected to be 0.7 percent lower for the year
8.00
6.00
ending June 2020.
4.00
More than 31.4 microns
2.00 • Poultry exports to Australia have been falling as a result
0.00
Mar Jun Sep Dec Mar Jun Sep Dec Mar Jun Sep Dec Mar Jun Sep of Infectious Bursal Disease Virus (IBDV) being
2016 2017 2018 2019
discovered in New Zealand. Last year poultry export
Source: Stats NZ revenue reached $91 million, of which 56 percent went
to Australia. Poultry meat must now be heat treated to
• Wool export revenue is forecast to fall to $490 million for remove the virus before it is exported to Australia, which
the year ending June 2020, an 11 percent decrease from reduces the range of products available to export.
the previous year. Export quantities are expected to
remain stable as a result of the stable sheep flock
looking forward. Strong wool export prices remain low,
whereas fine and mid-micron wool prices remain
variable (Figure 6). This is due to reduced demand from
China as they are exporting fewer clothes and textiles to
the US due to trade tensions.
SOPI DECEMBER 2019 • 17Forestry
Forestry exports for the year ending June 2020 are forecast to fall 12.8 percent to $6.0 billion compared to the
year ended June 2019 when prices and volumes were at record highs. This is $0.2 billion higher than the
September forecast for year ending June 2020 as log prices are recovering more quickly than expected from
their sharp fall over June and July of this year. If prices continue their sharp recovery, export volumes may
increase faster than currently forecast.
Forestry export revenue 2015-2021 ($NZ million) Actual Forecast
Year to 30 June 2015 2016 2017 2018 2019 2020 2021
Logs 2,059 2,224 2,687 3,337 3,806 3,080 3,640
Sawn timber & sleepers 751 860 830 890 936 920 970
Pulp 628 683 651 828 812 640 620
Paper & paperboard 473 522 488 491 491 480 440
Panels 451 512 476 501 514 560 600
Chips 52 64 59 56 67 70 80
Other forestry products* 268 275 290 281 257 250 260
Total 4,683 5,140 5,482 6,382 6,883 6,000 6,600
% Change year on year -9.9% +9.8% +6.7% +16.4% +7.9% -12.8% +10.0%
Source: Stats NZ and MPI.
* Other forest products include: structural or moulded wood, furniture, and prefabricated buildings.
Figure 8: Log prices are beginning to recover
as New Zealand logs they are slowing the export volume
2.5 All Other Destinations China Export Price 180
recovery. However, we are expecting to see volumes
increasing in subsequent years as both small and
Log export volume (million cubic metres)
170
2.0
Export price (NZ$/m3 FOB)
corporate growers respond to the log price recovery by
160
1.5 increasing harvest volumes.
150
1.0 • China’s construction market remains active and there is
140
no sign of decreased demand. Therefore, industry is
0.5
130 expecting export volumes to China to recover over the
next year, but for prices to be slightly lower than recent
0.0 120
Feb May Aug Nov Feb May Aug Nov Feb May Aug levels. However, any increase in shipping costs resulting
2017 2018 2019
from new requirements on the sulphur content of fuels
Log export volumes and prices 2017-2019. from 2020 could slow down the export volume recovery
Source Stats NZ.
by impacting the marginal returns on harvest.
• Forestry exports for the year ended June 2019 reached
• Longer-term, the recent log price drop has underlined
$6.9 billion. Just over half of this value was from log
the importance of increasing domestic processing and
exports, through record high export volumes and prices.
diversifying export markets. Interestingly, the price of
• Log export prices for A grade logs dropped sharply (down wood products has not followed the log price drop, and
11 percent to a low of $138.0/m3 in July due to a build-up demand from other export markets such as Japan, South
of softwood inventories in China following very high log Korea, and India, has remained stable with potential to
export volumes from New Zealand. At the same time, the increase.
supply of logs increased from Europe and Russia. Prices
• Additionally, log exports have grown from 24 percent of
recovered to $143.5/m3 in September (Figure 8), and are
forestry exports in 2009 to 55 percent in 2019 (Figure 9).
expected to continue rising to $155-$165 m3 by the
With 75 percent of New Zealand’s exports going to China,
middle of 2020. This has driven a forecast fall of
forestry is heavily exposed to risks of changing demand
$726 million (nearly 20 percent) for New Zealand log
in this market. The key drivers for this are New Zealand’s
export value for the year ending June 2020.
increased log supply, the increasing log demand from the
• The price recovery during August and September was China’s construction industry and New Zealand’s wood
driven by log inventories at China’s ports declining much processing capacity remaining relatively static over the
quicker than expected. This recovery is unlikely to last decade.
continue over the next few months as sales to China
traditionally slow in January and February. High volumes
of logs from beetle-damaged forests are continuing to
arrive in China from Europe. As these have a similar use
18 • MINISTRY FOR PRIMARY INDUSTRIESFigure 9: Log exports continued to gain proportion of new dwellings consented was 34,804, up 6 percent from
export share until the June 2019 year the June 2018 year. The number of consents is
100 accelerating, with an increase of 20 percent for the
90
September 2019 quarter compared with the same
80
70
quarter in 2018.
Export share (percent)
60
50 Figure 10: Sawn timber production remains robust
40
30 5000
20 4500
4000
Volume (thousand cubic metres)
10
0 3500
2009 2010 2011 2012 2013 2014 2015 2016 2017 2018 2019 3000
Logs Sawn timber Pulp Panels Paper and paperboard Chips 2500
Proportions of Log export volumes and prices 2009-19. 2000
Source Stats NZ. 1500
1000
500
• Exports of pulp, paper, and panels remain steady 0
2006 2007 2008 2009 2010 2011 2012 2013 2014 2015 2016 2017 2018 2019
despite pulp prices decreasing by 15 percent in the last Production Consumption Export Import
12 months (to $766/t from $904/t). The key reasons for
Sawn timber production, consumption, and trade, year ended June 2006-19.
the pulp price drop were increased supply from Brazil to
Source: MPI.
China and a slowdown in China’s paper exports to the
US, due to increased tariffs applied by the US.
• Sawn timber export revenue for the year ended June
2019 increased 5.2 percent to $936 million. Both export
and domestic market demand remains stable (Figure
10). Domestic market demand is expected to increase
due to an increase in the number of new dwelling
consents. In the year ended June 2019, the number of
SOPI DECEMBER 2019 • 19Horticulture
Horticulture sector revenue is forecast to rise 4.7 percent for the year ending June 2020 driven by increases
in kiwifruit, wine, and apple and pear exports. This will push the horticulture sector to the third largest
primary sector industry by value, edging ahead of the forestry sector. Kiwifruit exports are expected to rise by
8.6 percent to $2.5 billion, while wine exports are predicted to rise by 1.8 percent to $1.8 billion, and apple
and pear export revenue to rise by 7.2 percent to $0.9 billion.
Horticulture export revenue 2015-21 (NZ$ million) Actual Forecast
Year to 30 June 2015 2016 2017 2018 2019 2020 2021
Kiwifruit 1,182 1,673 1,664 1,861 2,302 2,500 2,560
Wine 1,408 1,558 1,661 1,694 1,807 1,840 1,840
Apples & pears 571 701 701 745 839 900 910
Fresh & processed vegetables* 588 612 614 622 696 650 660
Other horticulture** 436 456 525 471 466 510 560
Total 4,185 5,000 5,165 5,392 6,111 6,400 6,530
% Change year on year +10.0% +19.5% +3.3% +4.4% +13.3% +4.7% +2.0%
Source: Stats NZ and MPI.
* Fresh vegetable exports include onions, squash, capsicum, potatoes and other fresh vegetables. Processed vegetable exports include frozen vegetables (including frozen potatoes,
peas, sweetcorn, etc.), dried vegetables, dry legumes, prepared and/or preserved vegetables, and vegetable juices.
** Other horticulture exports include: other fresh fruit (including avocados, cherries, blueberries, etc.), frozen and processed fruit, fruit juices, nuts and ornamentals.
Apples and pears apples and pears in the year ended December 2020 are
• The 2019 apple and pear export season is near influenced by:
completion, with new records being set for export − a return to normal production levels in China in 2019;
volumes and prices. Exports are expected to reach − a reduced apple crop in Europe in 2019 due to adverse
395,000 tonnes (21.9 million cartons) and $870 million weather, estimated to be down by 20 percent on the
for the year ending December 2019. Favourable climatic prior year, although production is up in France and
conditions during ripening and harvest helped lift the the Netherlands;
proportion of export-grade fruit. − tariffs on US apple imports into China and India; and
− a slightly lower New Zealand dollar against the US
• Strong demand from Asian markets, in particular China, dollar and Euro compared with the 2019 exporting
driven in part by a reduction in China’s 2018 apple crop season.
by an estimated 25 percent, increased the average
export price to a new high of $39.50 per carton. A lower Figure 11: China’s reduced apple crop provided more
New Zealand dollar also assisted. Asia will account for opportunities for apple exports to Asia in 2019
around 50 percent of New Zealand apple exports in 2019, 250,000
China Thailand Vietnam Taiwan India
up from 40 percent in the prior year. The increased
demand in Asia helped offset lower demand from Europe Hong Kong Rest of Asia
200,000
due to large domestic stocks from the 2018 harvest
(Figure 11).
Export volume (Tonnes)
150,000
• Apple and pear exports are forecast to increase in 2020
and beyond due to trees maturing and the ongoing 100,000
increase in planted area. However, there may be some
downside risk to the 2020 crop forecast once the impacts 50,000
of several localised spring hail events are fully realised.
The lower prices received for Braeburn in 2019 will likely 0
2012 2013 2014 2015 2016 2017 2018 2019 YTD
speed up growers’ timelines for the replacement of
Year ended December
Braeburn with apple varieties in higher consumer
New Zealand apple exports to Asia, 2012-2019.
demand. Orchard replanting and new plantings are
Source: Stats NZ and MPI.
expected to continue, with the total planted area on track
to reach 11,000 hectares by 2021.
• Export revenue for the year ended December 2020 is
forecast to be similar to the 2019 year, with higher export
volumes offset by a slightly lower price forecast of
$38.00 per carton. Price expectations for New Zealand
20 • MINISTRY FOR PRIMARY INDUSTRIESKiwifruit Figure 13: Global kiwifruit exports are dominated
• After emerging from the impact of Psa, the kiwifruit by four countries; southern hemisphere countries
generally supply to the northern hemisphere during
industry is in a period of strong growth. Kiwifruit export
their production off season.
revenue is forecast to grow to $2.5 billion in the year
120
ending March 2020, based on total export volume of Rest of world Chile Iran Italy New Zealand
149 million trays. While this overall volume is forecast to
Export volume (thousand tonnes)
100
be down slightly on the previous season’s crop volume,
80
the balance continues to shift from green (down
14 percent) to gold (up 11 percent). Sustained growth is 60
forecast based on improving prices and maturing Gold3 40
vines further increasing production.
20
Figure 12: Monthly export value for gold kiwifruit, year 0
Jan Feb Mar Apr May Jun Jul Aug Sep Oct Nov Dec
to date (March to September 2017 – 2019)
350
Top 4 Kiwifruit exporting countries by volume, 2018
Source: GTA
300 2017 2018 2019
• As production switches from green varieties to gold, the
250 green producing area is decreasing alongside some
Export value (NZ$ millions)
variability in yields. This season’s green yields are down
200
on the previous year, which were close to the record.
150 Gold yields have climbed steadily for the last three years,
and it is yet to be seen what the long term average yield
100
might be for mature Gold3 orchards.
50
• While the smaller fruit size this season has not reduced
0
prices, larger kiwifruit are generally more highly sought
Mar Apr May Jun Jul Aug Sep in premium markets. As the crop for the coming season
Gold export values up on previous two seasons establishes, growers will be carefully managing vines to
Source: Stats NZ.
maximise value from a balanced yield, fruit size and
• A hot, dry summer produced an early start to the Gold3 taste.
season with increased dry matter and taste, but these
conditions also reduced fruit size. A favourable exchange • Although Gold3 has consistently outperformed Hayward
rate and growing demand has seen prices above those of green kiwifruit in terms of orchard gate return, there are
last season in five out of seven months, despite the opportunities to exploit other segments of the fruit
smaller fruit size, which is a great result given the market with new kiwifruit varieties. The new red kiwifruit
increasing supply. For the March to September year to variety will be available in New Zealand and other
date Gold3 volumes and prices were up 8 and 2 percent international markets, after being well received in a
respectively, resulting in 11 percent more revenue Singapore trial this season. This variety is likely to be
compared to the same point last year (Figure 12). popular in other Asian markets, where the shorter
shipping times make this a more realistic destination
• The tail of the export season sees remaining green than Europe. Earlier maturing varieties such as Sweet
kiwifruit from the reduced crop facing increasing Green enable green fruit to reach the market earlier in
competition from northern hemisphere grown fruit as the season, ensuring longer seasonal supply of
summer production comes on line (Figure 13). New Zealand grown fruit.
SOPI DECEMBER 2019 • 21Wine • The latest Vineyard Benchmarking Report was released
• Wine exports are forecast to reach $1.84 billion in the in August 2019, covering Marlborough vineyard
year ending June 2020, up 1.7 percent from the previous profitability for the vintage harvested in early 2019. The
year. In the September 2019 quarter, export volumes report shows profit before tax of $8,700 per hectare for a
were up 4 percent from the same period last year, 30 hectare vineyard model.
continuing the strong export volume growth seen in the
• This is 13 percent lower than 2018, and the third straight
first half of calendar year 2019.
year of falling returns after an excellent result in 2016.
• Given that the 2019 vintage is down 1.4 percent from the Incomes have fallen slightly as production has slipped,
previous year, it is unlikely this pace can be sustained while working expenses continue to increase.
throughout the current export season. As a result, export
• Production per hectare is the largest source of variability
volumes are expected to rise just 0.5 percent during the
in vineyard income, and is largely out of growers’ control.
year ending June 2020. While export volumes are
After bumper crops in 2014 and 2016, the weather hasn’t
maintained, the reduced vintage will likely result in
been as cooperative, and as a result, yields have fallen.
falling inventories and less New Zealand wine consumed
(Figure15). At the same time, production expenses have
domestically.
increased, rising by 10 percent in the past year alone.
• The main markets driving growth are the US, UK, and
• Increases in the minimum wage are a significant factor,
Europe, with export revenues up 9.5, 15.1, and
contributing to higher labour costs for pruning, canopy/
4.8 percent respectively, in the year to September 2019.
crop management, and other wages. This trend is
Wine sales to the US are expanding again following a lull
expected to continue with further minimum wage rises
in mid-2018. The UK has been a strong market for
scheduled in 2021. Expenditure has also increased on
New Zealand wine over the past year, although exports
electricity, fuel, and fertiliser over the past year.
have slowed in the past few months, possibly due to
uncertainty created by Brexit (Figure 14).
Figure 15: Vineyard profitability hindered by lower
• While wine export revenues from Australia have held yields and rising expenses
constant in recent years, Australia remains our third Income (per hectare) Vineyard working expenses per hectare
$35,000 16
largest export market. Yeild (Tonnes per hectare)
$30,000 14
Figure 14: Wine exports strong to UK and US 12
$25,000
600
Dollars per hectare
Tonnes per hectare
10
$20,000
500
8
$15,000
Export revenue (NZ$ million)
400 6
$10,000
300 4
$5,000 2
200
$0 0
100 2011 2012 2013 2014 2015 2016 2017 2018 2019
Australia United Kingdom United States EU (excl. UK)
0
Vineyard income, expenses, and yields 2011-19.
Jul
Jul
Jul
Jul
Jul
Jan
Jan
Jan
Jan
Jan
Oct
Oct
Oct
Oct
Apr
Apr
Apr
Apr
Apr
Source: MPI and New Zealand Winegrowers.
2015 2016 2017 2018 2019
Wine export revenue by destination (12 month rolling average) 2015-19.
Source: Stats NZ.
Wine production and trade, year ended June 2014-21.
Actual Forecast
2014 2015 2016 2017 2018 2019 2020 2021
Area harvested (hectares) 35,511 35,463 36,226 36,943 38,073 38,680 39,200 39,600
Grape production (metric
tonnes) 445,000 326,000 436,000 396,000 419,000 413,000 431,000 436,000
Wine production (million 320.4 234.7 313.9 285.1 301.7 295.0 310.0 315.0
litres)
Export volume (million litres) 186.2 206.7 211.4 252.2 253.9 269.0 270.5 271.8
Export price (NZ$ per litre) 7.11 6.81 7.37 6.59 6.67 6.70 6.80 6.75
Export revenue (NZ$ million) 1,323 1,408 1,558 1,661 1,694 1,810 1,840 1,840
Source: MPI, New Zealand Winegrowers, Stats NZ.
22 • MINISTRY FOR PRIMARY INDUSTRIESYou can also read