EF METATRADER 5 USER GUIDE FOR THE ONLINE TRADING PLATFORM FOR IOS (IPHONE & IPAD)
←
→
Page content transcription
If your browser does not render page correctly, please read the page content below
User Guide for the online trading
            platform
       EF MetaTrader 5
     for iOS (iPhone & iPad)

                         Euro-Finance
     43 Christopher Columbus blvd., 1592 Sofia, Bulgaria
     tel.: +359 (0) 700 156 56; fax: +359 (0) 2 981 14 96
                   support@eurofinance.bg

                    www.eurofinance.bg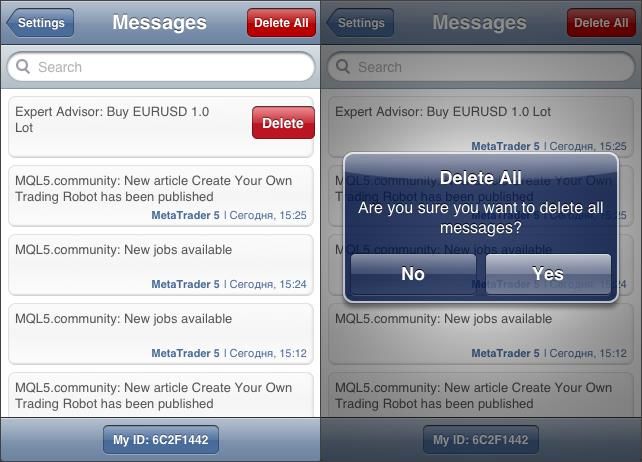
User Guide for EF MT5 iOS platform

                                                                   Contents

I.         Getting Started ......................................................................................................................... 3
II.        Application GUI ......................................................................................................................... 4
III.       Quotes ........................................................................................................................................ 5
IV.        Chart ........................................................................................................................................... 9
V.         Indicators for Technical Analysis ......................................................................................... 10
    1.     Trend Indicators ...................................................................................................................... 13
a)         Average Directional Movement Index .................................................................. 13
b)         Bollinger Bands ................................................................................................... 14
c)         Envelopes............................................................................................................ 15
d)         Ichimoku Kinko Hyo ............................................................................................. 16
e)         Moving Average .................................................................................................. 17
f)         Parabolic SAR ...................................................................................................... 19
g)         Standard Deviation.............................................................................................. 20
    2.     Oscillators ................................................................................................................................ 21
a)         Average True Range ............................................................................................ 22
b)         Bears Power ........................................................................................................ 22
c)         Bulls Power ......................................................................................................... 23
d)         Application.......................................................................................................... 24
e)         Commodity Channel Index ................................................................................... 24
f)         DeMarker............................................................................................................ 26
g)         Force Index ......................................................................................................... 27
h)         MACD ................................................................................................................. 28
j)         Moving Average of Oscillator ............................................................................... 30
k)         Relative Strength Index ....................................................................................... 30
m)         Stochastic Oscillator ............................................................................................ 33
    3.     Volume Indicators .................................................................................................................. 35
a)         Accumulation/Distribution .................................................................................. 35
b)         Money Flow Index ............................................................................................... 36
c)         On Balance Volume ............................................................................................. 37
d)         Volumes .............................................................................................................. 38
    4.     Bill Williams' Indicators ......................................................................................................... 38
a)         Accelerator Oscillator .......................................................................................... 38
b)         Alligator .............................................................................................................. 40
c)         Awesome Oscillator............................................................................................. 41
d)         Fractals ............................................................................................................... 42
e)         Gator Oscillator ................................................................................................... 43
f)         Market Facilitation Index ..................................................................................... 44
VI.        Trading...................................................................................................................................... 45
VII.       Settings ..................................................................................................................................... 68
    1.     Accounts ................................................................................................................................... 69
    2.     Charts ................................................................................................................. 74
    3.     Messages ............................................................................................................ 75
    4.     My ID .................................................................................................................. 78
    5.     Show log ............................................................................................................. 78
VIII.      iPad Version............................................................................................................................. 79
    1.     Interface ................................................................................................................................... 80
    2.     Charts ........................................................................................................................................ 82
    2.1.   Managing Charts .................................................................................................................... 82

www.eurofinance.bg                                                                                                                                       1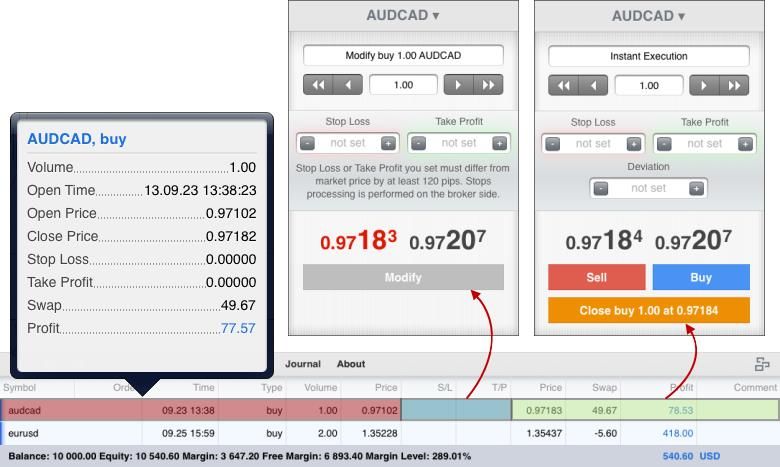
User Guide for EF MT5 iOS platform

  2.2.   One-Click Trading ................................................................................................................... 83
  3.     Toolbox ..................................................................................................................................... 84
  3.1.   Trade ......................................................................................................................................... 84
  3.2.   Orders ....................................................................................................................................... 89
  3.3.   Deals ......................................................................................................................................... 91
  3.4.   Mailbox .................................................................................................................................... 93
  3.5.   News ......................................................................................................................................... 94
  3.6.   Journal ...................................................................................................................................... 96

www.eurofinance.bg                                                                                                                                    2
User Guide for EF MT5 iOS platform
Introduction
The world's most popular forex trading platform MetaTrader 5 is now available for iPhone and iPad
free of charge. With the MetaTrader 5 iOS you can control your account, trade in the
financial markets and use technical indicators for market analysis.
Trading
Real-time quotes of financial instruments
The full set of trade orders, including pending orders
Support of all types of trade execution
Full trading history
Technical analysis
Interactive real-time charts with zoom and scroll options
30 most popular Technical Indicators: Average True Range, Bollinger Bands,
Commodity Channel Index, Envelopes, Force Index, MACD, Momentum, Money Flow
Index, Moving Average, Moving Average of Oscillator, Relative Strength Index,
Standard Deviation, Stochastic Oscillator and Williams' Percent Range, etc.
7 timeframes: M1, M5, M15, M30, H1, H4 and D1
3 types of charts: Bars, Japanese Candlesticks and a Broken Line
Ease of use
User friendly interface
Trade levels and volumes on the chart
Offline mode (prices, charts, current trade positions and the entire trading history)
Minimum traffic
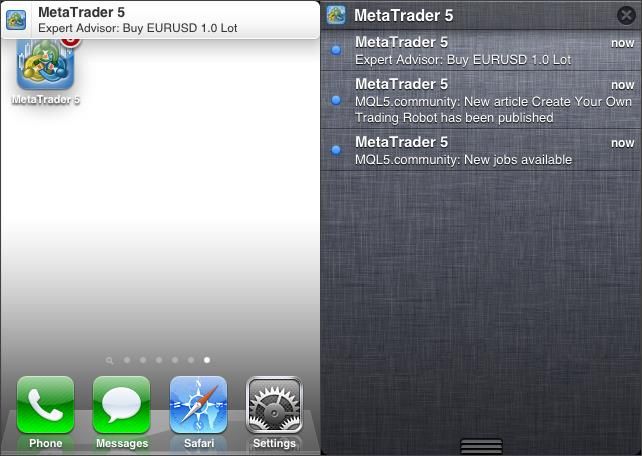
Support for push notifications sent from a desktop client terminal or by the
MQL5.community service; viewing the history of notifications.
Download the MetaTrader 5 iPhone mobile platform to trade in the Forex and other
financial markets from everywhere in the world. The state-of-the-art and most popular
trading platform is now in your pocket.
I. Getting Started
To start trading from on mobile device, download MetaTrader 5 from iTunes or using the
AppStore application on your iPod Touch/iPhone/iPad.
The application runs on the iPhone 3G/3GS/4, iPod
Touch and iPad running iOS 4.0 and above. The
MetaTrader 5 for iPhone requires a cellular network
or Wi-Fi.
After installation, run the application by tapping the
icon on the desktop. This will open the
following window:
The application version number is shown at the
bottom of the window.
It is recommended that you update MetaTrader 5
regularly, which will provide enhanced features and
greater stability.
www.eurofinance.bg 3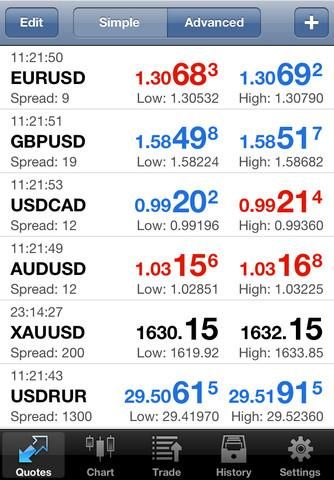
User Guide for EF MT5 iOS platform
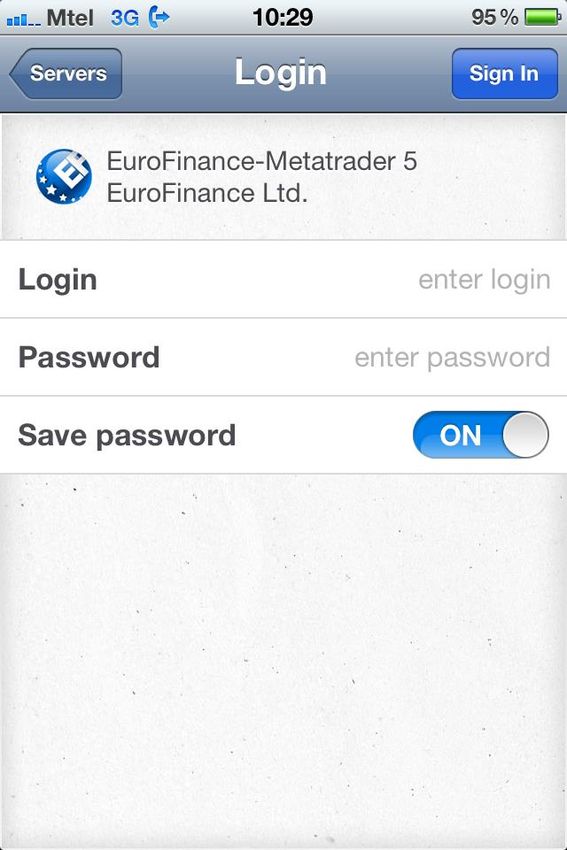
Connect to an Account/Open a Demo Account
During the first start of the application you will be offered the following options:
Login with existing account — select this option if you have an existing account.
Open demo account — select this option if you want to open a new demo account.
Find detailed instructions on how to work
with accounts in a separate section.
II. Application GUI
The whole interface of the MetaTrader 5 mobile platform consists of the main working area
and the bottom panel, designed to switch between the main functions of the program:
Using the bottom panel, you can go to the
following sections:
Quotes — a window with prices of
financial instruments.
Chart — view charts and indicators.
Trade — view the state of account and
manage trade positions and pending
orders.
History — view the history of trade
operations.
Settings — application settings, as well as
opening of accounts and switching
between them.
www.eurofinance.bg 4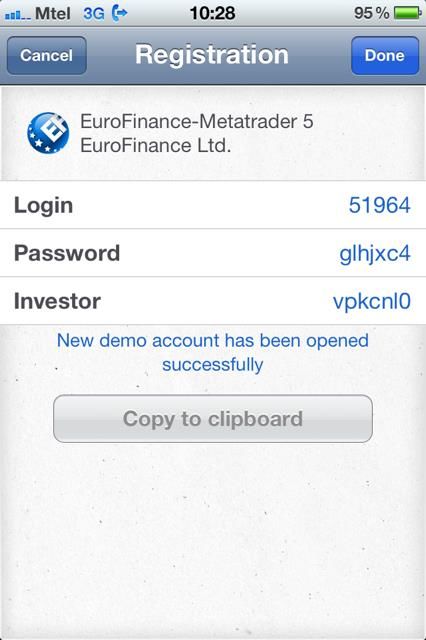
User Guide for EF MT5 iOS platform
III. Quotes
Use this tab to view real-time pricing information on financial instruments. To switch to this
tab, use the bottom panel of the MetaTrader 5 for iPhone.
The following price information is shown here:
name of the financial instrument
the ask price
the bid price
spread
the time of the last quote
the lowest ask price for the current day
(Low)
the highest bid price for the current day
(High)
Information Display Mode
To switch between the full and reduced representation of price information, use buttons
"Simple" and "Advanced" at the top of the screen. In the "Advanced" mode, detailed symbol
information is shown: spreads, time. High and Low prices. In the "Simple" mode only the Bid
and Ask prices are shown.
List of symbols
In order to remove a symbol from the list or change its position, tap "Modify" at the top of
the window. To add a new symbol, tap at the top of the window.
To save traffic, disable unnecessary symbols.
Read more about how to work with the list of symbols in a separate section.
Context Menu
To open the context menu, tap once on any of the symbols. The menu contains the following
commands:
Trade — go to conducting trade operations with the specified symbol. This button is
not displayed when not connected to the server.
Chart — view the chart of the specified symbol.
Properties — open symbol properties.
Cancel — close the context menu.
www.eurofinance.bg 5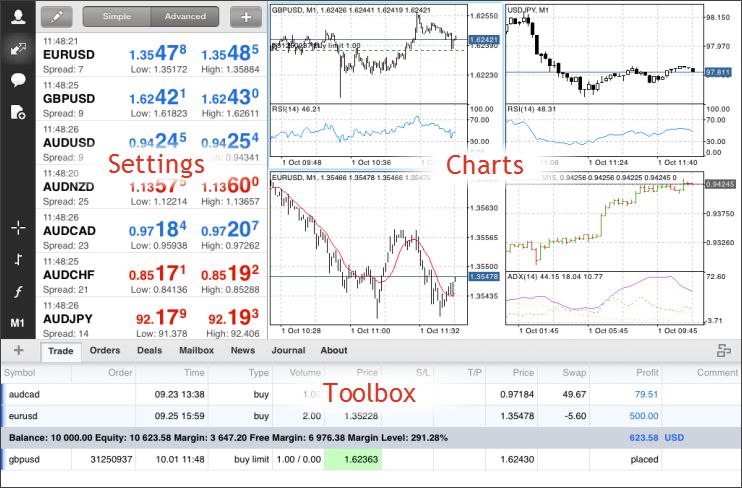
User Guide for EF MT5 iOS platform

List of symbols
This section describes how to manage the set of symbols displayed on the "Quotes" tab. You
can work with these symbols in the MetaTrader 5 for iPhone.

Hiding Symbols

                                          To hide a symbol, go to the edit mode by tapping
                                          "Modify" at the top of the "Quotes" window.

                                          To hide a symbol, tap    against it. Then tap the
                                          "Delete" button that appears.

                                          A financial instrument cannot be hidden, if there
                                          are open positions or pending orders for it, or its
                                          chart is open.

                                          Moving Symbols
                                          To change the symbols display order, enter the
                                          symbols list edit mode by tapping "modify" at the
                                          top of the "Quotes" window. Then tap      on the
                                          desired symbol, and holding it, drag the symbol
                                          to the desired position.
                                          Adding Symbols
                                          To add a new symbol, tap        at the top of the
                                          "Quotes" tab.

Select a group of symbols. To quickly find the desired symbol, use the search bar at the top
of the page. Symbols are filtered as you type in the symbol name.

www.eurofinance.bg                                                                        6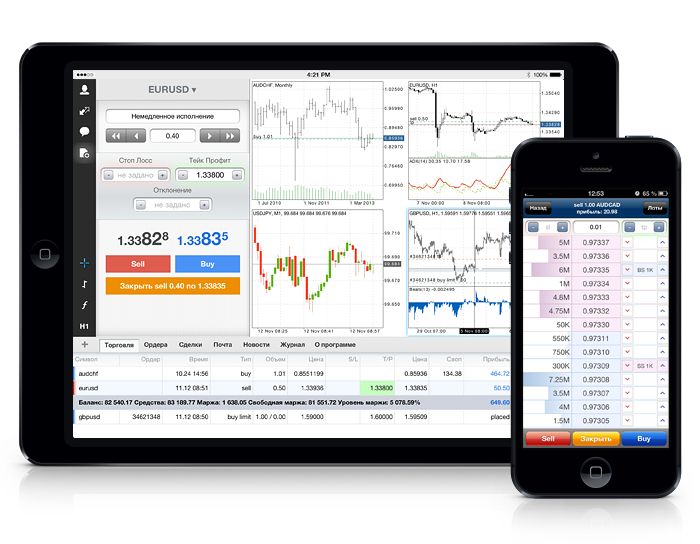
User Guide for EF MT5 iOS platform
To add a symbol, tap against it. When you
are finished, tap "Done".
Symbol Properties
Symbol trading terms are shown in this window. You can go to this window using the
"Settings" command in context menu of the "Quotes" tab.
In the window displays the following set of parameters set by a broker
Symbol name and description —
name of a symbol and its short
description.
Spread — spread in points. If the
spread is floating, then the
appropriate record is specified in
this point (floating).
Digits — number of decimal
places in the price of the symbol.
Stops level — channel of prices (in
points) from the current price,
inside which one can't place Stop
Loss, Take Profit and pending
orders. When placing an order
inside the channel, the server will
return message "Invalid Stops"
and will not accept the order.
Contract size — number of units
of the commodity, currency or
financial asset in one lot.
www.eurofinance.bg 7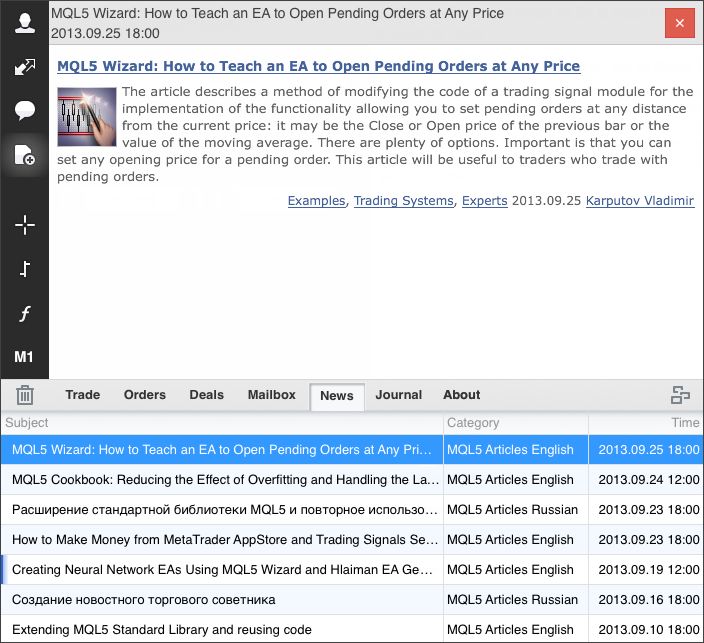
User Guide for EF MT5 iOS platform
Margin currency — currency, in which the margin requirements are calculated.
Profit currency — currency, in which the profit of the symbol trading is calculated.
Calculation — method used to calculate the profit (Forex, CFD, Futures, CFD Index,
CFD Leverage).
Trade — symbol trading mode (full access, long only, short only, close only). Also,
trade can be completely prohibited.
Type of orders — types of orders placed:
Good till today including SL/TP — orders that are valid only during one trading day.
With the end of the day, all levels of Stop Loss and Take Profit, as well as pending
orders are deleted.
Good till canceled — pending orders are preserved as a trade day changes.
Good till today excluding SL/TP — when a trade day changes, only pending orders
are deleted, Stop Loss and Take Profit levels are preserved.
Minimal volume — minimal volume of a deal for the symbol.
Maximal volume — maximal volume of a deal for the symbol.
Volume step — step of volume changes.
Swap type — type of swap calculation:
In points — the specified number of points of the security price.
In the base currency — the specified amount in the base currency of the symbol.
In the margin currency — the specified amount in the symbol margin currency.
In the deposit currency — the specified amount in the deposit currency.
As a percentage of current price — the specified percentage of the symbol price at
the time of calculation of the swap.
As a percentage of the open price — the specified percentage of the position open
price.
In points, re-open at Close price — at the end of the trading day the position is
closed. The next day the position is re-opened at the close price +/- the specified
number of points.
In points, re-open at the Bid price — at the end of the trading day the position is
closed. The next day the position is re-opened at the Bid price +/- the specified
number of points.
Swap long — swap for Buy positions.
Swap short — swap for Sell positions.
3-days swap — day of the week when a triple swap is charged.
The lower part shows information about quoting and trading sessions of the symbol.
Symbol properties have the landscape view mode.
www.eurofinance.bg 8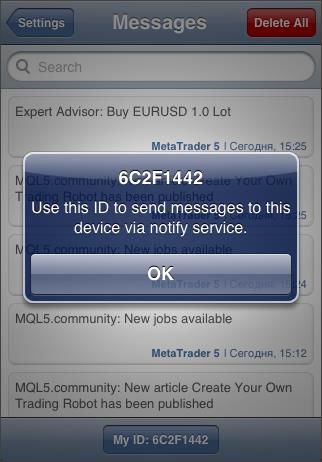
User Guide for EF MT5 iOS platform

IV. Chart
A chart shows price changes over time. You can apply different built-in indicators to a chart
and thus analyze the market. To switch to this tab, use the bottom panel of the MetaTrader
5.

Chart Opening
To open a chart of a financial instrument, run the "Chart" menu command in the "Quotes"
tab.

There is a limit to the depth of price data that can be displayed in the mobile version of the
MetaTrader 5 for iPhone. Depending on your device, you can view 2,000 bars and more. As
soon as the limit has been reached, the "Maximum bars limit" notice appears at the bottom
of the chart.

Chart Timeframes
In the MetaTrader 5 for iPhone, you can view 7 chart timeframes: from 1 minute (M1) to 1
day (D1). You can switch between timeframes in the top panel of the chart. Tap the button
with the current period. This will open the menu to switch to other timeframes:

www.eurofinance.bg                                                                          9
User Guide for EF MT5 iOS platform
Chart Controls
A user can perform the following manipulations on charts:
Scrolling — to scroll through a chart, drag your finger left or right.
Scaling — to zoom in, place two fingers together on the area of the chart you want
to zoom in and then drag your fingers apart. To zoom out, place two fingers on
different parts of the screen and drag them towards each other.
Use of indicators — to add or remove an indicator from a chart, tap at the top
of the chart or use the "Indicators" command of the context menu.
Full-screen mode — the full-screen mode is automatically enabled when you rotate
your device to the landscape mode. Further you can switch between the full screen
and normal mode by tapping on the chart.
Change the chart type — there are three chart types available. To switch between
them, use the following commands that are available at the top of the window:
— Show the chart as a sequence of bars.
— Show the chart as a sequence of Japanese candlesticks.
— Show the chart as a broken line that connects close prices of bars.
Settings — to open chart settings, tap at the top of the window or use the
"Settings" command of the context menu.
Context Menu
The context menu of this tab contains the following commands:
Trade — go to conducting trade operations with the specified symbol. This button is
not displayed when not connected to the server.
Indicators — manage indicators of the current chart.
Settings — open chart settings.
Cancel — close the context menu.
V. Indicators for Technical Analysis
A technical indicator is a mathematical manipulation of a security price and/or volumes
aimed at forecasting future price changes. Decisions about how and when to open or close
positions can be made on the basis of signals from technical indicators. According to their
functional properties, indicators can be divided into two groups: trend indicators and
oscillators. Trend indicators help to assess the price
direction and detect the turn moments
synchronously or with a delay. Oscillators allow to
find the turning points in advance or synchronously.
The MetaTrader 5 for iPhone/iPad provides 30
indicators. They are divided into the following
groups:
Trend Indicators
Oscillators
Volume Indicators
Indicators by Bill Williams
A technical indicator can be drawn in a separate
indicator window with its own vertical scale (for
example, MACD) or applied directly to a price chart
(like Moving Average). Each indicator has a specific
set of parameters.
www.eurofinance.bg 10User Guide for EF MT5 iOS platform Managing Indicators To go to the indicators management page, tap when viewing a chart or use the "Indicators" command of the context menu. Adding Indicators To add an indicator, tap next to the required chart window. If the indicators are applied only on the main chart or not applied at all, the window provides options for adding/removing indicators only for the main chart. If the light is plotted in a separate window (for example, MACD), the window is created automatically. After an additional window has been created, you can add indicators right to it. A tap on opens a where you can select an indicator: Select one of the indicators listed here. A detailed description of all available indicators is available in sections "Trend Indicators", "Oscillators", "Volume Indicators" and "Bill Williams' Indicators". After you select an indicators, its properties window opens. Specify the necessary settings and tap "Done". www.eurofinance.bg 11
User Guide for EF MT5 iOS platform
Removing Indicators
There are several ways to remove an indicator:
Tap the Modify button in the upper right corner. To remove an indicator, tap to
delete an additional window, tap .
Drag your finger from left to right on the indicator line. To remove an indicator, use
the "Delete" button that appears.
Modifying Indicators
To change the parameters of an indicator, tap on it in the "Indicators" window.
Settings of Indicators
Each indicator has a specific set of parameters.
One of the common parameters is "Apply to".
Indicators can be plotted based on price data
and derivatives thereof (Median Price, Typical
Price, Weighted Close), as well as on the basis
of other indicators. For example, a Moving
Average can be constructed based on MACD
values. To do this, first plot the MACD
indicator, and then in its window add MA,
selecting in the "Apply to" field of its settings
the "Previous indicator's data" option. If you
select "First indicator's data", MA will be
constructed on the basis of the very first
indicator, which is not necessarily the MACD.
Nine variants of indicator construction are
available:
Close — based on close prices.
Open — based on open prices.
www.eurofinance.bg 12User Guide for EF MT5 iOS platform
High — based on High prices.
Low — based on Low prices.
Median Price (HL/2) — based on the median price: (High + Low)/2.
Typical Price (HLC/3) — based on the typical price: (High + Low + Close)/3.
Weighted Close (HLCC/4) — based on the average weighted close price: (High + Low
+ 2*Close)/4.
First indicator's data — based on the values of the first applied indicator. The option
of using the data of the first indicator is only available for indicators in a separate
window, because in the main chart window the first indicator is the price.
Previous indicator's data — based on the values of the previous indicator.
In addition to this parameter, you can set the Period, Method, Shift and many other
parameters of indicators.
1. Trend Indicators
Trend indicators are used for detecting trends in financial markets. Indicators of these group
are inefficient in periods of flat. Trend indicators point to the price movement direction.
The MetaTrader 5 for iPhone provides the following trend indicators:
Average Directional Movement Index
Bollinger Bands
Envelopes
Ichimoku Kinko Hyo
Moving Average
Parabolic SAR
Standard Deviation
a) Average Directional Movement Index
Average Directional Movement Index Technical Indicator (ADX) helps to determine if there is
a price trend. It was developed and described in detail by Welles Wilder in his book "New
concepts in technical trading systems".
The simplest trading method based on the system of directional movement implies
comparison of two direction indicators: the 14-period +DI one and the 14-period -DI. To do
this, one either puts the charts of indicators one on top of the other, or +DI is subtracted
from -DI. W. Wilder recommends buying when +DI is higher than -DI, and selling when +DI
sinks lower than -DI.
To these simple commercial rules Wells Wilder added "a rule of points of extremum". It is
used to eliminate false signals and decrease the number of deals. According to the principle
of points of extremum, the "point of extremum" is the point when +DI and -DI cross each
other. If +DI raises higher than -DI, this point will be the maximum price of the day when
they cross. If +DI is lower than -DI, this point will be the minimum price of the day they cross.
The point of extremum is used then as the market entry level. Thus, after the signal to buy
(+DI is higher than -DI) one must wait till the price has exceeded the point of extremum, and
only then buy. However, if the price fails to exceed the level of the point of extremum, one
should retain the short position.
www.eurofinance.bg 13User Guide for EF MT5 iOS platform
Calculation
ADX = SUM ((+DI - (-DI)) / (+DI + (-DI)), N) / N
Where:
N — the number of periods used in the calculation;
SUM (..., N) — sum for N periods;
+DI — value of the indicator of the positive price movement (positive directional index);
-DI — value of the indicator of the negative price movement (negative directional index).
b) Bollinger Bands
The Bollinger Bands Technical Indicator (BB) is similar to Envelopes. The only difference is
that the bands of Envelopes are plotted a fixed distance (%) away from the moving average,
while the Bollinger Bands are plotted a certain number of standard deviations away from it.
Standard deviation is a measure of volatility, therefore Bollinger Bands adjust themselves to
the market conditions. When the markets become more volatile, the bands widen and they
contract during less volatile periods.
Bollinger Bands are usually plotted on the price chart, but they can be also added to the
indicator chart. Just like in case of the Envelopes, the interpretation of the Bollinger Bands is
based on the fact that the prices tend to remain in between the top and the bottom line of
the bands. A distinctive feature of the Bollinger Band indicator is its variable width due to
the volatility of prices. In periods of considerable price changes (i.e. of high volatility) the
bands widen leaving a lot of room to the prices to move in. During standstill periods, or the
periods of low volatility the band contracts keeping the prices within their limits..
The following traits are particular to the Bollinger Band:
1. abrupt changes in prices tend to happen after the band has contracted due to
decrease of volatility;
2. if prices break through the upper band, a continuation of the current trend is to be
expected;
3. if the pikes and hollows outside the band are followed by pikes and hollows inside
the band, a reverse of trend may occur;
4. the price movement that has started from one of the band’s lines usually reaches
the opposite one.
The last observation is useful for forecasting price guideposts.
www.eurofinance.bg 14User Guide for EF MT5 iOS platform Calculation Bollinger bands are formed by three lines. The middle line (ML) is a usual Moving Average. ML = SUM (CLOSE, N) / N = SMA (CLOSE, N) The top line (TL) is the same as the middle line a certain number of standard deviations (D). TL = ML + (D * StdDev) The bottom line (BL) is the middle line shifted down by the same number of standard deviations. BL = ML - (D * StdDev) Where: SUM (..., N) — sum for N periods; CLOSE — close price; N — number of periods used in calculation; SMA — Simple Moving Average; SQRT — square root; StdDev — standard deviation: StdDev = SQRT (SUM ((CLOSE — SMA (CLOSE, N))^2, N)/N) It is recommended to use 20-period Simple Moving Average as the middle line, and plot top and bottom lines two standard deviations away from it. Besides, moving averages of less than 10 periods are of little effect. c) Envelopes The Envelopes Technical Indicator is formed with two Moving Averages, one of which is shifted upward and another one is shifted downward. The selection of optimum relative number of band margins shifting is determined with the market volatility: the higher the latter is, the stronger the shift is. Envelopes define the upper and the lower margins of the price range. Signal to sell appears when the price reaches the upper margin of the band; signal to buy appears when the price reaches the lower margin. The logic behind envelopes is that overzealous buyers and sellers push the price to the extremes (i.e., the upper and lower bands), at which point the prices often stabilize by moving to more realistic levels. This is similar to the interpretation of Bollinger Bands (BB). www.eurofinance.bg 15
User Guide for EF MT5 iOS platform
Calculation
UPPER BAND = SMA (CLOSE, N) * [1 + K / 1000]
LOWER BAND = SMA (CLOSE, N) * [1 - K / 1000]
Where:
UPPER BAND — upper line of the indicator;
LOWER BAND — lower line of the indicator;
SMA — Simple Moving Average;
CLOSE — close price;
N — period of averaging;
K / 1000 — the value of shifting from the average (measured in basis points).
d) Ichimoku Kinko Hyo
Ichimoku Kinko Hyo Technical Indicator is predefined to characterize the market Trend,
Support and Resistance Levels, and to generate signals of buying and selling. This indicator
works best at weekly and daily charts.
When defining the dimension of parameters, four time intervals of different length are used.
The values of individual lines composing this indicator are based on these intervals:
Tenkan-sen shows the average price value during the first time interval defined as
the sum of maximum and minimum within this time, divided by two;
Kijun-sen shows the average price value during the second time interval;
Senkou Span A shows the middle of the distance between two previous lines shifted
forwards by the value of the second time interval;
Senkou Span B shows the average price value during the third time interval shifted
forwards by the value of the second time interval.
Chinkou Span shows the closing price of the current candle shifted backwards by the value
of the second time interval. The distance between the Senkou lines is hatched with another
color and called "cloud". If the price is between these lines, the market should be considered
as non-trend, and then the cloud margins form the support and resistance levels.
If the price is above the cloud, its upper line forms the first support level, and the
second line forms the second support level;
If the price is below cloud, the lower line forms the first resistance level, and the
upper one forms the second level;
www.eurofinance.bg 16User Guide for EF MT5 iOS platform
If the Chinkou Span line traverses the price chart in the bottom-up direction it is
signal to buy. If the Chinkou Span line traverses the price chart in the top-down
direction it is signal to sell.
Kijun-sen is used as an indicator of the market movement. If the price is higher than this
indicator, the prices will probably continue to increase. When the price traverses this line
the further trend changing is possible. Another kind of using the Kijun-sen is giving signals.
Signal to buy is generated when the Tenkan-sen line traverses the Kijun-sen in the bottom-
up direction. Top-down direction is the signal to sell. Tenkan-sen is used as an indicator of
the market trend. If this line increases or decreases, the trend exists. When it goes
horizontally, it means that the market has come into the channel.
e) Moving Average
The Moving Average Technical Indicator shows the mean instrument price value for a certain
period of time. When one calculates the moving average, one averages out the instrument
price for this time period. As the price changes, its moving average either increases, or
decreases.
There are four different types of moving averages: Simple (also referred to as Arithmetic),
Exponential, Smoothed and Weighred. Moving Average may be calculated for any sequential
data set, including opening and closing prices, highest and lowest prices, trading volume or
any other indicators. It is often the case when double moving averages are used.
The only thing where moving averages of different types diverge considerably from each
other, is when weight coefficients, which are assigned to the latest data, are different. In
case we are talking of Simple Moving Average, all prices of the time period in question, are
equal in value. Exponential Moving Average and Linear Weighted Moving Average attach
more value to the latest prices.
The most common way to interpreting the price moving average is to compare its dynamics
to the price action. When the instrument price rises above its moving average, a buy signal
appears, if the price falls below its moving average, what we have is a sell signal.
This trading system, which is based on the moving average, is not designed to provide
entrance into the market right in its lowest point, and its exit right on the peak. It allows to
act according to the following trend: to buy soon after the prices reach the bottom, and to
sell soon after the prices have reached their peak.
Moving averages may also be applied to indicators. That is where the interpretation of
indicator moving averages is similar to the interpretation of price moving averages: if the
indicator rises above its moving average, that means that the ascending indicator movement
is likely to continue: if the indicator falls below its moving average, this means that it is likely
to continue going downward.
Here are the types of moving averages on the chart:
Simple Moving Average (SMA)
Exponential Moving Average (EMA)
Smoothed Moving Average (SMMA)
Linear Weighted Moving Average (LWMA)
www.eurofinance.bg 17User Guide for EF MT5 iOS platform Calculation: Simple Moving Average (SMA) Simple, in other words, arithmetical moving average is calculated by summing up the prices of instrument closure over a certain number of single periods (for instance, 12 hours). This value is then divided by the number of such periods. SMA = SUM (CLOSE (i), N) / N Where: SUM — sum; CLOSE (i) — current period close price; N — number of calculation periods. Exponential Moving Average (EMA) Exponentially smoothed moving average is calculated by adding of a certain share of the current closing price to the previous value of the moving average. With exponentially smoothed moving averages, the latest close prices are of more value. P-percent exponential moving average will look like: EMA = (CLOSE (i) * P) + (EMA (i - 1) * (1 - P)) Where: CLOSE (i) — current period close price; EMA (i - 1) — value of the Moving Average of a preceding period; P — the percentage of using the price value. Smoothed Moving Average (SMMA) The first value of this smoothed moving average is calculated as the simple moving average (SMA): SUM1 = SUM (CLOSE (i), N) SMMA1 = SUM1 / N The second moving average is calculated according to this formula: SMMA (i) = (SMMA1*(N-1) + CLOSE (i)) / N Succeeding moving averages are calculated according to the below formula: PREVSUM = SMMA (i - 1) * N SMMA (i) = (PREVSUM - SMMA (i - 1) + CLOSE (i)) / N www.eurofinance.bg 18
User Guide for EF MT5 iOS platform

Where:
SUM — sum;
SUM1 — total sum of closing prices for N periods; it is counted from the previous bar;
PREVSUM — smoothed sum of the previous bar;
SMMA (i-1) — smoothed moving average of the previous bar;
SMMA (i) — smoothed moving average of the current bar (except for the first one);
CLOSE (i) — current close price;
N — smoothing period.
After arithmetic conversions the formula can be simplified:
SMMA (i) = (SMMA (i - 1) * (N - 1) + CLOSE (i)) / N

Linear Weighted Moving Average (LWMA)
In the case of weighted moving average, the latest data is of more value than more early
data. Weighted moving average is calculated by multiplying each one of the closing prices
within the considered series, by a certain weight coefficient:
LWMA = SUM (CLOSE (i) * i, N) / SUM (i, N)
Where:
SUM — sum;
CLOSE(i) — current close price;
SUM (i, N) — total sum of weight coefficients;
N — smoothing period.

f) Parabolic SAR
Parabolic SAR Technical Indicator was developed for analyzing the trending markets. The
indicator is constructed on the price chart. This indicator is similar to Moving Average with
the only difference that Parabolic SAR moves with higher acceleration and may change its
position in terms of the price. The indicator is below the prices on the bull market (Up
Trend), when the market is bearish (Down Trend), it is above the prices.
If the price crosses Parabolic SAR lines, the indicator turns, and its further values are situated
on the other side of the price. When such an indicator turn does take place, the maximum or
the minimum price for the previous period would serve as the starting point. When the
indicator makes a turn, it gives a signal of the trend end (correction stage or flat), or of its
turn.
The Parabolic SAR is an outstanding indicator for providing exit points. Long positions should
be closed when the price sinks below the SAR line, hort positions should be closed when the
price rises above the SAR line. It means one should trace the movement of Parabolic SAR
and hold open positions only in the direction of this movement. It is often the case that the
indicator serves as a trailing stop line.
If the long position is open (i.e., the price is above the SAR line), the Parabolic SAR line will
go up, regardless of what direction the prices take. The length of the SAR line movement
depends on the scale of the price movement.

www.eurofinance.bg                                                                             19
User Guide for EF MT5 iOS platform
Calculation
For long positions:
SAR (i) = SAR (i - 1) + ACCELERATION * (HIGH (i - 1) - SAR (i - 1))
For short positions:
SAR (i) = SAR (i - 1) + ACCELERATION * (LOW (i - 1) - SAR (i - 1))
Where:
SAR (i - 1) — value of Parabolic SAR on the previous bar;
ACCELERATION — acceleration factor;
HIGH (i - 1) — maximal price for the previous period;
LOW (i - 1) — minimal price for the previous period.
The indicator value increases if the price of the current bar is higher than previous bullish
and vice versa. The acceleration factor (ACCELERATION) will double at the same time, which
would cause Parabolic SAR and the price to come together. In other words, the faster the
price grows or sinks, the faster the indicator approaches the price.
g) Standard Deviation
Standard Deviation is the value of the market volatility measurement. This indicator
describes the range of price fluctuations relative to Moving Average. So, if the value of this
indicator is high, the market is volatile, and prices of bars are rather spread relative to the
moving average. If the indicator value is low, the market can described as having a low
volatility, and prices of bars are rather close to the moving average.
Normally, this indicator is used as a constituent of other indicators. Thus, when calculating
Bollinger Bands one has to add the symbol standard deviation value to its moving average.
The market behavior represents the interchange of high trading activity and languid market.
So, the indicator can be interpreted easily:
if its value is too low, i.e., the market is absolutely inactive, it makes sense to expect
a spike soon;
otherwise, if it is extremely high, it most probably means that activity will decline
soon.
www.eurofinance.bg 20User Guide for EF MT5 iOS platform
Calculation
StdDev (i) = SQRT (AMOUNT (j = i - N, i) / N)
AMOUNT (j = i - N, i) = SUM ((ApPRICE (j) - MA (ApPRICE , N, i)) ^ 2)
Where:
StdDev (i) — Standard Deviation of the current bar;
SQRT — square root;
AMOUNT(j = i - N, i) — sum of squares from j = i - N to i;
N — smoothing period;
ApPRICE (j) — applied price of the j bar;
MA (ApPRICE , N, i) — moving average value with the N period on the current bar;
ApPRICE (i) — applied price of the current bar.
2. Oscillators
Oscillators show price deviation from its average value. Oscillators help to predict the
approaching correction or the direction of price oscillation phase. Oscillators best suit the
purpose of decision making when there is no vivid trend in the market.
The following oscillators are available in the MetaTrader 5 for iPhone:
Average True Range
Bears Power
Bulls Power
Commodity Channel Index
DeMarker
Force Index
MACD
Momentum
Moving Average of Oscillator
Relative Strength Index
Relative Vigor Index
Stochastic Oscillator
Williams' Percent Range
www.eurofinance.bg 21User Guide for EF MT5 iOS platform
a) Average True Range
Average True Range (ATR) is an indicator that shows volatility of the market. It was
introduced by Welles Wilder in his book "New concepts in technical trading systems". This
indicator has been used as a component of numerous other indicators and trading systems
ever since.
Average True Range can often reach a high value at the bottom of the market after a sheer
fall in prices occasioned by panic selling. Low values of the indicator are typical for the
periods of sideways movement of long duration which happen at the top of the market and
during consolidation. Average True Range can be interpreted according to the same
principles as other volatility indicators. The principle of forecasting based on this indicator
can be worded the following way: the higher the value of the indicator, the higher the
probability of a trend change; the lower the indicator’s value, the weaker the trend’s
movement is.
Calculation
True Range is the greatest of the following three values:
difference between the current maximum and minimum (high and low);
difference between the previous closing price and the current maximum;
difference between the previous closing price and the current minimum.
The indicator of Average True Range is a moving average of values of the true range.
b) Bears Power
Everyday trading represents a battle of buyers ("Bulls") pushing prices up and sellers
("Bears") pushing prices down. Depending on what party scores off, the day will end with a
price that is higher or lower than that of the previous day. Intermediate results, first of all
the highest and lowest price, allow to judge about how the battle was developing during the
day.
It is very important to be able to estimate the Bears Power balance since changes in this
balance initially signalize about possible trend reversal. This task can be solved using the
Bears Power oscillator developed by Alexander Elder and and described in his book titled
Trading for a Living. Elder based on the following premises when deducing this oscillator:
moving average is a price agreement between sellers and buyers for a certain period
of time,
the lowest price displays the maximum sellers' power within the day.
On these premises, Elder developed Bears Power as the difference between the lowest price
and 13-period exponential moving average (LOW - EMA).
www.eurofinance.bg 22User Guide for EF MT5 iOS platform
Application
This indicator is better to use together with a trend indicator (most frequently Moving
Average):
if trend indicator is up-directed and the Bears Power index is below zero, but
growing, it is a signal to buy;
it is desirable that, in this case, the divergence of bases were being formed in the
indicator chart.
Calculation
The first stage of this indicator calculation is calculation of the exponential moving average
(as a rule, it is recommended to use the 13-period EMA).
BEARS = LOW - EMA
Where:
BEARS — Bears' Power;
LOW — the lowest price of the current bar;
EMA — Exponential Moving Average.
In the down-trend, LOW is lower than EMA, so the Bears Power is below zero and histogram
is located below zero line. If LOW rises above EMA when prices grow, the Bears Power
becomes above zero and its histogram rises above zero line
c) Bulls Power
Everyday trading represents a battle of buyers ("Bulls") pushing prices up and sellers
("Bears") pushing prices down. Depending on what party scores off, the day will end with a
price that is higher or lower than that of the previous day. Intermediate results, first of all
the highest and lowest price, allow to judge about how the battle was developing during the
day.
It is very important to be able to estimate the Bulls Power balance since changes in this
balance initially signalize about possible trend reversal. This task can be solved using the
Bulls Power oscillator developed by Alexander Elder and and described in his book titled
Trading for a Living. Elder based on the following premises when deducing this oscillator:
moving average is a price agreement between sellers and buyers for a certain period
of time,
the highest price displays the maximum buyers' power within the day.
www.eurofinance.bg 23User Guide for EF MT5 iOS platform
On these premises, Elder developed Bulls Power as the difference between the highest price
and 13-period exponential moving average (HIGH - EMA).
d) Application
This indicator is better to use together with a trend indicator (most frequently Moving
Average):
if trend indicator is down-directed and the Bulls Power index is above zero, but
falling, it is a signal to sell;
it is desirable that, in this case, the divergence of peaks were being formed in the
indicator chart.
Calculation
The first stage of this indicator calculation is calculation of the exponential moving average
(as a rule, it is recommended to use the 13-period EMA).
BULLS = HIGH - EMA
Where:
BULLS — Bulls' Power;
HIGH — the highest price of the current bar;
EMA — Exponential Moving Average.
In the up-trend, HIGH is higher than EMA, so the Bulls Power is above zero and histogram is
located above zero line. If HIGH falls under EMA when prices fall, the Bulls Power becomes
below zero and its histogram falls under zero line.
e) Commodity Channel Index
Commodity Channel Index (CCI) measures the deviation of the commodity price from its
average statistical price. High values of the index point out that the price is unusually high
being compared with the average one, and low values show that the price is too low. In spite
of its name, the Commodity Channel Index can be applied for any financial instrument, and
not only for the wares.
There are two basic techniques of using Commodity Channel Index:
1. Finding the divergences
The divergence appears when the price reaches a new maximum, and Commodity
Channel Index can not grow above the previous maximums. This classical divergence
is normally followed by the price correction.
2. As an indicator of overbuying/overselling
Commodity Channel Index usually varies in the range of ±100. Values above +100
www.eurofinance.bg 24User Guide for EF MT5 iOS platform
inform about overbuying state (and about a probability of correcting decay), and the
values below 100 inform about the overselling state (and about a probability of
correcting increase).
Calculation
1. To find a Typical Price. You need to add the HIGH, the LOW, and the CLOSE prices of
each bar and then divide the result by 3:
TP = (HIGH + LOW + CLOSE) / 3
2. To calculate the n-period Simple Moving Average of Typical Prices:
SMA (TP, N) = SUM (TP, N) / N
3. To subtract the received SMA(TP, N) from Typical Prices of each of preceding n
periods:
D = TP - SMA (TP, N)
4. To calculate the n-period Simple Moving Average of absolute D values:
SMA (D, N) = SUM (D, N) / N
5. To multiply the received SMA(D, N) by 0,015:
M = SMA (D, N) * 0,015
6. To divide M by D:
CCI = M / D
Where:
HIGH — maximal bar price;
LOW — minimal bar price;
CLOSE — close price;
SMA — Simple Moving Average;
SUM — sum;
N — number of periods used for calculation.
www.eurofinance.bg 25User Guide for EF MT5 iOS platform f) DeMarker Demarker Technical Indicator (DeM) is based on the comparison of the period maximum with the previous period maximum. If the current period (bar) maximum is higher, the respective difference between the two will be registered. If the current maximum is lower or equaling the maximum of the previous period, the naught value will be registered. The differences received for N periods are then summarized. The received value is used as the numerator of the DeMarker and will be divided by the same value plus the sum of differences between the price minima of the previous and the current periods (bars). If the current price minimum is greater than that of the previous bar, the naught value will be registered. When the indicator falls below 30, the bullish price reversal should be expected. When the indicator rises above 70, the bearish price reversal should be expected. If you use periods of longer duration, when calculating the indicator, you’ll be able to catch the long term market tendency. Indicators based on short periods let you enter the market at the point of the least risk and plan the time of transaction so that it falls in with the major trend. Calculation The value of the DeMarker for the "i" interval is calculated as follows: DeMax (i) is calculated. If HIGH (i) > HIGH (i - 1), then: DeMax (i) = HIGH (i) - HIGH (i - 1) otherwise DeMax (i) = 0 DeMin (i) is calculated. If LOW (i) < LOW (i - 1), then: DeMin (i) = LOW (i - 1) - LOW (i) otherwise DeMin (i) = 0 The value of the DeMarker is calculated as: DMark (i) = SMA (DeMax, N) / (SMA (DeMax, N) + SMA (DeMin, N)) Where: HIGH (i) — the highest price of the current bar; LOW (i) — the lowest price of the current bar; HIGH (i - 1) — the highest price of the previous bar; LOW (i - 1) — the lowest price of the previous bar; SMA — Simple Moving Average; N — number of periods used for calculation. www.eurofinance.bg 26
User Guide for EF MT5 iOS platform
g) Force Index
The Force Index Technical Indicator was developed by Alexander Elder. This index measures
the Bulls Power at each increase, and the Bulls Power at each decrease. It connects the basic
elements of market information: price trend, its drops, and volumes of transactions. This
index can be used as it is, but it is better to approximate it with the help of Moving Average.
Approximation with the help a short moving average (the author proposes to use 2 intervals)
contributes to finding the best opportunity to open and close positions. If the
approximations is made with long moving average (period 13), the index shows the trends
and their changes.
It is better to buy when the forces become minus (fall below zero) in the period of
indicator increasing tendency;
The force index signalizes the continuation of the increasing tendency when it
increases to the new peak;
The signal to sell comes when the index becomes positive during the decreasing
tendency;
The force index signalizes the Bears' Power and continuation of the decreasing
tendency when the index falls to the new depth;
If price changes do not correlate to the corresponding changes in volume, the force
indicator stays on one level, which tells you the trend is going to change soon.
Calculation
The force of every market movement is characterized by its direction, scale and volume. If
the closing price of the current bar is higher than the preceding bar, the force is positive. If
the current closing price if lower than the preceding one, the force is negative. The greater
the difference in prices is, the greater the force is. The greater the transaction volume is, the
greater the force is..
FORCE INDEX (i) = VOLUME (i) * ((MA (ApPRICE, N, i) - MA (ApPRICE, N, i-1))
Where:
FORCE INDEX (i) — Force Index of the current bar;
VOLUME (i) — volume of the current bar;
MA (ApPRICE, N, i) — any Moving Average of the current bar for N periods:
Simple, Exponential, Weighted or Smoothed;
ApPRICE — applied price;
N — period of smoothing;
MA (ApPRICE, N, i-1) — any Moving Average of the previous bar.
www.eurofinance.bg 27User Guide for EF MT5 iOS platform h) MACD Moving Average Convergence/Divergence (MACD) is the next trend-following dynamic indicator. It indicates the correlation between two Moving Averages of a price. The Moving Average Convergence/Divergence (MACD) Technical Indicator is the difference between a 26-period and 12-period Exponential moving averages (EMA). In order to clearly show buy/sell opportunities, a so-called signal line (9-period moving average of the indicator) is plotted on the MACD chart. The MACD proves most effective in wide-swinging trading markets. There are three popular ways to use the Moving Average Convergence/Divergence: crossovers, overbought/oversold conditions, and divergences. Crossovers The basic MACD trading rule is to sell when the MACD falls below its signal line. Similarly, a buy signal occurs when the Moving Average Convergence/Divergence rises above its signal line. It is also popular to buy/sell when the MACD goes above/below zero. Overbought/Oversold Conditions The MACD is also useful as an overbought/oversold indicator. When the shorter moving average pulls away dramatically from the longer moving average (i.e., the MACD rises), it is likely that the security price is overextending and will soon return to more realistic levels. Divergence An indication that an end to the current trend may be near occurs when the MACD diverges from the security. A bullish divergence occurs when the Moving Average Convergence/Divergence indicator is making new highs while prices fail to reach new highs. A bearish divergence occurs when the MACD is making new lows while prices fail to reach new lows. Both of these divergences are most significant when they occur at relatively overbought/oversold levels. Calculation The MACD is calculated by subtracting the value of a 26-period exponential moving average from a 12-period exponential moving average. A 9-period dotted simple moving average of the MACD (the signal line) is then plotted on top of the MACD. MACD = EMA(CLOSE, 12) - EMA(CLOSE, 26) www.eurofinance.bg 28
User Guide for EF MT5 iOS platform
SIGNAL = SMA(MACD, 9)
Where:
EMA — Exponential Moving Average;
SMA — Simple Moving Average;
SIGNAL — the signal line of the indicator.
i) Momentum
The Momentum Technical Indicator measures the amount that a security’s price has
changed over a given time span. There are basically two ways to use the Momentum
indicator:
As a trend-following indicator analogous to Moving Average Convergence/Divergence
(MACD). In this case a signal to buy occurs if the Momentum indicator makes up a
trough and starts rising; a signal to sell occurs when it reaches peak and turns down.
You may want to plot a short-term moving average of the indicator to determine when
it is bottoming or peaking.
Extremely high or low values of Momentum imply continuation of the current trend.
Thus if the indicator reaches extremely high values and then turns down, the further
price growth should be expected. In any case, a position should be opened or closed
only after prices confirm the signal generated by the indicator.
As a leading indicator. This method assumes that the final phase of an up-trend is
usually accompanied by a rapid price increase (when everyone expects prices to go
higher), and that the end of bears' market is characterized by rapid price declines (when
everyone wants to get out). This is often the case, but it is also a broad generalization.
As the market approaches peak, the Momentum indicator is accompanied by the sharp
leap of the Momentum indicator. After that it starts to fall while prices keep on growing
or move horizontally. Analogous to that, at the market bottom Momentum sharply falls
and then turns up long before prices start growing. Both of these situations result in
divergences between the indicator and prices.
Calculation
Momentum is calculated as a ratio of today’s price to the price n periods ago:
MOMENTUM = CLOSE (i) / CLOSE (i - n) * 100
Where:
CLOSE (i) — close price of the current bar;
CLOSE (i - n) — close price n bars ago.
www.eurofinance.bg 29You can also read