Towards Supporting Collaborative Spatial Planning: Conceptualization of a Maptable Tool through User Stories - MDPI
←
→
Page content transcription
If your browser does not render page correctly, please read the page content below
International Journal of
           Geo-Information

Article
Towards Supporting Collaborative Spatial Planning:
Conceptualization of a Maptable Tool through
User Stories
Rosa Aguilar * , Johannes Flacke                  and Karin Pfeffer
 Faculty of Geo-Information Science and Earth Observation, University of Twente, P.O. Box 217,
 7500 AE Enschede, The Netherlands; j.flacke@utwente.nl (J.F.); k.pfeffer@utwente.nl (K.P.)
 * Correspondence: r.m.aguilardearchila@utwente.nl; Tel.: +31-647-616-029

 Received: 10 December 2019; Accepted: 30 December 2019; Published: 3 January 2020

 Abstract: Geographic information-based planning support tools implemented in a maptable have the
 potential to mediate collaborative spatial planning processes. However, available tools for a maptable
 either lack advanced analytical functions or have usability shortcomings. Given these limitations,
 this research aims to conceptualize an interactive planning support tool intended to fully exploit
 maptable capabilities while providing spatial analytical functions to better support planning and
 decision-making processes with a larger group of participants. To do so, we conducted a literature
 review of reported maptable-based applications and semi-structured interviews with identified
 intended user groups of such applications, and derived Agile user stories. We identified a) principal
 spatial analyses, b) must-have functionalities, c) required support for individual contributions, and
 d) preferred space-time settings for group work collaboration, and based on that conceptualized an
 interactive tool for a maptable. By involving the intended users in the conception of the tool we
 revealed a discrepancy between the understanding of scholars and developers with respect to what
 users need and what they do. Intended user groups require tailored but straightforward instruments,
 rather than complicated or time-consuming models. Our research has laid down the foundation for
 future maptable tool development to support collaborative planning processes.

 Keywords: collaborative planning; maptable; interactive; support

1. Introduction
      Geographic information (GI) based planning support tools which offer interactive map
visualization and analytical capabilities have the potential to mediate collaborative spatial planning
processes. The shift from rational planning to communicative planning has promoted the utilization of
such (digital) geo-tools as mediators for social interaction in addressing spatial planning problems [1–4].
However, planning practitioners have not fully incorporated Planning Support Systems (PSS) in their
practice despite the variety of such tools developed to aid spatial planning tasks [5,6]. This problem,
known as “the implementation gap” [3,7–9], is explained by certain characteristics of PSS such as low
usability, vast requirements of expert knowledge or user unawareness of the PSS potentials [4,10].
      A maptable is a PSS tool to support collaborative spatial planning processes usually arranged in a
PSS workshop [3,11,12]. The primary characteristic of a maptable is the utilization of a large horizontal
touch table that allows interacting with geospatial content. A maptable facilitates the communication
process by providing a GI-based visual platform easy to understand by the majority of users regardless
of their IT literacy or knowledge background [13]. Besides, the physical characteristics of the platform,
its size, and horizontal orientation enable more equitable participation as all members are located
around the content being able to contribute to the discussion [14]. The enhanced interaction provided

ISPRS Int. J. Geo-Inf. 2020, 9, 29; doi:10.3390/ijgi9010029                         www.mdpi.com/journal/ijgi
ISPRS Int. J. Geo-Inf. 2020, 9, 29 2 of 18
by a maptable might lead towards social learning, knowledge sharing, knowledge integration or
consensus-building [15–17]. Maptables have been applied in different fields, among others, energy
transition [18], proposals for green and blue infrastructure [15] or development of long term adaptation
strategy in peatlands [19].
Regardless of the proven and claimed benefits of a maptable, such as an enhanced interaction
among different types of stakeholders or an improved negotiation led by the interactive feedback
on measures being discussed [20], three principal factors constrain the use of a maptable in a PSS
workshop. First, there are limited software applications specifically designed for a maptable [21].
Moreover, typical applications reported in the literature have usability shortcomings that prevent users
from achieving a satisfactory user experience because they have single-user roots meaning that those
applications were designed for a desktop computer [7]. Second, a maptable can only accommodate a
limited number of people in a PSS workshop. A typical maptable can host four to six participants at
the maximum. Third, so far, a maptable PSS is only applied in a co-located and synchronous setting for
group work collaboration [21]. However, certain collaborative spatial planning processes may require
the contribution of participants in a different group work setting, e.g., people remotely located and
not able to participate in a specific place at a specific time, or a larger audience that cannot be easily
accommodated in a room.
Given the mentioned shortcomings, this research aims to conceptualize an interactive PSS tool for
maptables specifically intended to fully exploit maptable capabilities while providing spatial analytical
functions to better support planning and decision-making processes with a larger group of participants.
To do so, we applied a combination of methods, namely a literature review of reported maptable-based
applications, semi-structured interviews with identified intended user groups of those applications
and Agile user stories. The interviews with intended users and their user stories served to involve
expectations of intended users at the conceptualization—i.e., primary stage—of the development
project of our tool.
The paper is structured as follows: Section 2 provides a synopsis of important elements of the
tool conceptualization. Section 3 elaborates the methods used to collect and analyze data; Section 4
presents the results including the conceptualization of the tool, whereas Section 5 discusses them,
presents conclusions, and outlines future research directions.
2. Background
In this section, we elaborate on maptable-based PSS workshops to enlighten the organizational,
technical, and physical aspects that should be considered when designing an interactive tool to support
such a collaborative activity. Besides, we briefly illustrate the different space-time settings where
collaborative planning processes can occur and the digital support they might require. Moreover, we
introduce human centered design (HCD) and Agile user stories since we aim to conceptualize a PSS
tool to be used in a maptable based on user needs.
2.1. A Maptable-Based PSS Workshop/Process
In this research we define, based on the literature and our own expertise, a maptable-based PSS
workshop as a structured meeting that provides a physical space and maptable(s) as a primary digital
supporting tool(s) to facilitate the interaction among participants during collaborative, participatory
processes [18,22,23]. A maptable-based PSS workshop has three fundamental elements, namely (a)
the planning problem context, (b) the purpose or intended outcome of the PSS workshop, and (c)
the planning phase in which the workshop takes place (see Figure 1). The planning problem context
involves the nature of the planning problem, stakeholders, and their setting concerning space and time.
The planning problem refers to the issue being discussed, for instance, matters related to the use of
land, infrastructure development, or facilities allocation [24]. The nature of the problem comprises its
complexity, degree of structuration [25,26], and geographic scope. It defines the stakeholders to be
involved—i.e., the individuals, groups, public or private organizations, and institutions that may haveISPRS Int. J. Geo-Inf. 2020, 9, x FOR PEER REVIEW 3 of 18
ISPRS Int. J. Geo-Inf. 2020, 9, 29 3 of 18
institutions that may have a stake in the problem [27]—and their characteristics such as knowledge,
skills,
a stakeexperience,
in the problem education,
[27]—and habits or preferences,
their characteristics such asgeographic distribution,
knowledge, skills, experience,and time for
education,
participation [28]. The purpose
habits or preferences, geographic refers to the intended
distribution, and timeoutcome of the workshop
for participation [22],
[28]. The meaning
purpose what
refers
is to
expected to be achieved from the stakeholder participation, e.g., design of
the intended outcome of the workshop [22], meaning what is expected to be achieved from the proposals, consensus-
building concerning
stakeholder the allocation
participation, of resources
e.g., design or learning
of proposals, about a particular
consensus-building problem
concerning [16,18,19,29].
the allocation of
The planning
resources phase and
or learning about the purpose problem
a particular delineate[16,18,19,29].
the orientation of the PSS
The planning phaseworkshop toward a
and the purpose
delineate the orientation
communicational of the PSS
or an analytical workshop
emphasis andtoward a communicational
the tasks that participants orare
an analytical
expected toemphasis
complete.
and the tasks that participants are expected to complete. Lastly, the planning phase
Lastly, the planning phase [30] plays a vital role in the purpose for which the application is used. [30] plays a vitalFor
role in the
example, inpurpose for which
an exploratory the application
phase, more socialis used. For example,
interaction in an exploratorytophase,
and communication framemore social
the problem
interaction and communication to frame the problem than to develop concrete
than to develop concrete plans may be expected. This communication process could be supported byplans may be expected.
This communication
map-based process
visualization. In could
otherbeplanning
supportedphases,
by map-based
such as visualization.
the design In orother planning
choice phase,phases,
specific
such as the design or choice phase, specific discussions which require not only
discussions which require not only map-based visualization but also analytical support such as map-based visualization
but also
impact analytical
analysis maysupport
be neededsuch[31].
as impact analysis may be needed [31].
Figure
Figure1.1.Map table-based planning
Maptable-based workshopcontext.
planning workshop context.Source:
Source:Authors;
Authors; based
based onon [3,22,30].
[3,22,30].
2.2.
2.2. Space-TimeDimensionality
Space-Time Dimensionalityfor
for Group
Group Work
Work Collaboration
Collaboration
AsAsmentioned
mentioned ininthethe
introduction,
introduction,a PSSaworkshop normally normally
PSS workshop happens inhappens
a co-located
inand synchronousand
a co-located
setting for group work collaboration. However, interaction among participants
synchronous setting for group work collaboration. However, interaction among participants in collaborative planning in
processes may occur in different space and time settings. Four cases were identified [28,32], namely: a)
collaborative planning processes may occur in different space and time settings. Four cases were
co-located synchronous: same place and same time, b) distributed synchronous: different place and
identified [28,32], namely: a) co-located synchronous: same place and same time, b) distributed
same time, c) co-located and asynchronous: same place and different time and, d) distributed and
synchronous: different place and same time, c) co-located and asynchronous: same place and
asynchronous: different place and different time. Figure 2 illustrates those settings. Various methods
different time and, d) distributed and asynchronous: different place and different time. Figure 2
for participation are applicable in each setting. For example, a group decision room (GDR), i.e., an
illustrates those settings. Various methods for participation are applicable in each setting. For
electronic mediated meeting room enabling stakeholders dialogue [3] could be a suitable method for
example,
co-locateda and
group decision (same
synchronous roomtime)(GDR), i.e., anAelectronic
discussion. web surveymediated meeting
can be applied room enabling
to distributed and
stakeholders
asynchronous dialogue [3] could
consultation, be been
as has a suitable method in
implemented forSoftGIS
co-located
[33]. and synchronous
As each (same
setting will time)
require
discussion. A web survey
different methods, specificcan be applied
support to distributed
concerning and asynchronous
enabling technologies consultation,
is required [34]. as has been
implemented
A maptable is a PSS tool used so far in collaborative processes happening in a co-locatedsupport
in SoftGIS [33]. As each setting will require different methods, specific and
concerning
synchronous enabling
setting,technologies is requiredIn[34].
e.g., a PSS workshop. this study, inspired by our experiences in observing/
conducting maptable workshops [17,18,35] where participation was limited by the size of maptable(s)
applied, we also explore the possibilities to extend maptable capabilities to support a different space-time
setting for group work collaboration and how relevant this kind of support for our intended user
groups is.ISPRS Int. J. Geo-Inf. 2020, 9, 29 4 of 18
ISPRS Int. J. Geo-Inf. 2020, 9, x FOR PEER REVIEW 4 of 18
Figure 2.
Figure Space-time setting
2. Space-time setting for
for group
group work
work collaboration.
collaboration. Based
Based on
on [28].
[28].
2.3. Human Centered Design and Agile User Stories
A map table is a PSS tool used so far in collaborative processes happening in a co-located and
synchronous
In the lastsetting,
decades,e.g.,twoamain PSSapproaches
workshop.have In this study,
driven software inspired by our namely
development, experiences
human- in
observing/conducting
centered design (HCD), map andtable workshops
Agile software[17,18,35]
developmentwhere[36].
participation
The HCDwas limitedisbyanthe
approach size of
iterative
map table(s)
workflow applied,and
of design weusability
also explore the possibilities
evaluation to extend
of interactive systems map tablethe
where capabilities
(human) to support
user plays a
different
central role.space-time
In such asetting
way, the fordeveloped
group work collaboration
system becomes and
more how relevant
usable. Agilethis kind ofdevelopment
software support for
our intended
comprises user
a set groups is.to produce software in a short and usually well-defined period complying
of practices
with user requirements. Agile methods apply incremental and iterative development cycles where
2.3. Human Centered
the intended Design and
users provide Agile User
feedback, and Stories
the goals of the system under development are adapted as
user Inrequirements are enlightened
the last decades, two main[37]. Although
approaches HCD
have and Agile
driven softwaretechniques pursue slightly
development, namely different
human-
centered design (HCD), and Agile software development [36]. The HCD approachonisthe
goals, e.g., Agile techniques focus on working functionalities whereas HCD focuses an usability,
iterative
both methods
workflow work in
of design andclose cooperation
usability with the
evaluation intended users
of interactive and stakeholders
systems of the system
where the (human) under
user plays a
design/development. The combination of HCD and Agile pursue delivering
central role. In such a way, the developed system becomes more usable. Agile software development highly usable software [37]
in a short time.
comprises a set of practices to produce software in a short and usually well-defined period complying
For instance,
with user requirements. a user story
Agileismethods
a conventional Agile technique
apply incremental and for collecting
iterative user requirements
development cycles where that
encapsulates
the intended usersfunctional
providerequirements
feedback, and in antheinformal
goals oflanguage
the system asunder
perceived by the user
development are[37] and can
adapted as
be used within a HCD. It usually follows a template of who, what
user requirements are enlightened [37]. Although HCD and Agile techniques pursue slightly and why [38] as shown in Box 1,
althoughgoals,
different other e.g.,
variants
Agileexist. The ‘[who]’
techniques focusisonrepresented by Persona, i.e.,
working functionalities an identified
whereas user or
HCD focuses onuser
the
role, the ‘[what]’ describes the capability or software functionality that should
usability, both methods work in close cooperation with the intended users and stakeholders of the be performed and the
(optional) ‘[why]’ that is located after the phrase so that, provides the
system under design/development. The combination of HCD and Agile pursue delivering highly rationality or benefits obtained
by having
usable that capability.
software [37] in a shortA user
time.story is an instrument for the dialogue between developers and
users, and is often further discussed,
For instance, a user story is a conventional for example,
Agiletotechnique
add detailsforand validation
collecting criteria, beforethat
user requirements its
implementation.
encapsulates User stories
functional can be gathered
requirements through
in an informal different
language methods, such
as perceived by theasuser
user[37]
interviews,
and can
questionnaires, observation, and story-writing workshops [39].
be used within a HCD. It usually follows a template of who, what and why [38] as shown in Box 1,
although other variants exist. The ‘[who]’ is represented by Persona, i.e., an identified user or user
Box 1. Standard templates for a user story.
role, the ‘[what]’ describes the capability or software functionality that should be performed and the
(optional) ‘[why]’ that is[Persona]
located after
wantsthe phrase so
to [perform that,soprovides
a task] the rationality
that [achieve this goal] or benefits obtained
As [user
by having that capability. A user I want is
role], story to [perform a task] so
an instrument forthat
the[achieve
dialoguethis between
goal] developers and
users, and is often further discussed, for example, to add details and validation criteria, before its
implementation.
3. Methods User stories can be gathered through different methods, such as user interviews,
questionnaires, observation, and story-writing workshops [39].
To conceptualize an interactive PSS tool for a maptable we conducted a comprehensive literature
Box 1. Standard
review on existing maptable applications templates
to identify for a user user
1) potential story.requirements of maptable users,
and 2) shortcomings of current PSS software for horizontal, large touch devices. Furthermore, we
conducted a series of[Persona] wants tointerviews
semi-structured [perform awithtask]a so that [achieve
carefully this goal]
identified groups of maptable users
As [user role], I want to [perform a task] so that [achieve this goal]ISPRS Int. J. Geo-Inf. 2020, 9, x FOR PEER REVIEW 5 of 18
3. Methods
To conceptualize an interactive PSS tool for a map table we conducted a comprehensive
literature review2020,
ISPRS Int. J. Geo-Inf. on existing
9, 29 map table applications to identify 1) potential user requirements of5 map of 18
table users, and 2) shortcomings of current PSS software for horizontal, large touch devices.
Furthermore, we conducted a series of semi-structured interviews with a carefully identified groups
to
of elicit
map their
tableneeds
users or
to expectations regarding
elicit their needs the application
or expectations underthe
regarding study. From these
application underinterviews, we
study. From
derived user stories as concrete expressions of user needs. Moreover, we drew on
these interviews, we derived user stories as concrete expressions of user needs. Moreover, we drewinsights gained from
previous
on insightsmaptable-based
gained from PSS workshops
previous [18,21]. Those
map table-based PSSuser stories and
workshops experiences
[18,21]. combined
Those user storieswith
and
the required baseline functionality of an online annotated map [40,41] formed the
experiences combined with the required baseline functionality of an online annotated map [40,41] starting point for the
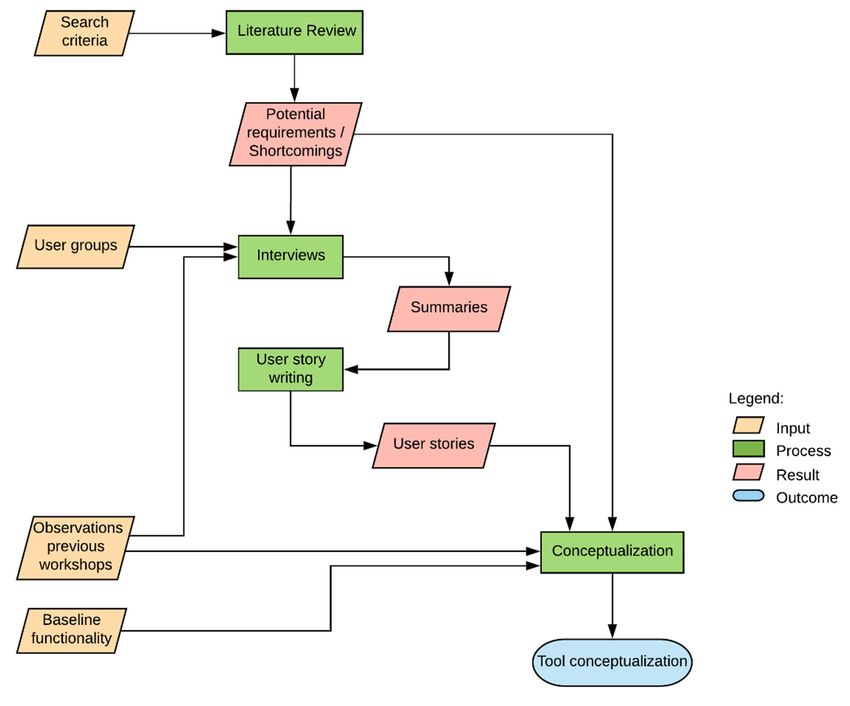
conceptualization of the tool that is presented in this article. Figure 3 shows the workflow
formed the starting point for the conceptualization of the tool that is presented in this article. Figure of our study
that is elaborated
3 shows in theof
the workflow following
our study subsections.
that is elaborated in the following subsections.
Figure 3. Methodology
Figure 3. Methodology overview.
overview.
3.1. Literature Review
3.1. Literature Review
Three central sources of literature were reviewed for the period between 2008 and 2018, namely,
Three central sources of literature were reviewed for the period between 2008 and 2018, namely,
Google Scholar, Scopus, and Web of Science. In Scopus and Web of Science, each search query was
Google Scholar, Scopus, and Web of Science. In Scopus and Web of Science, each search query was
applied to the title, abstract, and article keywords. The criteria and search keywords used to build
applied to the title, abstract, and article keywords. The criteria and search keywords used to build
queries for each database format are given below:
queries for each database format are given below:
• Keywords: urban planning, tools, maptable, multi-touch, collaboration. Synonyms for maptable:
• Keywords: urban planning, tools, map table, multi-touch, collaboration. Synonyms for map
tabletop and touch device. Strings used were:
table: tabletop and touch device. Strings used were:
a)
a) planningAND
planning ANDtools
toolsAND
ANDmap
maptable ANDmulti-touch
table AND multi-touchAND
ANDcollaboration;
collaboration;
b)
b) planningAND
planning ANDtools
toolsAND
ANDmap
maptable ANDcollaboration.
table AND collaboration.
•• Language:
Language:English.
English.
•• Type
Typeof
ofpublication:
publication:full
fulltext
textavailable
availablein
injournals,
journals,proceedings.
proceedings.
Using the term “touch device” in google scholar returned more than 2000 hits. For that reason,
that keyword was omitted in that search engine. The total number of papers returned by each source
was: a) Google Scholar: 135, b) Scopus: 26, and c) Web of Science: 18. Through manual screening,
we omitted non-relevant papers, i.e., papers not directly related to planning, or articles referring toISPRS Int. J. Geo-Inf. 2020, 9, 29 6 of 18
tangible user interface (TUI) where the interaction is based on the combination of physical objects and
computer vision technologies.
After manual screening the search resulted in 12 papers selected from a) Google Scholar: 10,
b) Scopus: 2, and c) Web of Science: 0 (papers were already returned in the other sources). Other
17 papers were included in the review as they were relevant to the discussion on PSS software for a
maptable. These papers did not appear in the initial result of the search; however, authors were aware
of them, or they were found in the bibliography of the reviewed papers. Appendix A contains a list of
the selected papers.
3.2. Semi-Structured Interviews with Intended Users as Part of Human-Centered Design and Agile User Stories
In this paper, we employed a HCD to involve the intended users in the conception of the tool. Hence,
we started the conception process of a digital interactive tool to support collaborative spatial planning
by identifying intended user groups and their characteristics, selecting a sample from identified groups
and interviewing them to generate user stories in a posterior phase. Four main groups of intended users
were identified for semi-structured interviews, namely planning researchers, GIS experts, planning
practitioners, and laypersons [27]. All of the identified user groups had to be aware of a maptable and
had used it at least once. Planning researchers are defined as professionals primarily dedicated to
planning studies, whether having or not a background in GIS applications. Their research interest is
mainly led by theoretical frameworks and planning problems instead of the supporting technology for
addressing them. GIS experts are professionals or researchers highly skilled in the application of GIS
technologies; they may have some knowledge of planning, but their central interest is the exploitation
of GIS capabilities. This type of users can perform the role of chauffeur, develop models to be used in
a maptable-based PSS workshop, or provide technical support during such a workshop. A planning
practitioner is understood as a planning professional working in a private or public organization to
develop plans or carry out projects related to land use interventions. This type of users may have or not
expertise in GIS applications. A layperson or lay user refers to a person without specialized knowledge
in planning or GIS. This kind of user can also be referred to as residents that have prior experience in
planning sessions.
The objective of the interviews was to unpack user perspectives concerning the current validity and
importance of the requirements found in the literature and identify new ones that may not have been
reported on it. We interrogated the users’ previous experience to understand the kind of application
for which they have applied a maptable. Besides, we asked for the problem addressed, stakeholders
involved in the process, the spatial analysis applied and the planning phase in which a maptable was
used. We also enquired about the shortcomings of the PSS tool applied or aspects to be improved, and
the expectations concerning a ‘must-have’ functionality of a new PSS tool under design. Furthermore,
we asked for the need of support for different space-time settings and individual footprints, i.e., tracking
individual contributions during a planning session with a maptable. The information collected through
the interviews outlined above, was the input to extract user stories described in the following section.
In total, we interviewed 11 participants, 4 planning researchers, 3 GIS experts, 2 planning
practitioners, and 2 laypersons. Those participants were selected given their experience with a
maptable and their availability, e.g., time and location, for participating in the interviews. Interviews
were (voice) recorded and summarized to provide the input for the systematic formulation of user
stories. The interview process complied with the General Data Protection Regulation (GDPR) meaning
participants were informed about the purpose of the interview, they gave consent to record it and to use
it for the purpose of this research; collected data was not disclosed to third parties; and its processing
and storage were performed following practices for data protection and privacy aligned with the GDPR.
Due to time availability and geographic location of our intended users, we derived Agile user
stories from their interviews. Recordings and interview summaries were deeply scanned to extract
expressions systematically. These impressions were translated into Agile user stories which are
reported in the result section. Formulated user stories follow the template given in Box 1 by specifyingISPRS Int. J. Geo-Inf. 2020, 9, 29 7 of 18
a username or user role, the feature or functionality required and, optionally, the benefit that the user
will attain by having that functionality in the tool. All user stories were checked by an external expert
in software development and revised where applicable. In order to minimize the subjectivity endowed
with this kind of data analysis method, interview audio, and summaries were revisited iteratively.
3.3. Tool Conceptualization
For the tool conceptualization we contrasted the requirements found during the literature
review with those expressed as user stories. Besides, a baseline of functionalities provided in regular
GI-based participatory tools such as annotated maps is taken as a basis of our tool. An annotated
map enables users to explore spatial content encoded in geographic layers and add information via
markers, comments, or media files. We also considered our own knowledge accumulated through the
experiences obtained from attending or moderating planning workshops. The result of this conception
process is presented through an illustration and a narrative describing the main components of our
tool in Section 4.3.
4. Results
This section discloses the findings we obtained from the literature review and user interviews and
presents the conceptualization of an interactive PSS tool for a maptable, narrowing down the many
specific aspects to what is required in practice by users.
4.1. A Maptable: Potential Shortcomings and Requirements of Maptable Software Applications
Based on the literature, concerning: a) case studies where a maptable was applied; b) general
shortcomings of the available PSS tools, i.e., software applications for this instrument; c) potential
requirements; and d) our own experiences of maptable-based PSS workshops, we found the following.
Different studies in diverse sectors of applications emphasize the potential of a maptable to
support collaborative spatial planning, for instance, to enhance the communication among different
types of stakeholders, e.g., expert and non-expert, and offering analytical functionality to generate
better-informed plans or proposals. The majority of the studies concerned strategic urban planning
issues [42,43], followed by planning studies related to climate [15,19,44,45] and environmental
health [17]. We also found applications in the energy sector [18], and transportation [29]. In several
of those studies, scholars reported that the enhanced interaction provided by a maptable might lead
towards knowledge sharing, knowledge combination, or consensus-building [46,47].
Although a maptable has shown potential as demonstrated by the case studies, the authors also
encountered some limitations. For example, it can accommodate only a limited number of people and
can be intimidating for elderly or low digital literate stakeholders [18]. Case studies also reported
shortcomings of software applications, i.e., the digital tool implemented in a maptable, when delivering
spatial content. This aspect is the focus of our research. The issues that were identified concerning
software applications for a maptable are summarized as follows:
• Single root: GIS desktop applications do not fully exploit the touch capabilities because they have
single-user roots, i.e., they were designed for a single user, i.e., one user at the time [32,48].
• Expert systems: conventional tools are developed for and by experts that can handle sophisticated
technologies which may limit the participation of non-expert stakeholders [4].
• Turn-taking: Turn-taking is a regular implementation of the collaborative group work, i.e.,
stakeholders use the software in turns, but the software itself is not aware of this and does not
keep a record of those turns [49]. Hence, individual contributions cannot be traced.
• Software offer: the offer of mature and stable GI-based software specially designed for supporting
large touch devices and collaborative group work is scarce. Besides, the current offer does not
satisfy the needs of most users [8]ISPRS Int. J. Geo-Inf. 2020, 9, 29 8 of 18
• Open source software: open-source software tools that allow for collaborative development of
extensible applications are scarce [7].
In addition to the general software shortcomings mentioned above, we also listed the desired
capabilities of a planning support tool as envisioned by researchers. We categorized those capabilities,
also known as potential requirements as follows:
1. navigation,
2. data input,
3. data management,
4. spatial analysis,
5. visualization and,
6. other capabilities mainly dealing with extensibility and performance of the PSS tool.
Concerning navigation, scholars documented the need for mobile-oriented designed applications.
This means apps with intuitive GUI (Graphical User Interface) adapted to an interactive surface, i.e.,
simple and minimal menus using larger buttons, and gesture-based user interaction [50–52].
Capabilities for data input concerned advanced editing, namely: automatic closing of shapes,
easy drawing of regular forms; copying, pasting, resizing, and rotate features; freehand drawing and
annotation; adding markers or comments and typing via a virtual keyboard [43,46,48,50,51,53].
Potential requirements related to data management address information reuse and integration;
for example, the integration of information via databases, map libraries and multiple sketching layers.
Besides, import and export of parameters values, results or maps is desired [45,50].
With regard to spatial analysis, scholars reported scenario planning, timely evaluation of
alternatives via indicators, embedded GIS functionality and cost-benefit analysis as pivotal functions
expected in a PSS tool [12,15,18,19,43].
In terms of visualization, scholars remarked the importance of a balance in the data used to
limit the cognitive effort of stakeholders, e.g., by limiting the number of concurrent layers being
displayed, showing a reduced number of indicators at once, and providing different visualization
forms understandable for a wider audience, e.g., dashboards, linked visualizations of maps, charts, and
graphs and efficient rendering of large datasets [12,19,29,43,50]. In addition, intuitive and interactive
styling and advanced visualization such as 3D views were listed as needed for supporting planning
processes [18,43].
Other relevant qualities for a PSS as understood by researchers refer to a) the performance of the
tool, e.g., handling large datasets or cloud computing; b) the learning curve, i.e., guidance through
workflows, well-structured help; and c) adaptable and understandable models [12,43,51,54,55].
In summary, based on the potential requirements and shortcomings found in the literature and our
previous experience in attending and moderating planning workshops, we identified four dimensions
to structure our interviews, namely:
1. the principal spatial analysis of a maptable PSS tool,
2. the must-have functionalities of a maptable PSS tool,
3. tracking of individual contributions and,
4. space-time settings for group work collaboration.
Dimensions a and b were chosen to stress the core of requirements that would enable users
to achieve their intended tasks when applying the tool being conceptualized, i.e., the principal
spatial analysis that is required and the minimum essential set of functions for a map-based PSS
tool. Dimensions c and d were selected on the basis of our experience gathered during attending and
moderating previous maptable-based PSS workshops, e.g., the limited window in space and time
that people have to participate in a workshop and the lack of support in discriminating individual
contributions. Besides, these dimensions imply functionalities that are not regularly included in a PSS
tool, because they go beyond the standard or base level of performance of a GI-based tool.ISPRS Int. J. Geo-Inf. 2020, 9, 29 9 of 18
4.2. User Stories Derived from the Interviews
In the following sections, we analyze the responses of the identified user groups structured
by the identified requirements from Section 4.1, namely a) principal spatial analysis, b) must-have
functionalities, c) tracking of individual contributions, and d) space-time settings for group work
collaboration. For each dimension, exemplifying user stories are given, following the template presented
in Box 1. For readability, we refer to our intended users in a general way, e.g., researchers instead
of interviewed researchers. Also, when we refer to statements made by a specific respondent we
identified her/him as follow: Pi represents a planning practitioner (i ranges from 1 to 2), Rj refers to a
researcher (j ranges from 1 to 4), Gk refers to a GIS expert (k ranges from 1 to 3), and Lm states for a
layperson, with m ranging from 1 to 2.
a) Principal Spatial Analysis
We found that the majority of case studies as reported by our respondents applied a maptable
during an exploratory phase (intelligence), i.e., for gaining an understanding of the planning problem
or issue at hand. In those cases, map visualization and essential input data functions, e.g., adding
markers, were sufficient for the intended purpose. In other instances, impact evaluation via indicators
was the principal spatial analysis used in planning workshops giving stakeholders immediate feedback
on specific intervention proposals. Table 1 lists the responses of our interviewees, followed by examples
of extracted user stories related to this topic.
Table 1. Principal spatial analysis.
Group\Type of Visualization/ Impact Evaluation Simple
SMCE
Analysis Mapping (Indicators) Calculations
Practitioners 2 - - -
Researchers 4 1 1 -
GIS experts 2 1 1 1
Lay persons - 2 - -
Example of user stories:
As a planning practitioner, I want to integrate different layers so that I can quickly identify ideal
locations for certain facilities.
As a researcher, I want to have a scenario analysis combined with impact analysis of alternatives
so that I can see the effect of specific measures on the problem being tackled.
b) Must-have functionalities
In this dimension, interviewed users responded at different levels of details providing statements
that were classified as non-functional and functional requirements. The non-functional requirements,
also known as quality attributes, describe how the tools should be whereas the functional requirements
refer to specific capabilities, e.g., calculations, input type, etc., desired for the new tool under construction.
We listed below a summary of the must-have capabilities according to our interviewees, the first set of
qualities are rather generic, whereas the following are specific:
Non-functional requirements:
• Customizable: a tool adjustable to the context and topic under discussion.
• Transparent: the user can know and modify any assumption of the tool.
• Interoperable: meaning easy integration with common GIS applications and formats, and
portability of the resulting analysis.
• More intuitive interface: the UI of the new tool looks and works similarly to a tablet or mobile
phone, e.g., simple interfaces with bigger buttons.
• Web-based: the app is available online.ISPRS Int. J. Geo-Inf. 2020, 9, 29 10 of 18
• OS: the app is Open Source.
• Reliable: recovers from failures with minimum data loss.
• Complexity: the complexity of the tool according to the tackled phase of planning and the specific
intended stakeholder participating in a workshop mediated by a maptable.
• Modularity: the application allows for a progressive addition of functions as the planning process
advance.
Functional requirements:
• Data collection: adding markers to the map concerning the issue at stake.
• Sketching and adding notes: free-hand drawing and adding text notes on the map canvas.
• Impact assessment: provides immediate feedback on the effects on predefined indicators of
sketched interventions being discussed.
• Scenario analysis: constructs and analyses future conditions concerning the problem at stake.
• (user-driven) Spatial Multi-criteria Evaluation (SMCE): stakeholders can perform a multi-criteria
evaluation and tune its parameters.
• 3D views: visualization of tri-dimensional data.
Examples of user stories:
As a researcher, I want to have a GUI rich in pictures so that people with low education (e.g.,
unable to read) can easily use the application.
As a GIS expert, I want an application available on the web so that more people can participate
remotely and integrate the result of that interaction into the discussion mediated by a maptable.
As a Researcher, I want an open-source application comparable to current private touch-oriented
apps for a maptable so that users can have a satisfactory experience without the restrictions of
private software.
As a layperson, I want to have an app that does not freeze so that participants remain engaged/active
in the discussion.
As a Planning practitioner, I want to quickly draw in a few steps so that the process of proposing
interventions can be faster.
As a Planning practitioner, I want to sketch on the maptable using free-hand gestures so that I can
express ideas or concepts as I normally do during design discussions.
c) Tracking of Individual Contributions
Common applications for maptable-based PSS tools do not offer the capability for keeping track
of individual contributions. We explored to what extent our intended users do need to discriminate
individual inputs during a planning workshop where a maptable is used. Table 2 presents gathered
responses in this matter, in which we observe that more than half of our participants judged tracking
individual contributions of stakeholders as not important or slightly important.
Table 2. Tracking individual contributions.
Very Moderately Slightly Not
Group\Item
Important Important Important Important
Practitioners 1 - 1 -
Researchers 1 - 1 2
GIS Experts - 1 - 2
Lay Persons - 1 - 1
Example of user stories:
As a researcher, I want to track individual inputs so that I can understand how stakeholders
become more concrete across the planning session or whether changes in the proposal can be related to
a communicational process (e.g., learning).ISPRS Int. J. Geo-Inf. 2020, 9, 29 11 of 18
As a planning practitioner, I want to be able to discriminate individual interventions of participants
so that I can understand who proposed a particular intervention during the planning workshop.
d) Space–Time Settings for Group Work Collaboration
In general, in the geospatial community, there is an increasing interest in supporting multi-user
collaboration in different space-time settings, particularly in asynchronous distributed environments [56].
In this dimension, we enquired our users’ perspective concerning how useful it would be having
extended capabilities to accommodate interactions among stakeholders in distributed–asynchronous and
distributed–synchronous settings (see Figure 2). This feature goes beyond the current support offered
by a maptable in a co-located–synchronous setting that is typical of face-to-face planning workshops.
Responses collected are listed in Table 3.
Table 3. Need for supporting different space-time settings.
Very Moderately Slightly Not
Setting Group\Item
Important Important Important Important
Practitioners - - 2 -
Researchers - - 3 1
Distributed–Synchronous
GIS experts - - - 3
Laypersons - - 1 1
Practitioners - - - 2
Researchers - 1 2 1
Distributed–Asynchronous
GIS experts - 2 1 -
Laypersons - 1 - 1
In general, respondents considered the support for the distributed-synchronous setting not
important or slightly important. However, some respondents envisioned potential uses cases that may
require this kind of configuration, for example, in a professional environment where users remotely
need to co-design proposals, and it is not possible to timely meet in face-to-face. Additional insights
emerged concerning this issue. We listed those below:
• As participants or stakeholders, being located in different places, work on the same problem
perhaps in different geographic contexts, a competitive rather than collaborative behavior may
be triggered (L1 ). Hence, there is a potential risk of a group dominating the discussion (R2 , G1 ).
Besides, stakeholders need to feel comfortable with the applied technology, i.e., a maptable and
the software application to effectively participate in a discussion (L1 ).
• The group dynamic occurring in a particular space can be disturbed by the communication with
another group. Hence, there is a risk of diverting the discussion from the planning problem at
stake by focusing on the interaction with the other group (G1 ).
• The logistic effort required to configure such a system to support distributed-synchronous setting
would be quite complex and perhaps might not add significant value to the planning process.
Besides, the benefits of applying a maptable rely on the face-to-face interaction among stakeholders
that would be impeded by the increased complexity to synchronize inputs from remote and local
groups (R1 ).
• Communication among different groups working on a maptable, e.g., two parallel workshops
could be useful for sharing results that each group achieved separately, discussing them and
perhaps building a consensual outcome (G3 ).
Respondents reacted—to some extent—positively on the question of supporting distributed
asynchronous settings in combination with a maptable-based workshop. Thus, although practitioners
did not find this quality as relevant, more than a third of our interviewees recognized this aspect as
moderately important. Use cases for this setting concerned data collection processes, e.g., collectingISPRS Int. J. Geo-Inf. 2020, 9, 29 12 of 18
user preferences or knowledge relating to a specific planning issue via annotated maps, online survey,
etc. Respondents provided their perspective on this issue as summarized below:
• Often, the workshop participants, i.e., stakeholders, want to know people preferences on the
problem under discussion. However, those processes should not be synchronized (R1 , G3 ). Instead,
it is useful to have those preferences elicited prior to the workshop, e.g., via online surveys,
geo-questionnaires or similar techniques and incorporate them as an input for the discussion
(R2 , G1 ).
• A potential use case of a distributed and asynchronous setting including a maptable is a variation
of the think-pair-share approach (G2 ) where users have their device, e.g., mobile phone or tablet
for data collection or design proposals and their inputs are shared in a next group session. Then,
the discussion on a maptable can take the input collected from individual participants or pairs
into account (P1 , G2 ).
• People contributing to a data collection process that served as input for a maptable session should
be able to know about the overall result of the data collection process, e.g., aggregated responses,
and the outcome that stakeholder achieved using that elicited data (G1 ).
Example of user stories:
As a GIS expert, I want to have seamless integration between mobile data collection and the
application in a maptable so that I can use the data collected in the field during a planning workshop
without much effort.
As a researcher, I want to collect people’s preferences beforehand so that those preferences can be
used during a workshop session.
4.3. An Interactive Tool for a Maptable: A Conceptualization from User Stories
In the previous section, we elaborated collected responses with respect to the selected dimensions
namely a) the principal spatial analysis, b) the must-have functionalities, c) tracking of individual
contributions, and d) space-time settings for group work collaboration. Besides, we provided examples
of user stories extracted from those responses. Here, building on the results for the selected dimensions
and taking into account that there exists a difference between what can be technically supported and
what users need [7,57], we present the main building blocks of the digital maptable tool (i.e., a software
application) to support a PSS workshop in a planning process, illustrated in Figure 4. The envisioned tool
has three central components offering support concerning mapping, analysis, and space-time settings
(see Figure 2). The mapping support component contains three subcomponents, namely interactive map,
data input and layer management. The interactive map provides a visual workspace where stakeholders
can explore geographic information, i.e., geographic layers, through gesture navigation tools such as
pinch, pan, rotate, etc. The data input element enables stakeholders to input data, i.e., attributes or
characteristics related to a particular location represented in one or more layers that are handled by
the layer management. Layers are usually offered by loading local files or consuming geoservices.
Through the mapping support component, participants can explore geographic information such as
plan interventions, create sketches, or submit data linked to a location via marker or pin. The interaction
provided by the mapping support component is compared to an annotated map as it accommodates
preferences collection, data input or local knowledge elicitation.
The analysis component (analytical support) concerns evidence-based methods to tackle the problem
at hand. We distinguish two sets of analytical functions. The first set refers to standard features expected
for most of our intended users. Compiled user stories indicate that users mainly need SMCE, scenario
development, impact assessment via indicators and sketching. These analytical functions, including
their output visualization, e.g., an indicator chart, can be applied to produce better-informed plans or
decisions [44]. The second set of analytical functions includes advanced functionality that is specific to
the problem at stake and the purpose for which a maptable will be applied. In this way, the application
contains a set of common functions that most users require but allows for extension through theISPRS Int. J. Geo-Inf. 2020, 9, 29 13 of 18
ISPRS Int. J. Geo-Inf. 2020, 9, x FOR PEER REVIEW 13 of 18
advanced
allowsand problem-based
for extension through functions to be developed
the advanced in close collaboration
and problem-based functions to bewith stakeholders
developed in closeof the
application, i.e., following an HCD approach. The space-time support component provides
collaboration with stakeholders of the application, i.e., following an HCD approach. The space-time functions to
accommodate participation
support component in two
provides differenttospace-time
functions accommodate settings: co-located
participation synchronous
in two different and distributed
space-time
asynchronous since compiled
settings: co-located user stories
synchronous and confirmed
distributed some application
asynchronous casescompiled
since for theseuser
settings (see the
stories
confirmed
previous some
section). Forapplication
co-locatedcases for these settings
and synchronous (see the
settings, previous section).
the conceptualized Forenables
tool co-located and
participation
synchronous
via gesture support,settings, the conceptualized
i.e., pinch, pan, minimaltool useenables participation
of regular mouse and viakeyboard
gesture support, i.e., pinch,
and a mobile-oriented
pan, minimal use of regular mouse and keyboard and a mobile-oriented GUI
GUI design, e.g., bigger buttons and simple interface. For distributed and asynchronous settings, design, e.g., bigger the
buttons and simple interface. For distributed and asynchronous settings, the tool provides easy
tool provides easy integration with GI-based open source tools for mobile data collection. The three
integration with GI-based open source tools for mobile data collection. The three building blocks of
building blocks of the tool aim to support the social interaction (synchronous and asynchronous) among
the tool aim to support the social interaction (synchronous and asynchronous) among stakeholders
stakeholders and the analysis required to support collaborative spatial planning.
and the analysis required to support collaborative spatial planning.
Figure
Figure 4. 4.Central
Centralcomponents
components of
ofan
aninteractive
interactivePSS
PSStool forfor
tool a map table.
a maptable.
5. Discussion
5. Discussion andand Conclusions
Conclusions
TheThe central
central aimaimof of thispaper
this paperisistotoconceptualize
conceptualize an aninteractive
interactive PSS tooltool
PSS to be
toused in a map
be used table
in a maptable
that carefully considers requirements expressed by intended
that carefully considers requirements expressed by intended users of such a tool.users of such a tool.
By involving the intended users in the conception of the tool, we revealed a discrepancy between
By involving the intended users in the conception of the tool, we revealed a discrepancy between
the understanding of scholars and developers with respect to what users need and what they do.
the understanding of scholars and developers with respect to what users need and what they do.
Thus, concerning the principal spatial analysis dimension, most cases reported by our respondents
Thus, concerning the principal spatial analysis dimension, most cases reported by our respondents did
did not perform spatial analysis because the process was at an early stage, or the intended outcome
not perform spatialelicitation
was knowledge analysis because the process
or social learning. was at
In other an early
cases, stage,spatial
the central or theanalysis
intended outcome
applied was was
knowledge elicitation
the calculations of or social learning.
predefined indicatorsIn toother cases,
assess thethe central
impact spatial analysis
of proposed appliedThis
interventions. was the
calculations
indicates that often scholars/developers seem to be more ambitious than our respondents when that
of predefined indicators to assess the impact of proposed interventions. This indicates
oftenaddressing
scholars/developers
spatial planning seem to be more
processes. ambitious
Hence, what our than our respondents
intended user group iswhen addressing
requiring spatial
is tailored
but straightforward
planning processes. Hence,instruments,
what our rather than complicated
intended user grouporistime-consuming models.
requiring is tailored This
but issue was
straightforward
also discussed
instruments, in earlier
rather studies [6]. or time-consuming models. This issue was also discussed in
than complicated
As regards
earlier studies [6]. must-have functionalities of the PSS tool to be developed, our respondents provided
insights at different levels of abstraction, showing a preference towards contextualized tools. In other
As regards must-have functionalities of the PSS tool to be developed, our respondents provided
words, a tool adjustable to the planning problem being addressed and the characteristics of the
insights at different levels of abstraction, showing a preference towards contextualized tools. In other
stakeholders to enable equity in participation. With respect to this, some of the extracted requirement
words, a tool adjustable to the planning problem being addressed and the characteristics of the
were comparable with those found in the literature, whereas others were not mentioned, e.g., cloud
stakeholders
computingtoorenable equity
movement in analysis
data participation.
[43,56].With
This respect
led us toto this,that,
argue some inof the extracted
general, requirement
in the context of
werecollaborative
comparablespatial
with those
planningfound in the mediated
processes literature,bywhereas others
a map table, were
users notsimple,
want mentioned, e.g., cloud
transparent,
computing or movement
fast-to-setup, interoperable,dataand
analysis [43,56].
affordable tools This ledinus
that aid to argue
their planning that, in general, in the context
tasks.
of collaborative spatial
Concerning planning
the support processes
of group workmediated by avia
collaboration maptable,
recordingusers wantcontribution,
individual simple, transparent,
our
users found this feature irrelevant, especially when the problem
fast-to-setup, interoperable, and affordable tools that aid in their planning tasks.at stake addresses personal opinions
Concerning the support of group work collaboration via recording individual contribution, our
users found this feature irrelevant, especially when the problem at stake addresses personal opinions
rather than institutional perspectives. This result challenges findings of previous studies [49], butISPRS Int. J. Geo-Inf. 2020, 9, 29 14 of 18
needs to be further researched as we conducted interviews with only a small number of potential users.
In terms of extended capabilities of a maptable for supporting distributed settings, e.g., as part of a
collaborative GIS [58], users reacted moderately positive towards distributed–asynchronous setting
and the use of the output of such a process as input for planning workshops mediated by a maptable.
In contrast, our respondents were sceptic concerning distributed-synchronous settings, arguing that
such setup imposes complexity and demands technical facilities, e.g., a broadband and stable internet
connection that is not always available. This finding is quite interesting because the need for supporting
group work in different space-time settings has been broadly discussed [28,59] but, so far, few software
solutions implemented capabilities for those settings [34]. Also, in the field of spatial planning, detailed
studies on this issue require further investigation as our number of interviewees is modest.
For several years, scholars discussed the mismatch between what planning practice needs and
what has been developed. In this research, we involved representative intended users of our PSS tool to
be developed in the conceptualization process through a combination of methods, namely interviews
and Agile user stories. By extracting user stories from the interviews, we have conceptualized a tool
that effectively addresses the requirements of those intended users. However, elicited requirements
were rather generic, and new ones might arise or evolve in the implementation phase which can be
handled in iterative collaboration with users in an HCD approach. Our research has laid down the
foundation for future maptable tool development to support collaborative planning processes. A next
step in our research is to actually implement our conceptualized tool in a co-creation process fed by
inputs collected in frequent iterations with a problem-specific focus group. Feedback will not only
concern functionality, but also usability aspects of the tool.
Author Contributions: Conceptualization, Rosa Aguilar, Johannes Flacke, and Karin Pfeffer; Methodology,
Rosa Aguilar; Formal Analysis, Rosa Aguilar; Investigation, Rosa Aguilar; Data Curation, Rosa Aguilar; Writing—
Original Draft Preparation, Rosa Aguilar; Writing—Review and Editing, Johannes Flacke and Karin Pfeffer;
Visualization, Rosa Aguilar; Supervision, Johannes Flacke and Karin Pfeffer. All authors have read and agreed to
the published version of the manuscript.
Funding: This research received no external funding.
Acknowledgments: We wish to express our gratitude to all the interviewees that enthusiastically responded to
our questions. We express our gratitude also towards Matthias Kuhn, Luis Calisto, and Raghavendra Sharma for
their support concerning software development practices. Also, our gratitude is deserved by Corné van Elzakker
for his valuable suggestions concerning human-centered design guidelines.
Conflicts of Interest: The authors declare no conflict of interest.
Appendix A Title and Reference of Selected Papers Used in the Identification of Shortcomings
and Potential Requirements
• Interactive Marine Spatial Planning: Siting Tidal Energy Arrays around the Mull of Kintyre [16].
• Map-Based Multicriteria Analysis to Support Interactive Land Use Allocation [60].
• Effectiveness of Collaborative Map-Based Decision Support Tools: Results of an Experiment [42].
• From Planning Support Systems to Mediated Planning Support: A Structured Dialogue to
Overcome the Implementation Gap [4].
• Tables, Tablets and Flexibility: Evaluating Planning Support System Performance under Different
Conditions of Use [55].
• Exploring Landscape Engagement through a Participatory Touch Table Approach [61].
• Beauty and Brains: Integrating Easy Spatial Design and Advanced Urban Sustainability Models [43].
• Collaborative Interaction with Geospatial Data—a Comparison of Paper Maps, Desktop GIS and
Interactive Tabletops [62].
• Collaborative Use of Geodesign Tools to Support Decision-Making on Adaptation to Climate
Change [12].
• What Do Users Really Need? Participatory Development of Decision Support Tools for Environmental
Management Based on Outcomes [7].You can also read