Detecting Campaign Promoters on Twitter using Markov Random Fields
←
→
Page content transcription
If your browser does not render page correctly, please read the page content below
Detecting Campaign Promoters on Twitter using
                 Markov Random Fields

                     Huayi Li∗ , Arjun Mukherjee† , Bing Liu∗ , Rachel Kornfield‡ and Sherry Emery‡
                           ∗ Department
                                     of Computer Science ‡ Institute for Health Research and Policy
                                         University of Illinois at Chicago, IL, USA
                                             † Department of Computer Science

                                             University of Houston, TX, USA
                        lhymvp@gmail.com arjun@cs.uh.edu liub@cs.uic.edu {rkornfie, slemery}@uic.edu

    Abstract—As social media is becoming an increasingly im-           [2], [3], detecting twitter spammers [4–7], correlating Twit-
portant source of public information, companies, organizations         ter activity with stock market [8–10], predicting presidential
and individuals are actively using social media platforms to           election [11], forecasting movie box revenues [12], modeling
promote their products, services, ideas and ideologies. Unlike         social behaviors [13] and influence [14].
promotional campaigns on TV or other traditional mass media
platforms, campaigns on social media often appear in stealth               In this paper, we aim to solve the problem of detect-
modes. Campaign promoters often try to influence people’s              ing user-accounts involved in promotional campaigns, more
behaviors/opinions/decisions in a latent manner such that the          specifically, to identify promoter accounts and non-promoter
readers are not aware that the messages they see are strategic         accounts in Twitter on a particular topic. Unlike advertisements
campaign posts aimed at persuading them to buy target prod-
                                                                       and promotional campaigns on TV or other traditional mass
ucts/services. Readers take such campaign posts as just organic
posts from the general public. It is thus important to discover such   media platforms, social media campaigns often work in stealth
campaigns, their promoter accounts and how the campaigns are           modes. Campaign promoters often try to influence peoples
organized and executed as it can uncover the dynamics of Internet      behaviors in a hidden or implicit manner without disclosing
marketing. This discovery is clearly useful for competitors and        their true intention. They even deliberately try to hide their
also the general public. However, so far little work has been done     true intentions. The readers are thus often unaware that the
to solve this problem. In this paper, we study this important          messages they see are strategic campaign posts aimed at
problem in the context of the Twitter platform. Given a set            persuading them to buy some target products/services or to
of tweets streamed from Twitter based on a set of keywords             accept some target ideas or ideologies. The readers may think
representing a particular topic, the proposed technique aims           those campaign posts are just organic posts from random
to identify user accounts that are involved in promotion. We
                                                                       members of the public. It is thus important to discover such
formulate the problem as a relational classification problem and
solve it using typed Markov Random Fields (T-MRF), which               campaigns, their promoter accounts and how the campaigns
is proposed as a generalization of the classic Markov Random           are organized and executed. This discovery is clearly useful for
Fields. Our experiments are carried out using three real-life          businesses and organizations, and also for the general public.
datasets from the health science domain related to smoking. Such       For example, any business would want to know whether its
campaigns are interesting to health scientists, government health      competitors are carrying out secret campaigns on Twitter to
agencies and related businesses for obvious reasons. Our results       promote their products and services (and possibly also making
show that the proposed method is highly effective.                     negative remarks/attacks about its own products/services). It
   Keywords—Campaign Promoter, Markov Random Fields                    also contributes to research in growing fields like opinon spam
                                                                       [15], deception [16] and fraud detection [17].

                      I.   I NTRODUCTION                                   However, by no means do we say that all campaigns on
                                                                       Twitter are bad or are spam. For example, a government health
    As Twitter has emerged as one of the most popular plat-            agency may conduct an anti-smoking campaign on Twitter to
forms for users to post updates, share information, and track          inform the general public the health risks of smoking and how
rapid changes of trends, it has become particularly valuable           to quit smoking. In this case, the agency would want to know
for targeted advertising and promotions. Since tweets can be           how effective the campaign is and whether the general public is
posted and accessed from a wide range of web-enabled ser-              responding to the campaign and even helping the campaign by
vices, real-time propagation of information to a large audience        propagating the campaign messages and campaign information
has become the focus of merchants, governments and even                web sites or pages. In fact, our research is motivated by a real-
malicious spammers. They are increasingly using Twitter to             life application and a request by a health research program,
market or promote their products, services, ideas and ideolo-          which studies smoking related activities on Twitter. In the field
gies. On the research front, researchers have regarded Twitter         of health science, more and more researchers are measuring
as a sensor of the real world and have conducted numerous              public health through the aggregation of a large number of
experiments and investigations on a variety of tasks including         health related tweets [18]. The campaigns studied in our
analyzing mood and sentiment of people [1], detecting rumors           work are three health related campaigns about smoking. After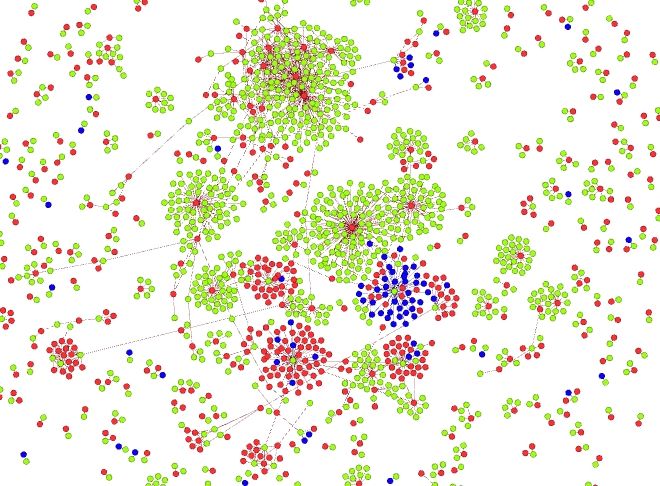
nearly five decades since the first US Surgeon Generals Report      a government health agency in the USA, and one dataset
on Smoking and Health was released, an estimated 443,000            is about electronic cigarettes (or e-cigarettes) promotions on
Americans still die each year from smoking-related diseases.        Twitter. Our algorithm can accurately classify promoters and
Thus it is critical to provide health scientists and government     normal Twitter users in all three datasets. From the e-cigarettes
health agencies with clean feedback from the general public.        dataset, we found that there are numerous promotions going
They can then use the feedback to perform health and policy         on in Twitter. They mainly promote different brands of e-
related studies of activities and tweets of Twitter users, to       cigarettes. Such activities have long been suspected by health
understand the effectiveness of health campaigns, to make           researchers. Our results thus demonstrate the effectiveness
better decisions and to design more appropriate policies.           of the proposed T-MRF model, which outperforms several
                                                                    baselines markedly. Our analysis of the results also shows
    Thus, our goal is to classify two types of user accounts,
                                                                    some interesting differences of the two types of campaigns.
those involved in promotion and those not involved in promo-
tion. Due to the fact that Twitter only allows 140-character-
                                                                                         II.   R ELATED W ORK
long messages (called tweets), they are often too short for
effective promotion of targeted products/services. Promotional          The problem of detecting promoters in Twitter is closely
tweets typically have to include URLs pointing to the full          related to detection of Twitter spam. Benevenuto et al. [4]
messages, which may include pictures, audios and videos (the        studied the problem of identifying Twitter spammers. They
URLs are typically shortened too). Note that we do not study        manually labeled a large collection of users from which they
opinion spamming in this work, which refers to posting fake         trained a traditional classifier using both tweet content and user
opinions about brands and products in order to promote them         behavior features. We also incorporate the content and behavior
or to demote them. Such posts often do not contain URLs. For        features into the local classifier of our model. In our case, the
opinion spamming, please refer to [19], [20].                       local classifier is only used to produce the prior probabilities
                                                                    for each user node. Chris et al. [6] did an interesting analysis
     Probably, the most closely related work to ours is that in
                                                                    of unethical use of Twitter. They showed that 8% of URLs
[5], but it is in the YouTube video domain and their video
                                                                    in tweets point to phishing, malware, and scam sites listed in
attributes are not directly applicable in our problem. This paper
                                                                    popular URL blacklists. Twitter is an effective platform for
formulates detecting promoters as a classification problem to
                                                                    coercing users to visit targeted webpages with a click-through
identify promoters and non-promoters. Although traditional
                                                                    rate of 0.13%. Even though URLs that are promoted in the
supervised classification is an obvious approach, we argue that
                                                                    campaign are not necessarily harmful, their work indicates a
it is unable to fully exploit the rich context of the problem.
                                                                    close relationship between Twitter users and URLs. However,
As we will see in the experiment section, the traditional clas-
                                                                    their work does not detect promoters. Several other researchers
sification approach adapted to our context produces markedly
                                                                    also provided some detailed analysis of Twitter spam accounts.
poorer results than our proposed T-MRF approach. By rich
                                                                    Thomas et al. [7] studied the underlying infrastructure of
context, we mean tweet content, user behavior, social network
                                                                    spam marketplace and identified a few spam companies. Social
effect, and burstiness of postings. Due to the social network
                                                                    relations between spammers and non-spammers were studied
effect, user accounts are not independent. In fact, we found that
                                                                    in [22], [23]. Their work showed that acquiring followers for
many promoter accounts are related to each other via following
                                                                    a user not only increases the size of the audience but also
relations. They are also implicitly related due to content
                                                                    boost up the ranking of the users tweets. Although some
similarities of their tweets. Furthermore, they may be related
                                                                    promoters behave in a similar way to spammers, there are
because they posted at roughly the same time, resulting in
                                                                    also a large number of promoters who are participating in a
bursts of posts. Additionally, if tweets from some user accounts
                                                                    campaign legitimately especially in non-profit campaigns. Two
all include the same URLs, they may also be related. Thus,
                                                                    of our datasets belong to this category. Thus, the criteria and
the i.i.d (independently and identically distribute) assumption
                                                                    techniques used in Twitter spam detection cannot be directly
on the instances in traditional classification is violated.
                                                                    applied to campaign promoter detection.
    To capture these sophisticated characteristics of campaign
                                                                        Campaign detection in social media has also been studied
promoters, the underlying infrastructure, and the rich context,
                                                                    by researchers. [24] analyzed the Facebook wall messages
we formulate the problem as a graph and model the problem
                                                                    and defined a graph of Facebook messages. Then the authors
using Markov Random Fields (MRF). Traditional MRF uses
                                                                    adopted a graph based clustering algorithm to detect campaigns
one type of nodes in the graph. However, in our case, we have
                                                                    as groups of messages. [25] extended the work and provided
multiple types of nodes, which affect each other in different
                                                                    three different approaches to extract campaigns from message
ways. We thus extend MRF to typed-MRF (or T-MRF). T-
                                                                    graphs. [26] instead constructed a graph of user accounts and
MRF generalizes the classic MRF, and with a single type of
                                                                    extracted dense sub-graphs as campaigns. However, our work
nodes, T-MRF reduces to MRF. T-MRF allows us to flexibly
                                                                    is clearly different from them in that our goal is to perform
specify propagation matrices for different types of nodes. The
                                                                    user-level classification to detect individual promoters. Further,
type here refers to the node type, e.g., user, URL or burst. We
                                                                    any promoters may not be connected in the graph. Benevenuto
then use the Loopy Belief Propagation method [21] to perform
                                                                    et al. [5] built a traditional classifier to solve the promoter
inference, i.e., estimate each user node’s belief(probability) of
                                                                    detection problem of YouTube users. As their study is on
being in the promoter/non-promoter category.
                                                                    YouTube, their features derived from video attributes (such
    Our experiments are conducted using three real-life Twitter     as video duration, number of views and comments and so on)
datasets from our health science collaborators. Two datasets        are not directly applicable in our problem. However, we adopt
are about two well-known anti-smoking campaigns conducted           their approach to our context and use it as a baseline and also
by the Centers for Disease Control and Prevention (CDC),            as our local classifier in our evaluation. Since their approach
did not incorporate the rich context of networks and relational variables and pairs of variables (or edges). We use ψi (σi ) to
information of users, the classification results are markedly denote the potential function on a single variable (indexed by
poorer than our proposed T-MRF method. node i), indicating the prior belief that the random variable
vi is in state σi . We also call it the prior of the node. We
Markov Random Fields (MRF) has been used in auc-
use ψi,j (σi , σj ) to denote the potential that node i in state σi
tion fraud [27]; mis-stated account detection [28], and fake
and node j in state σj for the edge of the pair of random
review detection [19], [29]. However, our task is different
variables (vi , vj ). Each potential function is simply a table
and the Twitter context also differs significantly from online
of values associated with the random variables. Due to its
reviews/auctions. Besides, we also generalize the classic MRF
simplicity and efficiency, pMRF is widely used in applications.
to the typed-MRF.
Thus we choose to use pMRF in this work. For simplicity of
While there have been extensive studies on information presentation, in the subsequent discussion, when we use MRF
networks, diffusion [30] and propagation of social contagions we mean pMRF.
[31], limited work has been done about promotions in such
networks, and how they are organized, and what strategies B. Loopy Belief Propagation
are used by promoters. These questions are at the heart of
modeling the dynamics of social contagions in the Web. In The inference task in the Pairwise Markov Random Fields
this paper, we solve the core problem of finding promoters in is to compute the posterior probability over the states/labels
this large context. of each node given the prior state assignments and potential
functions. For specific graph topologies such as chains, trees
Also related is the work of [32] which studies campaigning and other low tree-width graphs, there exist efficient algorithms
in Yelp and presents some theoretical results. It also performs for exact inference. However, for a general graph, the exact
some case studies on Yelp elite users. However their focus inference is computationally intractable. Therefore approxi-
is classifying venues which are likely to review spam targets mate inference is typically used. The most popular algorithm is
in Yelp which is very different from identifying campaign the Loopy Belief Propagation algorithm, which is from Belief
promoters in Twitter based marketing. Propagation.
III. P ROMOTER D ETECTION M ODEL Belief Propagation was first proposed by Pearl [33] for
finding exact marginals on trees. It turns out the same algo-
This section presents the typed-MRF (T-MRF) model for rithm can be applied to general graphs that contain loops [34].
detecting promoters who are strongly correlated with each The algorithm is thus also called Loopy Belief Propagation
other. The standard approach to classify each entity indepen- (LBP). However, LBP is not guaranteed to converge to the
dently ignores these relations. We thus formulate our promoter correct marginal probabilities. But recent studies [21] indicate
detection problem with Markov Random Fields (MRF), which that it often converges and the marginals are a good approxi-
are well suited to such relational classification problems. To mation to the correct posteriors.
our knowledge, this is the first attempt to employ MRFs for
solving the campaign promoters problem in Twitter. To apply The key idea of LBP is the iterative message passing. A
the standard MRF for our problem, however, is not sufficient. message from node i to node j is based on all messages from
We thus extend it to typed-MRF (T-MRF). Below, we first other nodes to node i except node j itself. The following
introduce the basic MRF model and its inference algorithm, equation gives the formula for message passing:
and then generalize it to T-MRF in order to solve our problem X Y
in a flexible way. mi→j (σj ) = z1 ψi,j (σi , σj )ψi (σi ) mk→i (σi ) (1)
σi ∈S k∈N (i)\j
A. Markov Random Fields where z1 is the normalization constant and σj is one com-
Markov Random Fields (also called Markov Networks) ponent of the message mi→j (σj ) which is proportional to
is an undirected graphical model that deals with inference the likelihood that node j is in state σj given the evidence
problems with uncertainty in observed data. MRF works on an from i in all possible states σi . N (i) is a function that
undirected graph G = (V, E), where each vertex or node vi ∈ returns all the neighbors of node i. The above equation is
V represents a random variable and each edge (vi , vj ) rep- called the sum-product algorithm because the inner product is
resents a statistical dependency between the pair of variables over the messages from other nodes to node i and the outer
indexed by i and j. A set of potential functions are defined on summation sums over all states that node i can take. At the
the cliques of the graph to measure compatibility among the beginning of LBP, all messages are initialized to 1. Then,
involved nodes. MRF thus defines a joint distribution over all the messages of each node from its neighbors are alternately
the nodes in the graph/network encoding the Markov property updated until the messages stabilize or a maximum number
of a set of random variables corresponding to the nodes. Each of iterations threshold is reached. The final belief bi (σi ) of a
random variable can be in any of a finite number of states S and node i is a vector of the same dimension as the message that
is independent of other random variables given its immediate measures the probability of node i in state σi . The belief of
neighbors. The inference task is to compute the maximum node i is the normalized messages from all its neighbors as
likelihood assignment of states of nodes. The states here are the shown
P below, where z2 is the normalization factor that ensures
classes for classification. A subclass of Markov Random Fields σi i i ) = 1.
b (σ
that arises in many contexts is the Pairwise Markov Random Y
Fields (pMRF). Instead of imposing potential functions on bi (σi ) = z2 ψi (σi ) mk→i (σi ) (2)
large cliques, the potential functions in pMRF are over single k∈N (i)Fig. 2: A simple example of User-URL-Burst network
means that some topic gets popular suddenly.
Fig. 1: Burstiness of CDC 2012 campaign dataset
As we discussed in the introduction, due to the relatedness
of these nodes, the probability of one node in a particular state
C. T-MRF is influenced by the state probabilities of the other associated
We now extend MRF because we need to consider multiple nodes. For example, if one user has a higher probability being a
types of nodes. Based on such different node types, the promoter, then the URLs in his tweets are likely to be promoted
interactions or dependencies among the nodes (or random URLs. Likewise, the burst that he is in is likely to be a planned
valuables) are also different. For example, in our problem, burst. Such relationships can be modeled in the T-MRF.
there are clearly two main types of entities: users and URLs, Motivated by the above intuition, we now present the
which are our nodes. We also introduce bursts as another type proposed T-MRF model. T-MRF basically defines a graph
of nodes. When promoters promote some URLs, they often with typed nodes. Each type of nodes represents a type of
do in bursts due to pre-planned campaigns. That is, campaign entity of interest, e.g., user, URL, or burst in our case. Table
organizers periodically drive the campaign by sending a large I summarizes the definitions of symbols that we will use.
number of tweets, which results in a sudden increase of tweets Our typed graph is represented by G(V, T, E), where V =
related to a topic in a short period of time. Figure 1 shows {v1 , v2 , ..., vn } is a set of nodes representing a set of random
burstiness in one of our datasets. We define some important variables and E is a set of edges on V . T = {t1 , t2 ..., tn } is the
peaks as the third type of entities and called them bursts (see set of corresponding node types of the nodes in V . Each ti is
Section IV-A on how we find peaks or bursts). The reason an element of a finite set of types H, i.e., ti ∈ H. For example,
that we use peaks or bursts is that users within the same we use three node types in this work, i.e., H ={User, URL,
burst may have some relationships (e.g., latent sockpuppets, Burst}. The edges between nodes represent their dependency
deliberative/coincidental collusion by users, etc.). relationships. Figure 2 schematically shows three types of
Different types of nodes also have different states. For nodes and some edges between them. As we will see later,
example, for the three types of nodes in our case, we have: we can also add edges between dependent users.
Each node vi representing a random variable in T-MRF
• A user is either a promoter or a non-promoter. Thus,
and is associated with the set of states denoted by Sti with
each user node has the two possible states.
respect to its node type ti . For instance, in our case, if
• A URL is either a promoted or organic URL. Each ti = user, then Sti = {promoter, non-promoter}. The state
URL node thus has these two possible states. σi ∈ Sti that each node is in depends on its observed features
as well as its neighboring nodes in the network. In order to
• A burst is either a planned or normal burst. A burst capture these dependencies, we define two kinds of potential
functions, the node potential ψi (σi |ti ) and the edge potential
Symbol Definition ψi,j (σi , σj |ti , tj ). ψi (σi |ti ) is the prior belief of the node vi of
V Set of nodes in the graph type ti in state i , which is measured by its own behavior and
E Set of edges in the graph content features. The edge potential for a pair of nodes, also
T Mapping from nodes to node types called the edge compatibility function, gives the probability of
H Set of types of nodes
a node vj of type tj being in the state σj given its neighboring
vi i-th node or random variable in the graph
ti Type of node i, ti ∈ H
node vi of type ti in state σi . For each pair of node types, the
St Set of states node i can be in edge potentials between the two types of nodes are represented
i
ψi (σi |ti ) Prior of node i in state σi as a propagation matrix, which is used in the loopy belief
ψi,j (σi , σj |ti , tj )
Edge potentials for node i of type ti in propagation algorithm (LBP). The message passing assignment
state σi and node j of type tj in σj equation of LBP now becomes:
Message from node i to node j expressing
mi→j (σj |tj )
node i’s belief to node j being in state σj
bi (σi |ti ) Belief of node i in state σi mi→j (σj |tj ) =
X Y
TABLE I: Important Notations z1 ψi,j (σi , σj |ti , tj )ψi (σi |ti ) mk→i (σi |ti ) (3)
σi ∈S k∈N (i)\jThe final belief bi (σi |ti ) of a node i of type ti is a vector as a propagation matrix to be used by LBP. The values in the
of the same dimension as the message that measures the matrix are set empirically.
probability of node i of type ti in state σi .
User-Burst Potentials: A user and a burst form an edge
if the user posted at least a tweet in the burst. The arrival
Y of a large number of tweets forming a burst is either a
bi (σi |ti ) = z2 ψi (σi |ti ) mk→i (σi |ti ) (4) natural reaction to a successful campaign or a deliberate
k∈N (i) promoting activity from real promoters and/or their Twitter
bots. We assume planned bursts contain primarily promoters
In summary, adding node types in T-MRF allows each type while normal bursts are mostly formed by normal users who
of nodes to have a different set of states, and enables the user are attracted by the campaign. Thus the user-burst relation can
to specify the potentials based on the types of two nodes in a help identify groups of promoters. The edge potentials for this
node pair. T-MRF thus generalizes MRF because when there kind of edges are given in Table II(b), which are also expressed
is only one type of nodes, T-MRF reduces to MRF. as a propagation matrix.
URL-Burst Potentials: A URL and a burst form an edge
IV. T-MRF F OR P ROMOTER D ETECTION if the URL has been tweeted at least once in the burst. To
We now detail how to apply the T-MRF model to our maximize the influence of a campaign, campaign promoters
application. Below, we first introduce the types of nodes, and have to continuously post tweets to maintain the advertising
edges potentials and then node potentials. balance for URLs of interest. Similar to User-Burst potentials,
URLs mentioned within a planned burst are likely to be
promoted while URLs in a normal burst are likely to be
A. Node Types organic. The edge potentials for this kind of edges are given in
Users: These are all the user accounts ids in a dataset. Table II(c), which are again expressed as a propagation matrix.
URLs: These are the set of all URLs mentioned in the User-User Potentials: Several user accounts could be
dataset. Most URLs in Twitter are shortened URLs. We potentially owned by the same individual or institution(e.g.
use their expanded URLs instead because multiple different sock-puppet). Rather than working alone, campaign promoters
shortened URLs may be mapped to the same expanded URL. can be well organized (note that sending tweets from individual
accounts aggressively would result in account suspension by
Bursts: In our setting, a burst is a particular day when Twitter according to Twitter posting policy1 . A group of
the volume of tweets suddenly increases drastically. To detect campaign accounts who work collaboratively can attract more
bursts, we first generate a time-series of tweets based on audience and increase their credibility. Without considering
the number of tweets per day and apply the peak detection the group of accounts collectively, it is difficult to detect some
algorithm in [35] to find bursts. individual promoters because of their insufficient features.
First of all, campaign promoters are inclined to send
B. Edge Potentials predefined tweets that are similar in contents. Two users are
Since we have three types of nodes, we can have 6 kinds similar if their tweet Content Similarity (CS) is high. With the
of edges: user-URL, user-burst, URL-burst, user-user, burst- bag of words assumption, we treat each tweet as a vector and
burst, and URL-URL. However, we only find the following each user as an averaged vector of all his/her tweets. Note
four kinds of edges useful: user-URL, user-burst, URL-burst, that as retweets are merely duplicates of original tweets, we
and user-user. We now define the edge potentials for these four generally discard them in measuring content similarity. Then
types of edges. The parametric algebraic formulations for node we use cosine similarity to measure the similarity of tweets of
potentials (Table II) were derived using our pilot experiments two users.
based on the relations explained below. In Section V, we report CSi,j = cosine(avg(tweetsi ), avg(tweetsj )) (5)
results for different values of to measure its sensitivity.
User-URL Potentials: A user and a URL form an edge Secondly, promoters are only concerned with their own
if the user has tweeted the URL at least once. This kind products or events thus they tweet only a small set of URLs for
of edges is useful because campaign promoters reply on the their own benefits. Let ri and rj be the sets of URLs that are
URLs they tweet to lead other Twitter users to the target mentioned in the tweets of user i and user j respectively. The
websites. If a URL is heavily promoted, the users who tweet URL Similarity (U S) of two users is measured by equation 6
the URLs are likely to be promoters. On the contrary, URLs in terms of Jaccard coefficient.
that are relatively less promoted are usually mentioned by
non-promoters. URLs in the tweets of promoters are called |ri ∩ rj |
U Si,j = (6)
promoted URLs. Non-promoters who learned the campaign |ri ∪ rj |
through external sources such as news, TV and other websites Besides, Ghosh et al. [22] showed that to have larger
are less likely to collaborate with promoters on targeted URLs. audience, to increase the perceived influence of their accounts
But non-promoters can have promoted URLs in their tweets and to impact the rankings of their tweets, promoters may
due to the influence of the social media campaign. Further- acquire followers either by establishing mutual following links
more, campaign promoters are more interested in their target between themselves or targeting (following) other normal users
URLs than URLs from other websites. The edge potentials for
this kind of edges are given in Table II(a), which is expressed 1 https://support.twitter.com/entries/18311-the-twitter-rulestj = URL tj = Burst tj = Burst tj = User
ti = User promoted organic ti = User planned normal ti = URL planned normal ti = User promoter non-promoter
promoter 1 − 2 2 promoter 0.5 + 0.5 − promoted 0.5 + 0.5 − promoter 0.5 + 0.5 −
non-promoter 2 1 − 2 non-promoter 0.5 − 0.5 + organic 0.5 − 0.5 + non-promoter 0.5 0.5
(a) (b) (c) (d)
TABLE II: Propagation matrix ψi,j (σi , σj |ti , tj ) for each type of edge potentials
who would then reciprocate out of social etiquette [36]. So of users in terms of their posting patterns. The behavior fea-
another important measure of user similarity is the Following tures are: maximum, minimum, average number of tweets per
Similarity (FS). Let fi and fj be the sets of users followed day, the maximum, minimum, average time interval between
by users i and j respectively. Equation 7 gives the Following two consecutive tweets, total number of tweets, and number
Similarity of two users. of unique URLs tweeted.
|fi ∩ fj | For classification, we use Logistic Regression because it
F Si,j = (7) can give the estimated posterior probability for each class,
|fi ∪ fj |
which is useful for LBP. First, we train a Logistic Regression
Eventually, we define the similarity of a pair of users as classifier with a small fraction of users that are labeled man-
the average of above-mentioned similarity measures (Eqn. 5, ually and then run it on the rest of the users to estimate their
6 and 7). The three similarity measures are used to model the probabilities of being promoters and non-promoters. Let the
dependency between users whose connections do not exist in promoter class be our positive class and non-promoter class be
the original graph. If the similarity of the two users is higher our negative class. The class probability of a user is computed
than some threshold, we add a user-user edge between them. through equations 8 and 9 where k is the total number of
Intuitively, if a user is connected with a promoter, then he/she features and xj is the j-th feature.
is also likely to be a promoter. Therefore, the corresponding
user-user propagation matrix is defined in Table II(d). 1
Puser (+) = Pk (8)
−β0 − βj xj
1+e j=1
C. Node Potentials: Prior Belief Estimation Pk
e−β0 − j=1 βj xj
Node potentials or prior beliefs of different nodes in the Puser (−) = Pk (9)
network are important (as we will see in our experimen- 1 + e−β0 − j=1 βj xj
tal results in Section V) in that they help the propagation URL and Burst Prior: Using the same strategy, a URL
algorithm to converge to a more accurate solution in less can be classified into the promoted or organic class. However,
time. This section details our approach to estimate the prior labeling URLs is difficult because there are usually a large
beliefs of the states that users, URLs and bursts are in. The number of tweets containing a URL which increases the cost
estimated probabilities can help to guide our proposed model of labeling tremendously. Moreover, tweets associated with a
to learn more accurate posterior probabilities of all nodes in URL can be from both promoters and non-promoters, which
the network. further increases the labeling difficulty. On the other hand, we
can actually get reasonable estimates of class/state probabilities
User Prior: We use supervised classification to compute for URL nodes using the labels of users.
the state priors for each user node. Since promoters and non-
promoters have different goals, they differ greatly on how n+ + α
they behave. Similar to [4], we define a set of content and Purl (+) = (10)
n+ + n− + 2α
behavior features for each user. We want to learn a local n− + α
classifier from a set of labeled users to estimate the state Purl (−) = + (11)
probability distribution for the rest of the unlabeled users. n + n− + 2α
The content features include the number of URLs per tweet, If a URL is tweeted more by promoters than non-
number of hashtags per tweet, number of user mentions per promoters, it is believed to be promoted. We define promoted
tweet, percentage of retweets for each user. These features URLs as the positive class and organic URLs as the negative
are important attributes that distinguish promoters from non- class. The prior probability of a URL is calculated from
promoters. As the goal of promoters is to promote, they tend to equations 10 and 11 where n+ is the number of times a
provide as many URLs as possible in a tweet that are pertaining URL is mentioned by all the labeled promoters and n− is
to their target events or products. Therefore, the number of the number of times it is mentioned by all the labeled non-
URLs per tweet can discriminate promoters from normal users. promoters. URLs that are neither tweeted by labeled promoters
Hashtags are another type of important indicators as they are nor labeled non-promoters have equal probabilities of being in
often used in the twitter trends. There also exist promoters who the two states. Even there are much more unique URLs than
send unwanted messages to target users by mentioning their labeled users, the popular URLs in the campaign could be
usernames in the tweets. Therefore, the abuse of user mentions approximately estimated. We use Laplace smoothing to obtain
is another important feature for the learner. As opposed to a smoothed version of estimates. In our experiment, we use
promoters, normal users (non-promoters) who show interest α = 1.
in the campaign are willing to retweet, reply or give their own
opinions. Similarly, we can estimate the prior belief of a burst in two
states: planned or normal, using the same strategy. Planned
Another important set of features is the behavioral features. bursts are dominated by promoters while natural bursts by
Behavior features capture the characteristics of the two classes normal users.Algorithm 1 The overall algorithm CDC2012 CDC2013 E-cigarettes
users 3447 7896 3615
Input: A set of labeled users Utrain for training tweets 4577 11302 53417
A set of tweets D on a particular topic URLs 2262 4481 14730
The propagation matrices ψi,j (σi , σj |ti , tj ) promoters(labeled) 266 369 612
Output: Probability estimate of every user being a promoter non-promoters(labeled) 534 431 188
1: Train a classifier c from D and Utrain TABLE III: Data statistics
2: Apply c on all the unlabeled users to obtain the user priors
(node potentials): ψi (σi |ti = user)
3: Calculate URL and burst priors ψi (σi |ti = URL) and 2012 and from March to June 2013 respectively. The goal of
ψi (σi |ti = burst) using Eqn. 10 and 11. the two anti-smoking campaigns is to raise the awareness of
4: Build the User-URL-Burst graph G(V, T, E) from D the harm of tobacco smoking by telling the public the real-
5: for (vi , vj ) ∈ E do life stories of several former smokers2 . During the campaign,
6: for all states σj of vj do a large number of tweets were posted by CDC staff and
7: mi→j (σj |tj ) ← 1 people in their affiliated organizations and individuals, who are
8: end for promoters. Due to the campaigns, a large number of individuals
9: end for from the general public also tweeted about the events and
10: while not converged do involved web pages and news articles. The third dataset is
11: for (vi , vj ) ∈ E do about electronic cigarettes (or e-cigarettes) tweets that were
12: for all states σj of vj do posted from May to June, 2012, by Twitter users. We do
13: update mi→j (σj |tj ) in parallel using Eqn. 3. not know any campaign information in the third one, but our
14: end for algorithm finds a large number of promotions by different e-
15: end for cigarettes brands.
16: end while
17: Calculate the final belief of every node in all states For each dataset, we set filters to fetch all the relevant
bi (σi |ti ) using Eqn. 4. tweets from Gnip3 , the largest social media data provider
18: Output the probability of every user being a promoter (which owns the full archive of the public Twitter data).
bi (σi = promoter|ti = user). Gnip allows us to retrieve tweets using a list of filtering
rules including keyword matching, phrase matching and logic
operations. The datasets were all retrieved and cleaned by a
D. Overall Algorithm group of health scientists (the last two authors of the paper
and their research team).
Finally, we put everything together and present the overall
algorithm of the proposed detection technique, which is given In our proposed approach, we rely on user behavior features
in Algorithm 1. Line 1 trains a local classifier c using the to obtain reasonable prior estimates. So we exclude those users
available labeled training data. c is then applied to all unlabeled in our dataset who only tweeted once because little evidence
user nodes and assigns each of them a probability of being a or feature can be observed from them. Incorporating single-
promoter (line 2), which is also the node potentials of the user tweet users will be our future work. Note again that the URLs
node. Line 3 computes the node potentials for each URL node in users tweets are mostly shortened URLs due to the limits of
and each burst node using equations 10 and 11. Note that maximal 140 characters per tweet. We used a Gnip software to
the edge potentials are reflected in the propagation matrices expand the shortened URLs to their actual URLs of webpages.
in Table II. Line 4 builds the graph G. Lines 5 through 15 In our experiment, we use the expanded URLs to represent
correspond to the message passing algorithm of LBP. We URL entities or nodes in T-MRF. Table III gives the statistics
first initialize all messages to 1 and update the messages of of our three datasets after single-tweet users are removed. The
each node with messages from its neighboring nodes. The topic of CDC2013 is the same as CDC2012 but with more
normalized belief of each user node in the promoter state (line promotion efforts and more participants.
18) is the final output.
For each dataset, we manually labeled 800 users. The
V. E XPERIMENTS labeling was done with the help of the health science re-
searchers. For each user, the labeling decision was made based
We now evaluate the proposed promoter detection algo- on the features defined in Section IV-C, the list of URLs
rithm based on T-MRF. We also compare it with the algorithm he/she tweeted and intents expressed his/her tweets. For each
in [5], which is actually our local classifier, and several other experiment, we perform 5 random runs. For each run, we
baselines. Note that [5] works in the YouTube context. We randomly select 400 users for training and the other 400
adapted it to our Twitter context. The main difference is that users for testing. Each result reported below is the average
we have to use a different set of features in learning. of the 5 runs. We first use logistic regression to build a local
classifier which provides the prior beliefs of user nodes. We
A. Datasets and Settings then employ Loopy Belief Propagation to infer the posteriors
We use three Twitter datasets related to health science to of each unlabeled node in the network.
evaluate our model. The first two datasets are about two well-
known anti-smoking campaigns launched by the Centers for 2 http://www.cdc.gov/tobacco/campaign/tips
Disease Control and Prevention (CDC) from March to June 3 http://gnip.comB. Results CDC2012 CDC2013 E-cigarettes
0.05 0.10 0.15 0.05 0.10 0.15 0.05 0.10 0.15
Since our promoter detection model yields the probability
of each user’s likelihood of being a promoter, we choose to Local-LR 0.87 0.87 0.87 0.82 0.82 0.82 0.83 0.83 0.83
use the popular Receiver Operating Characteristic (ROC) curve ICA 0.88 0.88 0.88 0.86 0.86 0.86 0.84 0.84 0.84
to evaluate its performance. ROC curve is the true positive T-MRF(all-
rate (sensitivity) versus false positive rat (1 − specificity). We nodes,no-priors) 0.83 0.83 0.81 0.73 0.73 0.72 0.68 0.70 0.69
finally report the Area Under the Curve (AUC). T-MRF(user-url) 0.89 0.89 0.89 0.84 0.85 0.86 0.84 0.84 0.84
We compare the following systems. They progressively T-MRF(all-nodes,
no-user-user) 0.88 0.89 0.90 0.88 0.90 0.88 0.86 0.87 0.86
include more information in the system. The AUC values are
also given in Table IV for different 0 s. Based on the results, T-MRF(all) 0.89 0.92 0.92 0.89 0.92 0.90 0.87 0.88 0.88
we have the following observations: TABLE IV: AUC (Area Under the Curve) for each dataset,
each system and different values.
Local-LR: This is the traditional classification approach
which does not use any relationships of nodes. This method is CDC2012 CDC2013 E-cigarettes
similar to [5]. We use logistic regression (LR) as the learning youtube.com cdc.gov vaporgod.com
algorithm as it gives the class probabilities, which we also use amazon.com youtube.com bestcelebrex.blogspot.com
facebook.com cnn.com www.shareasale.com
as priors in LBP. It is poorer than all others except T-MRF with kktv.com usatoday.com www.reddit.com
no priors, which means that local classification is not sufficient drugstorenews.com blogs.nytimes.com www.prweb.com
marketingmagazine.co.uk medicalnewstoday.com www.nicotinefreecigarettes.net
and relational information is very useful for classification for adage.com cbsnews.com electronicvape.com
all three datasets. cdc.gov nbcnews.com youtube.com
howtoquitsmokingfree.com twitter.com dfw-ecigs.com
ICA: This is the classific collective classification algorithm presstitution.com news.yahoo.com ecigadvanced.com
youtube.com twitter.com purecigs.com
[37] which utilizes all relationships of nodes. We use logistic smokefree.gov cdc.gov instagram.com
regression (LR) as base learning algorithm and compared it twitlonger.com youtube.com houseofelectroniccigarettes.com
with our proposed T-MRF. As the labels of URLs and bursts cdc.gov instagram.com smokelesscigarettesdeals.com
instagram.com deadspin.com aan.atrinsic.com
are only based on a rough estimation, it does not perform as twitpic.com cnn.com smokelessdelite.com
well as our proposed final T-MRF. tmi.me soundcloud.com twitpic.com
facebook.com usatoday.com youtube.com
T-MRF(all-nodes, no-priors): This baseline uses all three yfrog.com chacha.com electroniccigarettesworld.com
chacha.com huffingtonpost.com review-electroniccigarette.com
types of nodes, but it does not use any node potential. It
thus purely replies on the network effect. Without priors, TABLE V: Most tweeted URLs by promoters (first 10) and by
for initialization every state of a node is assigned the same non-promoters (next 10) ordered by frequency
probability based on the uniform distribution of the states of
the node type. It performs the worst compared to other systems.
This is understandable because without any reasonable priors, are very helpful. From Table IV, we can see that T-MRF(all)
the system has little guidance and thus it is hard to achieve makes markedly improvements over Local-LR and T-MRF(all-
good results. nodes, no-priors).
T-MRF(user-url): This baseline uses only two types of In summary, we can conclude that the proposed T-MRF
nodes, user and URL. Burst nodes are not used in this case. method is highly effective. It remarkably improves both the
The method discussed in Section IV-C is employed to assign traditional classifier LR and relational classifier ICA across
prior probabilities to the states of each node. This baseline also all settings of . This shows that the proposed T-MRF model
uses the edge potentials for user-URL given in Section IV-B. can capture the dynamics of the problem better than baseline
It does better than Local-LR and T-MRF(all-nodes, no-priors). approaches and is also not very sensitive to the choice of .
Although this baseline does not use burst nodes, it uses the Further the performance improvement of T-MRF are statisti-
edge potentials for users and URLs, which enable the system cally significant (p < 0.002) according to a paired t-test.
to do quite well.
C. Posterior Analysis
T-MRF(all-nodes, no-user-user): This model uses all
three types of nodes. The priors are computed based on the Since our predictions are quite accurate, we want to
methods in Section IV-C. It also uses edge potentials for user- perform some analyses based on the results to gain a good
URL, user-burst and URL-burst but not user-user. We want to understanding of Twitter promotions from non-for-profit or-
single out and see the effects of user-user potentials separately, ganizations (CDC) and for-profit organizations (e-cigarettes
which is included in the final system below. It progressively companies).
improves further because burst nodes are now used and edge
potentials of user-burst and URL-burst are applied. But, in this Promoted URLs: Since our model produces the prob-
case, user-user edge potentials are not used. ability distribution for each user node as well as for each
URL, it is natural to think of ranking URLs by its probability.
T-MRF(all): This is the proposed full system, which uses However a URL with higher probability of being promoted
all three types of nodes, all priors and edge potentials. It uses does not necessarily implies its popularity. Thus, in order
all information, which represents the full proposed system. It to know which URLs/domains are being heavily promoted,
outperforms all baselines. Compared to T-MRF(all-nodes, no- we simply count the frequency of URLs being tweeted or
user-user), we see that user-user similarity based potentials retweeted by promoters and non-promoters. In Table V, we(a) CDC2013 (b) CDC2013 (c) E-cigarettes
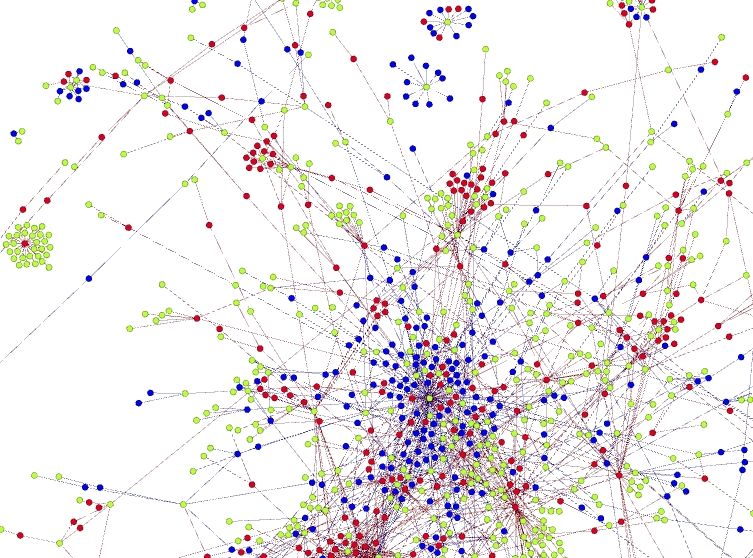
Fig. 3: Portions of network structures for promoters (red), non-promoters (blue) and URLs (green)
list the domains of URLs that are most popular among the two
classes of users respectively. It is interesting to find that for
the two CDC anti-smoking campaigns led by the government,
promoters tend to share URLs that correspond to government
sites and mainstream news websites whereas ordinary users are
more likely to include URLs from social networking services
such as Facebook, Instagram, Twitpic Tmi.me, Twitlonger,
yfrog and other new sites such as deadspin, huffingtonpost,
chacha. Campaign leaders choose to cite news articles from
authoritative websites to add credibility to their posts. Apart
from campaign tweets from promoters, there are many other
sources where non-promoters learn about the CDC campaigns
as CDC also simultaneously carried out campaigns on TV,
newspapers and some news sites. As ordinary users have
different preferences of their news sources, the popular URLs
tweeted by them are thus different from the promoted ones.
Unlike the CDC government regularized campaigns, pro- Fig. 4: Heat map of posting patterns of promoters on different
moted URLs in the e-cigarettes dataset are not from news hours of day and days of week
websites but from individual e-cigarettes companies or coupon
sites. The types of URLs from promoters and non-promoters
are similar. However, e-cigarettes campaigns are more like cigarettes campaigns are much fewer, which is understandable
a competition. Promoters are competing with each other for because few people are interested in commercial campaigns
their own benefits. Note that from the top URL domains of and would respond to them.
the promoters we find PRweb and ShareASale being quite From the network structures, we observe that promot-
different from those merchants websites. PRweb is a company ers and non-promoters in the CDC anti-smoking campaign
that distributes customers news to every major news website datasets are mostly mixed together sharing some common
and search engine on the web. ShareASale focuses on bridging URLs. While for the e-cigarettes data, we clearly see some
the gap between affiliates and merchants. Once an affiliate and pure clusters, i.e., some promoters promote a large number
a merchant are connected, the former will promote the products of URLs, and some URLs are promoted by many promoters.
of the latter and get paid based on the link click rates. Besides, promoters form different clusters as they may work
for different e-cigarettes companies.
Responses from Non-Promoters: It is interesting to see
the differences in incentives lead to different response rates Temporal Pattern of Promoters: To maximize profits
from non-promoters and different network structures as illus- from marketing campaigns, campaign leaders often hire ded-
trated in Figure 3. The ratio of the number of non-promoters icated promoters to advertise their products and services.
to promoters is much higher for the two CDC campaigns than Some of those dedicated promoters use bots to deliver ads
for the e-cigarettes campaigns (e-cigarettes data contain many to Twitter users consistently and aggressively. Real people
campaigns). Non-promoters clearly show more interests in the normally tweet at regular working hours, but Twitter bots may
two CDC campaigns because the two anti-smoking campaigns tweet randomly in all hours of the day and the night. In order
are related to their lives and they tend to tweet or retweet the to show this, we constructed a vector of 168 (= 24 × 7)
URLs from promoters. This also means that the CDC cam- elements to represent promoters’ hourly tweeting pattern for
paigns are quite successful in raising peoples awareness of the each day of week. We then aggregated the number of tweets
harm of tobacco smoking. However, non-promoters in the e- of promoters per hour per day of week and normalized thenumbers to generate a heat map in Figure 4. [14] X. Shuai, Y. Ding, J. R. Busemeyer, S. Chen, Y. Sun, and J. Tang,
“Modeling Indirect Influence on Twitter,” Int. J. Semantic Web Inf. Syst.,
We can see that promoters in the e-cigarettes dataset are vol. 8, no. 4, pp. 20–36, 2012.
sending tweets relentless in spite of even weekends and sleep- [15] N. Jindal and B. Liu, “Opinion spam and analysis,” in WSDM, 2008,
ing hours. Without the participation of bots, CDC campaigns pp. 219–230.
are organized by the government and rely on Twitter news [16] A. Mukherjee, V. Venkataraman, B. Liu, and N. S. Glance, “What yelp
hubs operated by real people who tweet more frequently in fake review filter might be doing?” in ICWSM, 2013.
working hours. These indicate that the CDC campaigns are [17] C. Phua, V. Lee, K. Smith, and R. Gayler, “A comprehensive sur-
more organic than e-cigarettes campaigns. vey of data mining-based fraud detection research,” arXiv preprint
arXiv:1009.6119, 2010.
VI. C ONCLUSION [18] M. J. Paul and M. Dredze, “You Are What You Tweet: Analyzing
Twitter for Public Health,” in ICWSM, 2011.
This paper studied the problem of identifying hidden cam- [19] G. Fei, A. Mukherjee, B. Liu, M. Hsu, M. Castellanos, and R. Ghosh,
paign promoters on Twitter who promote some target products, “Exploiting Burstiness in Reviews for Review Spammer Detection,” in
services, ideas, or messages. To the best of knowledge, this ICWSM, 2013.
problem has not been studied before in the Twitter context. [20] A. Mukherjee, A. Kumar, B. Liu, J. Wang, M. Hsu, M. Castellanos, and
Yet, it is a very important and has many practical implications R. Ghosh, “Spotting opinion spammers using behavioral footprints,” in
because every organization or business would want to know KDD, 2013, pp. 632–640.
hidden campaigns that are going on in social media in their [21] K. P. Murphy, Y. Weiss, and M. I. Jordan, “Loopy Belief Propagation
for Approximate Inference: An Empirical Study,” in UAI, 1999, pp.
industrial and from their competitors. This paper proposed 467–475.
a novel method to deal with the problem based on Markov [22] S. Ghosh, B. Viswanath, F. Kooti, N. K. Sharma, G. Korlam,
Random Fields (MRF). Since the traditional MRF does not F. Benevenuto, N. Ganguly, and P. K. Gummadi, “Understanding and
consider different types of nodes and their diverse interac- combating link farming in the twitter social network.” in WWW,
tions, we generalized MRF to T-MRF to flexibly deal with A. Mille, F. L. Gandon, J. Misselis, M. Rabinovich, and S. Staab,
any number of node types and complex dependencies. Our Eds. ACM, 2012, pp. 61–70. [Online]. Available: http://dblp.uni-
trier.de/db/conf/www/www2012.html#GhoshVKSKBGG12
experiments using three health science Twitter datasets show
[23] C. Yang, R. C. Harkreader, J. Zhang, S. Shin, and G. Gu, “Analyzing
that the proposed method is highly accurate. Its AUC value spammers’ social networks for fun and profit: a case study of cyber
reaches 0.91 on average for the three datasets. In our future criminal ecosystem on twitter,” in WWW, 2012, pp. 71–80.
work, we also plan to study hidden promotion or demotion [24] H. Gao, J. Hu, C. Wilson, Z. Li, Y. Chen, and B. Y. Zhao, “Detecting
campaigns based on tweet contents and opinions in them. and characterizing social spam campaigns,” in ACM Conference on
Computer and Communications Security, 2010, pp. 681–683.
R EFERENCES [25] K. Lee, J. Caverlee, Z. Cheng, and D. Z. Sui, “Content-driven detection
[1] B. Liu, Sentiment Analysis and Opinion Mining, ser. Synthesis Lectures of campaigns in social media,” in CIKM, 2011, pp. 551–556.
on Human Language Technologies. Morgan & Claypool Publishers, [26] X. Zhang, S. Zhu, and W. Liang, “Detecting spam and promoting
2012. campaigns in the twitter social network,” in ICDM, 2012, pp. 1194–
[2] V. Qazvinian, E. Rosengren, D. R. Radev, and Q. Mei, “Rumor has 1199.
it: Identifying Misinformation in Microblogs,” in EMNLP, 2011, pp. [27] S. Pandit, D. H. Chau, S. Wang, and C. Faloutsos, “Netprobe: a fast
1589–1599. and scalable system for fraud detection in online auction networks,” in
[3] M. Gupta, P. Zhao, and J. Han, “Evaluating Event Credibility on WWW, 2007, pp. 201–210.
Twitter,” in SDM, 2012, pp. 153–164. [28] M. McGlohon, S. Bay, M. G. Anderle, D. M. Steier, and C. Faloutsos,
[4] F. Benevenuto, G. Magno, T. Rodrigues, and V. Almeida, “Detecting “Snare: a link analytic system for graph labeling and risk detection,” in
spammers on twitter,” in Collaboration, electronic messaging, anti- KDD, 2009, pp. 1265–1274.
abuse and spam conference (CEAS), vol. 6, 2010. [29] L. Akoglu, R. Chandy, and C. Faloutsos, “Opinion Fraud Detection in
[5] F. Benevenuto, T. Rodrigues, V. A. F. Almeida, J. M. Almeida, and Online Reviews by Network Effects,” in ICWSM, 2013.
M. A. Gonçalves, “Detecting spammers and content promoters in online [30] D. Gruhl, R. Guha, D. Liben-nowell, and A. Tomkins, “Information
video social networks,” in SIGIR, 2009, pp. 620–627. Diffusion through Blogspace,” in WWW. ACM Press, 2004, pp. 491–
[6] C. Grier, K. Thomas, V. Paxson, and C. M. Zhang, “@spam: the un- 501.
derground on 140 characters or less,” in ACM Conference on Computer [31] D. M. Romero, B. Meeder, and J. M. Kleinberg, “Differences in
and Communications Security, 2010, pp. 27–37. the mechanics of information diffusion across topics: idioms, political
[7] K. Thomas, C. Grier, D. Song, and V. Paxson, “Suspended accounts hashtags, and complex contagion on twitter,” in WWW, 2011, pp. 695–
in retrospect: an analysis of twitter spam,” in Internet Measurement 704.
Conference, 2011, pp. 243–258. [32] M. Rahman, B. Carbunar, J. Ballesteros, G. Burri, and D. H. Chau.,
[8] J. Bollen, H. Mao, and A. Pepe, “Modeling Public Mood and Emotion: “Turning the tide: Curbing deceptive yelp behaviors,” in SIAM, 2014.
Twitter Sentiment and Socio-Economic Phenomena,” in ICWSM, 2011. [33] J. Pearl, “Reverend Bayes on Inference Engines: A Distributed Hierar-
[9] J. Bollen, H. Mao, and X.-J. Zeng, “Twitter mood predicts the stock chical Approach,” in AAAI, 1982, pp. 133–136.
market,” J. Comput. Science, vol. 2, no. 1, pp. 1–8, 2011. [34] J. S. Yedidia, W. T. Freeman, and Y. Weiss, “Generalized Belief
[10] E. J. Ruiz, V. Hristidis, C. Castillo, A. Gionis, and A. Jaimes, “Cor- Propagation,” in NIPS, 2000, pp. 689–695.
relating financial time series with micro-blogging activity,” in WSDM, [35] P. Du, W. A. Kibbe, and S. M. Lin, “Improved peak detection in mass
2012, pp. 513–522. spectrum by incorporating continuous wavelet transform-based pattern
[11] A. Tumasjan, T. O. Sprenger, P. G. Sandner, and I. M. Welpe, “Predict- matching,” Bioinformatics, vol. 22, no. 17, pp. 2059–2065, 2006.
ing Elections with Twitter: What 140 Characters Reveal about Political [36] D. Gayo-Avello and D. J. Brenes, “Overcoming Spammers in Twitter-
Sentiment,” in ICWSM, 2010. A Tale of Five Algorithms,” in 1st Spanish Conference on Information
[12] S. Asur and B. A. Huberman, “Predicting the Future with Social Media,” Retrieval, Madrid, Spain, 2010.
in Web Intelligence, 2010, pp. 492–499. [37] P. Sen, G. Namata, M. Bilgic, L. Getoor, B. Gallagher, and T. Eliassi-
[13] X. Liu, K. Tang, J. Hancock, J. Han, M. Song, R. Xu, and B. Pokorny, Rad, “Collective classification in network data,” AI Magazine, vol. 29,
“A Text Cube Approach to Human, Social and Cultural Behavior in the no. 3, pp. 93–106, 2008.
Twitter Stream,” in SBP, 2013, pp. 321–330.You can also read