The International Communications Market 2017 - 7 Internet and online content - Ofcom
←
→
Page content transcription
If your browser does not render page correctly, please read the page content below
The International
Communications Market 2017

     7 Internet and online content

                                130
Contents

7.1   Internet and online content: overview and key market
      developments                                                                  132
      7.1.1   The UK in context                                                     132
      7.1.2   Key market development: proliferation of connectivity and data
              collection creates new cyber-security concerns                        134
      7.1.3   Key market development: the internet is becoming the most-used
              source of news                                                        142

7.2   Connected devices                                                             147
      7.2.1   Smartphones were the most popular internet device in the majority
              of our comparator countries                                           147
      7.2.2   Smart devices are extending internet connectivity into more aspects
              of people’s lives                                                     148

7.3   Online content                                                                150
      7.3.1   Browsing                                                              150
      7.3.2   Social networking                                                     158
      7.3.3   Financial activities and e-commerce                                   161

7.4   Internet advertising                                                          166
      7.4.1   Internet advertising expenditure                                      166
      7.4.2   Consumer attitudes to internet advertising                            171

                                                                                     131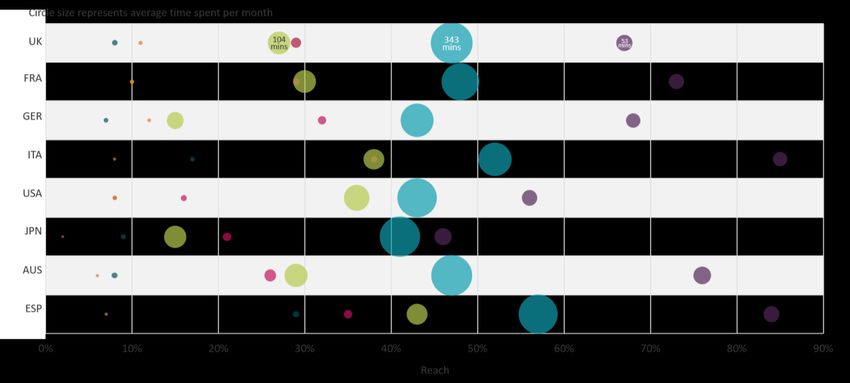
7.1 Internet and online content: overview and key market
    developments
Figure 92   Key metrics

Sources:
1 comScore MMXMP, August 2017. ‘Mobile data’ is persons 18+ for all countries and desktop data is persons 2+
    (US), 4+ (Spain) and 6+ (rest). Japan and Australia have not been included due to differences in panel
    availability.
2 comScore MMX, home & work panel, August 2017, persons 2+ (US), 4+ (Spain), 6+ (other). ComScore has data
    available for the countries indicated by n/a but we did not order it.
3 comScore MoMX, August 2017, persons 18+. ComScore has data available for the countries indicated by n/a
    but we did not order it.
4 Ofcom research, 2017 All respondents UK=1006, FRA=1038, GER=1012, ITA=1020, USA=1000, JPN=1019,
    AUS=1008, ESP=1010, SWE=1000. Q4bii: Which of the following services do you personally use either at home
    or elsewhere?
5 2016. PwC Global Entertainment and Media Outlook 2017-2021 @ pwc.com/outlook. Values converted from
    dollars to UK £ sterling ($1 = £0.74).
6 Ofcom research, 2017 All respondents UK=1006, FRA=1038, GER=1012, ITA=1020, USA=1000, JPN=1019,
    AUS=1008, ESP=1010, SWE=1000. Q9. How often do you use the internet on any of your devices for each of the
    following activities?
Desktop/laptop online universe (m) and smartphone online universe (m) includes home use and use at work,
whereas desktop use (%), laptop use (%) and tablet use (%) is based on UK households.

7.1.1 The UK in context
Ubiquitous high-speed fixed and mobile networks are enabling consumers around the world to live
more of their lives online – communicating, being entertained, buying goods and finding information.
Our need to be constantly connected has driven the proliferation of internet-connected devices, and at
the forefront is the smartphone. At least three-quarters of internet users in all the countries we
surveyed said they personally used a smartphone; 83% in the UK, which was higher than in the US
(76%), but lower than in Spain and Italy (each 90%). Smartphones are also the internet devices on

                                                                                                          132
which consumers spend the most time. According to comScore, adults in the UK spent an average of 62
hours on their smartphone in August 2017, but those in the US spent the most time, averaging 75 hours.
This compares to an average of 27 hours in the UK, and 25 hours in the US, spent using the internet on a
laptop or desktop computer.
Smartphones and tablets (personally used by 52% of UK internet users, higher than in most other
comparator countries), enable people to connect while on the move. And online video services are also
increasingly available on their television sets. Around a third of internet users in the UK (31%) reported
having a smart TV (i.e. a TV that can be connected directly to the internet); take-up was highest in Spain
(39%) and Germany (37%). Streaming sticks (such as Roku or Amazon Fire) are also widely used to
access online services on the TV set; take-up of these was highest in the UK (18%) along with Sweden
(20%) and the US (18%).
A characteristic of the internet-connected world is the prominence of the US-based online giants.
According to comScore, Google properties (including Search, YouTube and Gmail) had the highest reach
on mobile (smartphone and tablet) and on PC (laptop and desktop) in all of the countries for which we
have data, including the UK. On mobile, Facebook was the second most popular comScore property
across the comparator countries. It was also the highest-reaching social network on desktop and
mobile, across the comparators. And according to App Annie Intelligence, Facebook was prominent in
the iOS app and Google Play markets, with the most monthly active users of all our comparator
countries apart from Japan, where Asia-native LINE led the market.
The UK stands out as a nation of internet shoppers, with the highest e-commerce turnover per head
among comparator countries, at £2,175, more than double the next highest markets, Sweden (£1002)
and the Netherlands (£977). Mobile payments are adding a new dimension to online shopping: over half
of UK smartphone users checked their bank balances and purchased products online using their mobile
device in 2017. Sweden ranked first for checking bank balances online, at three-quarters of smartphone
users, while the US and Spain ranked highest for purchasing products online, at 57% and 56%
respectively.
The rising prominence of smartphones for online activities is fuelling the growth of internet advertising
revenues. Internet ad expenditure accounted for more than half of all advertising expenditure in the UK,
along with Sweden and China, for the first time in 2016. The share of mobile ad expenditure among all
internet ad spend grew in all comparator countries year on year, accounting for more than half in some
markets. It comprised 38% of internet ad spend in the UK in 2016, up from 30% in 2015. The US had the
highest proportion of mobile ad spend out of total internet ad spend, at 51% in 2016, up from 35% in
2015.
Online advertising is underpinned by the use of personal data. Our research found that a majority of
internet users in the UK (69%), and in most other countries surveyed, are concerned that online
personal information is not being stored securely by websites. A similar proportion (68% in the UK, and
a majority in most other countries surveyed) also reported that they were concerned about websites /
apps sharing their data with third parties.
In the first two sections of this chapter we look at two areas where increased internet connectivity is
affecting individuals and society; cyber-security and data privacy, and online news consumption. In the
133rest of the chapter we provide overviews comparing the UK to international comparators in: the take-up
and use of internet-connected devices; the most popular internet services on PCs and mobile devices;
the use of social networking; mobile banking and payments; internet shopping; and internet advertising.
7.1.2 Key market development: proliferation of connectivity and data collection creates
new cyber-security concerns
Overview
As more and more devices connect to the internet, everything from IoT household appliances to
government networks become potential targets for hacking. Some devices do not need even to be
connected to the internet to suffer a security breach; a wireless connection can render devices
vulnerable. In order to protect themselves, most companies set up their own secure networks through
VPNs and firewalls, but the average citizen and consumer usually rely on passwords and retail anti-virus
software.
Businesses and companies with an established online presence have protected themselves from online
threats by ensuring that their technology keeps up with the latest security offerings. But as the
landscape for cyber-security evolves, so do the threats.
Data breaches and attacks
Data breaches and attacks appear to fall into two categories:
1) Targeting personal data
Global impact: For example, in October 2017, credit monitoring company Equifax announced it had
suffered a data breach that resulted in the unlawful access of personal information of US and UK
citizens by hackers140.
Individual impact: For example, in September 2017, researchers found that Fitbit fitness trackers
were susceptible to hacking. Personal information could be accessed from the device as it was sent
to the company's cloud servers for analysis141.
Hackers can gain access to personal data by targeting the IT systems of businesses, or by targeting
individual consumers. Businesses and companies are likely to have sophisticated measures in place, but
individual consumers are likely to have only basic protection, if any, making them vulnerable. Monetary
loss can be the most obvious consequence, but stolen personal data is often more valuable to hackers
when sold on the ‘dark web’. In August 2013 Yahoo experienced a data breach compromising the
records of up to 1 billion users; three years later the information was discovered on the dark web for
sale at up to $300,000, which is when it came to the attention of Yahoo142. The WannaCry virus in May
2017 infected businesses and organisations in 150 countries including the UK's NHS systems, Spanish
incumbent telecoms provider Telefónica, and American courier and shipping company FedEx.
140
http://www.bbc.co.uk/news/technology-41737241
141
http://www.telegraph.co.uk/technology/2017/09/14/fitbit-devices-can-hacked-research-shows/
142
https://www.nytimes.com/2016/12/15/technology/hacked-yahoo-data-for-sale-dark-web.html
1342) Hacking to disrupt the running of a service
Global impact: For example, in October 2016, a distributed denial-of-service attack (DDoS)143 on
Dyn, an internet infrastructure company144, caused a number of popular websites, including
Amazon, Twitter, Spotify, Netflix and Reddit, to crash for a few hours, causing disruption for
customers.
Individual impact: For example, in July 2015, Fiat recalled 1.4 million Jeep Cherokee vehicles after
researchers remotely accessed and disabled the brakes and steering system by seizing control of a
car’s Uconnect information and entertainment dashboard while it was in transit145.
Attacks like that experienced by Dyn are intended to cause inconvenience and disrupt the operation of
online sites. The source of most attacks can usually be traced back to a computer, but the Dyn attack
was different because it targeted networks largely associated with connected devices such as digital
cameras and DVR players. The emergence of connected cars creates potential new threats: in August
2017, the UK Government issued cyber-security guidelines for connected and automated vehicles, to
ensure that security is prioritised, in order to prevent a cyber-attack such as accessing personal data or
taking control of the vehicle remotely146. Cyber-attacks can also have more serious effects than
inconvenience and disruption: the UK’s National Health service was hit by the WannaCry virus in May
2017, resulting in operations being cancelled or delayed.
143
https://www.theguardian.com/technology/2016/oct/26/ddos-attack-dyn-mirai-botnet
144
Dyn is best known for providing domain name system services that essentially help websites get from an
address like ‘ofcom.com’ to the web servers that host the pages
145
https://www.washingtonpost.com/news/the-switch/wp/2015/07/24/fiat-recalls-1-4-million-cars-vulnerable-of-
being-hacked/?tid=a_inl&utm_term=.2af90e94c764
146
https://www.gov.uk/government/publications/principles-of-cyber-security-for-connected-and-automated-
vehicles/the-key-principles-of-vehicle-cyber-security-for-connected-and-automated-vehicles
135Figure 93 Notable data breaches 2016-2017
Online data security concerns
Internet users in our comparator countries were asked about their attitudes toward cyber-security.
Overall, the findings show high levels of concern; across all countries, 63% were concerned about
136websites failing to store data securely, 62% were worried about their data being passed to third parties,
and 67% were concerned that someone might misuse their personal data.
Respondents with connected devices and/or smart appliances in their homes were even more likely to
worry about these issues, perhaps indicating that they were aware that these devices may be at risk.
Fifty-seven per cent of consumers across all countries worry about the robustness of security
measures on their devices
Despite taking steps to protect their online privacy and security, 57% of consumers across all countries
are not sure they have done enough; the figure rises to 65% of respondents who have connected
devices or smart appliances. Three-quarters of respondents in Spain (76%) felt that the measures they
had put in place were insufficient to stop someone accessing their accounts, followed by respondents in
the US (67%) and Italy (64%). Respondents in France were the least concerned, at 32%. In the UK, the
level of concern was 57%.
Analysing the findings by country, respondents in Spain were the most concerned about all the listed
threats; the highest levels of concerns were about someone gaining access to their account login details
(83% compared to the UK’s 68%); someone misusing their data (82% compared to the UK’s 69%); the
security of online payments (79% compared to the UK’s 63%); and online personal information not
being stored securely by websites (79% compared to the UK’s 69%). According to Quocirca’s report The
Trouble At Your Door147 Spain is one of the EU countries most affected by cyber-attacks. A number of
Spanish organisations featured in the top 25 of the top 40 worst cyber-attacks across Europe, with the
retail sector being most affected, followed by financial services. This may explain the high levels of
concern among respondents in Spain.
Figure 94 Levels of concern associated with data security threats: 2017
Proportion of all respondents (%)
72 73
66 67 67 69 69
63 62 65 62 62
61 59
57 55 56
51
Somebody gaining Someone misusing your The security of online Online personal Websites/apps sharing Security measures you Online ads displaying Online ads directing Online ads slowing
access to your account personal data payments information not being your data with 3rd have put in place on inappropriate content you to illicit websites or down your computer or
login details stored securely by party companies your devices not being or false information downloads mobile
websites enough to prevent
someone accessing
your account
All Countries Have connected device/ smart appliance
Source: Ofcom research 2017
Base: All respondents UK=1006, FRA=1038, GER=1012, ITA=1020, USA=1000, JPN=1019, AUS=1008, ESP=1010,
SWE=1000
Q10e. How concerned or unconcerned are you about each of the following when carrying out online activities?
147
htp://quocirca.com/content/trouble-your-door-targeted-cyber-attacks-uk-and-europe
137Figure 95 Levels of concern associated with data security threats, by country: 2017
Proportion of all respondents (%)
83
82
79
79
78
73
73
73
72
71
70
70
69
69
69
68
68
68
67
67
67
67
67
65
64
63
62
61
60
59
58
57
56
55
54
54
54
54
53
53
53
50
47
44
43
Somebody gaining access to Someone misusing your The security of online Online personal information Websites/apps sharing your
your account login details personal data payments not being stored securely by data with 3rd party
websites companies
76
71
68
67
66
64
64
63
60
59
59
58
57
57
56
54
54
54
53
53
53
52
50
50
49
48
47
47
47
46
46
46
46
46
40
36
Security measures you have put in Online ads displaying inappropriate Online ads directing you to illicit Online ads slowing down your
place on your devices not being content or false information websites or downloads computer or mobile
enough to prevent someone
accessing your account
UK FRA GER ITA USA JPN AUS ESP SWE
Source: Ofcom research 2017
Base: All respondents UK=1006, FRA=1038, GER=1012, ITA=1020, USA=1000, JPN=1019, AUS=1008, ESP=1010,
SWE=1000
Q10e. How concerned or unconcerned are you about each of the following when carrying out online activities
Prevention
Most people acknowledge that they need some form of protection to protect their personal and
financial data when using the internet. Our survey asked internet users what privacy and security
measures they had taken when going online, and found that most respondents had taken some action,
in the form of installing and running antivirus software, although this varied from 55% of respondents in
the US to 71% in Germany. Overall, respondents in Germany were also most likely to have in place each
of the listed security protection measures than any of the comparator countries such as: regularly
running software updates; regularly clearing their browsing history; having different passwords for
different accounts; using a firewall and regularly changing their passwords.
138Figure 96 Security protection measures used: 2017
Proportion of all respondents (%)
71
67
64
62
61
61
59
59
57
57
55
55
54
52
52
51
51
50
50
50
50
50
50
50
49
49
49
48
48
48
48
47
47
46
45
45
45
45
44
43
42
38
38
30
23
Install and run antivirus software Regularly run software updates Regularly clear my browsing Have different passwords for all Only use your own PC / laptop /
history my accounts mobile/ connected device when
providing personal data
51
49
48
48
45
44
44
43
43
42
41
41
41
40
40
40
40
39
39
38
38
37
37
37
37
36
36
36
35
35
35
34
32
32
32
32
31
30
30
30
25
24
22
22
9
Use a firewall Only purchase from websites Avoid using public Wifi Regularly change my passwords Back-up the data stored on my
with a secure lock icon in the devices
web address
UK FRA GER ITA USA JPN AUS ESP SWE
Source: Ofcom research 2017
Base: All respondents UK=1006, FRA=1038, GER=1012, ITA=1020, USA=1000, JPN=1019, AUS=1008, ESP=1010,
SWE=1000
Q10f. Which of the following security measures or checks, if any, do you use when going online?
Account hacking
Respondents in the US were the most likely to say that they knew someone whose account (email,
social or bank) had been hacked into (34%) and were also the most likely to have experienced it
themselves (22%). A quarter of respondents in the UK personally knew someone who had been a victim
of hacking, compared to just over one in ten (11%) who had themselves been a victim.
Figure 97 Security breaches experienced: 2017
Proportion of all respondents (%)
34
26
25
22
21
21
20
13
13
12
12
11
11
11
10
10
8
8
I know someone who has had their email, social network or online bank account accessed by an I have personally had my email, social network or online bank account accessed by an
unauthorised person unauthorised person
UK FRA GER ITA USA JPN AUS ESP SWE
Source: Ofcom research 2017
Base: All respondents UK=1006, FRA=1038, GER=1012, ITA=1020, USA=1000, JPN=1019, AUS=1008, ESP=1010,
SWE=1000
Q10g. Have you ever experienced any of the following situations?
Our research showed that, apart from in Japan, a substantial proportion of respondents across all of the
comparator countries reported having received a suspicious email or message asking them to divulge
139confidential personal or financial information. Forty-four per cent of consumers surveyed in the UK said
this had happened to them, as did more than half of respondents in France, Germany and Italy.
Seventeen per cent of consumers across the comparator countries reported having been prompted to
be careful online, either by reviewing their security settings or verifying a login from a different location,
by one of their service providers (bank, social network or e-commerce company). Consumers in Sweden
(22%), France (23%) and the US (20%) were most likely to report this, but only 14% of consumers in the
UK, Japan and Australia said they had been alerted in this way.
Internet users in the US are the most likely to have lost money through online theft and to have been
a victim of identity theft
Sixteen per cent of internet users in the US said they had lost money due to online fraud, compared to
10% in the UK. Seven per cent of consumers in the UK said they had been a victim of online identity
theft as a result of people accessing their personal information online, while the equivalent figure in the
US was 14% - at least double the figure for all the other comparator countries.
Respondents in Japan were less likely to have experienced any of the security breaches featured in the
questionnaire: 59% of respondents said they had never experienced any of the concerns listed.
Figure 98 Security breaches experienced: 2017
Source: Ofcom research 2017
Base: All respondents UK=1006, FRA=1038, GER=1012, ITA=1020, USA=1000, JPN=1019, AUS=1008, ESP=1010,
SWE=1000
Q10g. Have you ever experienced any of the following situations?
Collecting and storing of personal data
When consumers are connected to the internet via a website or an app, the devices they use to access
content online are ‘smartly’ collecting and storing information about them: their whereabouts, their
preferences, their habits. Consumers may be unaware of how this information is used by third-party
companies for targeted advertising. Many companies use algorithms which use data gathered online,
such as consumption and location history, and use the data to optimise website/app features, in order
to improve users’ experience and to recommend products and services for sale. Online properties and
third-party providers collect and aggregate data about consumers’ online activity such as first party
sign-in data (e.g. data gathered after logging into Facebook and ITV Hub), traditional demographic data
(e.g. age, gender), behavioural data (e.g. affiliation with car websites) and cookie-acquired data (e.g.
browsing history).
140Ofcom research shows that respondents feel quite protective of how their personal information is used.
Almost seven in ten (69%) consumers in the UK expressed concern that their online personal
information was not being stored securely by websites. Respondents in Spain were most concerned, at
79%, whereas those in Sweden were the least concerned, at 50%. Websites and apps that shared user
data with third-party companies were flagged as an area of concern, with 78% of respondents in Spain
and 68% in the UK feeling troubled by this.
However, of all the concerns expressed around online advertising, respondents were more anxious
about how this might slow down their devices than they were about inappropriate content or false
information.
Regulation
According to PwC148, 90% of large and 74% of small UK organisations reported suffering a data breach in
2015, so the incentive to address cybersecurity and privacy is a priority for most organisations. This
increasing concern, and the growth in online data breaches, has pushed cyber-security up the agenda
for all digital economies.
In Europe, the introduction of the General Data Protection Regulation149 (GDPR), will take effect on 25
May 2018, with the purpose of strengthening and rationalising data protection for all individuals within
the EU. It will replace the existing Data Protection Directive at EU level. The GDPR aims to address
technological advancements and capture the differing ways in which data is used and shared, from
social media platforms to targeted advertising, covering all aspects of the data lifecycle.
Outside Europe, recent laws and regulations to protect online security include:
• The USA’s Strengthening the Cybersecurity of Federal Networks and Critical Infrastructure, (May
2017) is an overarching cybersecurity law150 widening the scope laid down by the Obama
administration in 2013151.
• China’s Cyber Security Law (June, 2017) introduced a wide range of data controls.
• Japan’s Act on the Protection of Personal Information, amended in 2015 to reflect modern
society and international data protection laws, covers spam and third-party data processing
but not cookies, and does not restrict the transfer of data outside Japan.
• The Philippines’ Data Privacy Act (2012) adopted elements of the EU GDPR including the
data breach notification obligation, special requirements in relation to consents to profiling,
and a right to data portability.
149
http://ec.europa.eu/justice/data-protection/reform/index_en.htm
150
https://www.whitehouse.gov/the-press-office/2017/05/11/presidential-executive-order-strengthening-
cybersecurity-federal
151
https://obamawhitehouse.archives.gov/the-press-office/2013/02/12/executive-order-improving-critical-
infrastructure-cybersecurity
1417.1.3 Key market development: the internet is becoming the most-used source of news
In the UK and in most other countries surveyed, more people access news on the internet (including
social media) than on television
As in previous years, this section of the report uses survey data from the Reuters Institute’s Digital News
Report.152 All interviewing was conducted online, so it must be borne in mind that all respondents were
internet users, and therefore not representative of the total population of each country.
With the exception of Sweden, the survey data in all our comparator countries showed that TV is the
most-used source for news, followed by online (excluding social media). When use of social media is
added to the online sources, online becomes the main source of news in five of our countries (UK, US,
Australia, Spain and Sweden). In the UK, 74% of respondents used online sources including social media
for news, and 41% said this was their main news source. Use of online as the main news source was
highest in Sweden, where 49% of respondents nominated online as their main source of news
compared to 29% for TV.
Figure 99 Sources used for news: 2017
Used in last week
Proportion of all respondents (%)
86
85
85
81
78
77
77
77
74
74
72
71
70
70
69
69
69
66
64
63
61
60
60
59
57
54
51
48
45
44
43
41
40
39
36
36
34
33
32
27
26
26
25
25
18
Online (Excl. Social Media) Online (Incl. Social Media) TV Print Radio
UK FRA GER ITA USA JPN AUS ESP SWE
Proportion of all respondents who have accessed news in the last week (%)
59
52
50
49
44
44
43
42
41
41
40
39
39
37
36
34
32
29
29
29
28
27
26
23
23
21
19
15
11
10
10
10
9
9
8
8
7
7
7
7
6
6
5
4
4
Online (Excl. Social Media) Online (Incl. Social Media) TV Print Radio
UK FRA GER ITA USA JPN AUS ESP SWE
Source: Reuters Institute / YouGov research Jan/Feb 2017
Base: Q3 All respondents: UK=2112, FRA=2000, GER=2062, ITA=2011, USA=2269, JPN=2000, AUS=2004, ESP=2006,
SWE=2021
Q4 All who have accessed news in the last week: UK=2026, FRA=1898, GER=1950, ITA=1997, USA=2193, JPN=1902,
AUS=1914, ESP=1964, SWE=1969
Q3 Which, if any, of the following have you used in the last week as a source of news? Q4. You say you’ve used
these sources of news in the last week, which would you say is your main source of news?
152
Research was conducted online by YouGov on behalf of the Reuters Institute at the end of January and
beginning of February 2017. Results were published online and can be found here: digitalnewsreport.org
142People in the UK and Sweden are more likely to access news websites direct rather than via social
media
Respondents in the UK and in Sweden, and to a lesser extent in Germany and Japan, were more likely to
access online news by going directly to a news website or app (e.g. BBC News, Guardian, Mail online,
Huffington Post), whereas those in the other comparator countries were equally likely to access online
news via social media as by going direct to a news website.
Figure 100 Sources used for news: 2017
Proportion of respondents who used each method (%)
Direct Via social media
59
54
37 35 39 42 38 41
34 34 34 32
30 28 26
22 23
18
UK FRA GER ITA USA JAP AUS ESP SWE
Source: Reuters Institute / YouGov research Jan/Feb 2017
Base: Total sample (around 2000 in each country)
Q10: Thinking about how you got news online (via computer, mobile or any device) in the last week, which were
the ways in which you came across news stories?
Social media is widely used for news in the UK and other countries – but only 9% in the UK considered
it their main source of news, compared to 18% in the US
Spain, Sweden and the US lead in the use of social media for news; more than half of those who had
accessed any news in the past week, in each of these countries, had done so via social media. But social
media is less likely to be their main source of news; less than a fifth in each of these countries say it is
their main source.
In the UK, 41% of respondents had used social media for news in the last week, with 9% citing it as their
main source. Respondents in Australia the US (both 16%) and Spain (15%) were the most likely to cite
social media as their main source of news.
143Figure 101 Use of social media as a main source for news: 2017
Proportion of respondents who have accessed news in the last week (%)
Social media as main source for news
16 16 15
11 10
9 9
7 7
UK FRA GER ITA USA JPN AUS ESP SWE
Any use of social media for news (Proportion of all respondents) (%)
UK FRA GER ITA USA JPN AUS ESP SWE
41 38 29 49 51 29 46 58 51
Source: Reuters Institute / YouGov research Jan/Feb 2017
Base: Q3 total sample (around 2000 in each country), Q4. All in each country who used a source of news in the last
week (around 2000 in each country). Q3: Which, if any, of the following have you used in the last week as a source
of news? Please select all that apply; Q4: You say you’ve used these sources of news in the last week. Which would
you say is your main source of news?
Internet users in the US, Italy and Spain are twice as likely as those in the UK to comment on news in
social media
While respondents in Spain were the most likely to use social media for news (see Figure 101), they
were also the most likely, along with those in Italy and the US, to comment on news on social media.
This trend has decreased year on year since 2015, when it peaked at 32%. In Italy and Spain in 2017
there was a four percentage point decrease in the proportion of respondents using social media to
comment on news (to 23% in Italy and 24% in Spain).
In the UK, only 12% of respondents reported that they had commented on news using social media in
2017. Those in Japan and Germany are the least likely to do this.
144Figure 102 Commenting on news on social media: 2015-2017
Source: Reuters Institute / YouGov research Jan/Feb 2017
Q13: During an average week, in which, if any, of the following ways do you share or participate in news coverage?
Base: Total sample (around 2000 in each country)
Mobile phones are widely used for accessing news in all countries surveyed
Use of mobile phones for news was highest in Sweden (69% in the last week), Spain (61%) and the US
(57%). Half of those in the UK had used their mobile for news in the past week. When ownership of
smartphones is taken in to account [see Figure 105), smartphone users in Japan were the most likely to
use their smartphone for news (just 58% of Japanese respondents used a smartphone but 88% of these
accessed news on their mobile). The lowest level of use of a smartphone for news among smartphone
owners was in Germany, where 78% used a smartphone and 53% of these used a mobile to access
news.
Figure 103 Use of mobile phones for news: 2017
Proportion of all respondents (%)
2017
69
61
57
50 51 49
44 47
41
UK FRA GER ITA USA JAP AUS ESP SWE
Source: Reuters Institute / YouGov research Jan/Feb 2017
Base: Total sample (around 2000 in each country)
Q8b: Which, if any, of the following devices have you used to access news in the last week?
Trust in social media as a news source is lowest in the UK
There has been much in the media recently about ‘fake news’ and the extent to which various sources
of news can be trusted. Respondents were asked to what extent they felt that traditional news sources
and social media sources did a good job of separating fact from fiction.
145In all six comparator countries where this question was asked, only a minority of consumers agreed that
news media did a good job of helping me to separate fact from fiction. Forty-one per cent of UK
respondents agreed with this, higher than in the US and France, but lower than in Spain and Germany.
However, in all countries traditional news media was felt to do a better job than social media in this
respect. Trust in social media as a news source was lowest in the UK, where 18% felt that social media
sources succeed in separating fact from fiction.
Figure 104 Whether news and social media sources do a good job of separating fact from fiction:
2017
Proportion of respondents who agree (%)
News Media Social Media
44 46
41 40
38 36
33
27
24
18 20 20
UK FRA GER USA AUS ESP
Source: Reuters Institute / YouGov research Jan/Feb 2017
Base: Total sample (around 2,000 per country)
Q6_2017_1/2 The news media / social media does a good job in helping me distinguish fact from fiction.
1467.2 Connected devices
7.2.1 Smartphones were the most popular internet device in the majority of our
comparator countries
In 2017, smartphones were the most popular internet device, in all the comparator countries except
Japan. Three-quarters of consumers in the UK used smartphones, broadly in line with France (77%),
Germany (78%), Australia (77%) and Sweden (78%). Reported smartphone use was lowest in Japan153
(58%) and the US (69%), and highest in Spain (87%) and Italy (85%).
Laptops were the second most popular device among consumers in all comparator countries except
Japan, where they were the most popular device. In the UK, use of laptops was 66%, broadly in line with
Japan (66%), Australia (67%), and Italy (68%), higher than in the US (61%), and lower than in the four
remaining comparator countries.
Tablet use was highest in Spain (55%), the UK (52%) and Italy (51%). Tablet use in Japan was significantly
lower than in the other comparator countries, at 25%.
Desktops were considerably less popular than laptops across the comparator countries. Desktop use
was 39% in the UK in 2017, in line with Japan (38%) and Spain (41%), and lower than in the seven
remaining comparator countries.
Figure 105 Personal use of devices: 2017
Proportion of all respondents (%)
87
85
78
78
77
77
75
73
72
71
69
69
68
67
66
66
61
58
56
55
52
51
51
51
50
49
47
46
45
45
44
43
41
39
38
25
Smartphone Tablet Laptop Desktop
UK FRA GER ITA USA JPN AUS ESP SWE
Source: Ofcom research 2017
Base: All respondents UK=1006, FRA=1038, GER=1012, ITA=1020, USA=1000, JPN=1019, AUS=1008, ESP=1010,
SWE=1000
Q4a. Which of the following devices do you personally use either at home or elsewhere?
153
Use of connected devices in general was lowest in Japan and is believed to be due to language and translation
issues. The term 'smartphone', used when conducting the research, is not widely used in Japan; these phones are
referred to as 'feature phones'.
1477.2.2 Smart devices are extending internet connectivity into more aspects of people’s lives
Smartphones allow individuals to connect with the world around them in myriad ways; they are often
the one device relied on most for accessing the internet.154 They are also increasingly used as an
interface to manage other connected devices, using an internet, wifi or Bluetooth connection. There are
numerous apps that allow users to connect to appliances in their homes via a smartphone, including:
Ring - a video doorbell that lets users answer the door from anywhere;
Nest Thermostat - allows users to programme their heating and hot water remotely;
Nest Protect - a smoke and carbon monoxide detector that alerts the user when something is
wrong when they are away from home;
Samsung Connect - allows users to remotely control Samsung devices; e.g. TV, washing machine,
fridge/freezer; and
Abode Connected Home Security – which has sensors to detect open door/ open window, motion
detector with camera, key fobs and keypads.
We asked internet users in seven countries about their use of smart devices. Take-up was generally low:
apart from wearable fitness/ health monitors, use of smart devices was generally less than 10% across
the surveyed countries. For respondents in the UK, of the seven smart devices asked about, the
consumers’ most-used smart device was a wearable fitness/ health monitor such as a Fitbit or Garmin
(but take-up was still relatively low, at 12%). Consumers in Australia had the highest use, at 14%,
whereas consumers in France had the lowest use, at 6%. Among the comparator countries, of the seven
smart devices asked about, smart fitness monitors were the most-used smart devices overall whereas
smart speakers (such as Amazon Alexa/ Echo or Google Home) were generally the least used. Use of
smart speakers was highest in the US at 10%, which may be because these devices were released in the
US first.
Overall, respondents in Spain and Italy had the highest level of use of the seven smart devices that we
asked about; 36% of respondents in each country claimed to use at least one of the seven smart devices
that we asked about (compared to 28% of respondents in the UK).
154
Figure 5.1, https://www.ofcom.org.uk/__data/assets/pdf_file/0017/105074/cmr-2017-uk.pdf, p.165
148Figure 106 Smart devices personally used: 2017
Proportion of all respondents (%)
23
21
21
21
20
20
19
18
18
17
16
15
15
15
14
14
13
13
12
12
12
12
11
11
11
11
11
11
11
10
10
10
10
9
9
9
9
8
8
7
7
7
7
7
7
7
7
7
6
6
6
6
6
6
6
6
5
5
4
4
4
4
4
Car with connected Smart thermostat, Smart home Smart appliances Smart watch (e.g. Wearable fitness / Smart speakers
features heating or lighting monitoring, such as Apple watch) health monitor that (Amazon
controls security systems/ connects with your Alexa/Echo, Google
CCTV mobile phone, Home)
tablet or laptop
(e.g. Fitbit, Garmin)
UK FRA GER ITA USA JPN AUS ESP SWE
Source: Ofcom research 2017
Base: All respondents UK=1006, FRA=1038, GER=1012, ITA=1020, USA=1000, JPN=1019, AUS=1008, ESP=1010,
SWE=1000
Q4a. Which of the following devices do you personally use, either at home or elsewhere?
Although use of these devices is currently low, our research found that among those who did not own
any of the seven listed smart devices, a large proportion were highly interested in acquiring them.
Overall, consumers in the US and Italy showed the most interest in owning each of the devices. In the
UK, among those who did not own a smart device, about one in five said they would be interested in
doing so. Consumers in Japan without these devices were the least interested in acquiring them,
reflecting the fact that they had the lowest usage levels (see Figure 107)
149Figure 107 Interest in ownership of smart devices: 2017
Proportion of respondents without the named product/service (% who rated interest as 8-10)
77
77
76
73
68
68
67
66
63
61
60
59
58
58
57
57
57
57
57
56
56
56
55
55
55
55
54
54
53
53
53
52
51
51
49
49
49
49
49
48
48
48
47
46
45
44
44
44
44
44
43
43
42
40
39
39
39
38
38
35
34
32
30
Car with connected Smart thermostat, Smart home Smart appliances Smart watch (e.g. Wearable fitness / Smart speakers
features heating or lighting monitoring, such as Apple watch) health monitor that (Amazon
controls security systems/ connects with your Alexa/Echo, Google
CCTV mobile phone, tablet Home)
or laptop (e.g. Fitbit,
Garmin)
UK FRA GER ITA USA JPN AUS ESP SWE
Source: Ofcom research 2017
Base: All those without the specified device (varies by type) - UK=865-954, FRA=933-1001, GER=877-960, ITA=821-
907, USA=832-915, JPN=814-983, AUS=829-956, ESP=791-906, SWE=896-943
Q4. How interested are you in owning the following types of products yourself?
7.3 Online content
7.3.1 Browsing
UK ranked third for the amount of time spent browsing on laptops or desktop computers
In the UK, smartphone owners spent 62 hours on average using the internet on their device in August
2017, ranking third among the comparator countries. Smartphone users in the US spent the most time
online, at 75 hours. Among the comparator countries for which figures were available, average time
spent on the internet was considerably higher on a smartphone than on a laptop or desktop computer.
This is despite the fact that laptop and desktop internet browsing may include internet use at work. In
the US, the average time spent browsing on a smartphone is three times higher than for a laptop or
desktop.
Among the comparator countries, internet users in Japan spent the longest on a laptop or desktop
computer in August 2017, averaging 29 hours. The UK and the US were second and third, at 27 and 25
hours respectively.
150Figure 108 Average time spent browsing on a smartphone: August 2017
Hours per month
Source: comScore MoMX, August 2017, adults 18+, browsing and application combined.
Note: The UK, the US, Italy, France, Germany and Spain have not been compared with the remaining comparator
countries on mobile, due to differences in panel availability. All figures have been rounded to the nearest whole
number.
Figure 109 Average time spent browsing on a laptop or desktop computer: August 2017
Hours per month
Source: comScore MMX, home & work panel, August 2017, persons 2+ (US), 4+ (Spain), 6+ (other)
Note: All figures have been rounded to the nearest whole number.
Google-owned sites had the highest reach on desktop and laptop computers in all but one of our
comparator countries in August 2017
Google’s properties (which include Google Search, as well as services such as Gmail and YouTube) had
the highest reach in all comparator countries, with the exception of Japan (where Yahoo Japan had the
highest reach).155 Microsoft properties (which include MSN, Bing Search, websites for Microsoft Office,
155
comScore ‘Properties’ represent all ‘Full Domains’ (e.g. felmont.com), ‘Pages’ (e.g. sports.felmont.com/tennis),
‘Applications’ and ‘Online Services’, under common ownership or majority ownership for a single legal entity. A
‘Property’ may also contain digital media content that is not majority-owned but has been legally signed over for
reporting purposes by the majority owner.
151Outlook and Windows, and desktop apps such as Skype Instant Messenger and the media player app
Zune) were among the top three in all comparator countries.
The high ranking of Microsoft sites may have been boosted by the fact that the data includes work use,
for which Outlook and Microsoft Office websites are often used. However, the average time spent per
person on Microsoft sites was often less than on those with lower reach, such as Yahoo sites, in all
comparators apart from Japan, and Facebook in all comparators apart from Italy and Japan. This could
be because MSN and Bing are often used for default home pages and search functions. Facebook
ranked third in the majority of countries, with the exceptions of Italy, where it ranked second, the US,
where it ranked fourth and Japan where it ranked ninth.
As in August 2016, domestic media and publishing services such as the BBC in the UK, CBS Interactive
(US), Hubert Burda Media (Germany) and Vocento (Spain) featured among the top ten properties in
their home countries in August 2017. A government property appeared only in the UK (GOV.UK),
although the average time spent per person on the site was comparatively low. Its high reach could
reflect its use as a central point for government services online, but the low amount of time spent
suggests that users are looking for specific queries when visiting.
Wikimedia Foundation sites, which include wikipedia.org, ranked within the top ten in four countries,
but average time spent was only around 10 minutes, again suggesting that people are looking quickly
for specific pieces of information on these sites. In contrast, in each comparator country apart from
Japan, Facebook ranks among the top two properties for average time spent per person, at more than
200 minutes in August 2017, reflecting users’ high engagement levels with social media content.
Figure 110 Top ten properties accessed on a laptop/ desktop computer, ranked by reach: August
2017
Source: comScore MMX Properties, home and work panel, August 2017, persons 2+ (US), 4+ (Spain), 6+ (other)
152In all comparator countries, Google Search had the highest reach among Google-owned sites for
desktop / laptop users.
Looking at Google entities individually156, 67% of all people in the UK browsing on desktops or laptops
used Google Search in August 2017. In all comparator countries apart from Japan, Google Search
reached more than half of the online population (on desktop / laptop). While Google Search had the
widest reach, visitors to YouTube ranked highest for average time spent; people in the UK spent more
than six times as long on YouTube as they did on search in August 2017 (343 minutes on average vs. 53
minutes).
There were regional differences in how the Google sites ranked. For instance, in most comparator
countries, Blogger, a blog-publishing service, had more desktop / laptop users than Google Shopping,
but this was not the case in Germany or the UK. In the UK this may relate to the high level of e-
commerce spend per head (Figure 121), although average time spent per person on Blogger was still
higher in both countries than on Google Shopping (6.5 minutes on average per person in the UK and 4.1
minutes in Germany, versus 3.4 and 2.7 minutes respectively on Google Shopping).
Figure 111 Top Google sites by unique desktop / laptop visitors, with average time spent per person
per month: August 2017
Source: comScore MMX, home & work panel, August 2017, persons 2+ (US), 4+ (Spain), 6+ (other). [M] indicates a
Media Title. [C] indicates a Channel
156
ComScore defines web entities that sit within its ‘Properties’ as a Media title [M], Channel [C], SubChannel [S]
or SubGroup [G]. A Media Title is an editorially and brand-consistent collection of content in the digital landscape
that provides the marketplace with a view of online user behaviour. This may represent a domain, a group of
domains, online service or application. Within a Media Title there may be grouped URLs of editorially consistent
content that make up a Channel. For some of the largest Media Titles, Channels themselves may be broad, and
Subchannels, Groups and Subgroups within the larger Channels may prove useful for categorisation within the
comScore Dictionary.
153US recording companies feature strongly on the highest-reach YouTube networks
Multichannel networks157 are made up of a range of media brands or independent content creators and
rank highly on YouTube channel lists. For example, Broadband TV, a Canadian multichannel network
owned by RTL group, has the highest reach of viewers in five of the eight comparator countries.
Broadband TV provides services including promotion, ad sales and design for a broad spectrum of
clients including NBA and Sony Pictures, as well as for independent creators.
Music channels appear prominently in the top ten highest-reach YouTube networks across all
comparator countries. With the exception of France and Japan, the ‘big three’ American recording
companies (Warner Music, Sony BMG and Universal Music Group) are all in the top five highest-reach
YouTube networks in each comparator country. They have additional presence through Vevo, a video
hosting service that publishes content from all three companies. Sony is also represented through its
property The Orchard, a multichannel network with a portfolio of 1,000 music and entertainment
channels. Vevo is among the top ten widest-reaching companies in every country. Looking at the music
networks in the top ten, Vevo has the highest viewer engagement levels (average minutes spent per
person per month) among the comparators. For instance, in the UK, the average time spent per person
per month on Vevo was 83.3 minutes in August 2017. Since videos on Vevo tend to be just a few
minutes long, this suggests that viewers are watching multiple videos in a given time period. American
channels are prevalent across the comparator countries, while no British companies appear in the top
ten YouTube networks, even in the UK.
Japan’s top ten highest-reach YouTube networks lean more towards local providers, such as music
networks avex, Victor and Sony Music Japan. Vlogging network channels UUUM Network and uuum are
the second and fourth highest-reach YouTube networks in Japan. uuum has the highest average minutes
spent per person, of all the top networks across the comparator countries, at 125.8 minutes per person
per month. While music channels tend to make the top five highest-reach YouTube networks, viewers
often spend more time watching networks that are not focused on music content. This may reflect the
fact that music videos tend to be shorter than other forms of video content. For instance, in the UK,
Style Haul, a multichannel network which focuses on fashion and lifestyle, is at the bottom of the list, in
tenth position in terms of reach, but has the highest average monthly minutes spent per person.
Similarly, Machinima, which has a core focus on video games, is the tenth highest reaching network in
both the US and Spain, but ranks third highest for average minutes spent per person in these countries.
This suggests that viewers are highly engaged with the content on these channels, which is likely to
appeal to advertisers.
157
Multi-channel networks are third-party service providers that affiliate with multiple YouTube channels to offer services that
may include audience development, content programming, creator collaborations, digital rights management, monetisation
and/or sales.
154Figure 112 Top ten YouTube networks on desktop or laptop, by reach: August 2017
Source: comScore VMX, August 2017, persons 2+ (US), 4+ (Spain), 6+ (other). [M] indicates a Media Title. [C]
indicates a channel.
Google-owned sites and Facebook were the most popular destinations on mobile in all comparator
countries in August 2017
As on desktops, Google sites had the most unique visitors on mobiles across all comparator
countries.158 Facebook ranked second on mobile, while on desktop, Microsoft sites ranked second in all
comparator countries apart from Japan and Italy. This further supports the suggestion that many
Microsoft site users are browsing within default desktop settings. Facebook’s higher prominence on
mobile reflects its shift to a mobile-first strategy in 2012; the company now generates 88% of its
advertising revenue via mobile.159 In August 2017 the company rolled out ‘Facebook Watch’, which
hosts original video content (in the mobile app only) to users in the US.160 Mobile users in Germany,
Italy and Spain still spent more time on average on Facebook than those in the US.
Certain media groups and multimedia publishing groups were also more prominent on mobile devices
than on desktop, notably in the UK. Here, as in Italy and Spain, media sites that did not appear in the
top ten on desktop / laptop – such as Trinity Mirror Group, News UK, Sky, Mail Online (all UK); Gruppo
Editoriale Espresso, Gruppo Mediaset (Italy); and Grupo Godo and Altresmedia (Spain) – made the list
on mobile. Some groups featured on both lists, such as RCS MediaGroup – Italian Digital Media (Italy),
RCS MediaGroup – Unidad Medios Digitales (Spain) and Gruppo Mondadori (Italy).
158
The UK, the US, Italy, France, Germany and Spain have not been compared with the remaining comparator
countries on mobile, due to differences in panel availability.
159
Facebook Q3 earnings report, 2017, https://s21.q4cdn.com/399680738/files/doc_financials/2017/Q3/Q3'17-
Earnings-Release.pdf
160
https://media.fb.com/2017/08/09/introducing-watch-and-shows-on-facebook/
155Figure 113 Top ten properties by reach accessed on smartphone and tablet, ranked by reach: August
2017
Source: comScore MoMX, August 2017, persons 18+. France is not strictly comparable as tablet is not measured.
Note: The UK, the US, Italy, France, Germany and Spain have not been compared with the remaining comparator
countries on mobile, due to differences in panel availability.
In August 2017, WhatsApp was the most popular app on iOS in the UK, Germany and Italy, with apps
owned by Facebook topping the charts globally
According to App Annie data, Facebook topped the iOS app market in August 2017, in terms of both
monthly active users and downloads from the App Store, reflecting the success of its mobile-first
strategy. At least three Facebook-owned apps (including WhatsApp, Facebook Messenger, Facebook
and Instagram) appeared in the top ten apps for monthly active users in all available countries. Across
all the comparators with the exception of Japan, Facebook or WhatsApp had the most monthly active
users (MAU).
When looking at Japan’s top apps by MAU, the US tech giants such as Facebook, Google and Amazon
appear fairly prominently alongside local companies. While data on internet users in China is
unavailable, China and Japan’s download charts leaned more towards local developers, with Google
Maps appearing only once in their iOS download charts (tenth place in Japan) and Facebook-owned
apps not at all. China’s top ten was reasonably evenly distributed between messaging, games, video
sites and e-commerce. E-commerce apps, including AliPay, Taobao and Pinduoduo, appear most
prominently in the top ten iOS apps in China. Similar apps appeared elsewhere only twice in other
markets (Joom, seventh in France, and Amazon, ninth in Italy).
Games dominated Japan’s top ten downloads, accounting for eight apps. In all countries, games were
more prevalent in the top ten downloads than top ten apps by MAU, appearing four times in the UK, for
instance. While games may experience sudden surges in popularity, underlying MAU data suggests that
the appeal of entertainment and utility apps, such as music players, e-commerce and – notably –
156messengers, is more enduring. Messenger apps have risen up the ranks for downloads since August
2016, when augmented reality game, Pokémon GO held first or second place in all comparator
countries. In seven of the eight markets where download data was available, messenger apps –
including Snapchat, QQ and newcomer Sarahah – appeared in at least the top two.
Figure 114 Top 10 iOS apps, by downloads and monthly active users: August 2017
Source: App Annie Intelligence
Facebook-owned messengers also topped the charts on Google Play in six comparator countries
Facebook-owned messengers also appeared prominently in the Google Play charts, with WhatsApp or
Facebook Messenger taking first place in six of seven available countries for MAU and downloads.
Because popular Google apps, such as Google Maps and YouTube, often come pre-installed on Android
phones, they did not appear at all. Messenger apps and games were popular, as in the iOS market, but
e-commerce apps – including Leboncoin, eBay Kleinanzeigen, Amazon, Wish and Wallapop – appeared
much more prominently on Android.
157Apps for reading and writing – such as Microsoft Word and Adobe Acrobat DC – were also relatively
popular in terms of monthly active users, while they did not appear at all in the iOS charts. News and
weather apps were also more frequently downloaded on Android, which could be due to iOS utility apps
coming pre-installed on iPhone.
Figure 115 Top ten Android apps, by downloads and monthly active users: August 2017
Source: App Annie Intelligence
7.3.2 Social networking
Respondents in Spain and Italy led in weekly access to social networks, with around three-quarters of
internet users in the UK using social networks at least once a week
The majority of internet users said they accessed social networks at least once a week in all of our
comparator countries. Weekly access was highest in Spain (86%) and Italy (83%), compared to 73% in
the UK. Japan had the fewest active social networkers of all the comparator countries, with half of
respondents (51%) using social media sites at least once a week. In the majority of the comparator
158countries the proportion of weekly social networkers remained broadly stable between 2016 and 2017.
The largest increase was in the US, up from 76% to 80%.
Figure 6.12 Weekly access to social networks 2016-2017
Figure 116 Weekly access to social networks: 2016-2017
Proportion of all respondents (%)
2016 2017
86
85
83
82
80
77
76
74
74
74
73
73
71
70
64
64
53
51
UK FRA GER ITA USA JPN AUS ESP SWE
Source: Ofcom research 2017
Base: All respondents UK=1006, FRA=1038, GER=1012, ITA=1020, USA=1000, JPN=1019, AUS=1008, ESP=1010,
SWE=1000
Q9. How often do you use the internet on any of your devices for each of the following activities?
In all comparator countries, Facebook reached the majority of the online population on both mobile,
desktop and laptop
Facebook.com was the widest-reaching social network among the online population on mobile
(including tablet and smartphone), desktop and laptop across the comparators in August 2017,
reaching 90% of the online and mobile population in the US.161 The reach of Facebook was considerably
higher on mobile than on desktop and laptop across the comparators, apart from in Italy and Spain,
where it was broadly similar. The reach of Instagram and Snapchat was considerably higher on mobile
across the comparators, reflecting Facebook’s ‘mobile-first’ company strategy. Instagram was popular
across the comparators, ranking second in terms of reach on both mobile and desktop/laptop in
Germany and Italy. When considering mobile alone, it ranked second in all comparator countries.
Twitter maintained a relatively high reach, and was the second most far-reaching social network in the
UK and Japan among the online population on desktop and laptop. In the UK and the US, it reached
almost half of all online and mobile users. Snapchat’s reach on mobile varied across the comparator
countries: in the US it reached half of the online and mobile population, and it reached about a third of
online and mobile users in the UK and France. In the remaining countries it reached less than 10% of
users. Pinterest was the least popular social network across the comparators, apart from in France,
161
Facebook.com [C] has the highest reach compared to Instagram.com [M], Twitter.com [M], Google+ [C],
Pininterest.com [M], Linkedin.com [M] and Snapchat.com [P]. [M] indicates a Media Title, [C] indicates a channel.
Source: comScore MMXMP, August 2017
159You can also read