2014 Air Quality Progress Report for Aberdeen City Council - In fulfillment of Part IV of the Environment Act 1995 Local Air Quality Management ...
←
→
Page content transcription
If your browser does not render page correctly, please read the page content below
2014 Air Quality Progress Report for
Aberdeen City Council
In fulfillment of Part IV of the
Environment Act 1995
Local Air Quality Management

October 2014

Aberdeen City Council

   Local Authority
                            Aileen Brodie/Nick Glover
   Officer

   Department               Environmental Health & Trading Standards
                            Aberdeen City Council, Marischal College,
   Address                  Business Hub 15, Broad Street, Aberdeen
                            AB10 1AB
   Telephone                01224 523737
   e-mail                   poll@aberdeencity.gov.uk

   Report Reference
                            001
   number
   Date                     October 2014

LAQM Progress Report 2014                                                   1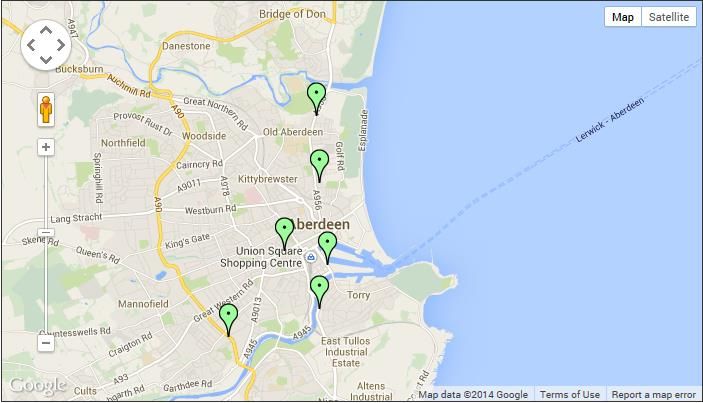
Aberdeen City Council

Executive Summary
This Progress Report has been undertaken to fulfil Aberdeen City Council’s duty to
annually review and assess air quality. The Report provides the latest monitoring
results and discusses the implications for air quality management in Aberdeen. In
writing the Report, the Council has regard to the Government’s published technical
guidance LAQM.TG(09).

In 2013 the annual mean nitrogen dioxide level (NO 2) continued to exceed the
national air quality objective across the City Centre and Wellington Road Air Quality
Management Areas (AQMA). Pockets of exceedances were also recorded within the
Anderson Drive/Haudagain Roundabout/Auchmill Road AQMA. Levels at monitoring
locations were generally similar to previous years but with decreases in levels at
Union Street and Wellington Road.
There were no exceedances of the NO2 1 hour objective at the continuous monitoring
sites although diffusion tube data suggested potential exceedances at specific
locations in the City Centre AQMA and Anderson Drive/Haudagain
Roundabout/Auchmill Road AQMA. Diffusion tubes located outwith the AQMAs did
not record any exceedances of the annual mean NO2 objective.
The annual mean PM10 objective was exceeded at Wellington Road, Market St,
Union Street and King Street. The objective was met at Errol Place and Anderson
Drive. Concentrations at Anderson Drive and Wellington Road have remained
steady over the period 2009-2013, however there has been a slight increase in levels
at both King Street and Union Street.

Market Street recorded exceptionally high annual mean PM10 concentrations and
daily exceedances of the air quality objective. Meteorological data strongly suggests
that the predominate cause of the high levels was unusual local climatic conditions,
particularly during March and April 2013.

Annual Average daily traffic flow data at Market Street showed a marginal increase in
all vehicles in 2013 compared to 2012. The increased flow is unlikely to be a
significant factor in the increased PM10 exceedences.

King Street exceeded the annual mean objective by 1ugm-3 in 2011, 2012 and 2013.
The King Street site is outwith the existing AQMAs. During 2012 it became apparent
that the BAMs at both Market Street and King Street were recording significantly
elevated levels during prolonged periods of wet weather or sea mist in the area. A
heat exchanger was installed at the Market Street site, however there may still be
some influence from meteorological conditions on PM10 concentrations.

The 24-hour objective was met at Errol Place, Union Street, Wellington Road,
Anderson Drive and King Street.

The 2013 monitoring data indicates the current AQMAs remain valid and Aberdeen
City Council has no proposals to undertake any Detailed Assessments during 2014.
PM10 concentrations at King Street will continue to be assessed and the need for
further action will be considered in future Progress Reports.

LAQM Progress Report 2014                                                          2
Aberdeen City Council

This Progress Report includes information on the implementation of the measures
within the 2011 Air Quality Action Plan. Significant progress has been made in the
development of the Car Club, the integration of air quality within planning policies and
initial steps in the development of a City Centre Masterplan, including a potential Low
Emission Zone or Strategy.

There were no new developments or other sources of pollution introduced in
Aberdeen during 2013 likely to have had a significant impact on local air quality.

LAQM Progress Report 2014                                                             3
Aberdeen City Council

Table of Contents

1    Introduction                                                               7
     1.1    Description of Local Authority Area                                 7
     1.2    Purpose of Progress Report                                          7
     1.3    Air Quality Objectives                                              8
     1.4    Summary of Previous Review and Assessments                         10
2    New Monitoring Data                                                       19
     2.1    Summary of Monitoring Undertaken                                   19
     2.2    Comparison of Monitoring Results with Air Quality Objectives       27
3    New Local Developments                                                    47
     3.1    Road Traffic Sources                                               47
     3.2    Other Transport Sources                                            47
     3.3    Industrial Sources                                                 47
     3.4    Commercial and Domestic Sources                                    47
     3.5    New Developments with Fugitive or Uncontrolled Sources             48
4    Local / Regional Air Quality Strategy                                     49
5    Planning Applications                                                     50
6    Air Quality Planning Policies                                             51
7    Local Transport Plans and Strategies                                      52
8    Climate Change Strategies                                                 54
9    Implementation of Action Plans                                            55
10 Conclusions and Proposed Actions                                            74
     10.1    Conclusions from New Monitoring Data                              74
     10.2    Conclusions relating to New Local Developments                    74
     10.3    Other Conclusions                                                 75
     10.4    Proposed Actions                                                  75
11 References                                                                  76

LAQM Progress Report 2014                                                        4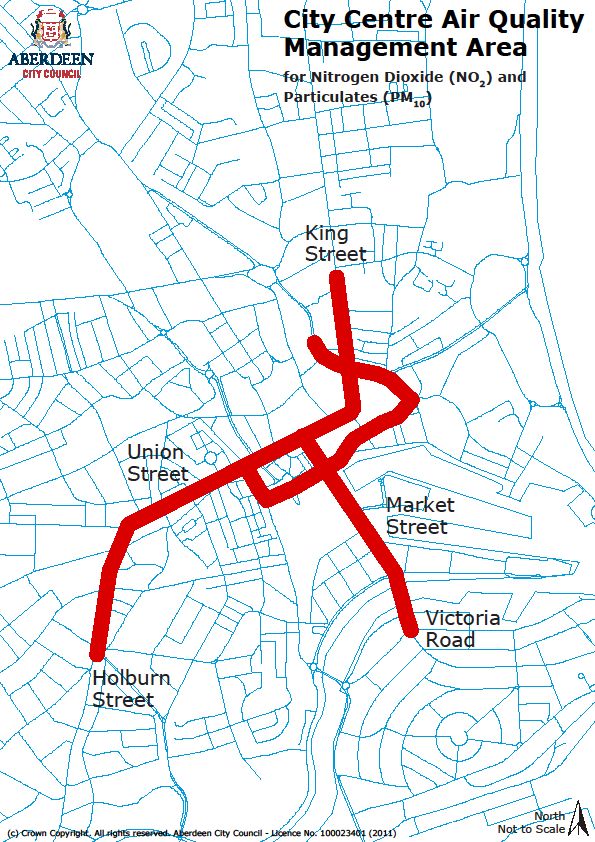
Aberdeen City Council
List of Tables
Table 1.1 Air Quality Objectives included in Regulations for the purpose of
Local Air Quality Management
Table 1.2 Summary of Air Quality Reports and Outcomes
Table 2.1 Details of Automatic Monitoring Sites
Table 2.2 Details of Non-Automatic Monitoring Sites
Table 2.3 Results of Automatic Monitoring for Nitrogen Dioxide:
Comparison with Annual Mean Objective
Table 2.4 Results of Automatic Monitoring for Nitrogen Dioxide:
Comparison with 1 hour Mean Objective
Table 2.5 Results of Nitrogen Dioxide Diffusion Tubes 2013
Table 2.6 Results of Nitrogen Dioxide Diffusion Tubes 2009-2013
Table 2.7 Results of PM10 Automatic Monitoring: Comparison with Annual
Mean Objective
Table 2.8 Results of PM10 Automatic Monitoring: Comparison with 24-hour
Mean Objective
Table 2.9 Results of PM2.5 Automatic Monitoring: Comparison with Annual
Mean Objective
Table 2.10 Results of Automatic Monitoring for Ozone: Comparison with
Annual Mean Objective
Table 5.1 Planning Applications with Potential Air Quality Impact
Table 9.1 Action Plan Progress
Table A1 Bias Factor Calculations
Table B1 Measured 4-Weekly Diffusion Tube Data
Table B2 Annual Mean Bias Adjusted Diffusion Tube Data and Correction
to Façade
Table B3 Diffusion Tube Concentrations Showing Calculations to Façade
List of Figures
Figure 1.1 Map of City Centre AQMA
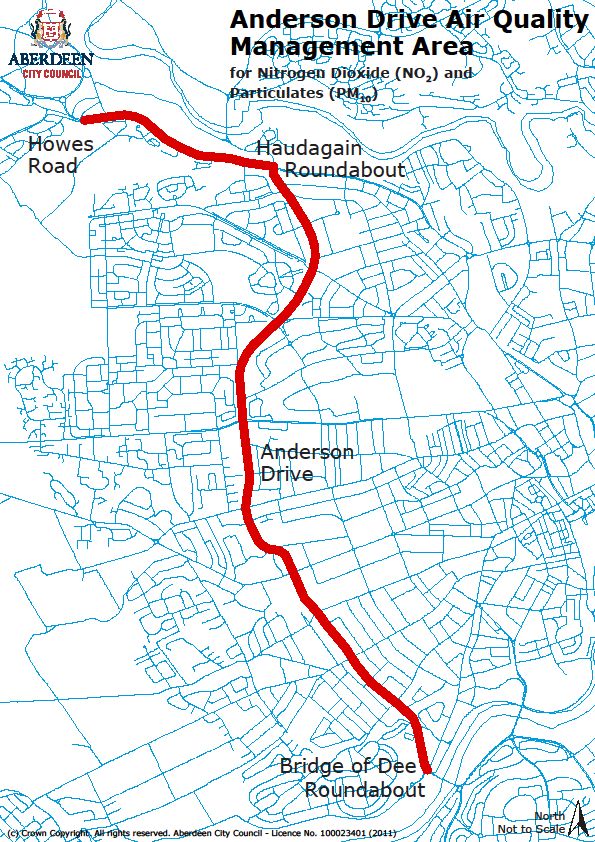
Figure 1.2 Map of Anderson Drive/Haudagain roundabout/Auchmill Road
AQMA
Figure 1.3 Map of Wellington Road AQMA
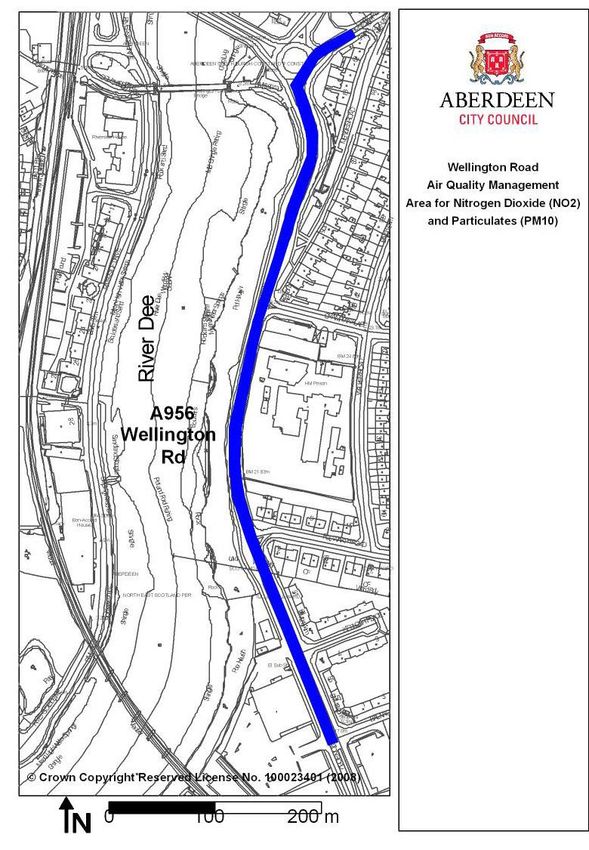
Figure 2.1 Map of Automatic Monitoring Sites
Figure 2.2 Trends in Annual Mean NO2 concentrations measured at
Automatic Sites
Figure 2.3 Trends in Annual Mean PM10 concentrations measured at
Automatic Sites 2009-2013
LAQM Progress Report 2014 5Aberdeen City Council
Figure C1 Wind direction and PM10 data trend at Market Street continuous
monitoring station 2013
Figure C2 Polar plot of wind speed and direction and PM10 concentrations
at Market Street continuous monitoring station 2013
Appendices
Appendix A QA/QC Data
Appendix B Diffusion Tube Data and Calculations
Appendix C Wind speed and direction and PM10 Data Trend at Market Street
continuous monitoring station 2013
LAQM Progress Report 2014 6Aberdeen City Council 1 Introduction 1.1 Description of Local Authority Area Aberdeen is situated on the east coast of Scotland by the North Sea and has a population of 220,000. The city acts as a focus for employment, service and leisure activities both for residents of Aberdeen and the surrounding area. There is little heavy industry within the city and much of the economy is based around services to the oil industry. Road traffic is the main source of atmospheric pollution. Aberdeen’s road transportation system is constrained by the River Dee to the south of the city and the River Don to the north therefore there are limited routes to either arrive at or pass around the city. Construction of a Western Peripheral Route around the city commenced in 2014, and completion is anticipated by 2018. The A90 and A96 trunk roads, A93 North Deeside Road, A956 Ellon Road and A956 Wellington Road are the most significant routes to converge or pass through the city centre. Much of the commuter traffic entering the city comes from the neighbouring Aberdeenshire. Aberdeen Harbour is located in the city centre and is a thriving environment acting as the UK’s main base for supply vessels to offshore installations. There are also regular ferries to The Shetland and Orkney Islands. Aberdeen Airport (Dyce) is located around 7km to the northwest of the city. 1.2 Purpose of Progress Report This report fulfils the requirements of the Local Air Quality Management (LAQM) process as set out in Part IV of the Environment Act (1995), the Air Quality Strategy for England, Scotland, Wales and Northern Ireland 2007 and the relevant Policy and Technical Guidance documents. The LAQM process places an obligation on all local authorities to regularly review and assess air quality in their areas, and to determine whether or not the air quality objectives are likely to be achieved. Where exceedences are considered likely, the local authority must then declare an Air Quality Management Area (AQMA) and prepare an Air Quality Action Plan (AQAP) setting out the measures it intends to put in place in pursuit of the objectives. Progress Reports are required in the intervening years between the three-yearly Updating and Screening Assessment reports. Their purpose is to maintain continuity in the LAQM process. They are not intended to be as detailed as Updating and Screening Assessment Reports, or to require as much effort. However, if the Progress Report identifies the risk of exceedence of an Air Quality Objective, the Local Authority (LA) should undertake a Detailed Assessment immediately, and not wait until the next round of Review and Assessment. LAQM Progress Report 2014 7
Aberdeen City Council

1.3       Air Quality Objectives
The air quality objectives applicable to LAQM in Scotland are set out in the Air
Quality (Scotland) Regulations 2000 (Scottish SI 2000 No 97), the Air Quality
(Scotland) (Amendment) Regulations 2002 (Scottish SI 2002 No 297), and are
shown in Table 1.1. This table shows the objectives in units of micrograms per cubic
metre µg/m3 (milligrams per cubic metre, mg/m3 for carbon monoxide) with the
number of exceedences in each year that are permitted (where applicable).

LAQM Progress Report 2014                                                         8
Aberdeen City Council

Table 1.1     Air Quality Objectives included in Regulations for the purpose of
LAQM in Scotland
                              Air Quality Objective               Date to be
     Pollutant
                        Concentration       Measured as          achieved by
                         16.25 µg/m3       Running annual
                                                                  31.12.2003
                                                mean
     Benzene
                            3.25 µg/m3      Running annual
                                                                  31.12.2011
                                                mean
                            2.25 µg/m3      Running annual
  1,3-Butadiene                                                   31.12.2003
                                                mean
                            10 mg/m3        Running 8-hour
Carbon monoxide                                                   31.12.2003
                                                mean
                            0.50 µg/m3       Annual mean          31.12.2004
       Lead
                            0.25 µg/m3       Annual mean          31.12.2008
                      200 µg/m3 not to be
                        exceeded more
                                             1-hour mean          31.12.2005
 Nitrogen dioxide       than 18 times a
                              year

                            40 µg/m3         Annual mean          31.12.2005
                      50 µg/m3, not to be
Particulate Matter      exceeded more       24-hour mean          31.12.2011
      (PM10)          than 7 times a year
  (gravimetric)
                            18 µg/m3         Annual mean          31.12.2011
                       350 µg/m3, not to
                       be exceeded more
                                             1-hour mean          31.12.2004
                        than 24 times a
                              year

                       125 µg/m3, not to

 Sulphur dioxide       be exceeded more     24-hour mean          31.12.2004
                      than 3 times a year

                       266 µg/m3, not to
                       be exceeded more
                                            15-minute mean        31.12.2005
                        than 35 times a
                              year

LAQM Progress Report 2014                                                         9
Aberdeen City Council
1.4 Summary of Previous Review and Assessments
The outcomes of the first, second, third and fourth rounds of the review and
assessment process for NO2 and PM10 are described in sections 1.4.1-1.4.4. All
rounds of the process concluded levels of carbon monoxide, benzene, 1,3-butadiene,
sulphur dioxide and lead in Aberdeen are unlikely to exceed the national air quality
objectives.
1.4.1 First Round of Review and Assessment
The first round of the review and assessment process predicted exceedances of the
annual mean objective for NO2 in parts of the city centre. An Air Quality
Management Area (AQMA) was declared in June 2001 centring around Market
Street and Union Street. Following subsequent Detailed Assessments in 2001 and
2002 the AQMA was slightly amended in March 2003 to include adjoining areas.
1.4.2 Second Round of Review and Assessment
The second round of review and assessment confirmed levels of NO 2 continued to
exceed the annual mean objective in the city centre, including streets adjacent to the
AQMA. Exceedances of the 1-hour objective were also predicted on Market Street.
Additionally, exceedances of the new annual mean objective for PM 10, to be achieved
by 2010, were also predicted in the city centre. Following a Detailed Assessment,
the AQMA was amended in January 2005 to include all areas of current or predicted
exceedances of both the NO2 and 2010 PM10 annual mean objectives in the city
centre and the 1-hour NO2 objective on Market Street.
Emissions from Aberdeen Harbour were considered in the Detailed Assessment. It
was concluded that emissions from shipping contributed to elevated levels of NO 2
and PM10 in the Market Street and Guild Street areas, but do not cause exceedance
of the objectives.
An Air Quality Action Plan was also published in July 2006 detailing measures to
improve the air quality in the AQMA. These included
Pedestrianisation of Union Street and associated road infrastructure
improvements
Additional controlled parking
Additional Park and Ride facilities
Green Transport Plans
Improved Public Transport
Increase Public Awareness of Air Quality Issues
Construction of a Western Peripheral Route around the city (AWPR)
LAQM Progress Report 2014 10Aberdeen City Council 1.4.3 Third Round of Review and Assessment A further Updating and Screening Assessment and Progress Reports were completed in 2006, 2007 and 2008 respectively. NO 2 levels across the City and PM10 levels on Union Street were found to be similar to previous years. In 2007 elevated levels of PM10 were recorded on Market St due to roadworks and the development of the Union Square retail park adjacent to the continuous monitoring station. Potential exceedances of the annual mean objective for both PM 10 and NO2 were predicted on the Anderson Drive/Haudagain roundabout corridor even with the construction of the proposed Aberdeen Western Peripheral Route (AWPR) and on parts of Wellington Road. A Detailed Assessment completed in March 2008 concluded that the annual mean NO2 objective and the annual mean 2010 PM10 objective were likely to be exceeded in 2010 at the Haudagain roundabout (A96/A90), locations along the A90 Anderson Drive and Wellington Road (Queen Elizabeth II Bridge to Balnagask Road) without the AWPR. With the AWPR exceedances were still predicted on Wellington Road although levels slightly below the objectives were predicted on the Haudagain roundabout/Anderson Drive corridor. Wellington Road (Queen Elizabeth II Bridge to Balnagask Road) was designated an AQMA in November 2008 as a result of the Detailed Assessment and annual mean NO2 and PM10 levels recorded in the 2008 Progress Report. The Haudagain roundabout/Anderson Drive corridor was also declared an AQMA for both pollutants as NO2 monitoring in the vicinity of the roundabout had frequently recorded measurements in excess of the objective and the AWPR would not be completed until 2012 at the earliest. The Detailed Assessment also considered NO2 and PM10 levels on King Street. Although potential exceedances of both objectives were identified, there was a lack of monitoring data in the area to confirm the likelihood of exceedances. Accordingly further monitoring was recommended prior to any decision being made on the requirement for an AQMA on King Street. 1.4.3 Fourth Round of Review and Assessment The 2009 Updating and Screening Assessment and 2010 Progress Report completed in July 2009 and July 2010 respectively confirmed measured NO 2 levels were again similar to previous years with the exception of Market Street. The Market Street monitoring station was relocated in 2008 and the lower levels recorded at the new site are attributable to the more open nature of the site and reduced congestion. Both reports confirmed continued widespread exceedances of the NO 2 annual mean objective within the City Centre AQMA and pockets of exceedances within the Wellington Road and Anderson Drive/Haudagain roundabout AQMAs. PM10 levels were lower in 2009 compared to previous years. It is believed that the replacement of Errol Place TEOM with an FDMS and the use of the VCM for the first time contributed to the lower values. LAQM Progress Report 2014 11
Aberdeen City Council
In 2010 diffusion tube concentrations identified likely exceedances of the annual
mean objective just outwith the existing boundaries of the City Centre and Anderson
Drive/Haudagain roundabout AQMAs. These AQMAs were extended in November
2011 to include the following areas:
City Centre AQMA: Victoria Road to the junction with Sinclair Road, Bridge
Street and West North Street to the junction with Littlejohn Street
Anderson Drive/Haudagain roundabout AQMA: Auchmill Road to the junction
with Howes Road.
Additionally, the Union Street continuous monitoring recorded exceedances of the
1 hour NO2 objective. As diffusion tube data indicated likely exceedances at
several sites across the City Centre AQMA, the AQMA was also amended to
include exceedance of the 1 hour objective.
A new Air Quality Action Plan (AQAP) covering all 3 AQMAs was adopted in
March 2011. Measures to improve air quality were grouped into the following 6
categories:
Modal Shift and Influencing Travel Choice
Lower Emissions and Cleaner Vehicles
Road Infrastructure
Traffic Management
Planning and Policies
Non-Transport Measures
1.4.4 Fifth Round Review and Assessment
The 2012 Updating and Screening Assessment again confirmed continued
exceedances of the annual mean PM10 and NO2 objectives across the 3 AQMAs.
NO2 and PM10 levels were broadly similar to previous years with the exception of the
Union St continuous monitor which recorded a 25% decrease in the annual mean
concentration. The reason for the dramatic decrease is unknown but equipment
malfunction may have been a factor, especially as traffic flows remained the same.
There were no exceedances of the 1 hour NO2 objective. A slight rise in the number
of exceedances of the 24 hour PM10 objective at Market St, Union St, King St and
Wellington Road was observed.
A study of emissions from shipping and their impact on the City Centre AQMA was
also completed in 2011. It was concluded that, whilst emissions from shipping are
not likely to cause an exceedance of the annual mean objectives, they do contribute
to existing exceedances in specific areas near the Harbour.
The 2012 monitoring data confirmed concentrations continued to exceed the annual
mean NO2 and PM10 objectives within the 3 AQMAs and the 1 hour NO 2 and 24 hour
PM10 objectives within the City Centre and Wellington Road AQMAs.
The annual mean PM10 objective was also marginally exceeded at the King Street
continuous monitoring station. Concentrations from the BAM monitor at this location
LAQM Progress Report 2014 12Aberdeen City Council may be elevated during prolonged periods of heavy rain and sea mist. A Detailed Assessment was not proposed at that time, however concentrations to be monitored and reviewed to determine if further action is necessary. There were no exceedances of the objectives at any other location outwith the AQMAs. Table 1.2 summarises the outcome of previous air quality reports. LAQM Progress Report 2014 13
Aberdeen City Council

Table 1.2    Summary of Air Quality Reports and Outcomes

Report                      Outcomes
Stages 1, 2, 3 and 4 City centre AQMA declared in June 2001 due to predicted
Reports 2000-2003       exceedances of annual mean NO2 objective. Area of AQMA
                        extended in March 2003.
Updating            and Detailed Assessment of NO2 and PM10 recommended in city
Screening               centre and assessment of Aberdeen Harbour.
Assessment August
2003
Detailed Assessment Extension of city centre AQMA for NO2 and inclusion of
August 2004             predicted exceedances of 1-hour objective on Market Street.
                        City Centre AQMA declared for PM10 due to predicted
                        exceedances of the 2010 annual mean objective.
                        Concluded emissions from Aberdeen Harbour do not cause
                        exceedances of objectives, but contribute to elevated levels
                        of NO2 and PM10 on Market Street and Guild Street areas.
Progress Report 2005 Update of monitoring results and new developments.
Updating            and Update of monitoring results and new developments.
Screening
Assessment July 2006
Air Quality Action Plan Detailed measures to improve air quality in the AQMA.
July 2006
Progress Report June Detailed Assessment of NO2 and PM10 recommended on
2007                    Wellington        Road,         Anderson       Dr/Haudagain
                        roundabout/Auchmill Rd corridor and King Street.
Detailed Assessment AQMAs declared November 2008 on Anderson
March 2008              Drive/Haudagain roundabout and Wellington Rd (Queen
                        Elizabeth II Bridge – Balnagask Rd) due predicted
                        exceedances of NO2 and 2010 PM10 annual mean
                        objectives.
Progress Report May Update of monitoring results and new developments and
2008                    progress on implementation of the Air Quality Action Plan.
Updating            and Update of monitoring results. Recommended additional NO2
Screening               diffusion tubes at potential areas of exceedances. Modelling
Assessment July 2009 of City Centre PM10 and NO2 recommended to support
                        proposed new Action Plan.
City Centre modelling City Centre modelling predicted widespread exceedances
study March 2010        of annual mean PM10 objective and minor potential areas of
                        exeedances of the NO2 annual mean objective outwith the
                        AQMA.
Progress Report July Update of monitoring results and progress in the
2010                    development of a new Air Quality Action Plan covering the 3
                        AQMAs.
Progress Report June Update of monitoring results, extension of City Centre and
2011                    Anderson Drive/Haudagain roundabout AQMAs and
                        amendment of City Centre AQMA to include exceedance of
                        the 1 hour NO2 objective.

LAQM Progress Report 2014                                                        14
Aberdeen City Council
Table 1.2 Summary of Air Quality Reports and Outcomes - Continued
Report Outcomes
Air Quality Action Plan Detailed measures to improve air quality across the 3
March 2011 AQMAs.
Updating and Update of monitoring results and planning developments.
Screening Assessment of emissions from Aberdeen Harbour.
Assessment July 2012
Action Plan Progress Update of progress in the Action Plan implementation,
Report January 2013 including specific indicators and trend analysis.
Progress report Update of monitoring results. Additional diffusion tubes will
September 2013 be located near sensitive receptors along the route of the
proposed 3rd Don Crossing
LAQM Progress Report 2014 15Aberdeen City Council Figure 1.1: Map of City Centre AQMA LAQM Progress Report 2014 16
Aberdeen City Council

Figure 1.2: Map of Anderson Drive/Haudagain roundabout/Auchmill Road
            AQMA

LAQM Progress Report 2014                                          17
Aberdeen City Council Figure 1.3: Map of Wellington Road AQMA LAQM Progress Report 2014 18
Aberdeen City Council

2         New Monitoring Data
2.1       Summary of Monitoring Undertaken
2.1.1     Automatic Monitoring Sites

There are 6 continuous monitoring sites in Aberdeen. Details of pollutants
monitored, equipment types and site locations are described in Table 2.1. Figure 2.1
shows the site locations. QA/QC procedures are detailed in Appendix A.

The Market St site required to be removed in October 2008 due to the construction of
the adjacent Union Square retail park. A new site at the junction of Market
Street/Poynernook Road commenced collecting data in July 2009.

The Market St TEOM was replaced with a BAM in March 2010 and a replacement
NOx analyser installed in April 2010. The Union Street NOx analyser was replaced
in February 2012 due to recurrent technical problems during 2011.

Figure 2.1   Map of Automatic Monitoring Sites

LAQM Progress Report 2014                                                        19
Aberdeen City Council

       Table 2.1       Details of Automatic Monitoring Sites
                                                                                                       Relevant
                                                                                                      Exposure?
                                                                                                                  Distance   Does this
                                                                                                       (Y/N with
                                                                                                                 to Kerb of Location
                                                      Inlet                                             distance
Site     Site                    X OS Grid Y OS Grid        Pollutants  In          Monitoring                    Nearest    Represent
                    Site Type                        Height                                             (m) from
 ID     Name                     Reference Reference        Monitored AQMA?         Technique                     Road (m)     Worst-
                                                       (m)                                            monitoring
                                                                                                                 (N/A if not   Case
                                                                                                         site to
                                                                                                                 applicable) Exposure?
                                                                                                        relevant
                                                                                                       exposure)
                                                               PM10, PM2.5,
                                                                                  FDMS
       Errol                                                   O 3,           N
CM1                 Background   X394397   Y807392       7.0                                          N/A           N/A        N
       Place                                                   NO2    (NO,
                                                                                  Chemiluminescence
                                                               NOx)
       Union                                                   PM10, NO2      Y   TEOM
CM2                 Roadside     X393656   Y805967       1.5                                          Y(2m)         2m         Y
       Street                                                  (NO, NOx)          Chemiluminescence
CM3    Market                                                  PM10, NO2      Y   BAM
                    Roadside     X394560   Y805677       1.5                                          Y(0m)         2m         N
       Street                                                  (NO, NOx)          Chemiluminescence
       Anderson                                                PM10, NO2      Y   TEOM
CM4                 Roadside     X392506   Y804186       1.5                                          Y(10m)        6m         N
       Drive                                                   (NO, NOx)          Chemiluminescence
       Wellington                                              PM10, NO2      Y   TEOM
CM5                 Roadside     X394395   Y804779       1.5                                          Y(5m)         4m         Y
       Road                                                    (NO, NOx)          Chemiluminescence
       King                                                    PM10, NO2      n   BAM
CM6                 Roadside     X394333   Y808770       1.5                                          Y(10m)        3m         N
       Street                                                  (NO, NOx)          Chemiluminescence

       LAQM Progress Report 2014                                                                                                   20
Aberdeen City Council 2.1.2 Non-Automatic Monitoring Sites Levels of nitrogen dioxide are also monitored across the city via diffusion tubes attached to lampposts and downpipes. Tube details and locations and are listed in Table 2.2. The diffusion tubes provide an indication of longer-term average NO2 concentrations and highlight areas of high NO2 concentrations. Tubes are co-located in triplicate at all the continuous monitoring sites detailed in Table 2.1 to enable the bias adjustment of the city wide survey. Duplicate tubes are also co-located at several city centre sites. Table 2.2 provides details of diffusion tube monitoring sites. LAQM Progress Report 2014 21
Aberdeen City Council

       Table 2.2        Details of Non- Automatic Monitoring Sites
                                                                                           Relevant
                                                                                   Is     Exposure?
                                                                                                      Distance   Does this
                                                                               Monitoring  (Y/N with
                                                                                                     to Kerb of Location
                                                         Site                  Co-located   distance
Site                      Site      X OS Grid Y OS Grid        Pollutants  In                         Nearest    Represent
        Site Name                                       Height                   with a     (m) from
 ID                       Type      Reference Reference        Monitored AQMA?                        Road (m)     Worst-
                                                         (m)                   Continuous monitoring
                                                                                                     (N/A if not   Case
                                                                                Analyser     site to
                                                                                                     applicable) Exposure?
                                                                                 (Y/N)      relevant
                                                                                           exposure)
DT1       Bucksburn                  389744     809575                               N       Y (façade)        8m          N
         Primary Sch,
                         Roadside                           2.5      NO2   Y
           Inverurie
             Road
DT2         885 Gt                   391167     809161                               N        Y (11m)          3m          Y
                         Roadside                           2.5      NO2   Y
         Northern Rd
DT3          549 N                   391394     808949                               N        Y (17m)          3m          Y
                         Roadside                           2.5      NO2   Y
         Anderson Dr
DT4                                  394652     809714                               N         Y(7m)           3m          Y
         38 Ellon Rd     Roadside                           2.5      NO2   N
DT5                                  394236     808066                               N         Y(9m)          0.1m         N
         520 King St     Roadside                           2.5      NO2   N
DT6       86 Victoria                394764     805197                               Y       Y(façade)         3m          Y
                         Roadside                           2.5      NO2   N
          Rd, Torry
DT7       Wellignton                 394411     804407                               N       Y(façade)         3m          Y
         Rd//Kerloch     Roadside                           2.5      NO2   Y
              Pl
DT8          107                     392337     804340                               N        Y(14m)           3m          Y
                         Roadside                           2.5      NO2   Y
         Anderson Dr
DT9                                  394258     806157                               N       Y(façade)         3m          Y
         31 Market St    Roadside                           2.5      NO2   Y

       LAQM Progress Report 2014                                                                                          22
Aberdeen City Council
Relevant
Is Exposure?
Distance Does this
Monitoring (Y/N with
to Kerb of Location
Site Co-located distance
Site Site Site X OS Grid Y OS Grid Pollutants In Nearest Represent
Height with a (m) from
ID Name Type Reference Reference Monitored AQMA? Road (m) Worst-
(m) Continuous monitoring
(N/A if not Case
Analyser site to
applicable) Exposure?
(Y/N) relevant
exposure)
184/192 394530 N
DT10 Roadside 805708 2.5 NO2 Y Y(façade) 3m Y
Market St
105 King 394406
DT11 Roadside 806637 2.5 NO2 Y N Y(façade) 3m Y
St
40 Union 394284
DT12 Roadside 806284 2.5 NO2 Y N Y(façade) 3m Y
St
Music
393777
DT13 Hall, Roadside 806030 2.5 NO2 Y N Y(façade) 6m Y
Union St
Dyce
Prim, Urban 389046
DT14 812794 2.5 NO2 N N Y(N/A) N/A N
Gordon background
Ter
Northfield
Urban 390801
DT15 swimming 808132 2.5 NO2 N N Y(N/A) N/A N
background
pool
Guild
394336
DT16 St/Market Roadside 806097 2.5 NO2 Y N Y(facade) 5m Y
St
43/45 394294 N
DT17 Roadside 806266 2.5 NO2 Y Y(façade) 3m Y
Union St
14 393305 N
DT18 Roadside 805734 2.5 NO2 Y Y(façade) 3m Y
Holburn St
468 Union 393386
DT19 Roadside 805826 2.5 NO2 Y N Y(façade) 3m Y
St
212 King 394400
DT20 Roadside 806842 2.5 NO2 N N Y(façade) 4m N
St
LAQM Progress Report 2014 23Aberdeen City Council
Relevant
Is Exposure?
Distance Does this
Monitoring (Y/N with
to Kerb of Location
Site Co-located distance
Site Site Site X OS Grid Y OS Grid Pollutants In Nearest Represent
Height with a (m) from
ID Name Type Reference Reference Monitored AQMA? Road (m) Worst-
(m) Continuous monitoring
(N/A if not Case
Analyser site to
applicable) Exposure?
(Y/N) relevant
exposure)
394449
DT21 26 King St Roadside 806453 2.5 NO2 Y N Y(façade) 4m Y
104 King 394425
DT22 Roadside 806634 2.5 NO2 Y N Y(façade) 4m Y
St
785 Gt
391458
DT23 Northern Roadside 809102 2.5 NO2 N N Y(façade) 3m Y
Rd
40
389913
DT24 Auchmill Roadside 809603 2.5 NO2 N Y Y(facade) 3m Y
Rd
21 Holburn 393332 N
DT25 Roadside 805748 2.5 NO2 Y Y(façade) 3m Y
St
147 393214 N
DT26 Roadside 805367 2.5 NO2 N Y(façade) 3m N
Holburn St
80 Holburn 393233
DT27 Roadside 805565 2.5 NO2 Y N Y(façade) 3m Y
St
61 Holburn 393275
DT28 Roadside 805624 2.5 NO2 Y N Y(5m) 3m Y
St
469 Union 393400
DT29 Roadside 805811 2.5 NO2 Y N Y(façade) 3m Y
St
209 Union 393795
DT30 Roadside 806009 2.5 NO2 Y N Y(façade) 5m Y
St
LAQM Progress Report 2014 24Aberdeen City Council
Relevant
Is Exposure?
Distance Does this
Monitoring (Y/N with
to Kerb of Location
Site Co-located distance
Site Site X OS Grid Y OS Grid Pollutants In Nearest Represent
Site Name Height with a (m) from
ID Type Reference Reference Monitored AQMA? Road (m) Worst-
(m) Continuous monitoring
(N/A if not Case
Analyser site to
applicable) Exposure?
(Y/N) relevant
exposure)
393170
DT31 249 Union St Roadside 805120 2.5 NO2 Y N Y(façade) 5m Y
Willowbank 393642
DT32 Roadside 805503 2.5 NO2 N N Y(5m) 3m N
Rd/Albury Rd
394505 N
DT33 East North St Roadside 806529 2.5 NO2 Y Y(façade) 4m Y
404 King 394317 N
DT34 Roadside 807527 2.5 NO2 N Y(façade) 9m N
Street
Riverside
House,
DT35 Roadside 39425 804873 2.5 NO2 N N Y(façade) 6m N
Riverside
Drive
115 Menzies
394403
DT36 Rd/Wellington Roadside 804799 2.5 NO2 Y N Y(12m) 1m Y
Rd
137
394697
DT37 Wellington Roadside 803735 2.5 NO2 N N Y(17m) 14m N
Road
Wellington
394719
DT38 Road / 4 Nigg Roadside 803329 2.5 NO2 N N Y(7m) 3m N
Kirk Road
819 Gt
DT39 Roadside 391293 809136 2.5 NO2 Y N Y(façade) 3m Y
Northern Rd
852 Fullerton
DT40 Facade 391353 809158 2.5 NO2 Y N Y(façade) 7m Y
Ct (facade)
LAQM Progress Report 2014 25Aberdeen City Council
Relevant
Is Exposure?
Distance Does this
Monitoring (Y/N with
to Kerb of Location
Site Co-located distance
Site Site Site X OS Grid Y OS Grid Pollutants In Nearest Represent
Height with a (m) from
ID Name Type Reference Reference Monitored AQMA? Road (m) Worst-
(m) Continuous monitoring
(N/A if not Case
Analyser site to
applicable) Exposure?
(Y/N) relevant
exposure)
852
Fullerton N
DT41 Roadside 391352 809151 2.5 NO2 Y Y(7m) 0.1m Y
Ct
(roadside)
248 N
DT42 Roadside 393868 806741 2.5 NO2 N Y(façade) 2m N
George St
25
DT43 Rosemount Roadside 393424 806685 2.5 NO2 N N Y(3m) 3m N
Pl
214
DT44 Rosemount Roadside 392897 806352 2.5 NO2 N N Y(façade) 3m N
Pl
111 S
DT45 Anderson Facade 392311 804349 2.5 NO2 Y N Y(façade) 13m N
Dr
West North
DT46 Roadside 394277 806671 2.5 NO2 Y N Y(façade) 4m Y
Street
LAQM Progress Report 2014 26Aberdeen City Council
2.2 Comparison of Monitoring Results with Air Quality
Objectives
The Union Street and Market Street continuous monitoring sites are on busy city
centre roads and are representative of population exposure for NO2. Union Street is
the city’s main shopping street with shops on the ground level and commercial
premises and flats on the 1st, 2nd and 3rd floors. Almost all of the city’s bus routes
pass along at least part of Union Street and the inside lane of both sides of the road
are designated bus lanes. Market Street is adjacent to Aberdeen Harbour and has a
high proportion of HGV’s travelling between the north-east of Scotland, the Harbour
and locations to the south of Aberdeen. The street is used by pedestrians travelling
to the city centre from residential properties to the south of the river Dee, visiting the
new Union Square retail park and people working around the Harbour area. There
are a small number of 1st, 2nd and 3rd floor flats. Emissions from Aberdeen Harbour
also contribute to the pollution on Market Street.
The Anderson Drive site is 4m from the kerb and is not representative of population
exposure as residential properties are set back 10-20m from the kerb. Similarly the
site at Wellington Road is around 3-4m closer to the kerb than residential properties
in the area. The nearest properties are 10m from the King Street site, however the
location is typical of flatted properties close to the kerb at other locations on King
Street. Errol Place is representative of typical residential properties close to the city
centre but not adjacent to a major road.
Diffusion tubes on Market Street, Union Street and the majority of those on Holburn
Street and King Street within the city centre are at building façade and are
representative of population exposure. Some of the tubes outwith the city centre are
at roadside locations with the façade of the nearest relevant property 5-20m back
from the roadside. Procedures within LAQM.TG(09) have been used to estimate the
concentration at the nearest receptor where appropriate.
LAQM Progress Report 2014 27Aberdeen City Council 2.2.1 Nitrogen Dioxide (NO2) Automatic Monitoring Data Table 2.3 shows the annual mean NO2 concentrations at the automatic continuous monitoring stations for NO2 from 2009-2013. The annual mean concentration at Errol Place is a best estimate due to valid data capture being less than 75%. The data is not “annualised” in accordance with LAQM.TG(09) due to the lack of other local background continuous monitoring sites. The annual mean of 20 µgm-3 from the 45% valid data captured is slightly less than the period 2008 to 2012. The trend is similar to other automatic sites in Aberdeen in 2013 and the concentration is considered to be representative for the year. Concentrations at Union Street, Market Street and Wellington Road continue to exceed the annual mean objective. At Errol Place, Anderson Drive and King Street concentrations are well below the objective. The Anderson Drive AQMA was declared due to predicted exceedances of the annual mean objective at locations elsewhere along the Anderson Drive/Haudagain roundabout corridor. Errol Place and King Street are outwith the AQMAs. Trends in the annual mean concentration are shown in Figure 2.2. Concentrations at Errol Place, Market Street and King Street were similar to previous years. At Anderson Drive the annual mean decreased by 8 µgm-3 compared to 2012 and is similar to concentrations pre 2012. There was a 5ugm-3 decrease in the annual mean concentration at Union Street compared to 2012. The level of 48 µgm-3 is the lowest measured since 2009 (2011 data unlikely to be representative of the annual mean concentration – refer to 2013 report). The annual mean at Wellington Road was similar to the 2010 and 2011 values and significantly lower than the 2012 concentration. Table 2.4 shows the number of exceedances of the 1-hour objective at the automatic monitoring sites. The hourly NO2 objective was met at all sites objective (200µg/m3 – not to be exceeded more than 18 times per year). Union Street had one exceedance of the objective and Wellington Road had six exceedances. This observation at Wellington Road is consistent with the decreased annual mean level. There were no exceedances recorded at the other sites. LAQM Progress Report 2014 28
Aberdeen City Council

Table 2.3      Results of Automatic Monitoring for NO2: Comparison with Annual Mean Objective
                                              Valid Data                                    Annual Mean Concentration (µg/m3)
                                                                Valid Data
                                Within        Capture for
     Site ID     Site Type                                     Capture 2013
                                AQMA?         Monitoring                         2009 c        2010 c     2011 c       2012 c      2013 c
                                                                   %b
                                              Period % a
                Urban
      CM1                           N                                45            26            21         23           21            (20)d
                Background
      CM2       Roadside            Y                               100            56c           59         44           53             48
      CM3                                                                               c
                Roadside            Y                               89.8           38            44         40           44             43
      CM4       Roadside            Y                                94            24            27         23           30             22
      CM5       Roadside            Y                               91.5           43            52         51           59             52
      CM6       Roadside            N                               95.1           32            29         32           29             28
In bold, exceedence of the NO2 annual mean AQS objective of 40µg/m3
a
    data capture for the monitoring period, in cases where monitoring was only carried out for part of the year
b
    data capture for the full calendar year (e.g. if monitoring was carried out for six months the maximum data capture for the full
calendar year would be 50%)
c
    Data has been seasonally adjusted in provide “annualised” data using procedures within PG(09), where monitoring was not carried
out for the full year.
d
    Best estimate - Measured mean concentration due to valid data capture less than 75%.

LAQM Progress Report 2014                                                                                                                29
Aberdeen City Council
Figure 2.2 Trends in Annual Mean NO2 Concentrations Measured at Automatic Monitoring Sites
Annual Mean NO2 Concentrations at Automatic Monitoring
Stations
80
70
Concentration ugm-3
60 Errol Place
50 Union Street
40 Market Street
30 Anderson Drive
20 Wellington Road
10 King Steet
0
Year
LAQM Progress Report 2014 30Aberdeen City Council
Table 2.4 Results of Automatic Monitoring for NO2: Comparison with 1-hour Mean Objective
Valid Data Number of Hourly Means > 200µg/m3
Valid Data
Within Capture for
Site ID Site Type Capture 2013
AQMA? Monitoring 2009 c 2010 c 2011 c 2012 c 2013 c
%b
Period % a
Urban
CM1 N 45 0 0(101) 0 0 0 (86)
Background
CM2 Roadside Y 100 10(190) 17(202) 6(168) 1 0
CM3 Roadside Y 89.8 2(175) 0(157) 1 0 1
CM4 Roadside Y 94 0 0(111) 0 0 0
CM5 Roadside Y 91.5 0 1 4 10 6
CM6 Roadside N 95.1 0 0 0 0(108.4) 0
In bold, exceedence of the NO2 hourly mean AQS objective (200µg/m3 – not to be exceeded more than 18 times per year)
a
data capture for the monitoring period, in cases where monitoring was only carried out for part of the year
b
data capture for the full calendar year (e.g. if monitoring was carried out for six months the maximum data capture for the full
calendar year would be 50%)
c
If the data capture for full calendar year is less than 90%, the 99.8th percentile of hourly means is provided in brackets
LAQM Progress Report 2014 31Aberdeen City Council Diffusion Tube Monitoring Data Table 2.5 details the results of the diffusion tube monitoring. Tubes have been bias adjusted using the methodology described in LAQM.TG(09). Details on the bias factors and adjustment calculations are in Appendix A. Uncorrected 4-weekly diffusion tube data, bias adjustment calculations and calculations to correct to façade where appropriate are shown in Tables B1-B3 in Appendix B. The majority of diffusion tubes within the City Centre AQMA continued to exceed the annual mean objective. Concentrations greater than 60ugm -3 were recorded at several sites indicating a risk of exceedance of the 1-hour objective. The AQMA was extended in 2011 to include Victoria Road, Torry and West North Street as a result of previous measured exceedances at Victoria Road and modelling carried out in 2010. The concentration at the Victoria Rd site was below the objective in 2013, but marginally exceeded the objective in 2012. Monitoring at West North Street commenced in autumn 2011. The annual mean objective both in 2012 and 2013 was well below the objective. Measurements over the next couple years will indicate whether the modelling over estimated concentrations at this location. Bias adjustment concentrations at the majority of City Centre sites were generally lower in 2013 compared to 2012. Concentrations at several sites within both the Wellington Road and Anderson Dr/Haudigan roundabout/Auchmill Road AQMAs exceeded the annual mean objective but were generally lower than 2012 levels and suggest pockets of exceedances across the AQMAs. Outwith the AQMAs concentrations at the sites were below the objective. The site at 38 Ellon Road exceeded the objective for the first time in 2011 however compliance was achieved in 2012 and 2013. The 2013 concentration was lower than the concentration in 2012. LAQM Progress Report 2014 32
Aberdeen City Council

Table 2.5    Results of NO2 Diffusion Tubes 2013
                                                                                                       2013 Annual Mean
                                                                           Full Calendar Year Data Concentration (µg/m3) - Bias
                                              Within   Triplicate or Co-
   Site ID      Location         Site Type                                 Capture 2013 (Number      Adjustment factor RD =
                                              AQMA?     located Tube
                                                                              of Months or %) a              0.894 b
                                                                                                             UB = 0
     DT1          Bucksburn
                Primary Sch,     Roadside       Y           Single                   9                         31.6
               Inverurie Road
     DT2            885 Gt
                 Northern Rd
                                 Roadside       Y           Single                   10                        42b
     DT3            549 N
                 Anderson Dr
                                 Roadside       Y           Single                   10                        27.5b
     DT4         38 Ellon Rd     Roadside       N           Single                   10                        34.8b
     DT5         520 King St     Roadside       N         Co-located                 10                        28.4b
     DT6       86 Victoria Rd,
                     Torry
                                 Roadside       N         Co-located                 11                        34.4
     DT7          Wellington
               Rd//Kerloch Pl
                                 Roadside       Y           Single                   9                         46.3
     DT8        107 Anderson
                      Dr
                                 Roadside       Y           Single                   8                        39.1a,b
    DT9         31 Market St     Roadside       Y         Co-located                 10                        57.6
    DT10           184/192
                  Market St
                                 Roadside       Y         Co-located                 12                        70.4
    DT11         105 King St     Roadside       Y         Co-located                 12                        64.7
    DT12         40 Union St     Roadside       Y         Co-located                 10                        54.3
    DT13          Music Hall,
                   Union St
                                 Roadside       Y         Co-located                 12                        43.4
    DT14          Dyce Prim,       Urban
                 Gordon Ter      background
                                                N           Single                   11                        12.9c
    DT15          Northfield       Urban
               swimming pool     background
                                                N           Single                   11                        14.5c

LAQM Progress Report 2014                                                                                                  33
Aberdeen City Council
2013 Annual Mean
Full Calendar Year Data Concentration (µg/m3) - Bias
Within Triplicate or Co-
Site ID Location Site Type Capture 2013 (Number Adjustment factor RD =
AQMA? located Tube
of Months or %) a 0.894 b
UB = 0
DT16 Guild
St/Market St
Roadside Y Co-located 11 52.3
DT17 43/45 Union St Roadside Y Co-located 12 58.2
DT18 14 Holburn St Roadside Y Co-located 12 50.1
DT19 468 Union St Roadside Y Co-located 12 54.9
DT20 212 King St Roadside N Co-located 12 35.8
DT21 26 King St Roadside Y Co-located 12 44.5
DT22 104 King St Roadside Y Co-located 12 51.1
DT23 785 Gt
Northern Rd
Roadside N Single 11 27.6b
DT24 40 Auchmill
Rd
Roadside N Single 6 39.8a
DT25 21 Holburn St Roadside Y Single 11 40.5
DT26 147 Holburn St Roadside N Single 11 31.7
DT27 82 Holburn St Roadside Y Co-located 8 31.6a
DT28 61 Holburn St Roadside Y Co-located 12 40.5b
DT29 469 Union St Roadside Y Co-located 11 63.3b
DT30 209 Union St Roadside Y Single 11 56.1
DT31 249 Union St Roadside Y Co-located 11 37.2
DT33 East North St Roadside Y Co-located 11 51
DT34 404 King
Street
Roadside N Co-located 12 33.9
DT36 115 Menzies
Rd/Wellington Roadside Y Co-located 10 43.4b
Rd
DT37 137 Wellington
Road
Roadside N Single 11 30.9b
DT39 819 Gt
Northern Rd
Roadside Y Single 9 63.8
LAQM Progress Report 2014 34Aberdeen City Council
2013 Annual Mean
Full Calendar Year Data Concentration (µg/m3) - Bias
Within Triplicate or Co-
Site ID Location Site Type Capture 2013 (Number Adjustment factor RD =
AQMA? located Tube
of Months or %) a 0.894 b
UB = 0
DT40 852 Fullerton
Ct (facade)
Facade Y Single 11 36.6
DT41 852 Fullerton
Road Roadside Y Single 10 25.4b
(roadside)
DT45 111 S
Anderson Dr
Facade Y Single 11 37.1
DT46 West North
Street
Roadside Y Single 10 33
In bold, exceedence of the NO2 annual mean AQS objective of 40µg/m3
Underlined, annual mean > 60µg/m3, indicating a potential exceedence of the NO2 hourly mean AQS objective
a
Although collection isAberdeen City Council
Table 2.6 Results of NO2 Diffusion Tubes (2009 to 2013)
Annual Mean Concentration (µg/m3) – Adjusted for Bias
2010 (Bias
2009 (Bias 2011 (Bias 2012 (Bias 2013 (Bias
Site Within Adjustment
Site ID Adjustment Adjustment Adjustment Adjustment
Type AQMA? Factor =
Factor = RD Factor = RD Factor = RD Factor = RD
nearest site
0.89, UB 0.74) 0.864, UB 0.67) 0.898. UB 0.78) 0.894, UB 0)
0.76-1.0))
DT1 Roadside Y 33 37 33 34 31.6
b
DT2 Roadside Y 41 39 41 40 42
b
DT3 Roadside Y 27 30 28 29 27.5
b
DT4 Roadside N 38 31 40 37 34.8
b
DT5 Roadside N 30 31 30 29 28.4
DT6 Roadside Y 34 41 33 41 34.4
DT7 Roadside Y 43 45 45 42 46.3
b
DT8 Roadside Y 42 42 42 46 39.1a
DT9 Roadside Y 55 63 52 59 57.6
DT10 Roadside Y 64 76 64 71 70.4
DT11 Roadside Y 67 66 63 62 64.7
DT12 Roadside Y 53 62 51 57 54.3
DT13 Roadside Y 45 57 42 48 43.4
DT14 Urban 11
background
N
13 9
10 12.9c
DT15 Urban 13
background
N
18 11
13 14.5c
DT16 Roadside Y 53 63 46 54 52.3
DT17 Roadside Y 54 61 55 54 58.2
DT18 Roadside Y 53 67 55 61 50.1
DT19 Roadside Y 55 68 54 61 54.9
DT20 Roadside N 36 38 37 36 35.8
DT21 Roadside Y 44 46 43 43 44.5
DT22 Roadside Y 47 52 48 49 51.1
b
DT23 Roadside N 32 36 32 33b 27.6
LAQM Progress Report 2014 36Aberdeen City Council
Annual Mean Concentration (µg/m3) – Adjusted for Bias
2010 (Bias
2009 (Bias 2011 (Bias 2012 (Bias 2013 (Bias
Site Within Adjustment
Site ID Adjustment Adjustment Adjustment Adjustment
Type AQMA? Factor =
Factor = RD Factor = RD Factor = RD Factor = RD
nearest site
0.89, UB 0.74) 0.864, UB 0.67) 0.898. UB 0.78) 0.894, UB 0)
0.76-1.0))
DT24 Roadside N 39 44 41 47 39.8a
DT25 Roadside Y 49 55 47 55 40.5
DT26 Roadside N 35 38 31 33 31.7
DT27 Roadside Y 38 38 31 33 31.6a
b
DT28 Roadside Y 38 44 38 44b 40.5
DT29 Roadside Y 65 65 63 56 63.3
b c
DT30 Roadside Y 57 62 57 55 56.1
DT31 Roadside Y 36 41 35 38 37.2
DT32 Roadside N 21 27 27 N/A N/A
DT33 Roadside Y 53 53 51 52 51
DT34 Roadside N 40 33 35 33 33.9
DT35 Roadside N 28 30 27 N/A N/A
b
DT36 Roadside Y 44 42 31 48 43.4
b
DT37 Roadside N 32 32 31 36 30.9
b
DT38 Roadside N 31 33 31 N/A N/A
DT39 54 a
Roadside Y 55 55 69 63.8
DT40 Roadside Y 36 40 36 36 36.6
b
DT41 Roadside Y 29 28 22 30 25.4
a a
DT42 Roadside N 34 38 35 N/A N/A
b a a
DT43 Roadside N 30 32 28 N/A N/A
a a
DT44 Roadside N 26 30 26 N/A N/A
DT45 Roadside Y N/A 32 29 36 37.1
DT46 Roadside Y N/A N/A N/A 30 33
LAQM Progress Report 2014 37Aberdeen City Council In bold, exceedence of the NO2 annual mean AQS objective of 40µg/m3 Underlined, annual mean > 60µg/m3, indicating a potential exceedence of the NO2 hourly mean AQS objective a Although collection is
Aberdeen City Council

2.2.2      Particulate Matter (PM10)

The Union Street and Market Street continuous monitoring locations are
representative of population exposure for PM10 due to the proximity of flats in the
area. Anderson Drive and Wellington Road are both closer to the kerb than the
façade of the nearest residential properties and are not representative of population
exposure. The nearest properties are 10m from the King Street site, however the
location is typical of flatted properties close to the kerb at other locations on King
Street. Errol Place is representative of typical residential properties close to the city
centre but not adjacent to a major road.

Tables 2.7 and 2.8 show the annual mean and number of exceedances of the 24
hour objective for PM10 obtained from the continuous monitoring sites over the period
2009-2013. All data was ratified by AEA Technology. TEOM and BAM data from
2009 has been corrected to gravitational equivalent by AEA Technology using the
procedures described in Appendix A

The annual mean objective was exceeded at Market Street, Union Street, Wellington
Road and King Street continuous monitoring sites. Concentrations were below the
objective at Errol Place and Anderson Drive.

King Street has exceeded the annual mean objective by 1ugm-3 since 2011. The
King Street site is outwith the existing AQMAs. During 2012 it became apparent that
the BAMs at both Market Street and King Street were recording significantly elevated
levels during prolonged periods of wet weather or sea mist in the area.

Market Street recorded exceptionally high annual mean PM10 concentrations and
daily exceedances of the air quality objective. Meteorological data strongly suggests
that the predominate cause of the high levels was unusual local climatic conditions,
particularly during March and April 2013.

The Market Street site is located at the coast with Aberdeen Harbour directly to the
east. It is therefore particularly influenced by easterly winds and on-shore breezes
that may be accompanied by foggy/misty conditions.

Around late February/early March Aberdeen experienced a prolonged period of high
pressure with light winds and dry, bright conditions. This was followed by damp,
misty weather and south easterly winds, lasting several days. Exceedances of the
daily objective were evident at four of the City’s continuous monitoring stations at this
time, but most particularly at Market Street due to its coastal location. Unusually,
easterly winds prevailed for much of March 2013 with occasional snow showers
followed by a period of dry, bright weather with light east winds in early April. Raised
levels were also evident at Wellington Road at this time. Resuspended dust/salt may
be one possible contributor to the raised concentrations during this period.
Interestingly, both Wellington Road and Market Street have a high HGV flow
compared to other sites.

East winds accompanied by misty/foggy conditions can also explain concentration
peaks evident in July, August and October 2013. Although Market Street has been
fitted with a heat exchanger to reduce the influence of moisture on the BAM, it has

LAQM Progress Report 2014                                                             39
Aberdeen City Council

been noted that levels at both this site, and King Street, may be raised during
prolonged periods of damp weather. It was not possible to install a heat exchanger at
the King Street site due to the BAM model type.

Figure C1 in Appendix C illustrates PM10 concentration bandings against wind
direction by month at Market Street in 2013. Figure C2 provides a plot of PM10 at
Market Street against wind direction and speed during 2013. The plots used
meteorological data from Aberdeen Airport which is located 7km north west of the
Harbour and less influenced by on costal effects. The link between weather
conditions and PM10 concentrations is clearly evident.

Annual Average daily flow data collated by Transport Scotland showed a marginal
increase in vehicles in 2013 compared to 2012. The increase is unlikely to be a
significant factor in the increases in annual mean and daily exceedences air quality
objective seen for 2013.

The trend at the Errol Place monitoring site suggests the annual mean background
concentration has remained steady at around 13 µgm-3. Concentrations at Anderson
Drive and Wellington Road and Union Street have also remained steady over the
period 2009-2013.

The 24-hour objective was met at Errol Place, Union Street, Anderson Drive, King
Street and Wellington Road.

LAQM Progress Report 2014                                                         40
Aberdeen City Council

Table 2.7       Results of Automatic Monitoring for PM10: Comparison with Annual Mean Objective
                                              Valid Data                        Confirm           Annual Mean Concentration (µg/m3)
                                                               Valid Data
                                Within        Capture for                     Gravimetric
    Site ID       Site Type                                     Capture                        2009
                                AQMA?         Monitoring                      Equivalent                 2010      2011      2012      2013
                                                                2013 % b
                                              Period % a                       (Y or N/A)
                Urban
     CM1                            N                              89             N/A           15        13        14        12        13
                Background
     CM2        Roadside            Y                              97              Y            18       18         22        21        20
     CM3        Roadside            Y                             94.6             Y            28c      22 c       22        23        35
     CM4        Roadside            Y                              97              Y            15       14         16        15        15
     CM5        Roadside            Y                              97              Y            23       22         24        23        22
     CM6        Roadside            N                             91.2             Y            17       18         19        19        19
In bold, exceedence of the PM10 annual mean AQS objective of 18µg/m3
a
    data capture for the monitoring period, in cases where monitoring was only carried out for part of the year
b
    data capture for the full calendar year (e.g. if monitoring was carried out for six months the maximum data capture for the full
calendar year would be 50%)
c
    Data has been seasonally adjusted to provide “annualised” data using the Errol Place background site and procedures within
TG(09).

LAQM Progress Report 2014                                                                                                              41
Aberdeen City Council
Figure 2.3 Trends in Annual Mean PM10 concentrations measured at Automatic Sites 2009-2013
A trend chart providing PM10 annual mean results over the past 5 years
40
35
30
Concentrations (ugm-3)
Errol Pl
25
Union St
Market St
20
Anderson Dr
15 Wellington Rd
King St
10 Objective 18ugm-3
5
0
2009 2010 2011 2012 2013
Year
LAQM Progress Report 2014 42Aberdeen City Council
Table 2.8 Results of Automatic Monitoring for PM10: Comparison with 24-hour Mean Objective
Valid Data Confirm Number of Daily Means > 50µg/m3
Valid Data
Within Capture for Gravimetric
Site ID Site Type Capture
AQMA? Monitoring Equivalent 2009 c 2010 c 2011 c 2012 c 2013 c
2013 % b
Period % a (Y or N/A)
Urban
CM1 N 89 N/A 2 1 1 1 1 (42)
Background
CM2 Roadside Y 97 Y 1(39) 0 4 3 4
148(17 15(71.
CM3 Roadside Y 94.6 Y 6(53) 15 59
0) 1)
CM4 Roadside Y 97 Y 0 0(32) 0 0 1
CM5 Roadside Y 97 Y 3(46) 1 8 10 7
CM6 Roadside N 91.2 Y N/A 4 7(38) 6 4
In bold, exceedence of the PM10 daily mean AQS objective (50µg/m3 – not to be exceeded more than 7 times per year)
a
data capture for the monitoring period, in cases where monitoring was only carried out for part of the year
b
data capture for the full calendar year (e.g. if monitoring was carried out for six months the maximum data capture for the full
calendar year would be 50%)
c
data capture for full calendar year is less than 90%. The 98.1th percentile of 24-hour means is in brackets
LAQM Progress Report 2014 43Aberdeen City Council
2.2.3 Sulphur Dioxide (SO2)
No monitoring of sulphur dioxide was carried out in 2013 as previous assessments
did not predict a likelihood of exceedances of the objective and there has been no
significant change in local emissions.
2.2.4 Benzene
No monitoring of benzene was carried out in 2013 as previous assessments did not
predict a likelihood of exceedances of the objectives and there has been no
significant change in local emissions.
2.2.5 Other Pollutants Monitored
PM2.5
Monitoring of PM2.5 at Errol Place commenced in February 2009 as part of the UK
automatic urban network (AUN). The new objectives for PM2.5 have not been
incorporated into the LAQM regime and authorities are not required to review and
assess air quality against the objectives. Table 2.9 shows the annual mean
concentration from 2009-2012. These results indicate the PM2.5 objective of 12ugm-3,
to be achieved by 2020, is likely to be met at urban background sites in Aberdeen.
Concentrations have increased slightly over the 3-year monitoring period suggesting
the target of a 15% reduction in concentrations at urban background sites, measured
as a 3-year mean is unlikely to be met unless measures are adopted to reduce PM 2.5
concentrations.
Table 2.9 Results of PM2.5 Automatic Monitoring: Comparison with the Annual
Mean Objective
Year Data Capture Annual Mean
for Monitoring (ugm-3)
Period (%)
2009 60.6 7
2010 80.0 7
2011 90.8 8
2012 96.4 9
2013 83.0 9
LAQM Progress Report 2014 44Aberdeen City Council
Ozone
Monitoring of ozone is also carried out at Errol Place as part of the AURN.
Concentrations of ozone are outwith the control of local authorities and hence ozone
is not part of the Local Air Quality Management process. Action to reduce
concentrations is a responsibility of the UK government and devolved
administrations.
The national objective for ozone is a running 8-hour mean of 100ugm-3 not to be
exceeded more than 10 times a year. Table 2.10 shows the annual mean
concentration and number of exceedances of the 8-hour running mean at Errol Place
over the period 2005-2013.
The annual mean has remained steady compared to previous years. Changes in
ozone are reflective of meteorological conditions and the variable number of
exceedance of the 8 hour objective over the monitoring period is likely to be
attributable to the changeable weather.
Table 2.10 Results of Automatic Monitoring for Ozone: Comparison with the
Annual Mean Objective
Year Data Capture Annual Mean Number of
for Monitoring (ugm-3) exceedances
Period (%) of 8-hour
objective
2005 99.0 50 26
2006 99.0 48 13
2007 98.5 48 2
2008 98.9 50 30
2009 94.4 42 1
2010 90.3 44 0
2011 96.0 42 38
2012 99.4 44 7
2013 88.0 47 0
LAQM Progress Report 2014 45Aberdeen City Council 2.2.6 Summary of Compliance with AQS Objectives Aberdeen City Council has examined the results from monitoring in the district. Concentrations still exceed the annual mean objective for NO2 in the City Centre, Wellington Road, Anderson Drive (Haudagain roundabout/Auchmill Road) AQMAs. Diffusion tubes in the City Centre and Anderson Drive (Haudagain Roundabout/Auchmill Road) indicate a potential exceedence of the NO 2 hourly mean AQS objective. The AQMAs should remain valid. Concentrations within both the City Centre and Wellington Road AQMAs still exceed the annual mean objective for PM10. The City Centre AQMA (Market Street) exceeds the 24 hour PM10 objective. Concentrations of both NO2 and PM10 outside of the AQMA are all below the objectives at relevant locations with the exception of the annual mean PM 10 objective at the King Street continuous monitoring station where the objective was marginally exceeded. Recorded measurements from BAM equipment may be elevated during periods of prolonged wet weather or sea mist resulting in a slightly elevated annual mean concentration at this location. A Detailed Assessment is not proposed at this time due to the uncertainty of data validity, however levels will continue to be monitored and the requirement for a Detailed Assessment assessed in future years. LAQM Progress Report 2014 46
You can also read