Cities Outlook 2020 - Centre for Cities

Page created by Ryan Miranda
 
CONTINUE READING
Cities Outlook 2020 - Centre for Cities
Cities Outlook
2020
Cities Outlook 2020 - Centre for Cities
Air
 Airpollution
     pollutionisisan
                   anurban
                      urbanproblem
                            problem                                                                         To clean up the air we breathe,                           Sources of airofpollution
                                                                                                                                                                          Sources               vary vary
                                                                                                                                                                                       air pollution across citiescities
                                                                                                                                                                                                          across
Levels ofof
  Levels  pollutants NO
            pollutants NO  and PM2.5 are
                         2 2 and PM2.5 are
                                                                                                            the UK’s largest cities and towns should:
higher inin
  higher  cities and
            cities   large
                   and largetowns than
                              towns    their
                                    than     surrounding
                                         their           areas
                                               surrounding areas

11%
 11%                                                                                                                  Clean air                                       50%
                                                                                                                                                                        50%                        Industrial  processes
                                                                                                                                                                                                            Industrial  processes
                                                                                                                                                                      of PM2.5 ofemissions
                                                                                                                                                                                  PM2.5 emissionsin someincities
                                                                                                                                                                                                            some contribute
                                                                                                                                                                                                                   cities contribute
Roads
  Roads inin
           the
             theUK UK                                                                                                                                                 in citiesin
                                                                                                                                                                                come
                                                                                                                                                                                  citiesfrom      more tomore
                                                                                                                                                                                          come from        NO2 emissions
                                                                                                                                                                                                                 to NO2 emissions
are breaching
  are breaching
                                                                          100%
                                                                           100%                                                                                       domestic    sources,sources,
                                                                                                                                                                               domestic                than others:
                                                                                                                                                                                                                than others:
legal limits
  legal       forfor
         limits    NONO
                      2 2
                                                                  ofof
                                                                     monitored
                                                                        monitored  roads
                                                                                     roads
                                                                                                                                                                      including
                                                                                                                                                                      coal burning
                                                                                                                                                                                  wood and
                                                                                                                                                                               including    wood and
                                                                                                                                                                                      stoves stoves
                                                                                                                                                                               coal burning
                                                                                                                                                                                                      68% 68%
                                                                                                                                                                                                           in Warrington
                                                                                                                                                                                                                    in Warrington   42%
                                                                                                                                                                                                                                      42%
95%
 95%
                                                                        inin
                                                                           1919
                                                                              cities
                                                                                citiesare
                                                                                        are                            ZONE
                                                                      above
                                                                         abovethe
                                                                                theWHO
                                                                                     WHO                                                                                                               7% 7%
                                                                                                                                                                                                           in Crawley        of NO2 emissions
                                                                                                                                                                                                                    in Crawley       of NO2 emissions
                                                                                                                                                                                                                                    in citiesin
                                                                                                                                                                                                                                              iscities is
ofof
   these are                                                                guidelines
                                                                              guidelines
     these are                                                                                                                                                                                                                      caused caused
                                                                                                                                                                                                                                             by       by
inin
   the UK’s cities                                                  forfor
                                                                         annual
                                                                           annual levels
                                                                                    levels                   Cities with poor quality air    Set tighter minimum
     the UK’s cities                                                                                                                                                                                                            road transport
                                                                                                                                                                                                                                        road transport
                                                                               ofof
                                                                                  PM2.5
                                                                                    PM2.5                         should introduce          emission standards for
                                                                                                                    London-style            burning stoves and ban
                                                                                                                   Clean Air Zones            domestic burning

There
 ThereisisaaSouth
             South/ /North
                      Northdivide
                             divide                                                                         The UK Government should:                                 It kills thousands
                                                                                                                                                                            It kills        everyevery
                                                                                                                                                                                     thousands    year year
                                                                                                                                                                                                       and affects
                                                                                                                                                                                                            and affects
and
 andthe
     theSouth
           Southisisworst
                     worstaffected
                           affected                                                                                                                                   the health    of many
                                                                                                                                                                            the health       moremore
                                                                                                                                                                                         of many
                                                                                                                                                                               In 2017,In
                                                                                                                                                                                        just onejust
                                                                                                                                                                                          2017,  pollutant, PM2.5, PM2.5,
                                                                                                                                                                                                     one pollutant,
                                                                                                                                                                               was estimated   to have to
                                                                                                                                                                                       was estimated   caused  over
                                                                                                                                                                                                          have caused over

                                                                                                                                                                               14,400
                                                                                                                                                                                  14,400
                                             Aberdeen
                                                Aberdeen
                                             hashas
                                                 thethe
                                                     lowest proportion
                                                        lowest         of
                                                               proportion
                                             PM2.5-related deaths
                                                PM2.5-related deaths
                                                                                                                Triple the size of the        Adopt World Health                                                        This is in spite
                                                                                                                                                                                                                                This      of spite of
                                                                                                                                                                                                                                      is in
   Belfast is the  citycity
                         with thethe                                                                             Clean Air Fund to           Organization stronger             deaths in UK cities
                                                                                                                                                                                      deaths  in UK cities              the UK meeting
      Belfast  is the       with                                                                                                                                                                                                the UK meeting

                                                                                                                 £660m
 lowest number     of  days  with
    lowest number of days with
                poor  airair
                   poor   quality
                             quality
                                                                                                                                              guidelines on PM2.5     That is an urban
                                                                                                                                                                              That is anaverage of
                                                                                                                                                                                         urban average of               current current
                                                                                                                                                                                                                                 legal limits
                                                                                                                                                                                                                                          legal limits
                                                       Cities in the   South saw  DAQI index

                                                                                                                                                                      1 in
                                                                                                                                                                         1 19
                                                          Cities  in the  South saw DAQI  index

                                                                                                                                                                           in 19
                                                       scores  of  4 or above most
                                                          scores of 4 or above most
                                                       frequently
                                                          frequently in 2018
                                                                        in 2018
          Birmingham   and  Manchester                                                                                                                                                      deaths deaths
             Birmingham   and Manchester
                     emit the most NONO
          and  PM2.5
                       emit the
                     outside of
                                 most
                                London
                                      2
                                        2
                                                           London   hashas thetheroad  with thethe
                                                                                                                                                                      Rising to
                                                                                                                                                                              Rising to

                                                                                                                                                                      1 in
                                                                                                                                                                         1 16
             and PM2.5 outside of London                      London                road with

                                                                                                                                                                           in 16            deaths in citiesin
                                                                                                                                                                                                   deaths    like London,
                                                                                                                                                                                                               cities       Slough,Slough,
                                                                                                                                                                                                                      like London, Chatham Chatham
                                                           highest  NO
                                                              highest NO 2
                                                                           breach,   double
                                                                               breach, doublethethe
                                                                             2
                                                           legal limit,  and    is the biggest
                                                              legal limit, and is the biggest  emitter
                                                                                                  emitter
     Swansea hashas
                 thethe
                     highest PM2.5                         of both NO
                                                              of both NO   and   PM2.5
                                                                               and PM2.5
                                                                                                                                                                                            and Luton
                                                                                                                                                                                                   and Luton
       Swansea          highest PM2.5                                   2
                                                                          2
       emissions per 10,000  people
         emissions per 10,000 people                                                                          Give cities more powers       Introduce Environmental   But it isBut
                                                                                                                                                                                lower,
                                                                                                                                                                                   it isatlower, at

                                                                                                                                                                      1 in
                                                                                                                                                                         1 33
                                                                                                                                                                           in 33
                                            Bournemouth
                                               Bournemouth is the  citycity
                                                               is the    with
                                                                            with                                 and resources to              Improvement Bonds
                                            thethe
                                                highest number     of days  with poor airair
                                                                                         quality                 clean up their air
                                                   highest number of days      with poor     quality                                                                                        deaths in citiesin
                                                                                                                                                                                                   deaths    like Dundee
                                                                                                                                                                                                               cities       and Aberdeen
                                                                                                                                                                                                                      like Dundee and Aberdeen
Cities Outlook 2020 - Centre for Cities
Contents

01
Cities Outlook 2020
Political gains, economic realities				   1

02
Holding our breath
How poor air quality blights cities				   7

03
City Monitor
The latest data				                       33
Cities Outlook 2020 - Centre for Cities
Centre for Cities

    01
    Cities Outlook
    2020
    Political gains,
    economic realities
1   Cities Outlook 2020   Cities Outlook 2020    2
Cities Outlook 2020 - Centre for Cities
Centre for Cities

    Political gains,                                                                           Tories held 107 seats in the North and Midlands compared to Labour’s 143.
                                                                                               Today, 150 are blue and 111 red.

    economic realities                                                                         Of this 43-seat increase, there is a distinctly urban flavour. Compared to 12
                                                                                               more in non-urban areas, the Conservatives gained 31 urban seats in the North
                                                                                               and Midlands, of which 17 were part of larger urban areas such as Birmingham,
    The political imperative for investing in the North and                                    Sheffield and Manchester.

    Midlands is clear from last month’s election. But the                                      There has been no such change in the geography of the economy in the
    Government must work with economic realities if it is to                                   last decade. In 2010, the south of England accounted for 53 per cent of all
                                                                                               economic output, up from 51 per cent in 1998. By 2018 (the latest available
    deliver for the voters who delivered its majority.                                         data), this had continued to widen to 54 per cent, driven by the growth
                                                                                               of London.

    “I believe that talent and genius and initiative and chutzpah are evenly distributed       These patterns are not sustainable either economically or politically. But the
    across the whole UK. But it is also clear that opportunity is not evenly distributed and   economic reality means that the Government must be careful what it promises
    it is the job of this one-nation Conservative government to unlock talent in every         so as not to create a noose for its own neck. To govern is to decide – to deliver
    corner of the UK because that is the right thing to do in itself and because that is       on pledges requires prioritisation driven by an understanding of both the
    the way to release the economic potential of the whole country.”                           politics and the economics.
                            Boris Johnson, Conservative Party Conference 2019                  A clear set of policies should be put in place to help all areas of the country
                                                                                               – be they central London boroughs, cities, towns or villages – to improve the
    The last decade was one of stagnation for the economy and of turbulence in                 quality of public services available to people no matter where they live. This
    politics. Four general elections, four prime ministers and two referendums have            should be done in two ways.
    been set against a backdrop of public sector austerity, barely positive wage
    growth and poor productivity improvements.                                                 The first is to end austerity for local government in this year’s Spending
                                                                                               Review. As Cities Outlook 20191 showed, local government is the part of
    The UK enters the third decade of this century with a former Mayor of London               government that has by far and away been hardest hit by austerity. This
    as Prime Minister. He presides over a government with the largest majority in              has had implications for the range and quality of services local government
    almost 15 years, elected on a promise to level the country up and govern as a              delivers, particularly those for which it does not have a statutory obligation. To
    ‘one nation’ or ‘people’s government’.                                                     protect spending in social care for example, other areas such as spending on
                                                                                               planning and cultural services have seen even larger cuts.
    Much has been written about how voters in towns helped secure the political
    ambition of a parliamentary majority. But if the Government is to achieve its              The second is to make good on its election commitments to increase
    economic ambitions – genuinely ‘levelling up’ regions across the country – then            spending on other public services, such as education, policing and the
    it is larger urban areas that hold the key.                                                NHS. In doing so it can pull a lever over which it has clear control to improve
                                                                                               the standard of living for people everywhere, including in its
    The election result has led to calls for the Government to reward those areas              newly-won constituencies.2
    that helped it win its majority with increased spending. The political imperative
    here is obvious. The make-up of the Conservative Government looks less
    southern than would ever have seemed feasible 10 years ago. In May 2010, the
                                                                                               1 Centre for Cities (2019), Cities Outook 2019, London: Centre for Cities.
                                                                                               2 Westlake S (2019), Hunting for Hinzelmann, or: helping towns without magical thinking.

3   Cities Outlook 2020                                                                                                                                                                   Cities Outlook 2020    4
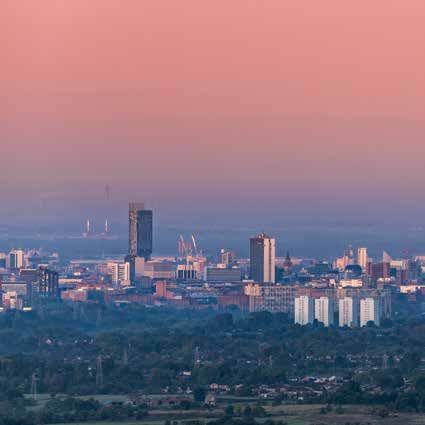
Cities Outlook 2020 - Centre for Cities
Centre for Cities

    In stark contrast, the levers it has to pull to significantly reshape the economy                      This has limited the increase in job opportunities and wages for the 16 million
    - and specifically where certain parts of the economy locate - are much more                           people who live in cities in the North and Midlands and those people living in
    limited, despite claims made by politicians for many decades.3                                         smaller towns around them. The contrasting fortunes of places such as Hertford
                                                                                                           and St Albans to those of Hartlepool and St Helens help illustrate this.
    The move to a more knowledge-based economy that has happened in recent
                                                                                                           This means that, in order to achieve its objective of ‘levelling up’, the
    decades and that will most likely continue in the coming ones is one that,
                                                                                                           Government needs to identify the cities that, with support, have the potential to
    in principle, benefits the largest cities and towns. This has been seen in a
                                                                                                           be more successful than they currently are and can have a ‘pull-up’ effect on
    number of developed countries,4 and occurs because of what urban areas allow
                                                                                                           surrounding areas.
    businesses to access – deep pools of talent and knowledge.
                                                                                                           The support offered should take two forms:
    The major problem for the UK is not that these trends have left some smaller
    places behind, although clearly a number have suffered, but that many large                            The first is to go further on devolution. The last decade has seen the
    cities in particular have not been able to sufficiently grasp the opportunities                        introduction of eight new metro mayors to add to the mayoralty in London. This
    these global forces have presented to them. Cities such as Manchester and                              did not seem likely in 2010 and constitutes welcome progress, but it has stalled
                                                                                                           since the EU referendum. Some major cities, such as Leeds, have no mayor in
    Liverpool lag behind the national economy in terms of productivity, when
                                                                                                           place and so have a very limited suite of powers to improve their economy. This
    they should be leading it. In 2018, cities in the South5 were 43 per cent more
                                                                                                           needs to change.
    productive than those in the North and Midlands (see Figure 1). If the cities of
    the North and Midlands ‘levelled up’ to those of the South, the UK economy                             And, while other city regions, such as Greater Manchester and Liverpool City
    would be £183 billion — or 9 per cent — larger.                                                        Region, do have a mayoral devolution deal in place, the powers they have in
                                                                                                           a number of areas are inferior to those held by the Mayor of London, not to
    Figure 1:                                                                                              mention mayors elsewhere in the world. The Government should use May’s
    Productivity of British cities (GDP per worker)                                                        metro mayoral elections to ensure that the existing and new metro mayors
                                                           South                                           can stand as equals with global counterparts such as New York’s Bill de Blasio,
    43% more productive
                                                           North and Midlands                              Paris’s Anne Hidalgo and Berlin’s Michael Mueller.
                                 £83,184
                                                                                                           But market forces and policy challenges are too big and persistent for local
                                                                                                           effort to do this alone. While devolution is necessary, it is not sufficient
                                                                                                           on its own. So, secondly, there should be direct intervention from the
                                 £58,346
                                                                                                           Government in conjunction with the city regions it aims to improve, based on
                                                                                                           the following principles:

                                                                                                            • Selective investment in a few places reflecting relative potential, rather
                                                                                                              than jam-spreading money across lots of areas.

    Source: ONS (2020), Regional gross domestic product (GDP) reference tables, Business Register of        • Significant investment — in the billions per year — rather than one-off
    Employment Survey, 2018 data.                                                                             pots of smaller sums of cash.
                                                                                                            • Sustained investment, with funding over a 10-year period, rather than
                                                                                                              short, ad-hoc funds to deal with specific issues.

    3 Swinney P and Thomas E (2015), A Century of Cities: Urban economic change since 1911, London:        The 2010s will be viewed as a decade of austerity, uncertainty, stop-start
      Centre for Cities.                                                                                   policy and hiatus. The 2020s must represent a new decade of investment from
    4 For example, see Moretti, E. (2013) The New Geography of Jobs. Houghton Mifflin Harcourt, New York
                                                                                                           national government and more devolution of power to help tackle the nation’s
      for how this has evolved in the USA.
    5 Defined as the regions of London, South East, East and South West.
                                                                                                           number one economic problem: the underperformance of many of its largest
                                                                                                           cities and towns. For the success and cohesion of the country as a whole, we
                                                                                                           cannot afford for this decade to be anything else.
5   Cities Outlook 2020                                                                                                                                                                        Cities Outlook 2020    6
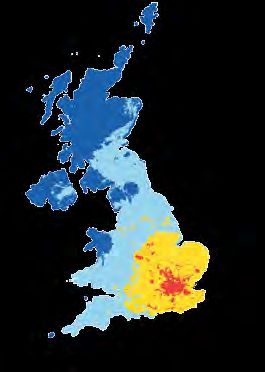
Cities Outlook 2020 - Centre for Cities
Centre for Cities

    02
    Holding our
    breath
    How poor air quality
7   blights cities
    Cities Outlook 2020    Cities Outlook 2020    8
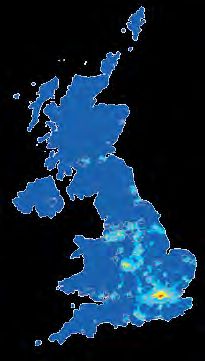
Cities Outlook 2020 - Centre for Cities
Centre for Cities

    How poor air quality                                                                                          Air pollution is an urban problem
                                                                                                                  Air quality tends to be worse in cities than elsewhere in the country. Figure

    blights cities                                                                                                2 shows the geography of background concentration levels of two major
                                                                                                                  pollutants – nitrogen dioxide (NO2) and fine particulate matter 2.5 (PM2.5)8 -
                                                                                                                  across the UK.
    The state of the environment has never been higher on
                                                                                                                  NO2 has a clear local pattern and is mostly concentrated where it is emitted:
    the national and international agenda, driven by concerns                                                     in urban areas and by busy roads. NO2 values are particularly high in the areas
    about climate change. Air quality has received less                                                           around London, but all urban areas have high levels.
    attention but, given the impact it has on the health of                                                       PM2.5, which includes soot and dust generated by the burning of fuels and
    residents and workers in cities in particular, urgent action                                                  from brake pads being applied to tyres, is more widely spread. Despite
    is needed from local and national government to clean up                                                      this there is still a clear geography — levels are higher in cities than their
                                                                                                                  surrounding areas, and particularly high in cities in the Greater South East.9 The
    the air we breathe.                                                                                           higher levels seen across the Greater South East as a whole result partly from
                                                                                                                  emissions from London and from contributions from continental Europe.

    Climate change has rightly risen up the national and international agenda over                                Figure 2:
    the last year, thanks to the actions of movements such as Extinction Rebellion                                UK ambient air quality: NO2 and PM2.5 annual mean concentration,
    and Youth Climate Strikes. And it has become a big issue for local government                                 2018
    — in the UK, more than 260 local authorities have declared states of ‘Climate
                                                                                                                                                    Nitrogen Dioxide                                   PM2.5
    Emergency’. In Centre for Cities and Arup’s Urban Voices survey of elected                                                                      background                                         background
                                                                                                                                                    concentration                                      concentration
    city leaders at the end of last year, climate change was identified as a top                                                                    Annual mean (µg m3)                                Annual mean (µg m3)
    policy priority.6                                                                                                                                  0 - 10                                             0.0 - 5.0
                                                                                                                                                       10.1 - 20                                          5.1 - 8.0
                                                                                                                                                       20.1 - 30                                          8.1 - 10.0
    Less attention has been paid to tackling air pollution, which is more local in                                                                     30.1 - 40                                          > 10
    its impact. And yet it is a killer - with an effect equivalent to 40,000 deaths                                                                    > 40

    each year, air pollution is the largest environmental risk to public health in the
    UK. These health effects also directly impact productivity: air pollution causes
    over six million sick days a year in the UK.7 Cities, as places that concentrate
    economic activity and the pollutants they produce, are particularly affected.
    But there is too little awareness of the geography of air pollution and its
    impacts. Using a range of measures (see Box 1), this chapter sets out how air
    quality varies across UK cities, and what this means for policy.

                                                                                                                  Source: Defra, 2019. Background mapping for local authorities.

    6 Jeffrey S, Neuhuber T, Arntzen S, and Wilcox Z (2019), Urban Voices, London: Centre for Cities.
    7 Royal College of Physicians (2016), Every breath we take: the lifelong impact of air pollution. Report of
      a working party, London: RCP.

                                                                                                                  8 PM2.5, also known as fine particulate matter, refers to particles that have a diameter less than 2.5
                                                                                                                    micrometres.
9   Cities Outlook 2020                                                                                                                                                                                                      Cities Outlook 2020    10
                                                                                                                  9 Defined as the region comprising London, South East and East.
Centre for Cities

        Box 1: Methodology box: how to measure air pollution?                                                        Box 2: Defining cities
        Air pollution is difficult to measure and there is not one single way                                        Centre for Cities’ research focuses on the UK’s 63 largest towns and
        to present pollution or to assess the quality of air. While some work                                        cities, defined as primary urban areas (PUAs).
        focuses on the pollution stemming from specific pollutants such as NO2
                                                                                                                     Unless otherwise stated, Centre for Cities uses data for PUAs in its
        or particulate matter, other methods look at several different pollutants
                                                                                                                     analysis – a measure of the “built-up” area of a large city or town, rather
        within one index.
                                                                                                                     than individual local authority districts. In this report PUAs are used in
        It is important to differentiate between emissions and concentration                                         the analysis because they provide a consistent measure to compare
        data. Emissions data is mostly used for the identification of the source                                     concentrations of economic activity across the UK. This makes them
        and its origin (such as transport or domestic combustion). But, as local                                     distinct from city region or combined authority geographies.
        emissions are only part of the story, it is the concentrations of pollution
                                                                                                                     You can find the full definitions table and a methodological note at:
        that give an indication of how polluted a place is. Concentration levels
                                                                                                                     www.centreforcities.org/puas.
        are measured at monitoring sites, located either nearby (roadside) or
        further away (background) from roads.10

        To give a comprehensive, comparative picture of air quality across the
        UK, this chapter uses different approaches to measure air pollution.                                      Poor air quality is a particular problem in
        It uses data from the Met Office’s Daily Air Quality Index, which uses                                    southern cities
        five different pollutants11 to give an overview of air pollution in the UK,
                                                                                                                  While cities generally show higher levels of pollution compared to non-urban
        and complements this by looking in more detail at nitrogen dioxide and
                                                                                                                  areas, not all cities experience the same levels of air pollution.
        particulate matter 2.5.

        For nitrogen dioxide concentration, the UK is not currently meeting the                                   The Daily Air Quality Index (DAQI) measures daily air quality in a place on
        legally-binding target of an annual mean of 40 micrograms per cubic                                       a scale from 1 (low) to 10 (very high), and is made up of a basket of five
        metre (µg/m3). And, while legal limits for PM2.5 (set at 25 µg/m3) are not                                pollutants. A score of 4 or above can affect adults and children with lung or
        being breached, they do exceed World Health Organisation guidelines of                                    heart problems, while values equal to 7 or above are likely to have immediate
        10 µg/m3.                                                                                                 impacts even on those without existing health issues.12 In the UK, average
                                                                                                                  daily values are usually between 2 and 4, but these mask spikes in pollution in
                                                                                                                  specific areas.13

     10 While roadside concentration helps measure traffic-related concentration levels, it is important to
       consider components coming from outside the local source, in order to obtain a broader picture of air
       pollution in an area, hence the use of background concentration. It can be defined as the remaining
                                                                                                                  12 Above 7, the UK Air website recommends to the general population to consider reducing outdoor
       pollution concentration if all the local sources were removed. These two elements provide an accurate
                                                                                                                    activities.
       estimate of air pollution concentration in an area.
                                                                                                                  13 The data of the DAQI models background air quality, which does not consider the impact of local
     11 The index is based on five pollutants: nitrogen dioxide (NO2), sulphur dioxide, ozone, and two types of
                                                                                                                    sources such as roadsides and or industrial sites. The air pollution close those local sources may
       particulate matters, PM10 and PM2.5.
                                                                                                                    be larger.

11   Cities Outlook 2020                                                                                                                                                                                                 Cities Outlook 2020    12
Centre for Cities

     Figure 3:                                                                                                                                                                                              Figure 3 shows the number of days during 2018 when the maximum DAQI
     Number of days the maximum modelled DAQI was equal to or above 4                                                                                                                                       in one place in a city was equal or above 4 in a year, i.e. the number of days
     in 2018                                                                                                                                                                                                where air quality was poor enough to affect those with pre-existing
                                                                                                                                                                                                            health issues.
                        Number of                   Number of
                        days DAQI                   days DAQI
                        equal to or                 equal to or                                                                                                                                             Cities in the South saw scores of 4 or above most frequently in 2018.
      City                above 4 City                above 4
                                                                                                                                                                                                            Bournemouth had the highest number, with DAQI measuring 4 or above on 62
      Bournemouth                62 Bradford               26
                                                                                                                                               Number of days DAQI                                          separate days of the year. It was followed by London and Southampton, which
      London                     56 Crawley                26
                                                                                                                                               equal to or over 4                                           had over 50 days where this score was met or exceeded.14
      Southampton                52 Leicester              26
                                                                                                                                                 ! 8 - 15
      Portsmouth                 49 Wigan                  26                                                                                                                                               Edinburgh and Belfast had the lowest number, with just seven days at or above
                                                                                                                                                 ! 16 - 25
      Bristol                    48 Blackburn              25                                                                 ! Aberdeen                                                                    4. They were followed by two other Scottish cities, Aberdeen and Dundee, with
                                                                                                                                                 ! 26 - 35
      Southend                   48 Liverpool              25
                                                                                                                                                 ! 36 - 45                                                  respectively 9 and 11 days.
      Norwich                    45 Northampton            25
                                                                                                                !   Dundee                       ! 46 - 65
      Swansea                    44 Plymouth               25                                                                                                                                               Of the basket of pollutants in the DAQI, two are of particular concern for
      Reading                    42 Telford                25                                                Edinburgh                                                                                      human health. The first, nitrogen dioxide (NO2), is the only pollutant for which
      Aldershot                  41 Middlesbrough          25                            ! Glasgow !
                                                                                                                                                                                                            the UK breaches existing legal limits. And, while the UK complies with the law
      Cambridge                  40 Worthing               25                                                                                                                                               for the second, particulate matter 2.5 (PM2.5), it is well above the guidelines
      Chatham                    40 Stoke                  24
                                                                                                                                                                                                            recommended by the World Health Organisation (WHO).
      Birmingham                 39 York                   24                                                                           !
                                                                                                                                            Newcastle

                                                                                                                                         ! Sunderland
      Cardiff                    38 Burnley                23                                                                                                                                               For NO2, there are two measures to consider – the number of roads that
                                                                  ! Belfast                                                                    ! Middlesbrough
      Peterborough               38 Hull                   23                                                                                                                                               breach legal limits (shown by the colours in Figure 4) and by how much the
      Swindon                    37 Leeds                  23                                                              Bradford
                                                                                                            Blackburn Burnley                                                                               worst performing roads breach this limit (shown by the size of the circles). The
                                                                                                                                               York
      Newport                    36 Mansfield              23                                                      Leeds !
                                                                                                 Blackpool
                                                                                                           ! ! ! ! ! Wakefield !Hull
                                                                                                                         Huddersfield                                                                       map shows that 38 of 63 cities had monitored roads which record excessive
      Slough                     35 Nottingham             23                                         Preston  !  ! ! !
                                                                                                         Wigan
                                                                                                   Liverpool  ! !   !        Doncaster
                                                                                                                                                                                                            NO2 concentrations and 15 cities had 10 per cent or more of their roads above
      Basildon                   35 Warrington             23                                  Birkenhead !
                                                                                                            ! !      ! Sheffield
                                                                                                       Warrington
                                                                                                                    Manchester Barnsley                                                                     legal limits. They are relatively spread across the country, but London had
      Gloucester                 34 Newcastle              22                                                                                 !Mansfield
                                                                                                                    Stoke
                                                                                                                            !       Derby
                                                                                                                                            ! ! Nottingham                                                  the highest proportion with nearly 40 per cent of monitored roads on average
      Ipswich                    33 Sheffield              22                                                                                                                                     Norwich
                                                                                                                      !
                                                                                                                Telford
                                                                                                                                        Leicester
                                                                                                                                                                ! Peterborough
                                                                                                                                                                                              !             above the legal limit. The capital was followed by Aldershot, Coventry
      Luton                      33 Sunderland             21                                                                                  !
                                                                                                                   Birmingham
                                                                                                                                   ! !Coventry                                                              and Basildon.
      Manchester                 31 Barnsley               19                                                                       Northampton!
                                                                                                                                                                            Cambridge
                                                                                                                                                                        !
      Coventry                   30 Doncaster              19                                                                        Milton Keynes !
                                                                                                                                                                                             ! Ipswich
                                                                                                                          Gloucester
                                                                                                                              !              Oxford            !Luton                                       London also had the road with the highest reading of NO2 in the country,
      Oxford                     30 Huddersfield           19                    Swansea              Newport                     Swindon     !                                   Basildon
                                                                                             !              !                          !
                                                                                                                                                      Slough     London       ! ! Southend                  which was more than twice the legal limit, followed by roads in Birmingham,
      Brighton                   29 Derby                  16                                           !            !                                             !
                                                                                                  Cardiff                                   Reading ! !                        !
                                                                                                                                                                                                            Southampton and Middlesbrough.
                                                                                                                    Bristol
                                                                                                                                                       !                             Chatham
      Exeter                     29 Glasgow                16                                                                                Aldershot
                                                                                                                                                                        Crawley
                                                                                                                                        Southampton
                                                                                                                                                                  !
      Blackpool                  29 Wakefield              16                                                                                !                      Brighton
                                                                                             Exeter                   Bournemouth                !             !!
      Milton Keynes              29 Dundee                 11                                      !                                !         Portsmouth       Worthing

      Preston                    28 Aberdeen                 9                Plymouth
                                                                                         !
      Birkenhead                 27 Edinburgh                7
                                     Belfast                 7

     Source: Met Office, 2019.
                                                                                                                                                                                                            14 The Met Office notes that modelling for air quality in coastal areas is more challenging than
                                                                                                                                                                                                              elsewhere.

13           Cities Outlook 2020                                                                                                                                                                                                                                                                               Cities Outlook 2020    14
Centre for Cities                                                                                                                                                                                                                                                                                                  Centre for Cities

     Figure 4:                                                                                                                                                 The geography of cities exceeding the WHO guidelines for PM2.5 is more
     Share of roads breaching NO2 legal limits and the                                                                                                         clear cut than that of those breaching legal limits for NO2. Cities in the South
     maximum concentration reached, 2018                                                                                                                       of England tend to perform more poorly on this measure, with Scottish cities
                                                                                                           Share of roads breaching
                                                                                                                                                               having amongst the fewest breaches. In terms of highest concentration
                                                                                                           NO2 legal limits (%)                                reached, the worst monitored road was once again located in London (17
                                                                                                                   0
                                                                                                                                                               µg/m3), followed by other cities in the South East of England: Portsmouth,
                                                                                                                   1- 9
                                                                                                                   10 - 20                                     Aldershot, Chatham and Reading, which all have a maximum recorded value of
                                                                                                                   > 20                                        around 15 µg/m3.
                                                                                               Aberdeen
                                                                                                           Maximum annual
                                                                                                           concentration reached (µg/m3)                       Figure 5:
                                                                                                                       0 - 40 (below legal limits)
                                                                                   Dundee
                                                                                                                       41 - 45
                                                                                                                                                               Share of roads breaching PM2.5 WHO guidelines and the maximum
                                                                             Edinburgh                                 46 - 55                                 concentration reached, 2018
                                                                 Glasgow
                                                                                                                       > 55
                                                                                                                                                                                                                                                                     Share of roads breaching
                                                                                                                                                                                                                                                                     WHO PM2.5 guidelines (%)
                                                                                                       Newcastle                                                                                                                                                            0
                                                                                                        Sunderland
                                                                                                                                                                                                                                                                            1- 20
                                                                                                             Middlesbrough
                                          Belfast                                                                                                                                                                                                                           21- 60
                                                                                                                                                                                                                                                                            61 - 99
                                                                                          Bradford
                                                                           Blackburn Burnley         York
                                                                                               Leeds                                                                                                                                                                        100
                                                                   Blackpool                         Huddersfield                                                                                                                                       Aberdeen
                                                                       Preston
                                                                          Wigan
                                                                                                     Wakefield
                                                                                                                  Hull
                                                                                                                                                                                                                                                                    Maximum PM2.5 annual
                                                                    Liverpool                            Doncaster
                                                                                                     Sheffield
                                                                                                                                                                                                                                                                    concentration reached (µg/m3)
                                                                Birkenhead        Manchester
                                                                        Warrington          Barnsley   Mansfield
                                                                                                                                                                                                                                           Dundee                               0 - 10 (below WHO guidelines)
                                                                               Stoke        Derby
                                                                                                      Nottingham                                                                                                                                                                10.1 - 12
                                                                                                                                                     Norwich                                                                         Edinburgh
                                                                             Telford               Leicester                                                                                                                                                                    12.1 - 14
                                                                                                                           Peterborough                                                                                 Glasgow
                                                                             Birmingham                  Coventry
                                                                                                                                  Cambridge
                                                                                                                                                                                                                                                                                14.1 - 17
                                                                                             Northampton
                                                                                                Milton Keynes                                       Ipswich
                                                                                  Gloucester                             Luton
                                                                        Newport                        Oxford                            Basildon
                                                       Swansea                                                           London                                                                                                                              Newcastle
                                                                                             Swindon         Slough
                                                                                                                                                Southend                                                                                                        Sunderland

                                                                   Cardiff         Bristol       Reading                                                                                                                                                             Middlesbrough
                                                                                                                                           Chatham                                                 Belfast
                                                                                                  Aldershot                      Crawley
                                                                                                 Southampton
                                                                                  Bournemouth                                 Brighton                                                                                                           Bradford
                                                               Exeter                                                                                                                                                             Blackburn Burnley
                                                                                                                                                                                                                                                            York
                                                                                                                                                                                                                                                      Leeds
                                                                                                          Portsmouth Worthing                                                                                             Blackpool
                                                    Plymouth                                                                                                                                                                                               Huddersfield
                                                                                                                                                                                                                              Preston                                               Hull
                                                                                                                                                                                                                                 Wigan                      Wakefield
                                                                                                                                                                                                                           Liverpool                                   Doncaster
                                                                                                                                                                                                                        Birkenhead             Barnsley            Sheffield
                                                                                                                                                                                                                               Warrington Manchester                 Mansfield
                                                                                                                                                                                                                                       Stoke    Derby
                                                                                                                                                                                                                                                                     Nottingham

                                                                                                                                                                                                                                                                Leicester                                  Norwich
                                                                                                                                                                                                                                       Telford
                                                                                                                                                                                                                                                                                   Peterborough
                                                                                                                                                                                                                                        Birmingham
                                                                                                                                                                                                                                                                   Coventry
                                                                                                                                                                                                                                                                                           Cambridge
     Source: Defra, 2019. Annual average nitrogen dioxide concentrations for all modelled UK road links.                                                                                                                                              Northampton
                                                                                                                                                                                                                                                                                                          Ipswich
                                                                                                                                                                                                                                                        Milton Keynes
                                                                                                                                                                                                                                           Gloucester                              Luton
                                                                                                                                                                                                                                                               Oxford
                                                                                                                                                                                                                 Swansea         Newport                                                      Basildon
                                                                                                                                                                                                                                                      Swindon                     London
                                                                                                                                                                                                                                                                      Slough
                                                                                                                                                                                                                                                                                                       Southend

     Turning to PM2.5, data shows that around 62 per cent of monitored roads15                                                                                                                                            Cardiff           Bristol        Reading
                                                                                                                                                                                                                                                                                                 Chatham
                                                                                                                                                                                                                                                            Aldershot                 Crawley

     in UK cities exceed the WHO guidelines for annual levels of PM2.5 (10                                                                                                                                                               Bournemouth
                                                                                                                                                                                                                                                           Southampton
                                                                                                                                                                                                                                                                                      Brighton
                                                                                                                                                                                                                        Exeter

     micrograms per cubic metre (µg/m3)) as illustrated by the large share of purple                                                                                                                         Plymouth
                                                                                                                                                                                                                                                                Portsmouth        Worthing

     circles in Figure 5. If the WHO guidelines were law in the UK, all the monitored
     roads in 19 cities would breach this limit.

                                                                                                                                                               Source: Defra, 2019. Annual average PM2.5 concentrations for all modelled UK road links.
     15 There are more than 9,900 monitoring sites located on A roads and motorways across the UK. The
       readings are dependent on the location and monitors available. Not all roads are monitored and the
       existence of monitors may be skewed towards more densely-populated areas.

15   Cities Outlook 2020                                                                                                                                                                                                                                                                                             Cities Outlook 2020    16
Centre for Cities

     Not all air pollution in a city is generated by that city                               Figure 6:
                                                                                             PM2.5 and NO2 emissions per 10,000 population across UK cities, 2018
     Air quality in a city is not only determined by the activities in a city itself. Some
                                                                                                        PM2.5 emissions per 10,000 population                  NO2 emissions per 10,000 population
     air pollution is blown in from elsewhere. For example, high levels of PM2.5                           Swansea                                         Warrington
     in the Greater South East, as shown earlier, are partly explained by pollution                          Belfast                                          Swansea
                                                                                                           Newport                                      Middlesbrough
     coming across the Channel from the continent. There is little cities can do                        Warrington                                             Crawley
                                                                                                           Norwich                                            Newport
     about this and addressing it will require international agreements and action.                         Burnley                                          Chatham
                                                                                                        Portsmouth                                          Wakefield
                                                                                                           Swindon                                              Slough
     But national and local policy has much more control over locally-generated air                       Aldershot
                                                                                                          Chatham
                                                                                                                                                            Doncaster
                                                                                                                                                             Aberdeen
     pollution and looking at the data on emissions shows the size of this problem.                         Preston                                            Preston
                                                                                                            Crawley                                      Peterborough
     In absolute terms, London, Birmingham and Manchester emit the highest                           Milton Keynes                                              Telford
                                                                                                        Sunderland                                            Basildon
     tonnages of emissions, both for PM2.5 and NO2. London particularly stands                             Reading                                               Bristol
                                                                                                           Barnsley                                             Cardiff
     out, as it emits more than 6,000 tonnes of PM2.5, and 51,000 tonnes of NO2,                              Derby                                           Swindon
                                                                                                     Middlesbrough                                            Norwich
     which is as much as three times the tonnage emitted in the other two.                            Southampton                                                Leeds
                                                                                                         Wakefield                                             Reading
                                                                                                          Plymouth                                               Stoke
     On a per-capita basis, Swansea and Belfast have the highest PM2.5 emissions                          Liverpool                                             Belfast
                                                                                                         Gloucester                                           Sheffield
     per 10,000 inhabitants, while London has the lowest (see Figure 6). For NO2,                            Telford                                         Aldershot
                                                                                                             Cardiff                                          Barnsley
     Warrington, Swansea and Middlesbrough have the highest emissions per                                     Bristol                                     Huddersfield
                                                                                                          Worthing                                      Milton Keynes
     10,000 inhabitants.                                                                              Bournemouth                                          Birkenhead
                                                                                                          Blackpool                                              Derby
                                                                                                       Huddersfield                                         Mansfield
                                                                                                      Peterborough                                        Birmingham
                                                                                                              Exeter                                       Sunderland
                                                                                                                Hull                                     Southampton
                                                                                                              Leeds                                         Edinburgh
                                                                                                         Blackburn                                           Liverpool
                                                                                                         Doncaster                                            Brighton
                                                                                                             Slough                                       Nottingham
                                                                                                           Basildon                                          Blackpool
                                                                                                              Stoke                                       Manchester
                                                                                                        Birkenhead                                             Burnley
                                                                                                               York                                               York
                                                                                                             Oxford                                          Leicester
                                                                                                           Brighton                                                Hull
                                                                                                            Ipswich                                          Plymouth
                                                                                                           Bradford                                         Gloucester
                                                                                                              Luton                                        Portsmouth
                                                                                                       Birmingham                                           Newcastle
                                                                                                         Mansfield                                           Coventry
                                                                                                       Manchester                                             Glasgow
                                                                                                              Wigan                                            Dundee
                                                                                                          Aberdeen                                               Wigan
                                                                                                       Nottingham                                                Luton
                                                                                                           Sheffield                                     Bournemouth
                                                                                                          Southend                                              Oxford
                                                                                                          Coventry                                            Bradford
                                                                                                          Leicester                                         Blackburn
                                                                                                            Dundee                                               Exeter
                                                                                                      Northampton                                        Northampton
                                                                                                           Glasgow                                           Southend
                                                                                                         Newcastle                                             London
                                                                                                         Cambridge                                             Ipswich
                                                                                                         Edinburgh                                          Cambridge
                                                                                                            London                                           Worthing
                                                                                                                    0 5 10 15 20 25 30 35 40 45                        0   50 100 150 200 250 300 350

                                                                                                           Tonnes PM2.5 emitted per 10,000 population       Tonnes NO2 emitted per 10,000 population

                                                                                             Source: BEIS 2019. UK National Atmospheric Emissions Inventory (NAEI).

17   Cities Outlook 2020                                                                                                                                                                                Cities Outlook 2020    18
Centre for Cities

     The sources of air pollution vary across cities, and                                                    Figure 7:
                                                                                                             NO2 and PM2.5 sector breakdown for UK cities, 2018
     road transport is just one of a number of causes
                                                                                                                                                                                                                                NO2 emissions by sector
     Transport is the main source of NO2 emissions but not the only one. At a                                                                         100

                                                                                                              Share of NO2 emissions (%)
                                                                                                                                                      90

     national level, road transport accounts for 34 per cent of all NO2 emissions,16                                                                  80

                                                                                                                                                      70

     and this rises to 42 per cent in cities - it represents the biggest source of local                                                              60

                                                                                                                                                      50

     NO2 in 54 cities (see Figure 7).                                                                                                                 40

                                                                                                                                                      30

                                                                                                                                                      20

                                                                                                                                                      10

     But transport plays a smaller role in PM2.5 emissions, accounting for 12 per                                                                      0

                                                                                                                                                            Milton Keynes
                                                                                                                                                                 Aldershot
                                                                                                                                                             Northampton
                                                                                                                                                                    Preston
                                                                                                                                                                   Swindon
                                                                                                                                                                   Barnsley
                                                                                                                                                                      Leeds
                                                                                                                                                                      Wigan
                                                                                                                                                                   Glasgow
                                                                                                                                                                  Worthing
                                                                                                                                                               Sunderland
                                                                                                                                                                Newcastle
                                                                                                                                                                Doncaster
                                                                                                                                                               Manchester
                                                                                                                                                                    London
                                                                                                                                                             Bournemouth
                                                                                                                                                                 Mansfield
                                                                                                                                                                      Stoke
                                                                                                                                                                     Bristol
                                                                                                                                                                 Edinburgh
                                                                                                                                                             Peterborough
                                                                                                                                                               Portsmouth
                                                                                                                                                                        York
                                                                                                                                                                    Burnley
                                                                                                                                                                     Cardiff
                                                                                                                                                               Nottingham
                                                                                                                                                                  Leicester
                                                                                                                                                              Huddersfield
                                                                                                                                                                  Liverpool
                                                                                                                                                                    Dundee
                                                                                                                                                                Cambridge
                                                                                                                                                                 Blackburn
                                                                                                                                                                 Blackpool
                                                                                                                                                                 Southend
                                                                                                                                                              Birmingham
                                                                                                                                                             Southampton
                                                                                                                                                                  Coventry
                                                                                                                                                                   Reading
                                                                                                                                                                      Exeter
                                                                                                                                                                   Bradford
                                                                                                                                                                     Telford
                                                                                                                                                                  Sheffield
                                                                                                                                                                      Derby
                                                                                                                                                                     Belfast
                                                                                                                                                                    Ipswich
                                                                                                                                                                  Plymouth
                                                                                                                                                                      Luton
                                                                                                                                                                     Oxford
                                                                                                                                                                        Hull
                                                                                                                                                                   Basildon
                                                                                                                                                               Birkenhead
                                                                                                                                                                   Brighton
                                                                                                                                                                   Norwich
                                                                                                                                                                   Newport
                                                                                                                                                                Gloucester
                                                                                                                                                                 Wakefield
                                                                                                                                                                 Aberdeen
                                                                                                                                                                Warrington
                                                                                                                                                                     Slough
                                                                                                                                                            Middlesbrough
                                                                                                                                                                  Swansea
                                                                                                                                                                   Crawley
                                                                                                                                                                  Chatham
     cent of these emissions at a national level, with similar levels in UK cities.
     Instead, it is domestic combustion (for example, through coal or wood fires)
     that is the biggest contributor. Around 38 per cent of PM2.5 levels in the UK                                                                                                                                            PM2.5 emissions by sector
     can be explained by domestic wood and coal burning.17 In cities, this rises                                                                      100

                                                                                                              Share of PM2.5 emissions (%)
                                                                                                                                                      90

     to 50 per cent, and is the largest source of PM2.5 in 57 UK cities. Some of
                                                                                                                                                      80

                                                                                                                                                      70

     this is to do with the rise in the use of wood stoves. The industry body HETAS
                                                                                                                                                      60

                                                                                                                                                      50

                                                                                                                                                      40

     estimated that the number of wood stove registrations increased 10-fold                                                                          30

                                                                                                                                                      20

     between 2004 and 2014.18                                                                                                                         10

                                                                                                                                                       0

                                                                                                                                                                                                                                        Slough

                                                                                                                                                                                                                                                                                                       Telford
                                                                                                                                                                 Worthing
                                                                                                                                                                 Chatham
                                                                                                                                                              Portsmouth
                                                                                                                                                                  Brighton
                                                                                                                                                                    Exeter
                                                                                                                                                                   Ipswich
                                                                                                                                                                  Reading
                                                                                                                                                                    Oxford
                                                                                                                                                            Southampton
                                                                                                                                                                 Plymouth
                                                                                                                                                            Milton Keynes
                                                                                                                                                                    Belfast
                                                                                                                                                               Gloucester
                                                                                                                                                                   Burnley
                                                                                                                                                               Birkenhead
                                                                                                                                                                 Aldershot
                                                                                                                                                            Bournemouth
                                                                                                                                                                Blackburn
                                                                                                                                                                  Bradford
                                                                                                                                                                    Cardiff
                                                                                                                                                                 Southend
                                                                                                                                                                 Liverpool
                                                                                                                                                             Huddersfield
                                                                                                                                                               Cambridge
                                                                                                                                                                     Leeds
                                                                                                                                                                Blackpool

                                                                                                                                                                                                                                                       London
                                                                                                                                                                                                                                                      Crawley
                                                                                                                                                                                                                                                        Bristol
                                                                                                                                                                                                                                                        Wigan
                                                                                                                                                                                                                                                  Manchester
                                                                                                                                                                                                                                                      Swindon
                                                                                                                                                                                                                                                       Dundee
                                                                                                                                                                                                                                                 Northampton
                                                                                                                                                                                                                                                       Preston
                                                                                                                                                                                                                                                      Newport
                                                                                                                                                                                                                                                     Coventry
                                                                                                                                                                                                                                                     Mansfield
                                                                                                                                                                                                                                                  Nottingham
                                                                                                                                                                                                                                                  Birmingham
                                                                                                                                                                                                                                                         Stoke
                                                                                                                                                                                                                                                    Edinburgh
                                                                                                                                                                                                                                                           Hull
                                                                                                                                                                                                                                                         Luton
                                                                                                                                                                                                                                                 Peterborough
                                                                                                                                                                                                                                                     Leicester
                                                                                                                                                                                                                                                      Basildon
                                                                                                                                                                                                                                                        Derby
                                                                                                                                                                                                                                                      Glasgow
                                                                                                                                                                                                                                                    Aberdeen
                                                                                                                                                                                                                                                      Norwich
                                                                                                                                                                                                                                                          York
                                                                                                                                                                                                                                                    Newcastle

                                                                                                                                                                                                                                                                                                                      Sheffield
                                                                                                                                                                                                                                                                                                                    Warrington
                                                                                                                                                                                                                                                                                                                     Doncaster
                                                                                                                                                                                                                                                                                                                     Wakefield
                                                                                                                                                                                                                                                                                                                       Barnsley
                                                                                                                                                                                                                                                                                                                      Swansea
                                                                                                                                                                                                                                                                                                                 Middlesbrough
                                                                                                                                                                                                                                                                                                                    Sunderland
     The sources of air pollution vary significantly between cities, both for NO2 and
     PM2.5. Figure 7 shows, for instance, that in Slough a relatively large part of                                                                             Domestic, commercial and institutional combustion   Other transport

     NO2 comes from combustion in energy production, whereas in Middlesbrough,                                                                                  Industry, solvents and points of emissions
                                                                                                                                                                Road transport
                                                                                                                                                                                                                    Other
                                                                                                                                                                                                                    Energy production

     Warrington and Swansea, industrial processes contribute more to NO2                                     Source: BEIS 2019. UK National Atmospheric Emissions Inventory (NAEI).
     emissions. Meanwhile, in places like Chatham or Worthing, PM2.5 is almost
     exclusively driven by combustion in commercial, institutional and domestic                              Figure 8:
     activities. In Aberdeen and Crawley, non-road transport (such as shipping or air                        The composition of sources of PM2.5 emissions for city
     transport) contributes a larger share of PM2.5 emissions.                                               centres and suburbs, 2018
                                                                                                                                                      100
                                                                                                                                                                                     4                                    5                       Domestic, commercial and institutional combustion
     Even looking at the level of a city hides variation in the sources of air pollution                                                                                                                                                          Industry, solvents and points of emissions
                                                                                                                                                                                    10                                    6
                                                                                                                                                       90
     within them. Figure 8 shows a sector breakdown of PM2.5 emissions in city                                                                                                                                                                    Road transport
                                                                                                                                                                                                                                                  Other transport
     centres and suburbs. While road transport’s contribution is much higher in city

                                                                                                             Share of PM2.5 emissions by sector (%)
                                                                                                                                                       80                                                                                         Other
                                                                                                                                                                                                                         22
                                                                                                                                                                                                                                                  Energy production
     centres, in suburbs more than half of PM2.5 emissions come from domestic                                                                          70
                                                                                                                                                                                    26

     and commercial combustion. Such a difference can be explained in part by
                                                                                                                                                       60
                                                                                                                                                                                                                         15
     higher congestion rates and traffic flows in city centres, and residential wood
     burning in less central areas. This shows that in tackling air pollution, different                                                               50
                                                                                                                                                                                    26

     approaches will be required even within a city.                                                                                                   40

                                                                                                                                                       30
                                                                                                                                                                                                                         51

                                                                                                                                                       20
                                                                                                                                                                                    33
     16 Defra (2019), Clean Air Strategy. London: The Stationery Office. Note: this figure is provided for
                                                                                                                                                       10
       nitrogen oxides, which are here expressed as NO2.
     17 Defra (2019), Clean Air Strategy. London: The Stationery Office.                                                                                    0
                                                                                                                                                                              City centres                             Suburbs
     18 Defra (2018), Domestic burning consultation. Impact assessment.
                                                                                                             Source: BEIS 2019. UK National Atmospheric Emissions Inventory (NAEI).

19   Cities Outlook 2020                                                                                                                                                                                                                                                                              Cities Outlook 2020            20
Centre for Cities

     Air pollution kills thousands of people each year, and
     affects the health of many more                                                                                                                                                                                                                         Box 3: What are the health impacts of air pollution?
                                                                                                                                                                                                                                                             The Royal College of Physicians has estimated that air pollution is
     Local data on the number of people whose health is affected by poor air
                                                                                                                                                                                                                                                             responsible for more than 20,000 hospital admissions a year due to
     quality is limited – asthma attacks brought on by poor air quality, for example,
                                                                                                                                                                                                                                                             respiratory or cardiovascular diseases.20 There is no comprehensive local
     are difficult to record in a systematic way. Box 3 looks at the broader health
                                                                                                                                                                                                                                                             data on the various health impacts of air pollution. However, research
     impacts in more detail.
                                                                                                                                                                                                                                                             conducted by King’s College London and UK 10021 has estimated the
     What can be estimated are the deaths attributable to one pollutant, PM2.5,                                                                                                                                                                              following effects on nine UK cities:
     in cities across the UK. These estimates show that, even on this very limited
                                                                                                                                                                                                                                                             •    Living near a busy road in London may contribute to 230 hospital
     measure, poor air quality is a killer.19
                                                                                                                                                                                                                                                                  admissions for strokes every year.
     This one pollutant is estimated to have caused just over 14,400 deaths of those
                                                                                                                                                                                                                                                             •    Living near a busy road may stunt lung growth in children by 12.5 per
     aged 25 or older in UK cities in 2017 (see Figure 9). In absolute terms, large
                                                                                                                                                                                                                                                                  cent in London and 14.1 per cent in Oxford.
     cities had the largest number of residents estimated to have died due to PM2.5.
     London had the highest number, followed by Birmingham and Manchester.                                                                                                                                                                                   •    In Birmingham, the risk of outside-hospital cardiac arrest is 2.3 per
                                                                                                                                                                                                                                                                  cent higher on high pollution days.
     Figure 9:
     Estimated absolute number of attributable deaths caused by PM2.5, 2017                                                                                                                                                                                  •    Higher air pollution days are responsible for 43 more people going to
                                                                                                                                                                                                                                                                  hospital for respiratory disease in Southampton, 68 in Bristol, 98 in
     London                                     Manchester          Portsmouth          Bristol                        Liverpool                                                         Leicester                          Southend

                                                                                                                                                       Bournemouth
                                                                                                                                                                                                                                                                  Liverpool.

                                                                                                                                                                                                                                                             Public Health England22 estimates that there could be around 2.5 million
                                                                                298                        288               279                                     273                               216                                     215

                                                                                                                                                                     Chatham                                                  Preston                        new cases of coronary heart disease, stroke, lung cancer and other
                                                                                                                                     Wakefield

                                                                                                                                                                                              Birkenhead
                                                                                            Huddersfield

                                                                    Middlesbrough                                  Stoke

                                                                                  198                                                                                                                                                                        health conditions by 2035 if pollution levels remain the same.
                                                             923
                                                                                                           156           154                        139                       137                          136                                 136
                                                                    Bradford
                                                Glasgow

                                                                                                                                                                                                                             Plymouth
                                                                                                                                                                          Sunderland

                                                                                                                                                                                                    Newport
                                                                                                                                                 Mansfield

                                                                                             Wigan                       Hull
                                                                                      191
                                                             354                                                 133
                                                                    Belfast
                                                                                            Doncaster                           128                            120                      115                   113                              108
                                                Nottingham                        178
                                                                                                                                                             Luton                     Basildon
                                                                                                                                                                                                                                Peterborough

                                                                                                                         Blackpool                                                                         Aldershot
                                                                                                                 132
                                                                    Southampton
                                                              319
                                                                                                                                     104
                                                                                  168           Reading
                                                                                                                                                                     93                     89                    85                             84
                                                Newcastle                                                        132
                                                                                                                         Milton Keynes
                                                                    Brighton                                                                                 Warrington                    Ipswich            Aberdeen Telford

                                                                                      167                                             102
                                        3,799                216                            Cardiff                                                                        83
                                                                                                                         Northampton                                                              68                   63                        62
                                                                    Swansea                                      131                                         Worthing
     Birmingham                                 Leeds                                                                                                                                     Gloucester                                      Slough
                                                                                                                                                                                                                Blackburn

                                                                                  158                                                     97
                                                                                                Norwich                                                                     81
                                                                                                                         Swindon                                                                      58
                                                             300    Edinburgh                                                                                Burnley                                                        50                   49
                                                                                                                                                                                          Dundee
                                                                                      157                        130                                                                                            Cambridge
                                                                                                                                          97
                                                                                                                                                                                                                                                Crawley

                                                Sheffield                                                                                                                   77                         55                     47
                                                                                             Derby                       Barnsley
                                                                    Coventry                                                                                 York                         Oxford
                                                                                                                                                                                                                Exeter
                                        1,182                300                  156                            128                      94                                75                         55                     47 43

     Source: Defra 2019, Population-weighted annual mean PM 2.5 data. National Records of Scotland 2019,
     Deaths Time Series Data, 2017 data. Northern Ireland Statistics and Research Agency 2019,
     Registrar General Annual Report 2017 Deaths, 2017 data. ONS 2019, Mortality statistics, 2017 data.

                                                                                                                                                                                                                                                          20 Royal College of Physicians (2018), Reducing air pollution in the UK: progress report, London: RCP.
     19 Calculations use attributable fractions and are based on the methodology of Gowers AM and                                                                                                                                                         21 Williams M et al (2019), Personalising the Health Impacts of Air Pollution – Summary for Decision
       Stedman JR (2014), Estimating Local Mortality Burdens associated with Particulate Air. Estimates are                                                                                                                                                 Makers, London: King’s College London.
       of attributable deaths as ‘an effect on mortality equivalent to X deaths at typical ages’.                                                                                                                                                         22 Public Health England (2018), Estimation of costs to the NHS and social care due to the health
                                                                                                                                                                                                                                                            impacts of air pollution.
21   Cities Outlook 2020                                                                                                                                                                                                                                                                                                                                           Cities Outlook 2020    22
Centre for Cities

     When looking at the proportion of local deaths that can be attributed to long-                                                           Cities have not responded sufficiently to the impact of
     term exposure to PM2.5, the rank of cities changes as illustrated in Figure 10.                                                          air pollution on their residents and workers
     London as the biggest city in the UK still tops the list but it is followed by a
     number of smaller cities — Slough, Chatham and Luton. For these cities, around                                                           Local policy aimed at limiting air pollution in recent years has at best been
     one in 16 deaths is attributed to PM2.5 pollution (more than 6 per cent).23                                                              slow and at worst absent. The rush to declare Climate Emergencies by local
                                                                                                                                              authorities in the last year – a global issue over which they have very little
     This is in contrast to cities like Dundee and Aberdeen, where around one in                                                              direct control - strongly contrasts with action on air pollution, an issue where
     33 deaths is related to PM2.5 exposure (around 3 per cent). This echoes the                                                              their actions can more clearly make a difference.
     outcomes of the DAQI index: the five worst cities in Figure 10 all had more than
     30 days a year when DAQI was 4 or above, while the Scottish cities with the                                                              National policies addressing air pollution have a long history in the UK and
     lowest share are ranked at the bottom of the DAQI index.                                                                                 have been successful when concrete action was undertaken. In 1956, the first
                                                                                                                                              national policy to target air pollution – the Clean Air Act - was introduced in
     Figure 10:                                                                                                                               response to the ‘Great Smog’ in London. Box 4 sets out a timeline of national
     Proportion of local deaths that can be attributed to long-term                                                                           policies in this area since the 1950s.
     exposure to PM2.5, 2017
                                                 7
      Risk fraction of attributable deaths (%)

                                                 6

                                                                                                                  5.2%   Cities average           Box 4: Timeline of air pollution policies
                                                 5

                                                                                                                  4.3%   Non-cities average
                                                 4                                                                                                                                                                                       Government publishes a
                                                                                                                                                                                             National Air Quality Strategy,              second national Air
                                                                                                                                                                                             which requires local authorities to         Quality Plan for tackling
                                                 3                                                                                                                                           monitor air quality in their area and       roadside NO2, which
                                                                                                                                                                                             create Air Quality                          requires 23 additional
                                                                                                                                                                                             Management Areas where                      local authorities to tackle
                                                                                                                                                                                             necessary which must be followed            air pollution. Launch of a    Government      Government
                                                 2
                                                                                                                                                                                             by an Air Quality Action Plan. This         £220 million funding for      publishes its   presents its
                                                                                                                                                                                             may include measures on                     the Clean Air Fund, and         Clean Air     new
                                                                                                                                                                                             “congestion charging, traffic               an additional £275 million       Strategy     Environment
                                                 1                                                                                                                                           management, planning and                    Implementation Fund to                        Bill
                                                                                                                                                                                             financial incentives”                       support local authorities

                                                                                                                                                         1956             1995       1997      2000       2015                  2017                2018                    2019
                                                 0
                                                             London
                                                              Slough
                                                           Chatham
                                                               Luton
                                                        Portsmouth
                                                            Reading
                                                     Milton Keynes
                                                              Oxford
                                                          Aldershot
                                                            Crawley
                                                            Brighton
                                                             Ipswich
                                                      Southampton
                                                            Basildon
                                                               Derby
                                                           Leicester
                                                         Cambridge
                                                           Worthing
                                                      Northampton
                                                        Nottingham
                                                           Coventry
                                                          Southend
                                                            Swindon
                                                       Birmingham
                                                      Peterborough
                                                            Norwich
                                                         Gloucester
                                                              Bristol
                                                      Bournemouth
                                                          Mansfield
                                                                 Hull
                                                              Cardiff
                                                           Liverpool
                                                               Leeds
                                                            Newport
                                                               Exeter
                                                        Manchester
                                                         Warrington
                                                            Bradford
                                                         Doncaster
                                                           Plymouth
                                                                 York
                                                               Stoke
                                                              Belfast
                                                          Wakefield
                                                               Wigan
                                                       Huddersfield
                                                             Burnley
                                                              Telford
                                                          Blackburn
                                                     Middlesbrough
                                                             Preston
                                                           Sheffield
                                                        Birkenhead
                                                        Sunderland
                                                            Barnsley
                                                         Newcastle
                                                           Swansea
                                                          Edinburgh
                                                          Blackpool
                                                            Glasgow
                                                             Dundee
                                                          Aberdeen
                                                                                                                                                                    Environment                                                                                Road to Zero Strategy,
                                                                                                                                                                     Act sets out      Under EU law,
                                                                                                                                                Clean Air Act as                        leaded petrol                                                          which sets out how the
                                                                                                                                                                        Local Air                                                                              Government will aim to
                                                                                                                                               a response to the                         was banned                 Government publishes the
                                                                                                                                                                          Quality                                                                              end the sale of
                                                                                                                                                   Great Smog in                       from sale, due               first Air Quality Plan which
                                                                                                                                                                    Management                                                                                 conventional petrol and
                                                                                                                                                         London                           to growing                requires five Local
                                                                                                                                                                     and places a                                                                              diesel-only cars and vans
                                                                                                                                                                                       evidence of its              Authorities to implement
                                                                                                                                                                             legal                                                                             by 2040
                                                                                                                                                                                      harmful effects               Clean Air Zones with
                                                                                                                                                                   responsibility
                                                                                                                                                                                           on human                 additional action required
                                                                                                                                                                   for air quality
                                                                                                                                                                                                                    in London
     Source: Defra 2019, Population-weighted annual mean PM 2.5 data                                                                                                      on local             health
                                                                                                                                                                      authorities

     These deaths occur in spite of the UK meeting current legal limits. Local
     authorities in Scotland follow the stricter WHO guideline for PM2.5,24 after
     the Scottish Parliament published its Clean Air Strategy in 2015 in which the
     annual concentration objectives were set at 10 µg/m3. But this is not the case
     elsewhere in the UK.

     23 That the risk fraction is higher for cities in the South East cannot exclusively be attributed to their
       comparatively higher levels of economic activities. Emissions from the continent can also have
       an impact.
     24 The 10 µg/m3 target is not binding.

23   Cities Outlook 2020                                                                                                                                                                                                                                                                              Cities Outlook 2020    24
Centre for Cities

     More recently, two place-based policies have been introduced at the local level                                   Figure 11:
     - Air Quality Management Areas (1995) and Clean Air Zones (2015).                                                 Creation and revocation of AQMAs

     Air Quality Management Areas                                                                                                  800                                                                                                              100

                                                                                                                                                                                                                                                    90
     Air Quality Management Areas (AQMAs) were first introduced by the 1995

                                                                                                                                                                                                                                                         Number of revoked AQMAs
                                                                                                                                   700
                                                                                                                                                                                                                                                    80
     Environment Act. They are areas designated by local authorities that face air                                                 600
                                                                                                                                                                                                                                                    70

                                                                                                                       Net AQMAs
     quality challenges, and vary in size, from one street to, in Liverpool’s case,                                                500
                                                                                                                                                                                                                                                    60

     the whole city centre. When national air quality standards and objectives have                                                400                                                                                                              50

                                                                                                                                                                                                                                                    40
     been met, and will continue to be, an AQMA can be revoked.25                                                                  300
                                                                                                                                                                                                                                                    30
                                                                                                                                   200
                                                                                                                                                                                                                                                    20
     Since their implementation, a total of 902 AQMAs have been introduced by                                                      100
                                                                                                                                                                                                                                                    10

     285 local authorities. Despite the concentration of air pollution in UK cities, 56                                             0                                                                                                               0
                                                                                                                                         1999 2000 2001 2002 2003 2004 2005 2006 2007 2008 2009 2010 2011 2012 2013 2014 2015 2016 2017 2018 2019
     per cent of currently-active AQMAs are located outside cities.
                                                                                                                                                                      Urban      Non-urban       Total AQMAs revoked

     The main issue of AQMAs is that, on the whole, they have been ineffective. Of                                     Source: Defra 2019. Air Quality Management Areas
     the 902 AQMAs established in the last two decades, 670 are still active today,
     as illustrated in Figure 11. And 29 cities have not revoked any of their AQMAs.                                   Clean Air Zones
     This suggests that a significant number of areas have so far failed to sufficiently                               The successive legal challenges brought by the environmental law charity
     address their local air quality issues.                                                                           ClientEarth against the UK Government for breaching its duty to meet the legal
     This perhaps is not surprising given that local authorities are not legally obliged                               limit for NO2 have sparked more recent action on air pollution. As set out in
     to meet the objectives set by their action plans.26 There is, then, little incentive                              the Air Quality Plan,27 Clean Air Zones (CAZs) are the Government’s preferred
     to do anything about poor air quality within them.                                                                policy tool. CAZs can either be ‘charging’ zones, where they involve a fee on
                                                                                                                       vehicles that do not meet the emission standards,28 or ‘non-charging’: where
     In addition, most AQMAs are focused only on NO2. But, as shown above,                                             they do not impose fees, but rely on other measures to improve air quality.
     although important, NO2 is just one of a number of pollutants contributing to                                     These include developing cycle lanes, improving public transport or introducing
     poor air quality.                                                                                                 traffic-flow management.

     25 Local Authorities can have more than one AQMA, which can range in size from one street to larger
       urban areas. In some cities, AQMAs were merged.                                                                 27 Defra (2017), UK Plan for tackling roadside nitrogen dioxide concentrations, London:
     26 Although this recognises that local authorities are not solely responsible for air pollution levels in their     The Stationery Office.
       area, it demonstrates there is a lack of clear duty for local authorities.                                      28 It is up to the local authority to decide which type of vehicle will be charged.

25   Cities Outlook 2020                                                                                                                                                                                                                                                           Cities Outlook 2020    26
Centre for Cities

     The UK Government has mandated a number of areas to tackle their levels of NO2:                          Figure 12:
                                                                                                              Clean Air Zones in the UK
       • Six ‘first wave’ local authorities in 2015 — London, Birmingham,
         Nottingham, Southampton, Leeds and Derby – with the Government
                                                                                                                                                                                                                                 ! CAZ implemented
         suggesting that CAZs were the preferred action to take.
                                                                                                                                                                                                                                ! CAZ expected
       • A further 23 English local authorities in 2017 to carry out feasibility                                                                                                                                                ! CAZ to be confirmed/consulting
         studies on ways to reduce NO2 pollution.                                                                                                                                                                               ! Required to take action on air pollution

       • Another 33 were designated to do the same in 2018, including eight where                                                                                                                                                        Not required/not expected

         NO2 concentration projections were worse than expected.29                                                                                                                                                 ! Aberdeen

     Despite the requirement from Government, the local response has largely been                                                                                                                  ! Dundee
     disappointingly slow. Figure 12 shows the current implementation of Clean
                                                                                                                                                                                                  Edinburgh
     Air Zones in the UK. Just two CAZs have been put in place, in London and                                                                                                   ! Glasgow !
     Glasgow.30 The lack of action is more frustrating because the evidence from
     London suggests that CAZs have an impact on reducing NO2 emissions
     (see Box 5).                                                                                                                                                                                                           !
                                                                                                                                                                                                                                Newcastle

                                                                                                                                                                                                                                  Sunderland

     While there are plans to introduce CAZs of various forms elsewhere, none of
                                                                                                                                                                                                                                         Middlesbrough
                                                                                                                                                           Belfast                                                                !
     the other ‘first wave’ cities, that were required to put a CAZ in place by 2020,                                                                                                                           Bradford
                                                                                                                                                                                                 Blackburn Burnley                   York

     have yet done so, nor do they have sufficient alternative arrangements. Despite                                                                                                  Blackpool                ! !
                                                                                                                                                                                                                             Leeds    !
                                                                                                                                                                                                                                      Huddersfield    Hull
                                                                                                                                                                                           Preston                                       Wakefield
     the problems of air pollution illustrated above, most cities have either delayed                                                                                                         Wigan
                                                                                                                                                                                        Liverpool        !
                                                                                                                                                                                                                !
                                                                                                                                                                                                                                             Doncaster
                                                                                                                                                                                                   ! !              !
     the introduction of a CAZ, or have decided against implementing it.                                                                                                            Birkenhead
                                                                                                                                                                                           Warrington
                                                                                                                                                                                                     Manchester Barnsley
                                                                                                                                                                                                                                      Sheffield
                                                                                                                                                                                                                                       Mansfield
                                                                                                                                                                                                         Stoke
                                                                                                                                                                                                                 !
                                                                                                                                                                                                                              !!
                                                                                                                                                                                                                       Derby             Nottingham
                                                                                                                                                                                                                                                                                     Norwich
                                                                                                                                                                                                                             Leicester
                                                                                                                                                                                                     Telford
                                                                                                                                                                                                                           !                             Peterborough
                                                                                                                                                                                                        Birmingham
                                                                                                                                                                                                                      ! ! Coventry
                                                                                                                                                                                                                                                                 Cambridge
                                                                                                                                                                                                                            Northampton
                                                                                                                                                                                                                                                             !
                                                                                                                                                                                                                             Milton Keynes                                         Ipswich
                                                                                                                                                                                                               Gloucester                             Luton
                                                                                                                                                                                                                                Oxford
                                                                                                                                                                        Swansea            Newport                   Swindon      !         Slough    London
                                                                                                                                                                                                                                                                        Basildon

                                                                                                                                                                                                                                                         !        ! ! Southend
                                                                                                                                                                                       Cardiff
                                                                                                                                                                                                         !                      Reading   ! !
                                                                                                                                                                                                         Bristol
                                                                                                                                                                                                                                 Aldershot !                               Chatham
                                                                                                                                                                                                                                                              Crawley
                                                                                                                                                                                                                             Southampton
                                                                                                                                                                                                                                                             Brighton
                                                                                                                                                                                                                                !
                                                                                                                                                                                  Exeter                 Bournemouth                  !
                                                                                                                                                                                                                                     Portsmouth Worthing

                                                                                                                                                                     Plymouth

                                                                                                              Source: UK 100 (2019) Clean Air Zones briefing. Defra (2015,2017,2018).

     29 These include Bradford, Portsmouth, Stoke, Leicester and Liverpool.
     30 In Glasgow, the Clean Air Zone implemented is a Low Emission Zone, launched in 2018 for buses only.
       It will charge all non-compliant vehicles in 2022.

27   Cities Outlook 2020                                                                                                                                                                                                                                            Cities Outlook 2020          28
Centre for Cities

     Of those that have developed proposals, some go further than others. For
     example, while Birmingham has taken the politically-courageous decision to                                   Box 5: How London’s Ultra Low Emission Zone has reduced
     charge non-compliant private cars, Greater Manchester and Leeds have not,                                    air pollution
     and Southampton will not charge at all, implementing a ‘non-charging’ CAZ.                                   In April 2019, London launched its first Ultra Low Emission Zone (ULEZ),
     After some delay, Bristol recently approved its plan, which will not charge                                  which operates in the existing central London Congestion Charge Zone.
     private cars but will ban all diesel vehicles in the city centre from 2021, and                              By implementing stricter emission standards, the aim of the ULEZ is to
     York has recently decided to ban all private cars from its city centre by 2023.                              reduce the number of old, polluting vehicles circulating in the central
                                                                                                                  zone, and therefore improve air quality. The evaluation of the first six
     One argument made against introducing charging zones is that charges will
                                                                                                                  months of the zone showed significant progress32 (although some
     disproportionally affect poorer people, but poorer households are less likely
                                                                                                                  improvements reflect the impact of the Toxicity Charge introduced
     to own a car. In addition, toxic air harms low-income households more, for
                                                                                                                  in 2017):
     example, because they are more likely to live near a busy road. This means that
     charges that effectively reduce local air pollution should disproportionately                                  • Increase of the average compliance rate with ULEZ standards from
     benefit poorer households.31                                                                                     39 per cent in February 2019 to 77 per cent in September 2019.

     A further issue with CAZs is that like the AQMAs before them, they tend to be                                  • Reduction of 36 per cent of NO2 concentration in central London
     very narrow in focus, looking to target NO2 emissions from transport. While this                                   between February 2017 and September 2019.

     may be a pragmatic first step, ultimately future interventions will need to be                                 • Reduction of NO2 concentration equivalent to 29 per cent in central
     broader in scope than just transport.                                                                            London, compared to a scenario with no ULEZ , based on average
                                                                                                                      data between July and September 2019.

                                                                                                                    • Reduction of nitrogen oxides emissions from road transport in the
                                                                                                                      central zone by 31 per cent.

                                                                                                                    • Reduction in the number of polluting and non-compliant vehicles in
                                                                                                                      the zone by 38 per cent, which corresponds to 13,000 fewer on an
                                                                                                                      average day.

                                                                                                                  London has also introduced a near £50 million scrappage scheme to
                                                                                                                  incentivise people to switch to cleaner vehicles, allocating £25 million for
                                                                                                                  low-income motorists, in addition to an existing £23 million scrappage
                                                                                                                  scheme for micro-businesses, sole traders and charities.

     31 Defra (2017), Air Quality: a briefing for directors of public health, London: Public Health England.   32 GLA (2019), Central London Ultra Low Emission Zone - six month report, London: GLA..

29   Cities Outlook 2020                                                                                                                                                                                 Cities Outlook 2020    30
Centre for Cities

     What needs to change                                                                     To support this, the UK Government should:

     Laudable environmental concerns in relation to climate change need to be                  1. Triple the size of the Clean Air Fund, which currently is £220 million for the
     mirrored in action on the linked issue of air pollution, on which progress has               period 2018/19 to 2020/21 to help cities introduce policies to improve air
     been frustratingly patchy and, in places, too slow. Politically, it is difficult given       quality. A share of the budget should be specifically used to fight cross-
     the strength of the motoring and other lobbies but it is by no means impossible              boundary air pollution by funding authorities to make interventions that
     as London has shown.                                                                         improve the air quality of their neighbours.

     After all, this is an issue that is affecting the health of people living and working     2. Introduce Environmental Improvement Bonds, based on the current Social
     in cities, that increases the number of sick days taken in workplaces and in the             Impact Bond model, allowing cities to keep some of the savings made
     most extreme cases kills residents. It is difficult to think of a more compelling            from reduction in NHS treatment of air quality-related illness.
     case for action.                                                                          3. Expedite passing its Environment Bill, which should legislate to:

     So this is what needs to change. In the UK’s largest cities and towns:                          • Adopt the WHO’s stricter guidelines on PM2.5 as a target to be met
                                                                                                       by 2030.
       1. Those cities with poor quality air should ‘level up’ to London-style CAZs,
                                                                                                     • Give local authorities greater powers to declare and enforce smoke
          charging the most environmentally-damaging vehicles to enter their
                                                                                                       control areas.
          centres.
                                                                                                     • Establish an independent body to hold the Government to account
       2. Expand their policy action to have a broader focus than just transport:
                                                                                                       on environmental issues after the UK leaves the EU.
              • Set tighter minimum emission standards for burning stoves and ban
                                                                                               4. Secure an international agreement with the EU to tackle trans-boundary
                domestic burning in areas with high PM2.5 levels.
                                                                                                  air pollution coming from the continent.
              • Work on raising public awareness on the effect of domestic
                combustion.
              • Restrict the sale of polluting fuels.
       3. Advocate collectively to central government for more powers and
          resources to clean up their air.

31   Cities Outlook 2020                                                                                                                                                       Cities Outlook 2020     32
03
City monitor
The latest data
Centre for Cities                                                                                                                                                                                   Centre for Cities

     City monitor: the                                                                                     Table 1:
                                                                                                           Population growth

     latest data                                                                                            Rank      City
                                                                                                                                                      Growth rate,
                                                                                                                                                      2017-18 (%)
                                                                                                                                                                          Population,
                                                                                                                                                                               2017
                                                                                                                                                                                        Population,
                                                                                                                                                                                             2018
                                                                                                                                                                                                       Change,
                                                                                                                                                                                                       2017-18

     There is considerable variation in the economic performance of cities and                              10 fastest-growing cities by population
     towns across the UK. The purpose of this chapter is to show the scale and                              1         Coventry                                  1.8          360,150       366,790        6,640
     nature of this variation by highlighting the performance of the 63 largest urban                       2         Wakefield                                 1.2          340,790       345,040        4,250
     areas33 on 17 indicators covering:                                                                     3         Exeter                                    1.2          128,920       130,430        1,510
                                                                                                            4         Telford                                   1.2          175,770       177,800        2,030

        •   Population                                      •   Productivity                                5         Peterborough                              1.1          198,910       201,040        2,130
                                                                                                            6         Newport                                   1.1          243,750       246,350        2,600
        •   Employment                                      •   Skills
                                                                                                            7         Bristol                                   1.1          738,280       746,050        7,770
        •   Wages                                           •   Housing
                                                                                                            8         Edinburgh                                 1.0          513,210       518,500        5,290
        •   Business dynamics                               •   Digital connectivity
                                                                                                            9         Reading                                   1.0          328,060       331,180        3,120
        •   Innovation                                      •   Environment                                 10        London                                    0.9       10,062,280    10,151,260       88,980

     For most indicators, the 10 strongest and 10 weakest performing places are                             10 slowest-growing cities by population
     presented.                                                                                             54        Dundee                                    0.0          148,710       148,750           40
                                                                                                            55        Plymouth                                  0.0          263,070       263,100           30
     Tables of the full list of cities can be found at www.centreforcities.org/data-tool                    56        Hull                                      0.0          260,670       260,650           -20
                                                                                                            57        Warrington                                -0.1         209,700       209,550         -150
                                                                                                            58        Oxford                                    -0.2         154,580       154,330         -250
     Population
                                                                                                            59        Northampton                               -0.2         225,660       225,150         -510

       • In 2018, cities accounted for 9 per cent of land, but for 54 per cent of                           60        Luton                                     -0.3         214,660       214,110         -550

         the UK population (36 million) and for 56 per cent of population growth                            61        Aldershot                                 -0.3         184,580       184,020         -560
                                                                                                            62        Aberdeen                                  -0.5         228,800       227,560        -1240
         between 2017 and 2018.
                                                                                                            63        Ipswich                                   -0.7         138,480       137,530         -950
       • The four biggest cities (London, Birmingham, Manchester and Glasgow)                                        United Kingdom                             0.6       66,040,230    66,435,550      395,320
         accounted for almost a quarter of the total UK population (24 per cent)
         and for 45 per cent of the total population living in cities.
                                                                                                           Source: ONS, 2019, Population estimates, 2017 and 2018 data.
       • London alone was home to 15 per cent of the UK population and
         accounted for 23 per cent of all population growth in the UK between
         2017 and 2018.
       • Every city has experienced population growth compared to 10 years ago
         but, in eight cities, population declined compared to 2018. This is twice as
         many cities compared to 2017, when only four cities saw a decline.

     33 Data for Bournemouth in this chapter reflects the geography of the new BCP local authority area.

35   Cities Outlook 2020                                                                                                                                                                              Cities Outlook 2020    36
Centre for Cities                                                                                                                                                                                   Centre for Cities

     Employment rate                                                                    Table 2:
                                                                                        Employment rate
       • Overall, the UK employment rate continued to increase in 2019, and was
         up by 0.6 percentage points compared to 2018. The city average                                                           Employment rate,                    Employment rate,  Percentage
         (73 per cent) was unchanged, and remained slightly lower than the               Rank     City                       Jul 2018-Jun 2019 (%)               Jul 2017-Jun 2018 (%) point change

         national average (76 per cent).
                                                                                         10 cities with highest employment rate
       • Thirty-four cities had employment rates below the national average.             1        Oxford                                            82.4                               81.3                  1.1
         To bring these cities up to the current UK average, a further 513,600           2        Aldershot                                         82.2                               78.9                  3.4
         residents in these places would need to find employment.                        3        Ipswich                                           81.8                               76.4                  5.4
       • Bradford, the UK city with the lowest employment rate in 2019                   4        Southend                                          80.4                               82.9                 -2.5

         (66 per cent), would need 29,600 of its residents to find employment            5        Cambridge                                         80.4                               75.2                  5.1

         to reach the UK average. Birmingham remains the city with the highest           6        Reading                                           79.7                               78.3                  1.3
                                                                                         7        Northampton                                       79.5                               76.5                  3.0
         deficit in absolute terms (-113,000) despite an increase in its employment
                                                                                         8        Preston                                           79.4                               82.8                 -3.4
         rate (1.4 percentage points).
                                                                                         9        Bristol                                           79.0                               79.2                 -0.1
       • Large cities tend to fare worse than smaller cities. Two of them –              10       Bournemouth                                       78.9                               76.5                  2.4
         Birmingham and Liverpool – are among the cities with the lowest
         employment rate. Only Bristol features in the top 10 cities with the highest    10 cities with lowest employment rate
         employment rate.                                                                54       Swansea                                           69.9                               67.7                  2.2
                                                                                         55       Luton                                             69.8                               69.7                  0.1
                                                                                         56       Sunderland                                        69.7                               71.0                 -1.3
                                                                                         57       Liverpool                                         68.6                               68.4                  0.2
                                                                                         58       Blackburn                                         68.4                               64.2                  4.2
                                                                                         59       Burnley                                           68.4                               71.5                 -3.2
                                                                                         60       Birmingham                                        68.3                               66.9                  1.4
                                                                                         61       Middlesbrough                                     68.3                               67.8                  0.5
                                                                                         62       Dundee                                            66.8                               65.1                  1.7
                                                                                         63       Bradford                                          66.3                               68.1                 -1.8
                                                                                                  United Kingdom                                    75.5                               74.9                  0.6

                                                                                        Source: ONS 2019, Annual Population Survey, July 2017 - June 2018 and July 2018 - June 2019.
                                                                                        DfE NI 2019, District Council Labour Market Structure Statistics for Belfast, 2017-2018 and 2018-2019 data.

37   Cities Outlook 2020                                                                                                                                                                              Cities Outlook 2020    38
You can also read