G20 CLIMATE RISK ATLAS - Impacts, policy, economics - CMCC Foundation
←
→
Page content transcription
If your browser does not render page correctly, please read the page content below
G20 CLIMATE RISK ATLAS
Impacts, policy, economics

JAPAN
                                                                                                                                      With the scientific
                                                                                                                                       contribution of
                                                                                                                                      Enel Foundation

How to read the Atlas: graphs, colours and scenarios.
The maps used in this Atlas are taken from The World Bank Official Boundaries -
(accessed on May 28, 2021). For the section Energy, the maps are based on Panoply Data Viewer
Each sector of this Atlas contains data and information on various climate scenarios.
When reported in graphs, the colour black indicates data and information referring to the current state, the past or the baseline.
When the authors refer to RCP (Representative Concentration Pathways), the 3 colours used across the factsheet refer to 3 scenarios, which are 3
different development options with different levels of greenhouse gas emissions, respectively low emissions (green), medium emissions (orange), and
high emissions (red). The same colour code is used when RCPs are associated with Shared Socioeconomic Pathways (SSP).
In some cases, the authors refer to global warming scenarios. In these cases, the 3 colours used refer to a temperature rise of 1.5°C (green), 2°C (dark
green), and 4°C (red).
When the authors refer exclusively to Shared Socioeconomic Pathways - SSPs (Population affected by river floods in the section: “Water"), data related to
SSP3 - that encompasses, among other things, slow economic growth, material-intensive consumption, and persisting or worsening inequalities – are
reported in a lighter shade; SSP5 – which refers to social and economic development that is coupled with an energy-intensive lifestyle and the abundant
exploitation of fossil fuel resources – is shown using a middle shade of the colour, whereas data related to the present conditions are represented in a
dark shade.
Further details on scenarios, methodologies, and the full list of references are available at: www.g20climaterisks.org
                                                                                                                      Concept and graphic design by element6.eu
JAPAN

CLIMATE
OVERVIEW                                                                  TEMPERATURE PROJECTIONS
Japan features a remarkable variety of climates inclu-                    Under a low emissions scenario projected temperature variations will
ding a subtropical zone and a sub-polar zone. This is                     remain contained under +2°C, both by 2050 and 2100.
                                                                          Under a high emissions scenario, with no reduction in GHG emissions,
due to its wide latitudinal extent, seasonal winds, and                   greater temperature anomalies are expected, particularly in 2100.
exposure to different types of oceans. The northern
part has warm summers but long, cold winters with
heavy snowfall; conversely, the central part presents
hot, humid summers and moderate to short winters                                                                                       +5.5°C
with some areas featuring very heavy snowfall; finally,                            TEMPERATURE                                          +2.7°C
the southwestern part has long, hot, humid summers                                ANOMALY                                              +1.9°C
and mild winters.
TEMPERATURE                                                                                                         +2.5°C
The temperature regime in Japan varies with latitude. More specifical-                                               +1.9°C
ly, temperatures are lower in the north, where snow and ice dominate                                                +1.7°C
in winter, and rise in the central and southern areas. The south is the
warmest area.
                                                                                              +0.5°C

MEAN                        +2                                    23
                                                                           -0.6°C
TEMPERATURE                       Celsius degrees / Over 1991-2020

                                                                           1985               2014                  2050                  2100

                                                                          Historical Period

                                                                          EXPECTED VARIATION
                                                                          FOR TEMPERATURE AT 2050
                                                                          The indicators show variations in selected temperature characteristi-
                                                                          cs for a thirty-year period centred on 2050 (2036-2065) with respect
                                                                          to the reference period 1985-2014.

TEMPERATURE TREND                                                                     +2.4°C                  +2.6°C                     +2.4°C
Temperature anomalies over the last 60                           max
years with respect to the annual mean of                       1.8 °C                   +1.9°C                  +2.0°C                        +1.9°C
1°C in Japan during the 1961-1990 period
                                                                                      +1.5°C                  +1.7°C                     +1.5°C
 1961                                                                     Annual Mean            Max Temperature           Min Temperature
                                                                          Temperature            of warmest month          of coldest month

                                                               2020
 -1.1 °C
 min
PRECIPITATION                                                                  PRECIPITATION PROJECTIONS
The precipitation regime in Japan features a high spatial variability          Precipitation trends show a very complex signal,
over the entire archipelago. Annual precipitation averages between             under all emissions scenarios, with a very large
1,000 and 2,500 millimetres.                                                   variability among climate models. This can be explai-
The hyper-humid Kii Peninsula can receive over 3,000 millimetres per           ned considering the complexity of the precipitation                   +15.7%
year, making it the world's rainiest subtropical area.                         regime and dynamics requiring                                         +11.3%
In some years rainfall causes severe floods and landslides, whereas in          more detailed spatial and tempo-                                       +5.1%
others there is too little rain to support agriculture.                        ral analysis.

                                                                                        PRECIPITATION                            +11.1%
                                                                                        ANOMALY                                  +6.9%

MEAN                         958                                 3,092
                                                                                                                                 +4.9%
PRECIPITATION                              mm/year / Over 1991-2020
                                                                                                       +3.3%
                                                                                -1.6%

                                                                                1985                   2014                      2050                    2100

                                                                              Historical Period

                                                                               EXPECTED VARIATION
                                                                               FOR PRECIPITATION AT 2050
                                                                               The indicators show variations in selected precipitation characteristi-
PRECIPITATION TREND                                                            cs for a thirty-year period centred on 2050 (2036-2065) with respect
Precipiation anomalies over the last 60                                        to the reference period 1985-2014.
years with respect to the annual mean of                              max
1,764 mm/year in Japan during the                                   +31%
1961-1990 period                                                                               +6.7%                          +7.3%                      +8.1%
 1961                                                                                            +6.1%                           +7.2%                    +8.5%

                                                                                               +6.5%                          +6.5%                      +8.0%
                                                                                Annual total                  Precipitation of            Precipitation of
                                                                                precipitation                  wettest month              warmest quarter

 -26%                                                             2020
 min
                                                                 +22%                           +13%                          +1,563%                    +20%

                                                                  +12%                           +9%                             +232%                       +7%
VARIATION OF SPECIFIC                                            +10%                           +8%                           +79%                       +2%
CLIMATE INDICATORS                             Agricultural drought         Hydrological drought                 Heatwave                     Runoff
                                                proportion of time           proportion of time                  duration                    increase
Climate indicators variation showing                % of time                     % of time                      % of time                   % of area
impacts of climate change on sectors such
as agriculture, health and water. Analysis                       +45%                           +9%                           +86%                       +28%
considers 3 threshold average temperatu-
re increase: +1.5°C, +2°C, +4°C.                                  +23%                           +8%                             +32%                        +10%

                                                                 +18%                           +10%                          +18%                       +5%

                                                   Agricultural                Hydrological                      Heatwave                     Runoff
                                                drought frequency            drought frequency                   frequency                   decrease
                                                   % of change                   % of change                    % of change                  % of area
JAPAN

OCEAN
OCEAN IN JAPAN                                                            FUTURE PROJECTIONS
Japan's marine exclusive economic zone (EEZ) compri-                      Projected annual changes within the marine EEZ for the two most
ses a wide range of environmental conditions, from the                    significant marine indicators of climate change: sea surface water
cold waters surrounding the island of Hokkaido to the                     temperatures and pH.
temperate ecosystems of the southern seas. Japanese                       Seawater temperature changes are in line
coastal systems can be divided into three main areas:                     with the definitions of each scenario, with
                                                                          maximum values in 2100 close to +4°C under
the Sea of Japan, East China Sea and the Pacific region.                   a high emissions scenario.                             +3.9 °C
                                                                                                                                 +2.4 °C
                                                                                                                                 +1.7 °C
CURRENT CLIMATE CONDITIONS
Mean sea surface temperature reflects the latitudinal variation in
climate regimes, with cold waters in the north and warmer ones in the             SEA SURFACE             +1.7 °C
Pacific region.                                                                    TEMPERATURE             +1.5 °C
                                                                                  ANOMALY
                                                                                                          +1.5 °C

                                                                                             0.2 °C

                                                                           -0.5 °C

 5                                             30          MEAN            1950                 2014         2050                   2100

SEA SURFACE TEMPERATURE
Celsius degrees / Over 1991-2020

 0                                            0.7         TREND
                                                                           0.05

                                                                                              -0.01

                                                                                                             -0.1
                                                                                  SEA SURFACE
                                                                                  pH ANOMALY                -0.12
                                                                                                            -0.16

                                                                          Seawater surface pH becomes more acidic in              -0.09
                                                                          all scenarios, closely reflecting rising                 -0.19
                                                                          atmospheric CO₂ concentrations, and only a
                                                                                                                                   -0.4
Surface temperature trends indicate a general warming of 0.2°C per        low emissions scenario leads to a stable
decade in all marine areas, with increased gains in the northern areas.   condition by 2100.
ECOSYSTEM
INDICATORS AT 2050
Regional changes in key marine ecosystem indica-
tors under projected future scenarios by mid-cen-
tury (2036-2065) with respect to present climate
conditions (1985-2014).                                                      East China Sea             Japan Sea                   Pacific

                                                                                           +1.78 °C                +2.43 °C                  +2.08 °C
Temperature regulates the metabolism of marine
organisms determining which habitats remain                                      24.94°C    +1.5 °C     15.21°C     +1.9 °C      22.35°C     +1.94 °C
suitable. Excessive warming will likely push
ecosystems beyond tolerance thresholds.                                                    +1.62 °C                +2.04 °C                  +2.16 °C

                                                                                           -0.16                   -0.18                     -0.16
pH represents the acid/base status of marine
waters, where a decreasing pH reflects the                                         8.09                    8.14                      8.1
                                                                                            -0.12                   -0.13                    -0.13
acidification of the ocean due to increased
absorption of atmospheric CO₂.                                                             -0.1                    -0.11                     -0.1

Oxygen is fundamental to sustain marine life and                                           -2.35 %                 -3.59 %                   -2.72 %
its reduction can have a large impact on coastal                                 212.78     -1.56 %      257.58     -2.94 %       224.18     -2 %
ecosystem services including fisheries and                                        mmol/m3                mmol/m3                  mmol/m3
aquaculture.                                                                               -2 %                    -2.89 %                   -2.78 %

Chlorophyll is an indicator of the biomass                                                 -22.35 %                -10.06 %                  -1.26 %
available at the base of the marine food web                                      0.17      -18.82 %      0.35      -14.66 %       0.24      -7.14 %
supporting all ecosystem productivity.                                            mg/m3                  mg/m3                    mg/m3

                                                                                           -17.65 %                -24.14 %                  -10.5 %

FISH CATCH POTENTIAL                                                                ANALYSIS DETAILS
Fish catch potential is an estimate of the maximum fish catch achie-                 All datasets were analysed using only data from within the
vable given the marine resources available over a sustained period. It              marine EEZ and therefore excluding overseas territories,
is linked to the concept of maximum sustainable yield, meaning the                  detached islands and any disputed or joint territories with
maximum amount of fish that can be extracted from a system without                   other nations. In the assessment of current climate conditions,
causing a collapse in fish populations.                                              seawater surface tempererature data was obtained using
                                                                                    satellite observations distributed in the framework of ESA
It is a characteristic of the natural system, which is substantially                Climate Change Initiative.
different from realized catch, and a direct result of the fishery policy in
place.                                                                              Future projections of marine indicators are represented by the
                                                                                    combined analysis of results from 15 different Earth System
                                                                                    models participating in the Coupled Model Intercomparison
                                                                                    Project Phase 6 (CMIP6). These models include new and better
                                                               -10.6%
Fish catch                     2050                                                 representations of physical and biogeochemical processes,
                                                                                    compared to previous IPCC assessment reports.
percentage
change                                                                              Fish catch potential data was obtained using the FAO's techni-
                                                               -6.5%                cal report and refers to the best and worst case climate scena-
                                                                                    rios from the Fifth IPCC Assessment Report. These mean
                                                                                    estimates are subject to substantial uncertainties as discussed
                                                                                    in the original work.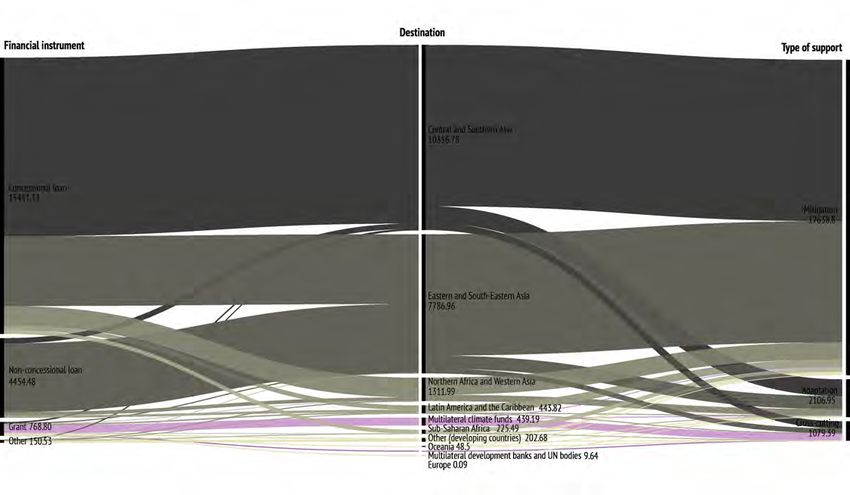
JAPAN

COASTS
OVERVIEW
Japan is a densely populated archipelago with 29,000
kilometres of shoreline and around 7,000 islands, 430
of which are inhabited. The two main islands are the                          Shoreline                           29,020 km
Island of Honshu, home to the largest cities, including                       Length
Tokyo (one of the largest coastal mega-cities in the
world), and the Island of Hokkaido. The coastal area of
Japan is predominantly made up of rocky shores and
sandy beaches, whereas the rest of the coast can be                           Sandy
classified as artificial. The coastal zone of Japan
sustains a thriving and advanced global economy.                              Coast Retreat                                            4.7 m
                                                                              at 2050

CLIMATE CHANGE HAZARDS
Coastal hazards such as erosion, storm tide inundation and permanent         These changes may exacerbate erosion issues and drive flooding in
flooding, can have strong adverse impacts on coastal regions, with            low lying coastal areas, with potential widespread economic damage.
loss of sandy shores, damage to settlements, infrastructure and ecosy-       In addition, changes in rainfall patterns may further exacerbate
stems. Climate change can exacerbate these impacts due to rising sea         flooding risks. Land subsidence, which in the past was mainly driven by
levels and increasing impacts of waves and storms. Climate change            groundwater extraction, is also a concern for many coastal urban
impacts on the coastal zone of Japan are mainly driven by rising sea         areas, resulting in large parts of cities such as Tokyo currently finding
levels and possible changes in storm intensity and direction, as well as     themselves below sea level.
changes in future typhoon frequency, intensity and area of influence.

SEA LEVEL RISE                                                               EXTREME SEA LEVEL
Relative sea level rise has been observed over the past century around       On average, one in 100 extreme sea level events are expected to rise
the coast of Japan, with a yearly average increase of approximately 2.8      from 2.88 metres at present day to 3.11 metres by 2050 under a
millimetres per year since the 1990s. The latest IPCC projections            medium emissions scenario.
indicate that, by 2050, global sea levels may rise between 0.18 metres,
under a low emissions scenario, and 0.23 metres, under a high
emissions scenario.

                                                               0.23 m                                                                           3.19 m
Observed and                                                                 Current and
projected sea                         2.8                                    projected extreme                  2.88 m                           3.11 m
level rise at 2050            mm/year                                        sea level at 2050
                                                               0.18 m

  OBSERVED                                                                      FUTURE
 STORMS           The eastward facing coasts of Japan are exposed to the
                  vast Pacific Ocean swell regime, whereas the western
                                                                              STORMS           Climate change is expected to influence the wave
                                                                                               climate of the coast of Japan. Different scenario
                  ones are exposed to the swell regime of the Sea of Japan                     projections of changes in wave height, period and
                  and South China Sea. The swell regime of the Pacific                          direction for this century seem to agree on a reduction in
                  Ocean delivers high energy waves to the east coast of                        wave energy. However, this may be offset by the impact
                  Japan throughout the year, both from the North Pacific                        of stronger typhoons fuelled by higher sea surface
                  during the winter and the South Pacific during the                            temperatures. Furthermore, it appears that although
                  summer. The Japanese coast is also strongly influenced                        there may be a reduction in the number of typhoons, the
                  by the typhoon season that runs from May to October.                         intensity of these is predicted to increase.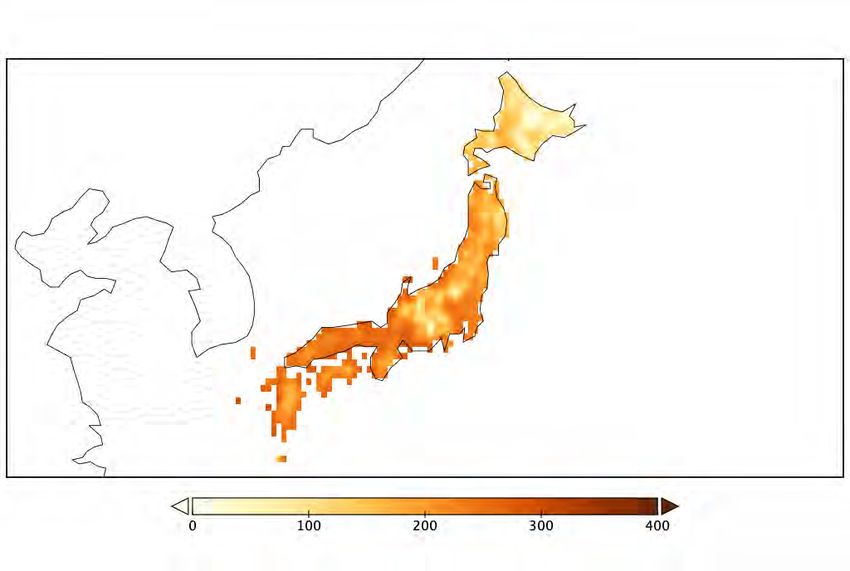
VULNERABILITY AND RISK
         Coastal areas of Japan are exposed to the impacts of                                                           VULNERABLE
         waves and sea level rise. However, protection measures                                          HISTORICAL     POPULATION
         are in place around most of the country, particularly in
         areas subject to tsunami inundations, which have a
         much higher impact on coastal flooding than sea level
         rise.                                                                                        3.20 Million

         Tsunami risk is concentrated in the southern and
         eastern coasts of Japan, whereas the western coast is
         less exposed to tsunamis and the impact of storm                                                  2050
                                                                                                                                      4.00 Million
         surges from typhoons.
                                                                                                                                        3.90 Million
         The most affected areas include Tokyo, Nagoya, Osaka and Okayama.
         Given the high population density around the south coast of Japan,                                                           3.80 Million
         with more than 100 million people concentrated in coastal urban
         areas, coastal population exposure can be considered widespread.
         Under a medium emissions scenario, the population exposed to the
         annual coastal flood level is expected to increase from 3.2 to 3.9                                                            6.10 Million
                                                                                                           2100
         million people by 2050.
                                                                                                                                        5.00 Million

                                                                                                                                      4.70 Million

                           INFLUENCE OF SEA LEVEL RISE
                           ON EXTREME SEA LEVEL                                              + Wave set up refers to the accumulation of water near
                                                                                             the shore due to the presence of breaking waves.
         Present and future sea level rise are a consequence of
         carbon induced global warming causing melting ice                                   + Storm surge is an occasional increase in sea level driven
         and ocean expansion due to heat accumulation.                                       by shoreward wind-driven water circulation and atmo-
                                                                                             spheric pressure.
         The extreme sea levels reported here are based on the 100-year storm
         surge + wave set up + sea level rise + high tide indicators. The first two           + High tide is usually the highest tide reached in a given
         parameters (storm surge + wave set up) are based on the 100-year                    location based on tide records.
         value for the event; sea level rise is its projected value at 2050; and
         high tide is the absolute value of the highest tide calculated for a
         given locality, which won’t be influenced by climate change.

                                                                                                                                                 Wave set up
                                                                                                                                                         Storm surge
         Wave set up                                                                                                                             Storm surge
Storm surge
        Storm surge
          Lowest  tide

            Mean sea level                                                  Extreme     Mean sea level
                                                                                                                                                 Sea levelSea
                                                                                                                                                           riselevel rise
Sea levelSea
          riselevel rise                                                    sea level
                                            0m elevation (AHD)                                                         0m elevation (AHD)
Hig tide Hig tide                                                                       Lowest tide                                                   Hig tide Hig tide

         Present sea levels have risen globally by approximately 20 centime-            Future sea level rise is a projection based on different global
         tres over the past century.                                                    warming scenarios, at approximately 100 centimetres by the end of
                                                                                        2100, with consequent inundation during extreme sea level events.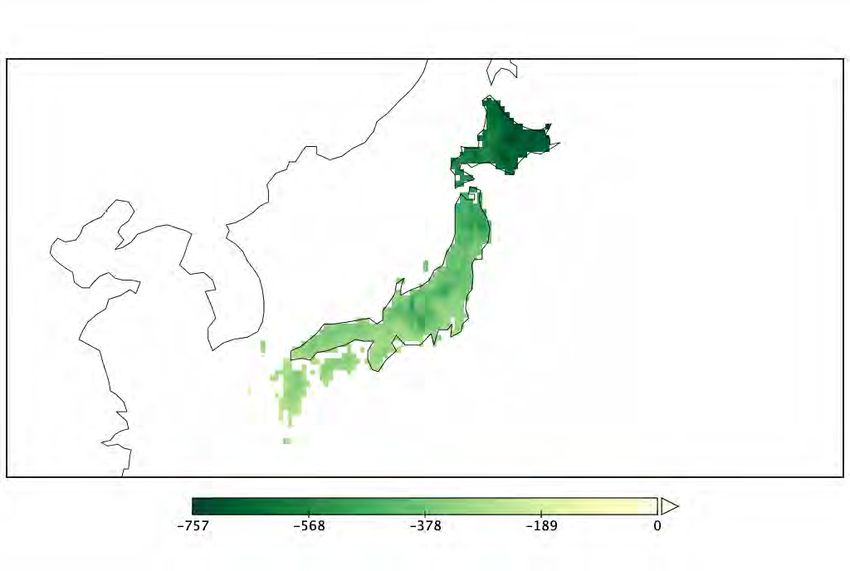
JAPAN

WATER
OVERVIEW
Japan's water resources are mostly influenced by rain-
fall distribution across the main islands. Annual preci-                   Renewable internal                      430
pitation in Japan is approximately 650 billion cubic                       freshwater resources               billion m3
metres, of which around 230 billion cubic metres
(35%) are lost through evaporation. Therefore, the
remaining 420 billion cubic metres are the most left
available for human use, which decreases in years of
low precipitation, and is reduced to 280 billion cubic                     Renewable internal                    3,391
metres in years of water shortage, which occur once                        freshwater resources                       m3
every 10 years.                                                            per capita

The amount of water actually used is approximately                        Over the last century the annual mean temperature has increased
83.5 billion cubic metres, equivalent to roughly 20% of                   from 10.3 to 11.5°C. With a further increase in temperature, of 1 to 3°C
the mean inventory of water resources. In the northern                    expected over the rest of the century, snowfall is expected to decrease
part of Japan, about 50% of the area of the country,                      during the winter, and subsequently, snowmelt supplied to rivers will
snowfall is responsible for a large part of total annual                  also decrease in early spring. This may lead to an alteration in the river
precipitation.                                                            discharge pattern, which will decrease during spring and early
                                                                          summer and become less gradual.

CLIMATE CHANGE HAZARDS
Climate change can affect water resources through increasing tempe-       in the vulnerability to climate change, and in the most significant
ratures, higher rates of evapotranspiration and altered rainfall          hydrological processes that will be affected. Common features of
patterns. This leads to changes in the water cycle, including decrease    climate change impacts include enhanced drought frequency (espe-
of snow and ice coverage, alterations of surface runoff and groundwa-     cially on the Honshu island) and increased flood discharge (especially
ter storage, as well as drought and flood occurrence. The impacts of       in Hokkaido and Kanto regions). From June to October these changes
climate change will show pronounced regionality in their magnitude,       may be particularly marked.

KEY POINT RUNOFF
Precipitation, evaporation, transpiration and soil moisture are the key                                                                +14.7%
                                                                          2050
factors impacting volume of runoffs and evaporation. Impacts of                        Changes in
changes in the surface runoff may include soil erosion, transport of                   annual runoff
pollutants and increased flood risk.                                                    % of change
                                                                                                                                       +12.1%
At a country scale, an average increase in surface runoff by approxima-
tely 12% and 15% is expected respectively under low and medium
emissions scenarios for the 2045-2055 period compared to
2015-2025.
                                                                                                                                       +28.0%
                                                                          2050
If temperatures rise by 1.5°C, 2°C or 4°C, 5%, 9.6% or 28% of the area                Runoff increase
of the country will likely experience an increase in runoff, while 2%,                % of area
6.9% or 20% of the surface of the country will likely experience a
decrease in runoff, respectively.                                                                                                      +5.0%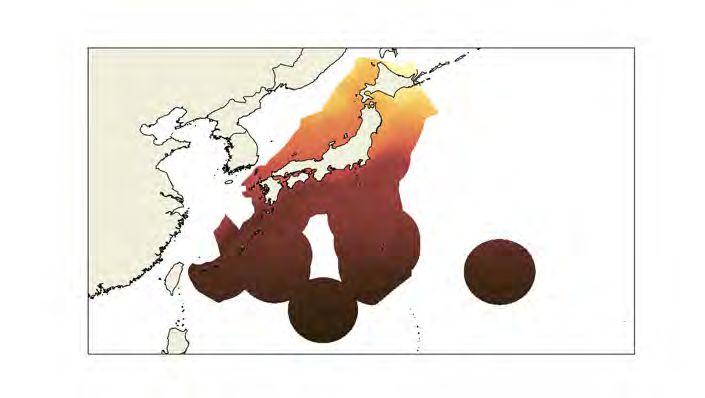
KEY POINT DROUGHTS
                                                                                                                                     +3.4%
Owing to its topography where rainwater falls in the mountain ranges
and flows quickly to the ocean, Japan has experienced repeated
                                                                            2050     Severe drought
drought events in the past. In 1994 for instance, because of the most                likelihood increase
severe drought episode of the last century, most regions experienced                 % of change
water shortages. During this period, the water quality of major rivers                                                               +1.9%
(Lake Sagami, Tsukui, and Tanzawa) deteriorated and the water supply
had to be regulated at a very high economic cost. Due to climate
change, an increase in the number of days without rain is expected.
Except for northern Japan and the central mountainous region, there                                                                  +9.0%
is a risk that river discharge will decrease, leading to severe drought.
In regions where snow melt water is used, maximum river discharge
                                                                            2050     Hydrological
may fall during the snowmelt period and its peak may occur earlier                   drought frequency
than usual, thereby leading to the possibility of decreased river                    % of change
discharge when water is most in demand.                                                                                              +7.0%

KEY POINT GROUNDWATER
In Japan, groundwater represents approximately 13% (10.4 billion
                                                                                                                                     -16.0%
cubic metres) of the total water use (83.5 billion cubic metres), and it    2050     Groundwater
has been a traditional source of water supply for a long period of time.             Recharge
After the country entered a rapid phase of industrialization and                     % of change
urbanization, there was an obvious increase in the pressures on the
groundwater environment. Uncontrolled abstraction of groundwater
                                                                                                                                     -1.0%
soon led to the emergence of problems such as the drawdown of
water tables, saline water intrusion near the Tokyo Bay area, and land
subsidence. The Tokyo government managed to overcome all of these           to further increased salt water intrusion into the groundwater. At the
problems by introducing hard and soft measures. Modern issues such          country level, a -1%, -9.2% and -16% decrease of the annual groun-
as the impacts of climate change, groundwater seepage to under-             dwater recharge for the period 2045-2055 compared to the timefra-
ground infrastructure, and micro-pollutant contamination have               me 2015-2025 is expected respectively under under low, medium and
recently emerged. In outlying islands, the rise in sea level could lead     high emissions scenarios.

KEY POINT FLOODS                                                            POPULATION AFFECTED BY RIVER FLOODS
Japan has been suffering from flood disasters since ancient times and
is still exposed to high flood risks, due to the high concentration of               TODAY                                               20,600
people and assets in flood-prone areas. In the archipelago, flood                                                                           people
disasters are more likely to happen in small rivers than in large rivers,
because small rivers managed by the prefecture have less hazard                     2050 SSP3                                           153,147
evaluations than large rivers managed by the country.                                                                                     people

In addition, flash floods can be extremely dangerous for the country:
                                                                                    2050 SSP5                                          196,739
for instance, in the early summer 2018 the southwestern part of Japan                                                                     people
experienced widespread damages, mudflows and casualties, while
forcing millions to evacuate across 15 prefectures, due to severe           with intense precipitation (more than 50 millimetres of rain) is
rainfall events. Changing rain patterns may affect the frequency and        expected, with 0.34 days under a low emissions scenario and 0.7 days
intensity of floods. By 2050 a slight increase in the number of days         under a high emissions scenario.

RISK INDICATORS
The water stress index summarises current and future water related
vulnerabilities and risks at the global level. Scores are based on the
ratio of total water withdrawals, including agriculture, industrial and
human consumption, to available renewable surface and groundwa-
ter supplies.

WATER STRESS
Japan's water stress level is considered low-medium for the recent
past (1960-2014 average), and it is expected to increase in the near
future (2030-2050) based on climate change projections.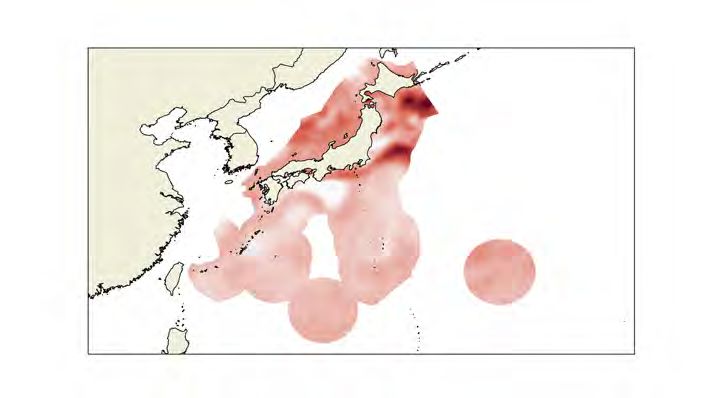
JAPAN

AGRICULTURE
OVERVIEW
In Japan, cultivated land and the relevance of the agri-
cultural sector have been in steady decline over recent
decades, accounting for only 0.9% of the country’s GDP
in 2018. Farmland is scarce (only 20% of the total area),
and high subsidies have been implemented to improve                             10.6 Mt                                    1.2 Mt
agricultural areas and their productivity, in particular                         Rice                                   Sugarcane
for paddy land.
The main staple food is rice, which is grown intensively in most                                      3.6 Mt
provinces and covers a large portion of domestic consumption. Sugar-
cane is also grown extensively in Okinawa and Kagoshima prefectu-
                                                                                                     Sugarbeet
res, whereas sugarbeet production is focused in Hokkaido. Farming in
Japan is also devoted to high quality crop production, with a focus on
several fruit trees (citrus, pome, peaches). In contrast, wheat                 0.8 Mt                                     0.8 Mt
production is quite limited compared to domestic demand, forcing the             Wheat                                       Citrus
country to rely on agricultural imports. Irrigation in agriculture is
extremely relevant, especially for rice production, and adsorbed 64%
of total water withdrawal in 2017.

Added Value of Agricultu-             Share of Agriculture                    Agricultural                           Area Equipped
 re, Forestry and Fishing           Value added in Total GDP                     land                                 for Irrigation

                                2000                                   2000                            2000

          67,459                                1.7 %                            4,830                                      2,641
         USD Million                                                          Thousand HA                               Thousand HA

                                2018                                   2018                            2018

          42,908                                0.9 %                           4,420                                       2,405
         USD Million                                                          Thousand HA                               Thousand HA

EXPECTED IMPACTS
ON AGRICULTURE PRODUCTIVITY                                                                                                 Rising
                                                                                                                      temperatures
                                                                                     Changes in
Rising temperatures, reduction in average annual precipitation, and                  precipitation
intensification of extreme events such as heat waves and drought,                     patterns
affect production variability with a tendency towards yield                                                                  Increased
reduction for many cultivated species, accompanied by a probable                                                      frequency of dry
decrease in food quality. Crops respond to increases in temperatures                                                spells and drought   Temperature
with changes in duration of the growing season, early appearance of                                                                        variability
phenological phases and potential shifts of cultivation areas toward                                   Increasing intensity of
higher latitudes and altitudes for better growing conditions. Howe-                                    extreme weather events
ver, impacts vary significantly depending on the geographical area
and specific crops in question.
CROP PRODUCTIVITY 6.8 13.2 (2.9)% 66.7 11.9 (5.9)%
Crop productivity refers to the harvested yield of a crop per unit of
land area. It is strongly influenced by climate and other environmental 13.8 (-2.6)% 12.4 (na)%
and management factors. Rice Sugarbeet
tons / ha tons / ha
Climate change is expected to have an impact on the productivity of
several major crops, although this may in part be offset by the fertili- 53.8 -0.1 (0)% 4.3 11.2 (4.5)%
zing effect of higher CO₂.
-4.2 (-4)% 10.7 (3.7)%
Impacts are estimated using a range of model projections based on Sugarcane Wheat
tons / ha tons / ha
low to high emission scenarios and reported as percentage changes
between the 30-year average around the historical period and the
30-year average around 2050. Productivity change with (without) the CO₂ fertilization effect.
2050
Estimates assume sufficient water and nutrient supplies, and
do not include impacts of pests, diseases, or extreme events.
CHANGE IN RICE CHANGE IN WHEAT
_ = + _ = +
On average, rice productivity may increase, particularly in central and rate grasses and increase in tropical grasses. However, the latter is
northern areas. However, a decline is expected for extremely warm relatively poor in nutrients. A changing climate may alter suitability
years due to heat stress. High temperatures could be detrimental to and distribution of several high-cash tree crops: Satsuma mandarin
rice yield with increasing levels of immature and cracked grains. gradually expanding northward and inland; Tankan mandarin could
Sugarcane may suffer a strong decline, while rapeseed and wheat replace several coastal areas where Satsuma mandarin is actually
cultivation may see strong gains in productivity especially in the cultivated; Grape production in Hokkaido is projected to expand to
northern provinces. Warming is projected to lead to an overall increa- higher altitudes.
se in the productivity of grass for livestock, with a decrease in tempe-
ADAPTATION IN AGRICULTURE AND WATER RESOURCES
Climate change may have some positive effects on some of the most (on a calorie basis). On average, irrigated areas are not expected to
widely used crops. However, higher temperatures may generally increase and in some regions they are even expected to decline,
require an increase in irrigation demand due to higher plant evapo- leading to lower water consumption from the agricultural sector. If
transpiration and expansion of irrigated areas. Japanese agriculture demand and internal production for grain and other high-cash crop
actually covers 40% of national self-sufficiency in terms of food supply increases, an expansion in irrigated area could pose a threat to water
resources in terms of quantity and quality.
CHANGE IN WATER DEMAND
_ = +
Agriculture
Water Demand -1.2%
% of change
-4.9%
2050
Several adaptation practices may help reduce climate risks,
such as anticipating crop transplanting to avoid rice earing
in the hottest period, developing heat-resistant rice
varieties, supporting management and renewal of irrigation
facilities.JAPAN
FORESTS
FORESTS IN JAPAN
Japan's rainy climate and mild temperatures are an 1990
ideal environment for forests, making it one of the
most forested countries in the world with boreal coni-
ferous forests, temperate deciduous forests and ever-
green broadleaf forests. 25 Mln ha 46 Tons/ha
Million hectares Tons of Carbon per hectare
Over 20% of these are considered primary. Mangrove Forested area Carbon stock
stands can be found in some places in the southern
islands. 2020
FORESTED AREA AND CARBON STORAGE
Nearly 70% of Japan is covered in forests. Japanese forests store 25 Mln ha 66 Tons/ha
Million hectares Tons of Carbon per hectare
almost 3,000 teragrammes of carbon and remove over 1.5 megagram-
mes of carbon per hectare every year. Forests are undoubtedly a key Forested area Carbon stock
carbon sink for Japan.
FOREST PRODUCTIVITY 2050
Forest productivity or Net Primary Production is the net carbon captu- Productivity anomaly +0.59
red by plants. It is the difference between the carbon gained by Gross Tons of Carbon per
hectare per year
Primary Production - net photosynthesis measured at the ecosystem +0.42
scale - and carbon released by plants' respiration. It is expressed per
unit land area.
Models predict a slight increase in the entire country,
but with very high uncertainty
+ Fertilizing effect of increasing atmospheric CO₂ and nitrogen
deposition, and rising temperatures promote productivity
Noticeable decrease expected for the island of
Okinawa
+ Increasing risk of drought stress reduces productivity
KEY SPECIES
THREATENED VULNERABILITY
SHIITAKE MUSHROOM BEECH
UNDER Significant negative impacts on Shiitake
mushroom production
Beech dominated forests show high
vulnerability and could be replaced by Oak
CLIMATE dominant types
CHANGE VULNERABILITY
MANGROVES
DECREASING
CONIFEROUS
Rapid sea level rise will threaten coastal In northern Japan the growth rates of
mangrove forests of the islands south of coniferous species will decrease whereas
Kyushu broad-leaved species will increaseFIRES IN JAPAN WHERE DO FIRES OCCUR?
Fire is a structural ecological process that provides several types of
ecosystem services and impacts on socio-ecological systems,
including human health, carbon budgets, and climate change. Changes Herbaceous ferns and dead
in global fire activity are influenced by multiple factors such as plant matter are the main fuel
land-cover change, policies, and climatic conditions. Fire also releases for forest fires.
large quantities of greenhouse gases into the atmosphere, contribu-
ting to a vicious cycle.
During the last two decades, 36,400 fires occurred.
BURNING EMITTING
19 THOUSAND HECTARES OF 0.78 TERAGRAMMES
FOREST OF CARBON PER YEAR
The region most susceptible to
fire are the Seto Inland Sea
region, included in the Honshu
and Shikoku islands, due to its
dry weather.
FOREST FIRE EMISSIONS
CONTRIBUTED TO
51% OF TOTAL FIRE RELATED
CARBON EMISSIONS
FUTURE BURNED AREA CASE STUDY: AIR QUALITY
Under a low emission scenario, models project a generalised
decrease in burned areas leading up to 2050, which might Vegetation fires are a significant source of gases and
concentrate in northern regions dominated by temperate conifer particulate that can have adverse effects on human
forest. In contrast, in some southern areas dominated by temperate health, with impacts at regional and intercontinental
evergreen forests burned area is expected to slightly increase. Under scales.
a medium emission scenario, models project temperate conifer
forests in the north to experience a slight increase. During 2003, 2008 and 2014, anomalous warm and dry
conditions over Euro-Asia led to large scale wildfires with
smoke reaching the Hokkaido region and affecting air
quality in Sapporo.
2050
Burned Area -20.9 In the spring of 2003 and 2008, intense Siberian wildfires
km² per year led to Rishiri Island experiencing high PM2.5 concentra-
-29.9 tions.
FUTURE FIRE EMISSIONS
Under both low and medium emissions scenarios, fire emissions
are expected to increase slightly, following a similar spatial
pattern to burned areas with a pronounced increase in north-eastern
regions.
2050
Fire Carbon emission +1.1
Decrease in burned areas for a low emissions scenario Teragrams of Carbon per
year
+1.1
Increase in burned areas for a low emissions scenario
+ Increase in number of days with weather that is considered
conducive to fire due to prolonged dry periods
+ Increase in temperature and greater variance in rainfall
+ Prolonged fire seasonJAPAN
URBAN
OVERVIEW
With an urbanization rate of 91.8% in 2020, Japan is 2020
one of the most urbanized countries. Population will
continue to concentrate in urban areas, with an urbani- 116,099,672
zation rate of almost 95% expected by 2050. Population in
Urban Areas
Half of the urban population is concentrated in the two 2050 103,038,909
largest urban areas, and 20% in urban areas with less
than 300,000 inhabitants. Japan's overall demographic
decline will mainly affect medium sized cities, which
will lose up to 16% of their population by 2035.
Graphs refer to data provided by United Nations, Department of
Economic and Social Affairs, Population Division (2018). World Urbani-
Built up areas cover 10.37% of Japan (38,729.36square zation
kilometers).
2020
91.8%
Urbanization
Rate
2050
94.7%
OVERVIEW OF KEY
CLIMATE IMPACTS IN URBAN AREAS
Under a changing climate, Japanese cities and urban agglomerations
will be affected by increasing impacts from heatwaves and the conse-
quences of flooding due to heavy rainfall and storm surges. +120.0%
2050
Cooling
Degree Days +43.0%
HEATWAVES AND HEAT STRESS % of change
Japan is experiencing an increasing trend in fatalities due to heat +27.0%
illness, with a peak in 2010, when temperatures were extremely high.
Numbers of heat related ilnesses and deaths are increasing. In the
period between 1968 and 1994, 2,326 deaths from heat stroke were
+85.5%
registered, of which 589 in 1994 when a severe heat wave brought
2050
Heatwave
temperatures reaching over 38°C.
frequency +31.8%
% of change
During the 2018 summer, a total of 95,137 Japanese residents were
taken to hospital with heat stroke symptoms, of which approximately +18.3%
50% were 65-year-olds and above. Rising average temperatures and
increasing numbers of extreme events will lead to more frequent and
prolonged heat waves. +1,563%
As a consequence morbidity and mortality will rise and may even
2050 Heatwave +232%
double in eastern and northern Japan. duration
% of time
+79%AN AGEING SOCIETY
Japan is a highly urbanized and rapidly ageing society which is proble- 2017
matic as the elderly are particularly vulnerable to heat related Population exposed
impacts, and urban populations are more exposed to high temperatu- 76.8%
to air pollution
res.
By 2035, approximately 38% of the population will be over 65 years
old. High levels of air pollution are increasing the impacts of urban
heat. In 2017, almost 77% of the overall population was exposed to
levels of air pollution exceeding WHO threshold levels.
COASTAL FLOODING 2050 0.23 m
Japan is vulnerable to coastal flooding, due to its geography and
dense urbanization along the long coastline, in particular on the most
populated island of Honshū. Japan is also subject to regular Typhoon
landfalls. 0.18 m
Projected
sea level rise
0.77 m
2100
FLOODING AND LANDSLIDES
0.38 m
Japan is vulnerable to flooding from extreme precipitation and coastal
flooding due to its layout and dense urbanization, in particular on the
most populated island of Honshū. High rates of soil sealing also +28%
contribute to flooding risks. In 2018, torrential rainfalls resulted in 2050 Runoff
flash floods and mudslides causing more than 200 deaths the evacua-
tion of 2.3 million people and over 7 billion USD in damages.
increase +10%
% of area
In the same year a typhoon caused over 12 billion USD in economic +5%
damages. Rising sea levels, wave heights and frequency of typhoons
are expected to increase damage to human settlements. Future flood
risk will increase bringing deeper flood depths, with a 170% increase
of flood depth in Tokyo expected by 2050. This will generate damages
to real estate and infrastructure by 220% to 240%.
SURFACE SEALING Heavy precipitation in cities is problematic due to the high level of sealed surfaces. Soil sealing
increases run off and reduces the amount of water absorbed by soil. Where there are large amoun-
AND FLOODS ts of impervious ground cover, short duration extreme rainfall events can lead to increased
flooding, even resulting in flash floods.
2010 % of urban population
SOIL SEALING AND FLASH FLOODS Population 0%
Under a high emissions scenarios, the risk of significant damage to living in slums
urbanized areas is expected to increase, driven by the combined effect
of changing precipitation patterns, rising sea levels and high rates of
soil impermeability.
% of total population
Urban population
2018
living in areas 11.9%
where elevation is
below 5 metersJAPAN
HEALTH
OVERVIEW
Japan’s climate and weather patterns have changed. the elderly population in the world. Rising temperatu-
The increase in mean temperature, combined with the res are also expected to facilitate the spread of disease
increase in heatwave intensity and heat stress, puts across Japan, including vector-borne diseases such as
vulnerable populations, such as the elderly, at high risk. dengue, which thrives in warmer climates.
It should be noted that Japan has the highest share of
HEAT RELATED MORTALITY
Japan’s ageing population makes it uniquely vulnerable to the
changing climate, especially heatwaves. Under a high emissions Heat-related mortality
% change with respect to 2000-2004
scenario, heatwave-related excess deaths will increase by 174%,
whereas under a moderate warming scenario of medium emissions,
the increases in heatwave-related excess mortality will be 104%.
In 2018, there was a 58% increase in heat-related deaths in Japan 2018
compared to a 2000 to 2004 baseline. 32.8% of heat-related mortality
in Japan from 1991 to 2015 can be attributed to human-induced +58%
climate change.
IMPACTS ON LABOUR Impact on total labour
% change with respect to 1986-2005 baseline
Labour is directly affected by changes in environmental conditions.
Warming affects both the number of hours worked (labour supply) and
on the productivity of workers during their working hours (labour
productivity). Both labour supply and productivity are projected to
decrease under future climate change in most parts of the world, and 2050
particularly in tropical regions.
Parts of sub-Saharan Africa, south Asia, and southeast Asia are at
highest risk under future warming scenarios. Future climate change
will reduce global total labour in the low-exposure sectors by 18
percentage points and by24.8 percentage points in the high-exposure
-0.9%
sectors under a 3.0°C warming scenario
Total labour in Japan is expected to decline by 0.88% under a low
emissions scenario, and by 2.2% under a medium emissions scenario. -2.2%
2080CLIMATE CHANGE AND DENGUE
Dengue has spread throughout the tropical world over the past 60
years and now affects over half the world’s population. Globally, vecto- Dengue suitability
rial capacity for both dengue vectors (A. aegypti and A. albopictus) has % of population at risk
been rising steadily since the 1980s, with nine of the ten highest years
occurring since 2000.
Climatic stressors are one important driver of the current distribution 81.8%
and incidence of dengue. Climate change is likely to expand the 2050
geographical distribution and suitability of several vector-borne
human infectious diseases including dengue. The risk of dengue 84.7%
transmission is increased by warming climates, as the growth and
development of mosquitoes are significantly influenced by temperatu-
re, precipitation, and humidity.
CLIMATE CHANGE AND ZIKA
Zika virus has spread to at least 49 countries and territories since 2013.
Climate change impacts on transmission suitability risk have increased Zika suitability
over the years and future warming over 1.3 billion additional people % of population at risk
could face suitable transmission temperatures for Zika by 2050.
DENGUE AND ZIKA: POPULATION AT RISK 82.7%
2050
The 2014 dengue outbreak in Japan may indicate that environmental
conditions are becoming favourable. 80.7%
Under a medium emissions scenario, 84.7% of the population will be
at risk of transmission-suitable mean temperature for dengue by 2050,
whereas 81.8% will be at risk under a high emissions scenario.
In the case of Zika, 80.7% of the population will be at risk by 2050
under a medium emissions scenario, whereas 82.7% will be at risk
under a high emissions scenario.
CLIMATE CHANGE AND MALARIA
Japan is a former malaria-endemic country, where malaria vectors are
still present. By 2050, 40.4% and 42.5% of the Japanese population Malaria suitability
will be at risk of malaria under low and high emissions scenarios, % of population at risk
respectively.
42.5%
2050
40.4%
POLLUTION AND PREMATURE MORTALITY
An overall 10 µg/m3 increase in daily PM2.5 concentrations was
associated with a 1.3% increase in total non-accidental mortality in
Japan. By 2060, 779 deaths will be caused by outdoor air pollution per
year per million people in Japan compared to 468 in 2010.JAPAN
ENERGY
ENERGY SYSTEM IN A NUTSHELL ENERGY SUPPLY
In recent decades, Japan has made substantial impro- Japan's energy mix shows a strong dependence on (imported) fossil
vements in the overall energy efficiency of its economy. fuels (88% of total primary energy supply in 2019), mostly oil, 38%
used mainly for transport, but also coal (27%), and gas (23%), which
compensate the drop in nuclear power generation after the Fukushi-
The 2012 Fukushima disaster, and the ensuing phasing ma disaster (4% in 2019 compared to 15% in 2010). Only 8% of total
out of nuclear capacity, however, has considerably primary energy supply is met by renewable sources (doubling their
increased the country’s dependence from fossil fuels, 1990 share).
which is putting a strong strain on Japan's decarboni-
zation process.
0.08 90.5%
ktoe/US$
Energy intensity Import
10.5% dependence ratio
AC Share in
electricity consumption
CLIMATE CHANGE TODAY
EXTREME EVENTS - FLOODS AND
TYPHOONS
The Japanese energy system has been hit
severely by floods caused by heavy precipita-
tion and typhoons. In September and October
2020, the Faxai and Hagibis typhoons left 10
million homes without electricity. Cooling
needs are increasing, following the
faster-than-global-average temperature
increases, and the increase in heatwave
frequency .
HEAT - COOLING NEEDS
Cooling needs are increasing, following the
faster-than-global-average increase in
temperatures and the increase in heatwave
frequency.
ENERGY DEMAND
Energy in Japan is used mainly by the industrial sector (29% of total
HEATWAVES final consumption in 2018), transport (25%) tertiary sector (17%) and
Heatwave frequency is increasing. Japan has residential demand (15%); whereas agriculture and fishing together
been hit by a particularly strong heatwave in have a slim 1.7% share. The share of non-energy use is relevant (12%).
August 2019. Air conditioning contributed 10.5% to residential electricity demand in
2015.FUTURE ENERGY DEMAND
In Japan, the decrease in heating demand is going to be more than
compensated by the increase in cooling needs, resulting in a net
increase of energy demand of almost 2,698 PJ (750 billion Kwh) by
Net change in 2050
+ 749.68
2050 under a medium emissions scenario. energy demand due to
changes in HDD/CDD
Billion KWh
COOLING NEEDS COOLING DEGREE DAYS 0 400
Cooling needs increase more substantial-
ly in the southern islands of Shikoku and
Kyushu, while in Hokkaido and in the
elevations of Honshu, only moderate
increases will occur.
HEATING NEEDS HEATING DEGREE DAYS -757 0
The pattern is somewhat reversed comn-
pared to cooling needs. Marked decreases
in heating needs are expected all over the
country, descending in magnitude from
Hokkaido where they reach their
maximum, to the southern islands where
the drop is moderate.
FUTURE EXPECTED IMPACTS
ENERGY SUPPLY OF CLIMATE CHANGE
The future configuration of the Japanese energy mix is likely to be The 2021 IEA's Japan Policy Review notes that adapting the energy
determined by the evolution of climate mitigation policies and hence sector to climate change was not perceived as a priority by the
is outside the scope of this report. In 2020 Japan announced its target Japanese government in the 2015 NDC, and the threats posed were
for full decarbonization by 2050, but it is still committed to a 26% seen as of “not very high significance and low urgency due to the
emission cut by 2030. This is likely to result in fossil fuels (and their limited number of cases”, bar some concern for indirect impacts on
vulnerabilities) keeping their relevance for the next few years, while imports.
carbon free sources (renewables and the residual nuclear) and their
vulnerabilities will prevail in the second half of the century. This position does not seem to have changed despite the recent
extreme climate events. A modest reduction in hydropower potential
-3.56% is expected.
Change in 2050
Hydropower generation -2.63%
% of changeJAPAN
ECONOMY
OVERVIEW
Japan ranks 4th in terms of GDP among G20 economies.
Japan was badly affected by the COVID crisis, recording
a decline of 4.8% in real GDP in 2020. In 2021 this 1.1/3.72%
trend has reversed and the country has seen 3.3% 2050
growth.
0.8/1.6%
IMPACTS ON GDP
There is a noticeable variability across estimates of the overall econo-
mic impact of climate change for Japan, although estimates under GDP Loss
similar assumptions tend to converge across studies. % change w.r.t baseline
The projected overall macroeconomic impacts for Japan range from
moderate GDP losses (0.8 %) under a low emissions scenario in 2050, 10.7%
to a loss larger than 10 % under a high emissions scenario by the end 2100
of the century.
3.47%
SECTORAL ECONOMIC IMPACTS
IMPACTS ON INDUSTRY AND INFRASTRUCTURE IMPACTS ON AGRICULTURE
Japan features the 7th longest coastline in the world. Just under half Agriculture, forestry and fisheries make up a small share of GDP,
of its population, and about the same proportion of industrial accounting for just 1% of the country’s GDP. Negative impacts of clima-
production, is vulnerable to an increase in sea level, due to the increa- te change can be expected in terms of reductions in the yield (up to
sed risk of coastal erosion, storm surges and typhoons. 40%) of high quality rice across Japan, although the overall yield of
rice, irrespective of the quality, may in fact increase by up to 30%.
Within the service macro-sector, the main economic impacts will likely Analogously, the quality of fruit and shitake fungi is expected to decre-
affect trade and transportation. Japan's economy and manufacturing ase; the suitable areas for the cultivation of some fruits is expected to
sector are based on highly sophisticated technologies, requiring a shift to higher latitudes and altitudes.
wider array of inputs which are usually not produced domestically, but
imported. This dependence from imports may also be an important IMPACTS ON FORESTRY AND FISHERY
source of climate vulnerability.
Increasing sea water temperatures around Japanese shores may result
For instance, it is estimated that 17% of Japanese imports during the in a drop in fish catches for traditional species (such as Hokkaido wild
period 2008-2018 originated from countries heavily threatened by salmon or abalone in the Tokyo Bay) and/or a transition to tropical
climate change. At the same time, Japan could benefit from a possible species. By mid century losses for the fishing sector could range
opening of the transpolar Artic route for freight transport, which between 243.6 million EUR under a low emissions scenario to 399.6
would reduce its distance from northern Europe by 37%. However, the million EUR under a high emissions scenario. In the second half of the
actual viability of such a route might be severely limited by safety and century, production losses may reach 239 million under a low
environmental factors, and hence the benefits, if any, might be very emissions scenario and 564 million EUR for a high emissions scenario.
limited. The areas suitable for the cultivation of edible seaweed are also
predicted to decline because of increasing sea water temperatures.404
2050
SEA LEVEL RISE DAMAGES
The economic losses induced by projected sea level rise in Japan are
massive. Assuming constant levels of coastal protection, in the low
emissions scenario asset losses could reach 203 and 537 billion EUR
in 2050 and 2070, respectively. 203
Under a high emissions scenario losses could increase to 404 and
Sea Level Rise
Expected annual damages
1,255 billion EUR in 2050 and 2070. Billion Euro
1255
2100
537
9.4
2050
RIVER FLOODING DAMAGES
River flooding can also induce substantial damages. By mid century
total asset losses could reach 7.1 to 9.4 billion EUR and in the second
half of the century 9.5 to 25.3 billion EUR under low and high Riverine 7.1
emissions scenarios, respectively. Flooding
Expected annual damages
Billion Euro
25.3
2100
9.5
IMPACTS ON TOURISM IMPACTS ON ENERGY
Japan is an important destination for international tourism, ranking As with all other economic sectors, energy supply and energy networks
7th in 2019 in terms of international tourists’ receipts. Some of its in Japan will undergo more intense stress from extreme weather
major attractions are nature-based and hence dependent on climate events.
conditions.
Key tourist hotspots such as autumn foliage season, cherry blossom Economic impacts of shifts in household and firm energy demand (see
season and winter drift ice form the Okhotsk Sea in Hokkaido are all chapter on energy) are difficult to predict and will mostly lead to
expected to undergo a direct negative impact due to increasing redistribution effects. In the case of Japan, the magnitude of the
temperature. Increasing temperatures will also imply less snow in increase in demand for cooling is expected to exceed by far the (tiny)
winter on mountain slopes, and hence negative consequences for decrease in heating demand, hence a significant increase in energy
skiing activities and mountain winter tourism. bills is expected.
The expected increase of extreme events such as typhoons is also
expected to weight negatively on the propension of international
tourists to visit this county in the future.JAPAN
POLICY
OVERVIEW INTERNATIONAL COMMITMENTS
Japan is responsible for 2.6% of global GHG emissions In April 2021, Japan proposed an updated NDC target of reducing
and has almost twice the world average rate of CO2 emissions by 46% below 2013 levels, which was a significant increase
from its previous commitment of a 26% reduction.
emissions per capita. Emissions have been declining
since 2013, and a net zero emissions by 2050 target
has been set. CLIMATE POLICY
COMMITMENTS CHRONOLOGY
1.204 1.159
MtCO2eq MtCO2eq 2002 KYOTO PROTOCOL - 1ST PERIOD
6% yearly average reduction in GHG over the four
year period 2008-2012, with respect to 1990
levels
2016 PARIS AGREEMENT - 1ST NDC
26% of GHG reduction by 2030 with reference to
2013 levels
2021 PARIS AGREEMENT - NDC UPDATE
46% GHG reduction by 2030 with reference to
1990 GHG EMISSIONS 2019 1990 levels
INTERNATIONAL CLIMATE Japan reported a financial commitment of 20.8 billion USD in climate action in 2017-2018 in
its 4th Biennial Report, almost all in the form of loans and similar instruments. The majority
FINANCE ASSISTANCE was directed at Asia. Mitigation was the main type of support.SUSTAINABLE RECOVERY POLICY ADAPTATION POLICY HIGHLIGHTS
According to the Global Recovery Observatory, in 2020 the proportion TRANSNATIONAL INITIATIVES
of green spending out of total recovery spending was 27%.
Asia-Pacific Climate Change Adaptation Information
Others: 4.387 Billion USD Platform (AP-PLAT)
The AP-PLAT was established to share climate risk information online
with research institutes/universities and to support adaptation
measures by providing advanced scientific climate risk information
1,311.95 304.48 80.82 NATIONAL INITIATIVES
billion $ billion $ billion $
Total Spending Recovery Spending Green Spending National Plan for Adaptation to the Impacts of
Climate Change
In 2015, Japan's government approved the 1st adaptation plan to
progress adaptation to climate change impacts systematically and
comprehensively across the country
DOMESTIC ADAPTATION POLICY Climate Change Adaptation Information Platform
(A-PLAT)
Japan’s National Plan for Adaptation to the Impacts of Climate Change A-PLAT is a portal that provides centralized information related to the
was adopted in 2015 and it includes sectorial measures in Agriculture, impacts of climate change, aiming to support the local governments,
Forestry, Fisheries; Water Resources; Natural Ecosystems; Natural businesses, and individuals to consider the adaptation measures to
Disasters/Coastal Areas; Human Health; Industrial/Economic Activity; climate change.
and Life of Citizenry and Urban Life.
SUBNATIONAL INITIATIVES
Inclusion of Adaptation in NDCs Tokyo Climate Change Adaptation Policy
Integrated Adaptation & Mitigation Policy The policy focuses on climate change impacts and policies for respon-
Domestic se to natural disasters, health, agriculture, forestry, and fisheries, water
Adaptation Policy Dedicated Adaptation Strategy resources and water environment, and natural environment.
Dedicated Adaptation Plan Fukuoka City's Climate Change Countermeasures
Action Plan
Sectoral Adaptation Plans The plan focuses on natural hazards from heavy rainfall and flooding,
Subordinate pressure on water resources, health risks from increased heat,
Adaptation Policies Subnational Adaptation Plans biodiversity loss, and effects on agricultural produce.
Policy not in place Active policy
ENERGY TRANSITION Energy Transition Fossil Fuels
Japan is performing along the G20 country average for what regards the overall
Energy Transition indicator. In particular, high performance in the Efficiency and 58.7 45.3
Electrification domains are pushing the transformation of the energy sector.
60.4 43.5
However, much is still to be done in increasing renewables installed capacity and in
using less fossil fuels. Progressing along this direction can also lower the level of
urban air pollution and of CO2 emissions per capita, further improving the Emissions Renewables Efficiency
indicator.
19.7 84.9
11.0 92.4
Only actively pursuing an energy transition based on decarbonization and Electrification Emissions
electrification – from policy and regulation, to health and education – will
enable countries to benefit the most from future opportunities and fight
G20 72.9
AVERAGE climate change whilst ensuring an equitable distribution of wealth. 70.8 72.9
COUNTRY
The Energy Transition indicators were developed by Enel Foundation in
cooperation with SACE, and provide a retrospective analysis based on 80.3 74.9
historical data.You can also read