Energy! ahead Energy Report of the City of Vienna - Data for 2015/ Year of reporting 2017, Municipal Department 20 - Stadt Wien
←
→
Page content transcription
If your browser does not render page correctly, please read the page content below
Energy!
ahead
 Energy Report of the City of Vienna
Data for 2015/ Year of reporting 2017, Municipal Department 20
ABBREVIATIONS

BLI          Bundesländer Luftschadstoff Inventur – survey of air pollutants in Austria
CHP          Combined heat and power, cogeneration
emikat.at    Emissions and energy data management system
             of the Austrian Institute of Technology (AIT)
ETS          Emissions trading system
GHG          Greenhouse gases
GIEC         Gross inland energy consumption
KliP         Climate protection programme of the City of Vienna
kWp          kilowatt peak
MA           Municipal Department
MIT          Motorised individual traffic
Non-ETS      Non-emissions trading system
PV           Photovoltaics
SCWR         Smart City Wien Framework Strategy
SEP          Urban Energy Efficiency Programme of the City of Vienna
STEP         Urban Development Plan oft he City of Vienna

IMPRINT

Owner and publisher:
Vienna City Administration/Municipal Department 20 – Energy Planning
Strategic coordination and editing of first chapter:
Municipal Department 20 – Energy Planning, www. energieplanung.wien.at
  Bernd Vogl, Herbert Ritter, Ursula Heumesser, Alexandra Höfenstöck
Energy Center Wien at UIV Urban Innovation Vienna GmbH
  Matthias Watzak-Helmer, Ute Gigler, Michael Cerveny, Waltraud Schmidt
Informationstechnologie im Energiebereich Valuch
  Monika Valuch
Design, illustration, layout:
Erdgeschoss GmbH, www.erdgeschoss.at
Copyright photos: Lukas Beck, Alexandra Kromus
English translation: Sylvi Rennert

Published and printed: Vienna 2017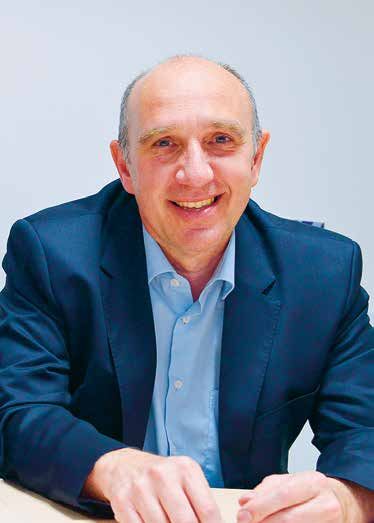
Energy!
ahead
DATA 2015
for the City of Vienna
4   TABLE OF CONTENTS

    1       Introduction and findings
    1.1     Preface                                                                               9
    1.2     Interview                                                                            10
    1.3     Milestones on the road to a sustainable energy future                                16
    1.4     Municipal Department 20 – Energy planning: Shaping Vienna's energy future            19
    1.5     Energy – from generation to use                                                      24
            a. An overview of the main concepts                                                  24
            b. Ideas for a smart city                                                            27
            c. Energy flow chart of the city of Vienna                                           27

    2       Indicators
    2.1     Monitoring indicators for the smart city wien framework strategy
    2.1.a   Emissions per capita                                                                 36
    2.1.b   Final energy consumption per capita                                                  37
    2.1.c   Primary energy consumption per capita                                                38
    2.1.d   Share of renewable energy in gross final energy consumption                          39
    2.1.e   Choice of transportation in Vienna                                                   40
    2.1.f   Share of motorised private transport in the modal split of the Viennese population   41
    2.1.g   Share of electric and hybrid cars                                                    42
    2.1.h   Share of electric and hybrid lorries                                                 43
    2.1.i   Energy consumption of passenger traffic across city boundaries                       44
    2.1.j   Share of energy sources for space heating, hot water and air conditioning            45
    2.1.k   Energy supply for subsidised large-scale housing in Vienna                           46
    2.1.l   Final energy consumption for space heating,
            air conditioning and hot water per capita                                            47
5

2.2      Developments in Vienna
2.2.a    Final energy consumption per capita in Vienna                                   48
2.2.b    Share of renewable energy and waste heat according to EU Directive 2009/28/EC   49
2.2.c    Share of renewable energy and waste heat according to the energy balance        50
2.2.d    Use of solar energy in Vienna’s districts                                       51
2.2.e    Electricity generation from renewable energy                                    52
2.2.f    Greenhouse gas (GHG) emissions per capita                                       53
2.2.g    Greenhouse gas emissions in relation to value added                             54
2.2.h    Car density in Vienna’s districts                                               55
2.2.i    Annual passes for public transport and cars per 1,000 inhabitants               56
2.2.j    Changes in number of cars and inhabitants by district                           57
2.2.k    Heating degree, frost, and ice days                                             58
2.2.l    Average annual temperature, summer days and hot days                            59

2.3      Comparison of federal provinces
2. 3.a   Final energy consumption per capita by federal province                         60
2. 3.b   Electrical energy per capita by federal province                                61
2. 3.c   Final energy consumption of private households per capita by federal province   62
2. 3.d   Final energy consumption in relation to value added by federal province         63
2. 3.e   Car density in provincial capitals                                              64
2. 3.f   Population growth by federal province                                           65
6

    INTRODUCTION 1
       AND FINDINGS
7
1. Preface 9
2. Interview 10
3. Milestones on the road to a sustainable energy future 16
4. Municipal Department 20 – Energy planning: Shaping Vienna's energy future 19
5. Energy – from generation to use 24
a. An overview of the main concepts 24
b. Ideas for a smart city 27
c. Energy flow chart of the city of Vienna 278 Maria Vassilakou
Vice Mayor of the City
of Vienna and Executive
City Councillor for
Urban Planning, Traffic
& Transport, Climate
Protection, Energy
and Public Participation1.1 PREFACE
In 2015, the highest concentration of greenhouse gases in the atmosphere to date was
measured. These concerning figures are an important reason to implement measures that will
help us meet the objectives of the Paris Agreement as quickly and consistently as possible. All
efforts in this area will benefit future generations.
With its 1.8 million inhabitants, Vienna is a strong driver for innovation at the heart of Europe.
9
Therefore, we must pay particular attention to energy efficiency and climate-friendly mobility,
increase the use of waste heat, and promote the use of renewables for energy generation.
Much has been achieved in all these areas. The impact of these efforts is reflected in this
energy report: For the first time, more people in Vienna own an annual public transport pass
than a car. Switching from cars to public transport has a dramatic impact on CO2 emissions, as
the transportation sector is the largest producer of carbon dioxide.
The first monitoring results show that the city is on the right track towards meeting the
ambitious goals of the Smart City Wien Framework Strategy. We have also developed a new
Energy Framework Strategy for Vienna, which lays out a clear path towards decarbonisation.
This strategy gives equal attention to the energy policy areas of energy efficiency, supply
security, economic viability, use of waste heat and renewables, and social impact.
Internationally, Vienna is regarded as a pioneer and driving force, and this year it was awarded
for its heat pump initiatives: At the DecarbHeat conference in Brussels on 11 and 12 May 2017,
the City of Vienna was awarded the “European Heat Pump City of the Year” award. Vienna’s
entry, which presented the city's main initiatives for promoting heat pumps, won over projects
from Trondheim and Berlin.
Numerous innovative energy projects are an impressive demonstration of how sustainable
energy supply can be implemented in a forward-looking way, and make Vienna a pioneer in the
use of new energy technologies and efficient construction. A new app allows users to discover
the many showcase projects in our city. It provides interesting information about buildings and
projects all over Vienna. It will soon be updated with many additional projects.
These are just some of the highlights you can read about in this new energy report. It contains
facts and figures about the city’s energy supply, energy efficiency and use, renewables, the
development of energy prices, and many other topics. There is no doubt: Vienna has to stay its
course towards sustainability. The coming generations will thank us for it.
Maria VassilakouCHAPTER 1
Introduction and findings
10
BERND VOGL HERBERT PÖSCHL
became Head of the Energy Planning became Head of the Energy Strategy Unit
Department (MA 20) in September 2011 in the Executive Group for the Environment
after working for 18 years at the Ministry of and Vienna Public Utilities in August 2016.
Environmental Affairs in the field of energy Previously, he and his team were in charge
planning and innovative energy systems. of energy management for all major faci-
lities of Wienenergie GmbH for medium-
term energy asset planning and operational
management for electricity, natural gas
(fuel oil), district heating and CO2.
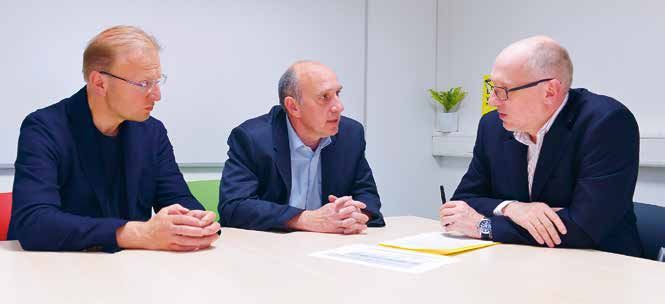
MA 20 Energy Report of the City of Vienna1.2 INTERVIEW
Interview by Herbert Ritter (Municipal Department 20)
with Bernd Vogl (Municipal Department 20) and Herbert Pöschl
(Executive Group for the Environment and Vienna Public Utilities).
HERBERT RITTER: Last year, you developed the Energy Framework Strategy 2030 for Vienna.
What does the city need an energy framework strategy for, and why was it developed now?
11
HERBERT PÖSCHL: One reason for developing the energy framework strategy was that
Vienna, as the largest city in Austria, has a very high energy density. That means that energy
demand and consumption are extremely high compared to the city’s size. The international
and European objectives of the Paris climate agreement have to be reflected in Austria’s
strategies as well as in the strategies of each province. That is why such a strategy is essential
for Vienna.
BERND VOGL: In 2014, the City of Vienna adopted the Smart City Wien Framework Strategy.
In its development, many fundamental long-term energy goals for 2030 and 2050 were
discussed and decided. But we also need specific strategies that set out the details of how our
ambitious long-term goals can be achieved. Therefore, it was the logical next step to follow
up on the Smart City Framework Strategy by tasking the energy experts with designing a
strategic framework for energy in Vienna, especially with a view to what measures can help us
achieve the goals. Currently, we have some great people working in energy, so they were able
to present a solid, well-rounded result in a very short time.
HERBERT PÖSCHL: I have been working for the Executive Group for the Environment and
Vienna Public Utilities since 1 August 2016. As a “newcomer”, this was a new challenge for
me and it was great to see what we were able to achieve in the short time available. We can be
proud of the results.
HERBERT RITTER: Vienna already has several strategies and programmes with a strong focus on
energy, like the Smart City Wien Framework Strategy you mentioned or the climate protection
programme. How is the Energy Framework Strategy embedded in the city’s array of programmes
and how do they link up to each other?
BERND VOGL: Vienna developed the Urban Energy Efficiency Programme SEP in 2006, an
ambitious climate protection programme in 2009, and the Smart City Wien Framework
Strategy in 2014. Therefore, there did not seem to be much urgency to develop an additional
energy strategy. However, the first discussions and plans for an energy strategy began in
2011 because there was a need for a holistic view of Vienna’s energy system. There were also
first discussions about an action plan for renewable energy in 2012. Now all of these ideas are
being bundled in a comprehensive Energy Framework Strategy for Vienna.
We are not the only city to do this; the Paris Agreement and decarbonisation efforts are
omnipresent. However, we are a lighthouse city that is already implementing the energy
system 2.0. We have achieved what other cities are still trying to do: We have nearly eliminated
oil and coal from our heat market. The next step is switching from natural gas to renewables.
To this end, we have to reinforce our efforts towards the use of waste heat and renewables.
Energy Report of the City of Vienna MA 20CHAPTER 1
Introduction and findings
HERBERT PÖSCHL: I consider the Smart City Wien Framework Strategy an umbrella strategy
that is located above the Energy Framework Strategy, the Urban Development Plan and the
climate protection programme. These sub-strategies are all on one level and interact with
each other.
BERND VOGL: We illustrated the relationship of the different programmes and strategies
to each other in the Energy Framework Strategy. The Smart City strategy is above all the
other strategies, the Energy Framework Strategy encompasses the entire energy sector, and
the other strategies (the climate change adaptation and urban development programmes)
are connected and have some overlap. Together, they form a large strategic framework.
12
It is not about the plans and ideas of individuals, but about cooperating more closely and
understanding that we are one single organism that is trying to meet ambitious energy and
climate policy goals.
HERBERT RITTER: The Energy Framework Strategy lays out the energy policy goals of the city.
What are they, what are their special characteristics, and how do they relate to each other?
HERBERT PÖSCHL: The energy policy goals are supply security, waste heat and renewables,
energy efficiency, economic viability, and social impact. None of these objectives has a higher
priority than the others, they are all equally important. I think it is important that these energy
policy objectives reflect a sustainable, socially equitable, fair and forward-looking energy
supply system for the city.
BERND VOGL: The City of Vienna considered it very important to add the social dimension
to the Smart City discussion, which was previously very much focused on technology. We on
the energy side also wanted to work gradually towards decarbonisation in a balanced way,
always keeping in mind these energy goals. Decarbonisation and using domestic resources
is a sustainable and socially beneficial approach. Future generations will be grateful for the
effort we put into pushing these issues, just as we are grateful to past generations for building
hydropower stations and giving Austria a step ahead in the renewables sector.
HERBERT RITTER: The Energy Framework Strategy works towards decarbonisation. What are the
main areas in which action is taken, and what are the next key measures? What major challenges
do we have to overcome?
HERBERT PÖSCHL: Taking our strategic areas as a starting point, our main challenges are in
the fields of strategic and sustainable energy supply, waste heat and renewables, the energy-
efficient city, energy use, mobility, and, of course, innovation and digitisation. There are
many excellent projects in the city that have already been completed. There are also projects
that are halfway done and now being revived. We are also addressing new issues, such as
digitisation. It’s a step towards the future.
BERND VOGL: Broadly speaking, we have two main issues in the city: Mobility on the one hand,
heating on the other. Both rely heavily on fossil energy sources; in the heating sector, it is
natural gas, and even district heating still uses some fossil energy sources. The entire heating
sector needs to shift more towards energy efficiency and renewables. We will have to look at
how the gas system, which plays a big part in heating, and related technologies develop. Will
there be renewable gas, and how much? How will cogeneration technologies, which are a very
efficient way of energy generation, develop? We should keep using cogeneration, as combined
heat and power plants are considered the backbone of our energy supply and can provide
electricity when there is a shortage, e.g. when renewables are not producing enough.
MA 20 Energy Report of the City of Vienna13 Energy Report of the City of Vienna MA 20
CHAPTER 1
     Introduction and findings

     For mobility, this means reducing private traffic in the public space and shifting towards public
     transport, cycling and walking, but also increasing electromobility. A city can provide suitable
     infrastructure, but it has very few ways of influencing technological developments as such.

     HERBERT RITTER: How can we reduce energy consumption? What are the legislative approaches
     at all levels, including the European level, where the motto is “energy efficiency first”? What
     strategies are available, particularly in the buildings and mobility sectors?

     BERND VOGL: Energy consumption is an important part of the strategy, particularly in the
     buildings sector. Electromobility is a leap forward in energy efficiency in the mobility sector,
14
     but in the buildings sector, where we have already done a lot, it is harder to reduce energy
     consumption further. That requires long-term investments. We know from the current
     funding instruments that it is hard to speed up refurbishment rates. The City of Vienna has
     been active in this area for 20 years, e.g. with the thermal energetic refurbishment initiative
     “Thewosan”, which yielded very visible results. Nevertheless, we must remain active in this
     field.

     HERBERT RITTER: The strategy also includes the energy use by end users, particularly in the
     section on consumers. Could you tell us a bit more about that?

     HERBERT PÖSCHL: It is important to reach people with our awareness-building measures.
     We also have to launch projects in kindergartens and schools to teach young children how to
     use energy. This is important because it is the only way to ensure that tomorrow’s adults know
     how to use energy efficiently.

     BERND VOGL: The “Wien Energie Erlebniswelt” experience is a great educational project,
     which our department helped develop. It is a good investment and it shows how Vienna tries
     to address all parts of the population with tailored energy information.

     HERBERT RITTER: In order to achieve a more sustainable energy supply, the “Vienna model” must
     be developed further while maintaining a high supply security. What approaches does that entail?

     HERBERT PÖSCHL: The Vienna model has two main components: Energy generation in the
     city on the one hand, and customer portfolios on the other, e.g. electricity, heating, or gas
     customers. These are linked by the overarching topic of grid infrastructure (district heating,
     electricity, natural gas, and in the future perhaps grids for biogas or synthetic gas). Over the
     next years, we must continue to expand the Vienna model, adding renewables and waste
     heat to it. There are also important new topics, such as increased use of photovoltaics and
     prosumer approaches that allow private users to sell electricity to their neighbours. The great
     technical challenge we are facing in this regard is what these many small power plants would
     mean for the electricity grid and supply security. Vienna has a very high degree of supply
     security, and we cannot let new technologies jeopardise that. The City of Vienna and the
     national government must create a legal framework within which these innovations can be
     implemented.

     BERND VOGL: Speaking of prosumers, we are currently implementing the “Smart Meter”
     project in Vienna. We are making large investments in this system, which will give us new
     methods for steering and using flexible tariffs. The city is a large consumer and should be
     able to use more energy when there is a lot of it. We want the city to act as energy storage.
     We are already in talks with the neighbouring provinces, as this is an energy region with a lot
     of wind and PV power. It is most beneficial to use this electricity directly in the energy region,

     MA 20 Energy Report of the City of Vienna
for example with electric vehicles. We also want buildings to use and store energy. We are
currently discussing methods like concrete core activation and heat storage, as well as battery
storage. There are many funding initiatives in this area. Every prosumer needs energy storage.
Smart meters will give us even more opportunities in this field.
HERBERT RITTER: The Energy Framework Strategy 2030 lays out the strategic guidelines for the
energy sector. What are the next steps, how will you implement these plans?
HERBERT PÖSCHL: The Energy Framework Strategy provides the framework for Vienna’s
energy policy. The individual areas will give rise to various initiatives, and we will implement
15
projects in the fields of energy efficiency and renewables. Another question we have to answer
is how to ensure that housing remains affordable in Vienna.
BERND VOGL: As regards the overall structure of the Energy Framework Strategy, we decided
to set up a steering group, which we will be heading jointly. We will commission and support
sub-programmes that are focused on measures for specific issues. These sub-programmes
will report about their progress to the steering group on a regular basis, and may be adapted
if necessary. The steering group is the point of contact for all sub-programmes supported by
the Energy Framework Strategy for Vienna.
HERBERT RITTER: Thank you for the interview.
Energy Report of the City of Vienna MA 20CHAPTER 1
Introduction and findings
1.3 MILESTONES ON THE ROAD
TO A SUSTAINABLE ENERGY FUTURE
Global developments
Paris Agreement enters into force
On 4 November 2016, the Paris Agreement entered into force after over 55 countries,
accounting in total for over 55 percent of the total global greenhouse gas emissions, had
deposited their instruments of ratification with the United Nations. Austria was among the
16
first countries to ratify the agreement.
At the Paris climate protection conference (COP 21) in December 2015, 195 countries had
agreed on a universal, legally binding global climate protection agreement for the first time in
history. It includes a global action plan that aims to limit global warming to well below 2°C. The
signatories commit to becoming climate neutral by the second half of the 21st century.
To this end, the countries will meet every five years and update the goals with more strict
objectives if scientific findings show it to be necessary. The consequences of the exit of the
United States from the Paris Agreement as announced by US president Trump on 1 June 2017
will only become clear in the coming years.
A global mega trend: Wind power and photovoltaics becoming more competitive
In 2016, the global investments in renewable energy installations were over US$ 280bn
(source: Bloomberg New Energy Finance). The lion’s share of these investments was into wind
power and PV installations. While annual investments in the sector have been hovering around
the $300bn mark for seven years, the installed capacity resulting from those investments has
nearly doubled in that period. This is reflected in the dramatic price drop in wind power and PV
installations, which has made them the cheapest way of generating electricity in many parts of
the world. A spectacular example of this was the tender for the third construction phase of the
Mohammed bin Rashid Al Maktoum Solar Park in Dubai, which is to be expanded by 800 MW. In
May 2016, the contract was awarded to a consortium with a bid of US$ 0.0299
(€ 0.026) per kilowatt-hour of solar power.
Price drops have been even more dramatic for battery storage, with prices falling by over ten
percent a year. The continuation of this trend will not only make electric vehicles commercially
viable by 2025 but also mean a breakthrough for stationary energy storage (especially in
conjunction with private PV installations).
Diesel emissions scandal heralds change in the automotive industry
The diesel emissions scandal, also referred to as “dieselgate”, began in September 2015,
when an illegal system was detected that throttled the exhaust cleaning mechanism of
diesel engines of a car manufacturer, designed to keep measured emissions levels below US
thresholds. The ensuing media reports and public discussion led to a massive loss of trust
in diesel vehicles in general. As a result, several automotive manufacturers have announced
plans to focus on electric mobility rather than combustion engines even sooner than initially
planned. Discussions are also being held at the regulatory level, e.g. regarding diesel bans in
various European cities, and the ambitious annually increasing electric car quota that China
is implementing in 2019. The impact of this and other political regulations on automotive
mobility cannot yet be estimated.
MA 20 Energy Report of the City of ViennaDevelopments at EU level
The “Winter Package”: “Clean energy for all Europeans”
At the start of December 2016, the European Commission presented an over 1000-page draft
package of measures, the so-called “Winter Package”. It contains several proposals for new
Directives, amendments to existing legislation, and working plans, and is aimed at ensuring
17
progress in all five dimensions of the energy union (decarbonisation, energy efficiency, energy
market, energy security, and research, innovation and competitiveness). The plan is to reach
an agreement on the Commission’s proposals no later than the second half of 2018, which
coincides with the Austrian Presidency.
The Commission’s proposals include goals for 2030 and measures for more energy efficiency,
renewable energy, buildings, effort sharing, etc. In particular, they include the following:
• Energy efficiency: Proposal for a revised Energy Efficiency Directive, proposal for a revised
Energy Performance of Buildings Directive, new proposals for energy efficiency of products
(Ecodesign Directive); Smart Finance for Smart Buildings initiative
• Renewable energy: Proposal for a recast of the EU Renewable Energy Directive including
bioenergy
• Electricity market design Proposal for a recast of the Internal Electricity Market Directive
and the Internal Electricity Market Regulation, proposal for a new Regulation on supply
security, proposal for a recast of the ACER Regulation, final report on the Sector Inquiry on
Capacity Mechanisms by DG Competition
• Governance: proposal for a Regulation on Governance of the Energy Union for climate
protection and energy
The proposal on the governance mechanism is of particular interest. It obliges the member
states to draw up a plan with a number of objectives (e.g. for carbon dioxide reduction, more
renewables, energy efficiency) and report implementation progress to the Commission at
regular intervals. These plans are intended to ensure that the Union-wide target of at least
40% reduction in economy-wide greenhouse gas emissions by 2030 is reached, which the EU
committed to as a contribution to the Paris climate agreement.
Agreement on reduction of EU emissions trading 2021-2030
The EU Emissions Trading System (EU ETS) is an EU climate policy instrument with the aim
to reduce greenhouse gas emissions at the lowest possible cost to the national economies.
Currently, the EU ETS limits the CO2 emissions of some 11,000 power stations, factories and
other plants in several sectors of industry. The system currently covers approx. 45% of GHG
emissions originating in the EU. The basis of the system is that the companies included have
to buy a tradeable certificate for each tonne of CO2 they emit, and only a limited number of
new certificates are issued each year. This number is being reduced by 1.74% annually until
2020.
In February 2017, the EU Parliament agreed to reduce the number of certificates by 2.2%
annually between 2021 and 2030. It remains to be seen whether this will raise the price of
certificates, which have been at only €5 per tonne for years. The price of certificates will be a
factor in whether e.g. highly efficient gas cogeneration plants can compete against coal-fired
power plants on the European electricity market.
Energy Report of the City of Vienna MA 20CHAPTER 1
Introduction and findings
Developments at the national level
Key legislation and strategies at a standstill
Despite long discussions, the federal government was not able to adopt or even submit the
planned “Integrated Energy and Climate Strategy” before the (early) end of the legislative
term. It was supposed to define Austria’s quantitative goals until 2030 (ideally until 2050) in
the areas of energy efficiency, renewables, and carbon dioxide (cf. EU Winter Package above)
and with what tools they would be reached.
There were also no notable improvements in the implementation of the Energy Efficiency Act
18
in the year under review. Due to a large number of generous regulations for individual mea-
sures (e.g. recognition of fuel additives or the sending of free flow restrictors to consumers
as efficiency measures), the market for energy efficiency certificates remains oversupplied.
The amendments for stricter calculation methods have not yet had any effect. As a result, the
price for energy efficiency certificates is at nearly 0 cent per kWh, providing no incentive for
real energy efficiency measures.
Green Electricity Amendment
In the last session of the legislative period, the green electricity amendment was adopted
unanimously by the National Council on 29 June (and the Federal Council on 5 July). The
amendment includes changes to the Green Electricity Act, the Electricity Industry and Orga-
nisation Act (EIWOG), the Natural Gas Act, and the Energy Control Act, as well as some minor
changes to the CHP Points Act. In the next years, funds will be freed up from the budget to,
e.g., reduce waiting times for approved installation for wind power, PV and storage, biogas, and
small hydropower. The “Green Electricity Amendment” is expected to trigger investments of
over half a billion Euro, increase the share of renewables in electricity generation in Austria by
approx. one percentage point, and make it possible for residents of multi-family homes to use
electricity generation installations (e.g. PV) communally.
MA 20 Energy Report of the City of Vienna1.4 MUNICIPAL DEPARTMENT 20 –
ENERGY PLANNING:
SHAPING VIENNA'S ENERGY FUTURE
Projects implemented in the field of energy between 1 July 2016 and 30 June 2017.
Strategies
19
New strategies – new challenges – new objectives
Energy Framework Strategy for Vienna
The government manifesto for the second term of Vienna’s coalition government of Social
Democrats and Greens includes the development of an Energy Framework Strategy for
Vienna. This Energy Framework Strategy has been developed and will, after final adaptations,
likely be presented to the Vienna City Council in late 2017.
Development and finalisation of an SEP successor programme (“SEP 2030”)
Consistently increasing energy efficiency is an important component of a sustainable energy
policy. Therefore, a successor, nicknamed “SEP 2030”, was developed for the Urban Energy
Efficiency Programme SEP, and was mostly completed in 2017. The programme is being
developed with the assistance of the Energy Center Wien (ECW). When it will be presented to
the City Council depends on the adoption of the Vienna Energy Framework Strategy.
Strategic concept on spatial energy planning
The strategic concept on spatial energy planning, whose development began in December
2016, is now in the final development phase. The strategic concept is being developed to meet
the goals of the Urban Development Plan 2025 (STEP 2025). The objectives set out in STEP
2025 and the Energy Framework Strategy provide the context for spatial energy planning in
Vienna.
The strategic concept defines the position and goals of the City of Vienna with regard to
spatial energy planning and determines the necessary steps for establishing spatial energy
planning in Vienna. It describes four main areas of action, which are each divided into several
bundles of measures. It will be presented to the City Council in early 2018.
Energy Report of the City of Vienna MA 20CHAPTER 1
Introduction and findings
Ideas for a smart city
“European Heat Pump City of the Year” Award
At the DecarbHeat conference in Brussels on 11 and 12 May 2017, the City of Vienna was
presented the “European Heat Pump City of the Year” award by Celine Fremault, Minister of
Housing, Quality of Life, Environment and Energy for the Brussels-Capital Region.
Vienna’s entry, which presented the main initiatives for promoting heat pumps, won over
projects from Trondheim (Norway) and Berlin (Germany). The projects included in Vienna’s
entry were the development and management of the city’s subsidies for heat pumps as well
20
as the integration of energy maps into the online city map to show potential for near-surface
geothermal energy in the city.
Data and research
Energy options study in Donaufeld
A novel method for assessing energy supply options in new urban development areas
was developed for the urban development area Donaufeld. A project advisory committee
consisting of representatives of Municipal Departments 20 and 25, housing fund Wohnfonds
Wien and energy supplier Wien Energie agreed on the basic approach and input parameters.
This method will be used for other urban development areas in the future.
The final report is available on the homepage of Municipal Department 20.
https://www.wien.gv.at/stadtentwicklung/energie/pdf/energieversorgung-donaufeld.pdf
Report on “Legal aspects of spatial energy planning”
As preparation for the implementation of new energy supply options, the legal aspects of their
integration into existing planning tools were studied. The study focused on identifying existing
obstacles and determining the legal scope of action. It also contains recommendations for the
adaptation of existing legal instruments. The report is available online at:
https://www.wien.gv.at/kontakte/ma20/publikationen/index.html#studien
Study of waste heat potential in Vienna
Municipal Department 20 supported a study of the AIT Energy Department, which gathered
data on the main potential sources of waste heat from commercial enterprises in Vienna and
assessed the volume of waste heat. The companies were selected depending on their sector,
number of employees, and size. Based on this, their potentials for waste heat were calculated
and localised on the map. The next step will be to make this information publicly available as
part of the energy potential maps, aggregated to statistical grids (250x250m).
Concrete core activation: local supply
In 2016, a cooperation project headed by TU Vienna was launched, which develops
assessment methods for the use of thermal component activation. The findings of the
project, which will be used to develop standards, will hopefully increase our understanding
of efficiency and energy supply of buildings. Due to its thermal characteristics and inertia,
concrete core activation is a good way to store and use fluctuating energy volumes generated
by renewables. Concrete core activation can also be used as storage to reduce the load on the
electric grid.
MA 20 Energy Report of the City of ViennaEnergy potential study for rivers
Municipal Department 20 commissioned the Geological Survey of Austria (GBA) with studying
the thermal potential of rivers and brooks in Vienna and to determine areas suited for thermal
use with heat pumps.
The streams in the Vienna Woods were found to be unsuited for thermal use, with the possible
exception of the Wien and Liesing rivers. The next step will be to verify these findings with
discharge and temperature data. The thermal use of watercourses in Vienna is, therefore,
mainly possible along the Danube Canal and the Danube. The results will be available in late
2017.
21
Storage systems in Germany
If fossil energy vectors are to be replaced by renewables, solar and wind energy are particularly
suited where they are available in sufficient amounts. As these energy sources are very
volatile, it is a major challenge to reconcile the fluctuating supply and the energy demand.
Methods for providing more flexibility are needed – for example energy storage.
Municipal Department 20 commissioned a literature review on the status quo (as at end of
2016) of energy storage in Germany. The central question was how recently initiated energy
storage activities in Germany have developed. The study focused on sources available online
as well as expert newsletters and print products. The perspective of municipalities and
municipal energy suppliers was of particular interest.
The results can be found on the homepage of Municipal Department 20 at:
https://www.wien.gv.at/stadtentwicklung/energie/pdf/energiespeicherung-deutschland.pdf
Awareness building measures
Interest in energy and climate protection is growing. More and more people, for
example, want to know about heat pumps, passive houses, or installing their own
photovoltaic system. The demand for more information and practical advice
regarding energy is growing. Municipal Department 20 addresses this demand with
a number of specific activities:
“Energy!ahead Vienna”: energy showcase project app
A newly developed app presents energy showcase projects from Vienna. The projects are
illustrated with attractive pictures and a description of the main energy indicators. The app
provides users a fun way to gain interesting information about buildings and projects in
Vienna. Some information is only unlocked when you are at the location of the building. The
map view provides an overview of the location of the showcase projects.
Energy literacy app
As part of the implementation of the energy literacy certificate “energie-führerschein” in
the Vienna City Administration, a training app was developed. It is intended as additional
motivation for young people attending the “energie-führerschein” course to think about
saving energy in their spare time and to prepare them better for their certification exam.
https://www.wien.gv.at/stadtentwicklung/energie/rette-deine-insel.html
Energy Report of the City of Vienna MA 20CHAPTER 1
Introduction and findings
Geothermal energy handbook
The handbook provides information on different ways of using near-surface geothermal
energy for forward-looking projects. The systems presented in the publication can be used in
single-family homes and in large residential and commercial buildings alike. It is intended to
help users decide on suitable heating and cooling systems that use the soil as a source of heat
or cold. The guide is available on the homepage of Municipal Department 20:
https://www.wien.gv.at/stadtentwicklung/energie/pdf/leitfaden-erdwaerme.pdf
Dialogue forum
The forum “Wiener Energie Impulse” is intended as a point of communication that bridges
22
business, industry, politicians and multipliers in the neighbourhood. It is an interdisciplinary
gathering for a fact-based exchange of experiences and ideas. The exciting format and
communication possibilities promote dialogue between stakeholders in the fields of energy
industry, forward-looking housing and working, mobility and logistics, public participation and
new media. The four events in this series were dedicated to different topics, and provided an
opportunity for discussion of their opportunities and challenges.
Plus magazine
Plus magazine presents innovative technologies and achievements in energy supply and
use. It discusses current energy issues in Vienna and other urban areas, presents showcase
projects, and prints interviews with pioneers who provide innovative energy solutions. The
latest issues focused on innovative storage technologies and energy flows in buildings.
https://www.wien.gv.at/stadtentwicklung/energie/plus.html
MA 20 Energy Report of the City of ViennaEU projects
Smarter Together
In February 2016, Vienna, together with Munich and Lyon, launched a large-scale EU project,
where the cities will develop new strategies for comprehensive urban renewal. In addition to
the refurbishment of buildings, it also includes modern mobility and energy supply solutions,
including changes to heating systems. Smarter Together, which is managed by Municipal
Department 25, addresses all of these topics and aims to bring new ideas to Vienna and
demonstrate them in Vienna’s 11th district, Simmering. Three housing estates will we
refurbished and a school gymnasium will be replaced with a zero-energy facility. This area will
23
also have the first “mobility points”, i.e. locations that connect different modes of mobility.
Municipal Department 20 is in charge of the working package “Integrative infrastructure and
services”, which addresses energy supply questions, an IT platform, and the development of a
piece of urban furniture that provides electricity. The project runs until the start of 2019, and
will be followed by a two-year monitoring phase.
Urban Learning
In the EU Horizon 2020 project URBAN LEARNING (2015-2017), eight European capitals or
major cities faced challenges together, such as reconciling their considerable population
growth with ambitious goals for reducing fossil energy and CO2 emissions. Vienna, Berlin,
Paris, Stockholm, Amsterdam / Zaanstad, Warsaw and Zagreb aimed to improve the
institutional capacity of local authorities for integrated urban energy planning.
The focus was on urban planning processes and related tools, such as zoning plans, concepts,
and contracts. Each partner city developed a proposal for the integration of energy into the
planning process for urban development areas and the appropriate framework conditions.
They also studied existing tools and technological solutions for neighbourhoods. To this end,
each city installed local working groups consisting of experts from different departments and
external stakeholders, such as energy suppliers. The aggregated results are available at
http://www.urbanlearning.eu/learn-and-exchange/deliverables/.
The cities shared and discussed their findings and questions with others. Vienna fosters an
ongoing exchange with the cities of Salzburg and Graz. The working groups will continue to
develop and implement the suggestions after the conclusion of the project.
In Vienna, the project directly supports the development of the strategic concept on spatial
energy planning as part of STEP 2025, it allows a more in-depth discussion of certain issues,
and shares international experiences from various cities. The project is coordinated by the
Energy Center Wien, and Municipal Department 20 is Vienna’s contact for the project.
The closing conference will be held in Vienna on 17 October 2017.
Further information available at: www.urbanlearning.eu
Energy Report of the City of Vienna MA 20CHAPTER 1
Introduction and findings
1.5 ENERGY – FROM GENERATION TO USE
a. An overview of the main concepts
AMBIENT HEAT …refers to heat found in the environment that is used for energy
generation, such as near-surface and deep geothermal energy and
solar heat.
24
BIOGENIC FUELS …includes the organic part of domestic waste, wood pellets, wood
briquettes, wood chippings, charcoal, waste liquor, landfill gas,
sewer gas, biogas, bioethanol, and biodiesel.
BLI BUNDESLÄNDER ...is a survey conducted by the Environment Agency Austria to
LUFTSCHADSTOFF analyse the development of greenhouse gases and selected air
INVENTUR pollutants in Austria’s federal provinces.
CLIMATE- …corrects the differences between years caused by varying
CORRECTED DATA weather conditions. As a result, the energy consumption for
different years is shown as it would have been had the weather
been the same.
CO2 EQUIVALENT …makes it possible to compare different greenhouse gases.
Carbon dioxide is a gas generated in all combustion processes.
There are also other greenhouse gases, such as methane or
nitrous oxide. These different types of gases do not all contribute
equally to the greenhouse effect. For example, methane has 21
times the climate impact of carbon dioxide, so it is referred to as
having a CO2 equivalent of 21.
COMBINED HEAT …is the cogeneration of electrical energy and heat, for example in a
AND POWER (CHP) heating plant.
COMBUSTIBLE …includes industrial waste and the non-renewable share of
WASTE domestic waste.
CONVERSION …refers to the energy that is lost during the conversion of primary
LOSSES energy to secondary or useful energy.
ECOBUSINESSPLAN …is the environmental service package of the City of Vienna for
VIENNA enterprises. It includes professional advice and consulting, support
with the practical implementation of measures, legal certainty, and
effective PR.
EMIKAT.AT ...is a data management system of the Austrian Institute of
Technology (AIT) that provides an emissions inventory based on
emitters.
ENERGY FLOW …is a chart depicting the energy flows within a given system, such
CHART as the City of Vienna, in one year.
MA 20 Energy Report of the City of ViennaFINAL ENERGY …is the energy available to end users, e.g. in the form of electricity,
district heating, petrol, diesel, wood pellets or natural gas. They
can use this energy directly or transform it further.
FROST DAY …is a day on which the minimum temperature goes below 0°C.
GROSS FINAL …is the energy available after conversion but before distribution to
ENERGY end users. It is used to calculate the share of renewables at EU level
CONSUMPTION (cf. Directive 2009/28/EC).
25
GROSS INLAND …is the energy available in the city. It is the difference between
ENERGY CON- imported and exported energy (net imports) and the energy
SUMPTION (GIEC) generated in the city itself.
HEATING DEGREE …are based on an indoor temperature of 20°C and a base
DAYS temperature (exterior temperature at which the building is heated)
of 12°C. This is designated as HGT20/12. This is the sum of the
differences between indoor temperature and mean outdoor
temperature for all heating degree days over one year and is
indicated in Kelvin x days (Kd).
HEATING PLANT …is an installation for the centralised generation of heat for water
and space heating or for use in industrial processes.
HOT DAY …is a day on which the maximum temperature is at least 30°C.
HYBRID PRO- …is a propulsion system or vehicle that uses a combination
PULSION/HYBRID of different technologies. In this report, the term is used for
CAR propulsion systems that combine petrol and electricity or diesel
and electricity.
ICE DAY …is a day on which the maximum temperature is below 0°C.
KILOWATT PEAK …is the peak power of a solar module under strictly defined
(KWP) standardised test conditions.
KLIP …is Vienna’s climate protection programme.
KLIP BALANCE …is the basis for all calculations in Vienna’s climate protection
METHOD programme (KliP). It is the result of BLI minus emissions trade
and minus traffic emissions that cannot be attributed to Vienna.
The vehicle emissions that cannot be attributed to Vienna are the
difference between the emissions caused by traffic in BLI and the
Austrian emissions inventory emikat.at.
OTHER TYPE OF … in this report, refers to propulsion systems that use liquid gas or
PROPULSION hydrogen (fuel cells) as well as hybrid systems that combine petrol
and liquid gas or petrol and natural gas.
Energy Report of the City of Vienna MA 20CHAPTER 1
Introduction and findings
PRIMARY ENERGY …is the energy form or energy source in its initial state. This may
be a fuel (e.g. coal, wood, natural gas, crude oil) or energy from the
sun, wind or ambient heat. Primary energy can usually only be used
after converting it into another form of energy.
PV AREA …this report uses photovoltaic surface area as a unit of energy
measurement to illustrate comparisons. 6.5 m2 of PV area
correspond to 1,000 kWh.
SECONDARY …is the energy that is generated with the conversion of primary
26
ENERGY energy. This may be wood pellets, diesel fuel or electrical energy.
SUMMER DAY …is a day on which the maximum temperature is at least 25°C.
TRANSMISSION …refers to the energy that is lost in transmission from the source,
LOSSES e.g. the power plant, to the final consumer. This includes the
energy consumption of the energy sector, transport losses and
non-energy use.
USEFUL ENERGY …is the energy that is actually used for heating, lighting,
mechanical work, propulsion, etc.
MA 20 Energy Report of the City of Viennab. Ideas for a smart city
How has energy consumption changed in Vienna over the last decades? Are we using more
and more energy?
Gross inland energy consumption Gross inland energy consumption Fig. 1.1
[kWh per capita] [GWh] Energy
30,000 48,000 consumption
(absolute and
per capita) in
25,000 40,000
Vienna by
energy vectors.
27
Sources: Energy
balance 2015 and
20,000 32,000 population data
15,000 24,000
10,000 16,000
5,000 8,000
0 0
1995 2005 2015
Renewables Gas Gross inland energy
District heating Oil consumption (absolute)
Electrical energy Solid energy vectors
Since the post-war period, the energy consumption of Vienna's population has increased
steadily. While in 1995, energy consumption per capita was at approx. 25,000 kWh, it had
risen by 15% to 28,500 kWh by 2005. This marked the peak in Vienna’s energy consumption.
Since 2005, there has been more focus on energy efficiency, resulting in a decrease of energy
consumption per capita by 20% to 23,000 kWh. This reduction is due both to the more
efficient use of energy – absolute consumption went down from approx. 47,000 GWh in 2005
to approx. 41,000 GWh – and to population growth (+10% between 2005 and 2015). The uses
and conversion of energy are described in detail in the section “Energy flow chart of the City of
Vienna”.
How clean or renewable is Vienna’s energy supply today? What big changes have been
made in the last years?
Since 1995, the share of renewables in gross inland energy consumption increased from 2% to
12% or, in absolute figures, from approx. 900 GWh to approx. 4,900 GWh.
There were large changes in the area of hydropower. In 1998, the Freudenau power plant on
the Danube was opened, and between 2001 and 2014, four small hydroelectric plants went on
line. The largest growth in the sector of renewables is in the area of biogenic fuels.
Energy Report of the City of Vienna MA 20CHAPTER 1
Introduction and findings
This increase is nearly exclusively due to the EU Biofuels Directive, which concerns the
blending of biofuels with conventional fuels (diesel, petrol) for motorised traffic. New
technologies such as wind power, photovoltaics and heat pumps have gained a more firm hold
on the market in recent years and have been able to increase their share considerably.
Renewable energy sources [GWh]
Fig. 1.2
Generation
238 49
of renewable
energy in 1,119 1,035
216
28 Vienna
(absolute),
32
1995-2015 181
Source: Energy 347
balance 2015 395
89
3,186
7 1,075
1995 2005 2015
Biogenic fuels Hydropower
Fuel wood Wind and photovoltaics
Ambient heat
How can we best illustrate energy consumption?
Gross inland energy consumption can be illustrated with PV area units. One PV area unit
generates 1,000 kWh of energy and has a size of 6.5 m2.
In order to provide all energy used in Vienna, an area of approx. 269 km2, or 65% of the
city’s total surface, would have to be covered with PV panels. Compared to 2005 – the year
with the highest energy consumption in Vienna – the area required has been reduced by
35 km2, or 12%.
Per capita consumption has been reduced by 37 PV area units in total since 2005. For every
person living in Vienna, 113 PV area units of energy from fossil sources are imported to the
city, the majority of them natural gas (59 PV area units) and oil (48 PV area units). In 2015,
the energy mix had 7 more PV area units per capita from renewables than in 2005. Over the
next decades, we will need to further reduce the number of fossil PV area units by increasing
efficiency or replacing them with renewables.
MA 20 Energy Report of the City of ViennaFig. 1.3
Gross inland energy consumption 2015 in PV area units per capita
Gross
inland energy
Increase in efficiency since 2005
consumption
2015 in PV area
units per capita
Solid energy vectors Oil 29
Gas
Electrical energy
District heating
Renewables
Note: The term "solid energy vector" refers, for the most part, to combustible waste that is converted into
district heating in waste incinerators, as well as a small percentage of coal. District heating here refers to
industrial waste heat from the Schwechat oil refinery outside Vienna, which is imported to the city. The part
of district heating in Vienna that is generated from waste, biomass, ambient heat, or gas, is not visible in
gross inland energy consumption, but is included in final energy consumption.
Energy Report of the City of Vienna MA 20CHAPTER 1
Introduction and findings
c. Energy flow chart of the city of Vienna
How much energy is needed to run a whole city? Where does that energy come from?
14 percent of the energy needed is generated in Vienna itself, mostly from renewable sources.
87 percent of energy comes from the surrounding area, with the fossil energy sources natural
gas and oil making up the majority of imports. Approx. 1.4 percent of energy is exported again;
the rest makes up the gross inland energy consumption.
Fig. 1.4
Energy imports and energy generation
30 Energy
generation and IMPORTS total: 87.2%
energy imports
in Vienna, 2015 10.1%
Electrical energy
32.7%
2.9%
Oil
Renewables
GENERATION total: 14.2%
1.9%
District 9.7% Renewables
heating 4.0% Combustible waste
0.4% Ambient heat
39.5%
Natural gas
EXPORTS total: 1.4%
What enormous energy flows move through the city and where are they used?
The energy flow chart of the City of Vienna1 shows how much energy is required to supply the
city (41,402 GWh), how that energy is transformed and distributed, and where it is finally used.
The chart shows a clear dominance of fossil energy sources (39% natural gas and 32% fuels)
in the city’s energy mix. Over half the natural gas is converted into electricity and district hea-
ting. Fuels and mineral oils (petrol, diesel, and other petroleum products), on the other hand,
are used nearly exclusively by the largest consumption sector, transportation. The energy flow
chart also shows energy losses, which amount to over 20,000 GWh, or 48% of gross inland
energy consumption. These losses occur during different phases of the energy flow, , with
approximately 4,600 GWh lost before arriving at the end user (conversion losses, transport
losses, etc.) and approximately 15,200 GWh losses in end-user consumption.
1
This energy flow chart considers both combustible waste and coal solid energy vectors. A more detailed
differentiation is provided in the following chapters.
MA 20 Energy Report of the City of ViennaNatural gas Electric District Liquid energy Renewable Solid Fuels
Gross inland 16,338 energy heating sources energy sources energy 12,175
4,200 800 1,353 4,846 sources
energy consumption 1,691
41,402 GWh
100% 39% 10% 2% 3% 12% 4% 30%
551
2,779
1,668 0
7,453 8,885
Conversion
Conversion losses - 7.2% 2,997 5,768
5,119
Energy sector consumption,
non-energy use - 3.9% 20 1,103 461 27 2 31
Natural gas Electric District Liquid energy Renewable Solid Fuels
Final energy use energy heating sources energy sources energy
7,434 12,173
by energy source 8,216 6,107 774 2,066 sources
36,792 GWh 22
88.9% 20% 22% 17% 2% 6% 0% 33%
2,839 3,059
208 1,384 30
Energy unit: 552
86
106 kWh = 1 GWh 598
2,967
965
1 GWh = 3.6 TJ
3.6 TJ = 3.6 × 10¹² J
235 136
(Joule)
5,078
3,695
168
10 306 226
490 1,035
942
227
11,536
11
1
Final energy use Private households Productive sector, agriculture Services Traffic and
11,609 3,043 8,805 transport
by sector 13,335
36,792 GWh
88.9% 32% 8% 24% 36%
1,537
1,382
1,872
712
5,430
7,359
13,335
2,378
1,838
949
Space heating Process heat Power and lighting
Final energy use
13,501 5,165 18,126
by end use
36,792 GWh
88.9% 37% 14% 49%
4,057
2,382
1,108
Energy losses
at end users - 36.8% 15,239 11,750
11,119 6,376
Useful energy consumption
21,553
21,553GWh
52.1% Fig. 1.5
Energy flow chart of the City
of Vienna 2015, Source: Wien EnergieCHAPTER 1
Introduction and findings
Fig. 1.6
Energy flow
Energy flow chart 2015 in PV area units per capita
chart 2015 in PV
area units per
capita
Conversion and distribution losses
Energy losses at end users
32
to Vienna
Imported
Useful energy
Generated
in Vienna
This is a simplified illustration of the energy flow chart, with the energy flows converted into
PV surface area. 1 unit of PV area has a size of 6.5 m2 and generates 1,000 kWh energy. In 2015,
each inhabitant of Vienna would have needed 148 PV area units to fuel their lifestyle. Out of
these 148 units, 19 are provided from within Vienna (lower section of the illustration) and 127
have to be imported. Only just over half of these PV area units, 77 in total (shown in yellow)
are consumed as useful energy, the rest are needed to compensate for losses. 16.5 PV area
units are needed for conversion (e.g. biomass to district heating and electrical energy) and the
distribution of energy in the grid (grey). Losses at end users (black) make up 54.5 PV area units.
MA 20 Energy Report of the City of ViennaFig. 1.7
Energy flow in PV area units Energy flow in
PV area units
33
21.
19.
18. 20.
22.
17.
14. 9.
16. 8. 1. 2.
7.
15. 3.
6. 4.
5.
13.
11.
12.
10.
23.
Conversion and distribution losses
Energy losses at end users
Useful energy
Free space
In order to provide all the energy used in Vienna, two thirds of the city’s surface would have
to be covered with PV panels. To compensate for transport losses and conversion losses (e.g.
from converting biomass to district heating and electricity) incurred in 2015, 20 km2 of the city,
or the 5th, 6th 7th and 19th district (shown in grey), would have to be covered with PV panels.
In order to cover the losses at final consumers, nearly 100 km2, or the entirety of districts 4,
16, 18, 20, 21 and 23 (black) would have to be completely covered with PV installations. Even
had there been no energy losses at all in 2015 and had all energy been used directly, we would
still have needed 140 km2 of PV panels, which corresponds to the combined size of the 13th
and 22nd district (yellow).
Energy Report of the City of Vienna MA 20You can also read