PORT OF MELBOURNE TRADE FORECASTS - DETAILED OUTLOOK TO 2022 21 APRIL 2021 - Essential ...
←
→
Page content transcription
If your browser does not render page correctly, please read the page content below
PORT OF MELBOURNE TRADE FORECASTS
                    DETAILED OUTLOOK TO 2022

                              21 APRIL 2021
00
MACROECONOMIC OVERVIEW
The External Environment
•   Global  growthto momentum
      Each section    start with a box has   generally improved, with the growth outlook
                                       slide that
      provides the key points of what’s to come
    becoming brighter in the US. Having experienced the worst of the virus first,
    China is generally ahead of the recovery curve, with industrial activity
    normalising relatively quickly. However, the Eurozone is facing stronger
    headwinds.
•   Vaccine rollouts will determine growth paths for all economies in 2021. Long-
    term, there will be a significant loss of output, but we have revised down the
    extent of economic scarring in some major economies, including China and the
    US.
•   Australian export prices held up over 2020, driven by industrial recovery in
    China. Longer-term, underlying demand for Australian commodities is expected
    to grow.
•   After a sharp depreciation at the start of the COVID-19 episode, the AUD has
    been remarkably strong, currently trading around $US 0.78. We expect only a
    small appreciation over the medium term to $US 0.80.

                                                                                           2   2   2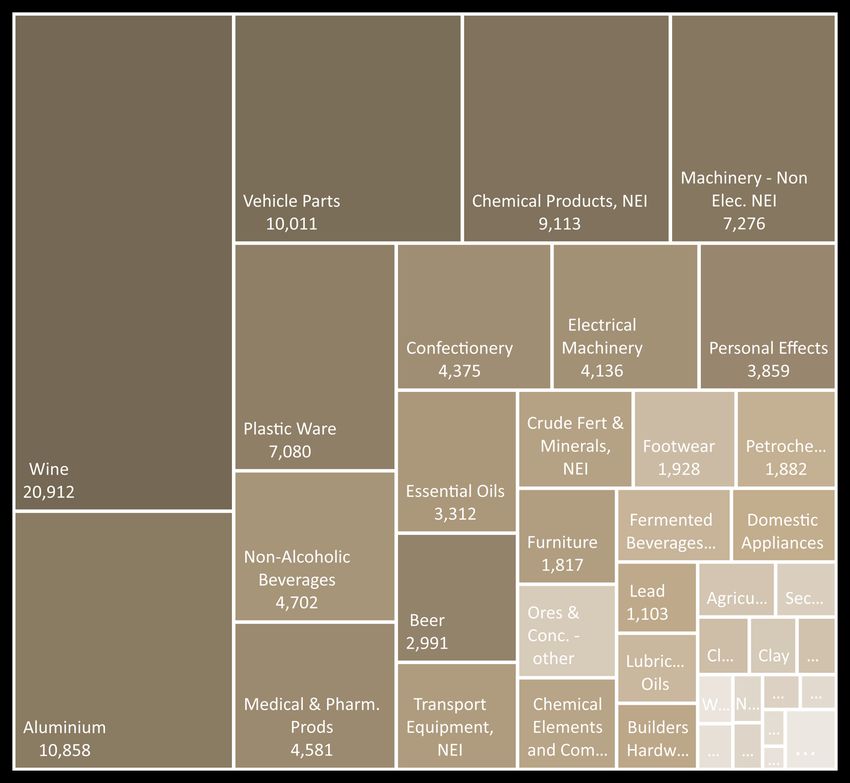
Executive Summary
Near-term outlook                                                                Consumer price inflation remains below the RBA target range: weak wage
                                                                                 growth is limiting cost push inflation, while the housing cycle continues to
The Australian economy’s recovery from the COVID-19 shock has been
                                                                                 drag on core inflation. The RBA board has cut the cash rate to its floor of
swifter than expected. The labour market recovery has outpaced
                                                                                 0.1%; we don not expect a change in the cash rate until 2024.
expectations; the initial shock was contained better than expected, and
employment has improved steadily since. Nevertheless, government income          Trend growth
support to households will be wound back further after Q1, which will provide
a further headwind to discretionary spending. Consumer confidence has            Over the medium term, Australia’s trend growth rate is expected to slow to a
improved with positive news on the vaccine rollout, but the savings rate         little over 2.5%. The fall in trend growth is primarily due to a smaller
remains very elevated, and some pockets of services consumption – mostly         contribution from labour force growth compared to recent history, with the
travel - remain restricted.                                                      Baby Boomer generation now transitioning into retirement. Capital
                                                                                 accumulation is expected to make a steady contribution to trend growth. In
The dwelling investment cycle appears to have turned, with HomeBuilder and
                                                                                 recent years, additions to the capital stock were skewed toward the mining
complementary state grants driving an upturn in activity. Business
                                                                                 industry. But large scale additions in this sector have now been completed.
investment remains disappointing overall; mining investment has slipped a
little, with the outlook for small greenfield projects clouded by uncertainty.   Going forward, investment growth is expected to come from the non-mining
Non-mining investment is also very subdued; the government has put strong        business sector and infrastructure projects. Business investment has been
incentives in place to spur machinery & equipment investment, but with the       subdued while resources were diverted to other parts of the economy. In the
focus for many firms still on survival, and city lockdowns still generating      near- and medium-term, we expect there will be some catch up growth.
uncertainty, the near term outlook is weak. Net exports have held up             Notwithstanding a structural decline in firms’ investment rates, the
relatively well; earlier expansions in mining capacity and strong demand for     composition of investment has been shifting toward intellectual property
steel in China is boosting commodity prices and volumes. Services trade          product investment (which includes research & development). Whether these
remains severely disrupted, although services exports are set to take another    investments are labour-augmenting or labour-saving, they are expected to
leg down in 2021. Import growth will remain subdued, in line with modest         contribute to solid labour productivity growth in the medium term.
domestic demand growth. Government spending remains supportive;
transport infrastructure projects are continuing, while the NDIS rollout and
greater education and health spending are boosting government
consumption.
City-wide lockdowns and interstate travel disruptions will buffet growth until
the vaccine rollout is well underway. These should have a limited impact on
hiring intentions if the lockdown durations remain short, although they are a
headwind to business confidence. The level of output is expected to reach
pre-crisis levels in mid-2021; overall, we expect GDP growth will bounce
back to 2.9% in 2021, improving to 3.2% in 2022.

                                                                                                                           3           3                        3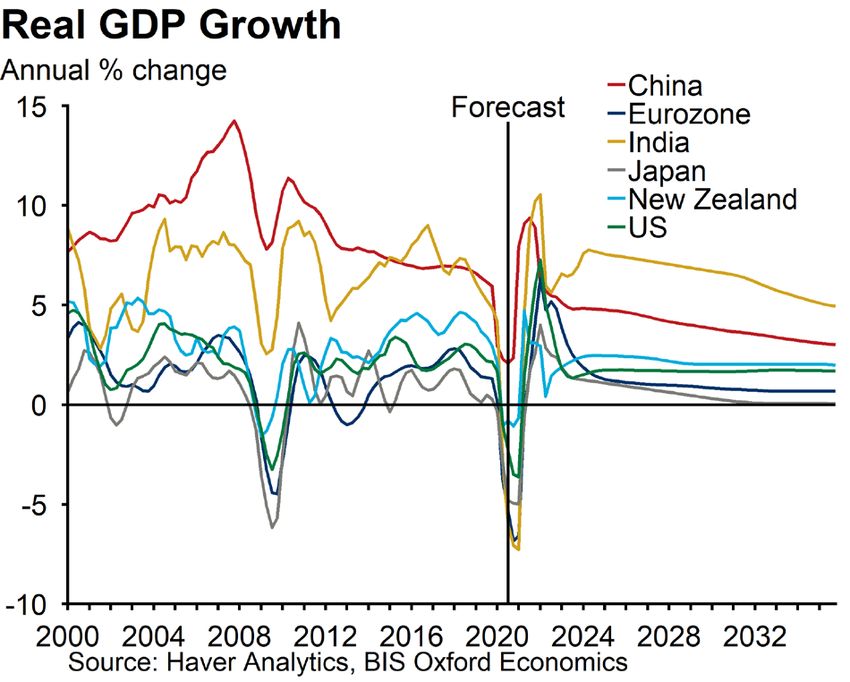
Executive Summary
Outlook for demand                                                               Monetary policy & financial markets

The slowdown in potential output growth will be matched by a slowing in          Monetary policy settings are historically accommodative and will
trend consumption growth over the medium term. The structural decline in         remain so for some time; our expectation is the cash rate target will
the share of goods in consumption will continue, with health and other age-      remain at 0.10% through to 2024, and then the RBA will commence a
related services set to increase their proportion of spending.                   fairly shallow tightening cycle, with rates settling at 2.5% in the long-
                                                                                 run. The RBA has committed to a program of quantitative easing
Resource exports are expected to face steady increases in demand,                through to Q3 2021; this program could be extended and/or ramped up
although with little new capacity coming online, the pace of growth will slow    if additional stimulus is deemed necessary.
through the 2020s. We are expecting weaker trend growth in most advanced
economies due to ageing populations, but growth is expected to be stronger       The 10-year Australian government bond rate remains historically low,
in Australia’s major trading partners. Ongoing improvements in the stock of      although it has drifted higher of late as investor confidence has
economic and social infrastructure in China, India and other emerging            improved. It is expected to gradually trend to its long-run level of 2.8%
markets in Asia will provide support to resource exports, while the transition   in 2028. Australia’s sound economic fundamentals and relatively low
away from nuclear power generation in Japan and South Korea will support         debt levels mean we expect the spread to the US government bond
LNG demand.                                                                      rate will remain tight over the medium term.

Services exports (primarily tourism and education) will become increasingly      The AUD depreciated sharply at the onset of the pandemic against
important over the medium term, as incomes rise in Australia’s neighbouring      both the USD and the broader trade-weighted basket. But since mid-
Asian economies. There was a solid pipeline of investment underway to            2020, the dollar has staged a strong recovery, boosted by the industrial
capture this demand, although it remains to be seen how COVID-19 impacts         recovery in China and higher commodity prices. We expect the AUD to
this.                                                                            gently appreciate against the USD in the medium term as conditions in
                                                                                 Australia improve and growth in the US and other developed
Underpinned by strong export volumes growth and higher commodity prices          economies moderates further.
of late, Australia’s current account position has improved markedly in recent
years. The merchandise trade balance has been in surplus for most of the         Over the medium term, we expect the AUD to settle at around 80 US
past three years, and we expect this to continue in the near term. In the        cents, our estimate of the equilibrium exchange rate. Australia’s
medium term, we expect goods trade to be roughly balanced, and for the           relatively robust growth outlook compared to other developed
current account deficit to be stable at around 2%-3% of GDP.                     economies will support the currency.

The Federal Government’s fiscal position was improving prior to the crisis.
There has been a strong fiscal response to shore up demand, but borrowing
conditions are easy and the Government has been well placed to respond.
Over the medium term, the ageing population will put the fiscal position under
some pressure, as demand for healthcare outstrips revenue growth.

                                                                                                                         4            4                      4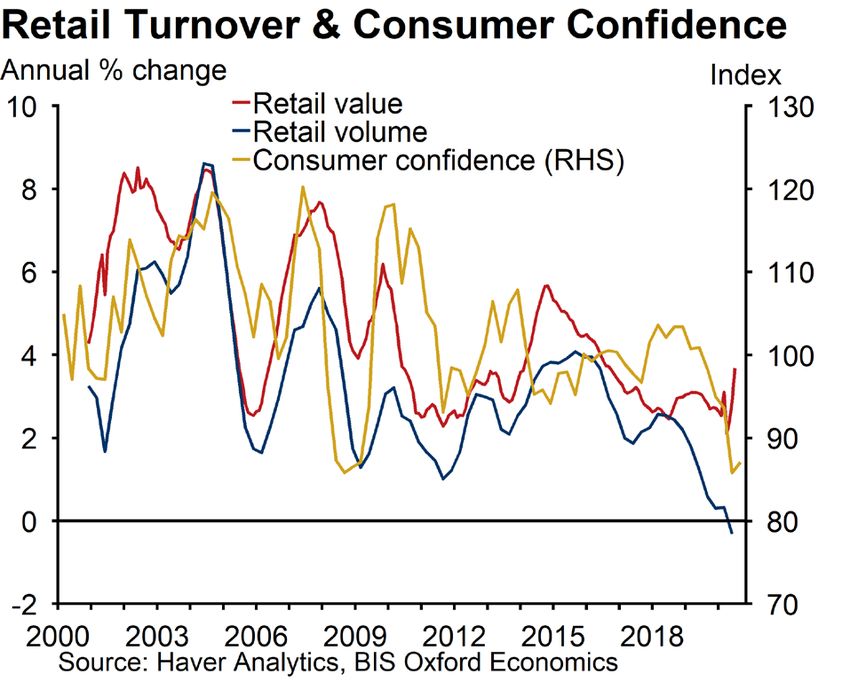
Demand
•   Household incomes have been well supported through the pandemic by fiscal
    policy. But with support programs largely scaled back, the near term will be
    tougher. Income tax cuts will provide some support, but slow wage growth
    remains the strongest headwind for household incomes.
•   Notwithstanding pockets of strength in retail, households remain bearish on the
    spending front. But confidence has improved, which will help lower the savings
    rate, which spiked in Q2 2020 and remains elevated.
•   Dwelling investment continues to fall, but the outlook has been buttressed by
    the HomeBuilder program.
•   Government spending will be elevated throughout the pandemic, but is
    expected to be steady as a share of GDP moving forward.
•   Demand for resource exports has been resilient through the crisis. But there is
    limited new mining capacity to come online in the near term, so export growth
    will slow. But relatively weak domestic demand will weigh on imports, limiting
    the drag next exports will put on GDP growth.

                                                                                      5   5   5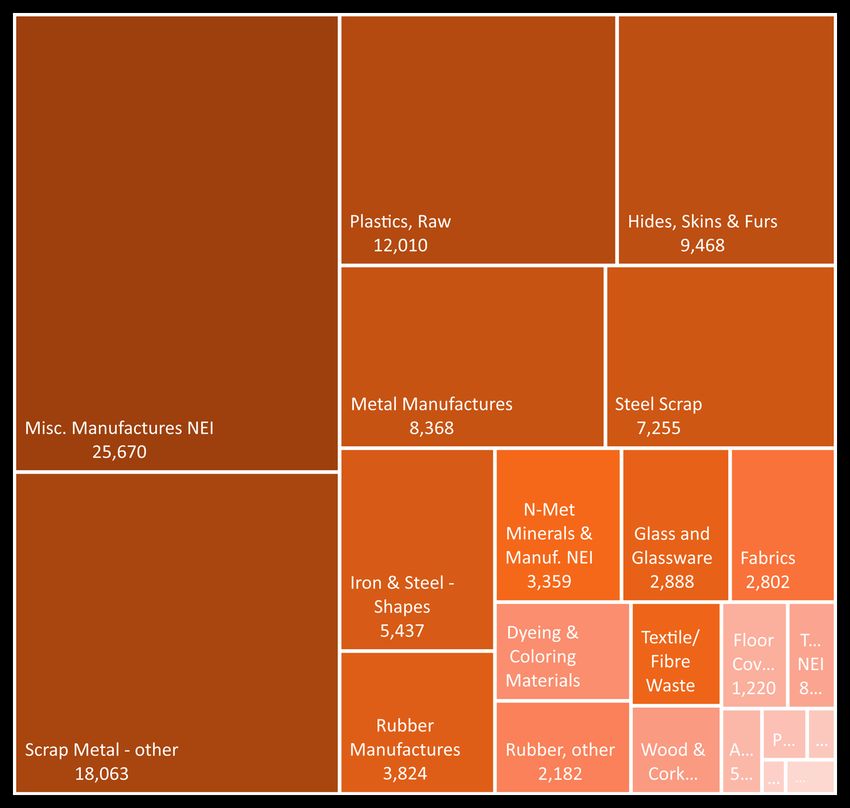
COVID-19 Impacts – Consumption
Household consumption will be the primary channel through which the COVID19 shock hits the
economy. Discretionary spending has suffered the largest falls to date; health concerns,
lockdowns, trading and travel restrictions have curtailed demand and access to many services
related to food, accommodation and recreation. Moreover, the shock to incomes and weak
consumer confidence has and will lead households to defer or cancel planned purchases of
discretionary goods such as motor vehicles, household goods and clothing. Discretionary
spending makes up around 45% of household consumption, and our expectation is that spending
in these areas fell sharply initially and will remain below normal until the health crisis has been
resolved.
The remainder of the consumption basket is made up of essential or core goods (food and medical
items) and services (housing, utilities, medical care and education). There is some upside in the
food and utilities category as people spend more time at home, but by their nature, these
components generally see steady levels of consumption.
Retail trade has been incredibly volatile through the pandemic, with panic buying and lockdowns
leading to the sharpest monthly increases and falls on record. And turnover remains well up on a
year ago. Some of this strength has come through pent-up demand from consumers who are
unable to access services. As a result, there will be a short-term shift in the goods-services
consumption split. There has also been an acceleration of inflation for many goods as retailers
have responded to stronger consumer demand by scaling back discounting activity. But overall,
retail volumes are subdued, meaning the strength in retail trade will not carry over to the GDP
measure of consumption. One exception is household goods, where volumes have grown sharply.
But due to the one-off nature of many of these purchases, we expect spending will return to trend
over the near term.
In the medium term, the fundamentals for consumer spending are very weak. Consumer
confidence is very subdued. And as Federal income support is wound back, household incomes
will come under pressure. The sharp fall in consumption, restrictions on spending, and an element
of caution amongst consumers likely saw the savings rate spike in Q2. These spikes typically
unwind slowly, and this will weigh on consumption over the next few years.

                                                                                                      6   6   6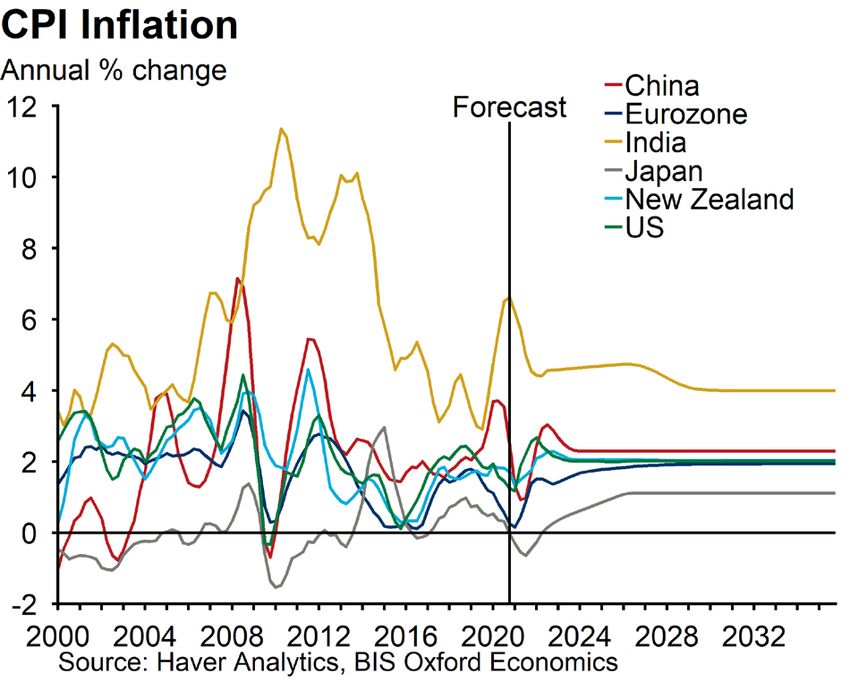
COVID-19 Impacts – Population and migration
The COVID-19 pandemic has caused a significant downgrade to our population forecasts.
International travel has almost ground to a halt. In the very near term there is expected to be a net
migration outflow as there have been more temporary migrants leaving Australia than there have
been Australian citizens returning home. Travel restrictions are expected to be in place for some
time and the repair process will be gradual; net overseas migration is not expected to return to
pre-crisis levels until 2024.
Population growth, in particular net overseas migration, has been a key driver of economic growth
for decades. The removal of this boost will weigh heavily on the pace of potential output growth,
and the recovery in population growth will determine the path for the economy’s supply side.
Population growth has been revised down to 1% in 2020 and just 0.7% in 2021. Accordingly, we
are forecasting a sharp fall in potential output in the near term (albeit a smaller fall than actual
output, resulting in a widening of the output gap). Much of our revision to potential GDP is
attributable to this reassessment of population growth.
The shock to the supply side of the economy is expected to result in a permanent loss of
productive potential, with GDP and many of its components now forecast to be structurally lower.
This is particularly noticeable in our outlook for dwelling investment. In the near term, the COVID-
19 shock will exacerbate the downturn that was already underway; we now expect the cycle to be
deeper and run for longer. But in the medium term, the lower population and less household
formation will lead to a permanently lower level of investment.
While a smaller population pulls down the economy’s productive potential, it also reduces
demand. And simultaneous supply and demand shocks have an ambiguous affect on inflation. In
general, we expect the inflationary pressures from the negative supply shock will be more than
offset by softness in domestic demand. There will be exceptions in some markets, but overall we
expect inflation will be soft in the near term, but our assessment of the long-run or ‘equilibrium’
inflation rate is unchanged.

                                                                                                        7   7   7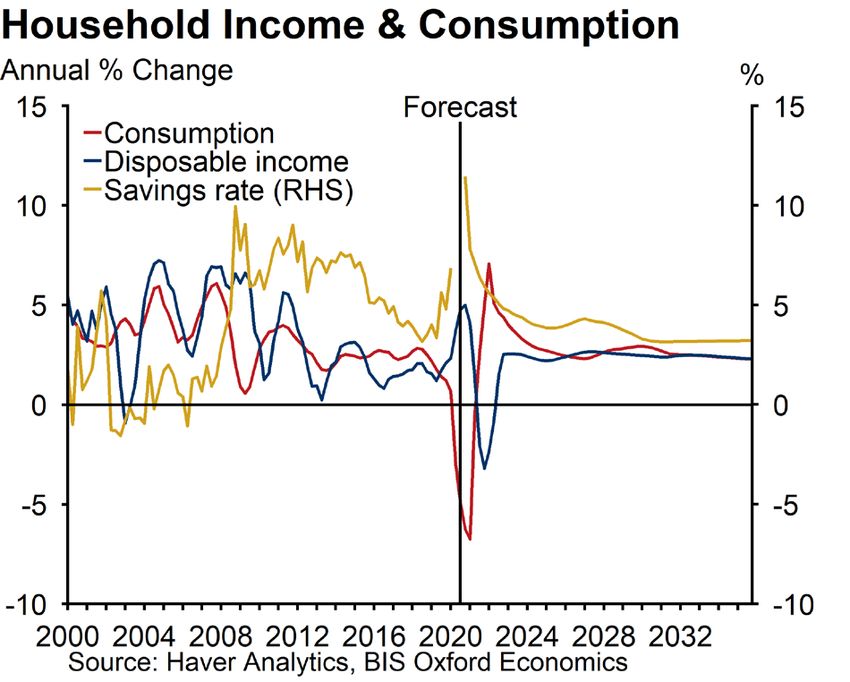
COVID-19 Impacts – Building Industry
Total building is forecast to ease back marginally over FY2021 (-1%) and FY2022          (-2%) to
$109.81 billion. Considerable divergence is anticipated across the major states, with Victoria
taking the biggest step down. This is a stronger outlook than previously forecast, with downside
risk subsiding with an improved trajectory for the economy. Nonetheless, it remains until FY2023
that total building activity is anticipated to return to growth.
It is expected that total residential commencements will lift 11% to 190,300 dwellings in FY2021.
Powered by a fierce response to the HomeBuilder program and other state level incentives, house
approvals reached a record level in Q4 2020. This pull forward of activity is forecast to result in
dwelling starts scaling back 7% to 177,300 in FY2022. The residential property market has gained
considerable momentum in Q1 2021, evident in the return of strong price growth. The core factors
currently underpinning strong housing demand, including record low borrowing costs, elevated
household savings and preference shifts are expected to be sustained, preventing a greater
correction. With the HomeBuilder hangover fading, growth for all build forms is forecast to return in
FY2023.
Supercharged by HomeBuilder, alterations & additions activity is expected to jump 16% to $9.57
billion in FY2021. The pulling forward of activity caused by the incentive is forecast to see activity
normalise to $8.61 billion (-10%) in FY2022. Lead indicators for renovation activity including
turnover and prices are favourable. Continued positive momentum in the property market over
2021 and 2022 is set to prevent a steeper fall.
Total non-residential building is forecast to fall sharply in FY2021 (-18%), then stabilise at $41.94
billion in FY2022 (+7%) in line with improving economic conditions and business confidence. The
pandemic has negatively impacted private investment, especially for retail, accommodation and
offices. Support is anticipated from a sizeable pre-existing major public project pipeline across
schools, defence, prisons and hospitals.
The downward trend in Victoria’s residential construction sector continued in FY2020, with total
starts falling by 6% to 58,487. Ahead of the onset of the pandemic, conditions were improving.
This momentum was halted due to a series of lockdowns, particularly in Melbourne. Dwelling
commencements are forecast to lift 3% in FY2021 to 60,276, with houses driving the improvement
(+17%). Following the weakening of the Melbourne rental market, where the rental vacancy rate
has lifted (5% as at Q4 2020) and unit rents are down (-8% y/y to Q4 2020) apartments are set to
continue contracting (-19%).

                                                                                                         8   8   8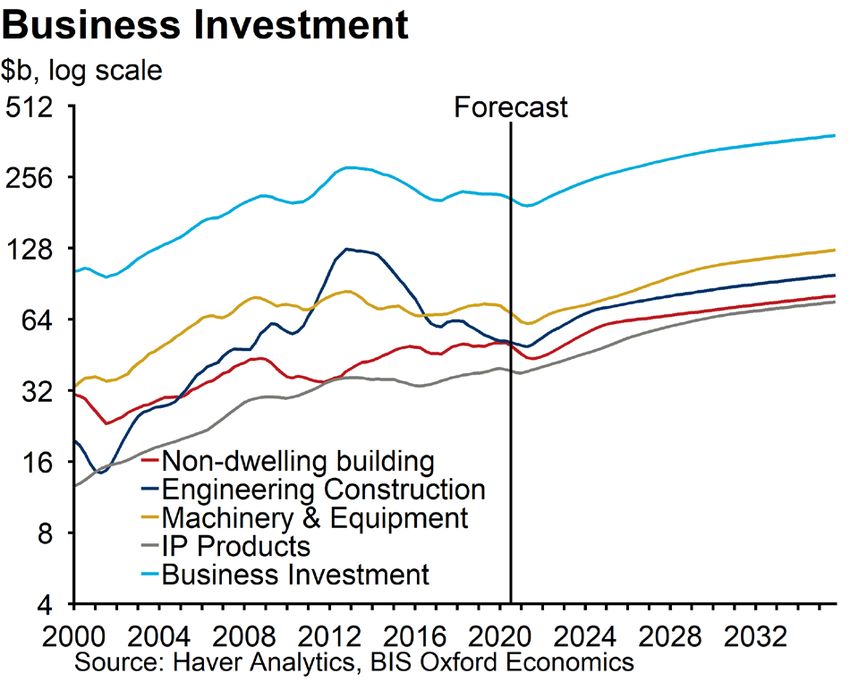
Domestic Productive Capacity
•   Australia’s potential growth rate is set to take a large hit in the near term due
    to COVID-19. Weaker net overseas migration and a sustained period of weak
    investment will result in potential output being lower permanently.
•   Over the medium-term, a falling birth rate and slower net overseas migration
    will weigh on growth in the working age population, while the ageing
    population will begin to put a drag on the participation rate. Against this,
    female labour force participation will continue to rise, which will push the total
    participation rate higher over the next 15 years.
•   Infrastructure spending has risen in recent years, with improvements to the
    transport, communications and electricity networks, which should improve
    productivity in the medium term.
•   Non-mining business investment has disappointed in recent years. Borrowing
    rates are low and strong government incentives are in place, but uncertainty is
    holding expenditure back.
•   Structurally investment rates are declining, and the composition is shifting
    towards intellectual products and away from machinery and equipment.
•   We are expecting an improvement in labour productivity, in part due to
    increased investment in intellectual property products.

                                                                                         9   9   9
Prices
• Inflation has been remarkably volatile over the past year, with government
policies causing large swings in administered prices. Notwithstanding a surge
in demand for retail goods, underlying inflation pressures have been weak, and
will remain so in the near term; we expect core inflation will remain below the
RBA’s target range until late-2023.
• Domestically, labour costs pressures are very weak and are expected to pick
up only very gradually. Lower migration into Australia will weigh on rents,
although the upturn in construction activity will provide some support to non-
tradeables inflation.
• Externally, global inflationary pressures remain subdued. Tradeable goods
inflation is expected to increase in the near term due to supply disruptions, but
this will be transitory.
• With inflation persistently undershooting the RBA’s target, inflation
expectations are edging lower.
• Wage growth is expected to settle a little above 3% in the long-run, resulting in
real wage growth of just under 1%, in line with our modest expectations for
labour productivity growth.
10 10 1001 CONTAINERISED IMPORTS (EXCL. BASS STRAIT)
Recent Trends and Composition
Short-term change in composition can be explained by cycles (AUD/USD, building activity)

Economic cycles                                         Historic Import Volumes by Import Category (per capita)
The strong AUD/USD help boost consumables (both                                         Food                              Other Consumer Gooods                          Capital Goods
food and non-food), including motor vehicle parts,
                                                                                        MV Parts                          Building Materials                             Other Goods
through the mid-2000s, but this unwound as the

                                                                                                   Per capita recession

                                                                                                                                               Global Financial Crisis
dollar returned below its long-run average.                                       160

The increasing share of building materials over the
                                                                                                                                                                                            Peak of
late-2010s reflect the building boom going on in the                              140
                                                                                                                                                                                            Victoria
state, with peaks (in 1999 and 2018) and troughs                                                                                                                                         Building boom
reflecting the peaks of those building cycles.
                                                                                  120
Similarly, boosts in capital goods have reflecting
investment booms (including in solar panels over the    kg / capita (quarterly)
                                                                                  100
last two years).
Echoing these cycles, other intermediate goods
have reflected employment booms and busts (2000,                                   80                                                                                                                    COVID
2009 and 2020 representing the busts), but have also                                                                                                                                                      retail
                                                                                                                                                                                                         boom
declined from first to fourth most common category                                 60
since the early 2010s.
Structurally, growth in motor vehicle parts (mostly                                40
consumables such as tyres and lead acid batteries)
is the weakest as the stock of vehicles only mildly
out-paces population.                                                              20

Both classes of consumables benefit from
increasing import penetration over the long-term, but                               0
other consumer goods outpaces food as retail
turnover per capita grows.

                                                                                                                                                                         12              12
International comparison
The phenomena of generally flat imports per unit of GDP also applies at an individual commodity
group level, with deviations (such as falling other intermediate goods) a common feature amongst
similar countries.
Legend
IC4: Consumer Goods (Non-Food)
Annual imports for select countries ICA: Consumer Goods (Food & Beverages)
IK7: Capital Goods (and Parts)
IOA: Parts for Motor Vehicles
IOJ: Building Materials
IOX: Other Intermediate Goods
13 13Forecast Mass Tonnes of Imports
We use a mix of state and national demographic / industry / macroeconomic drivers to model the
import demand in mass tonnes.
Cyclical & Structural
Import Class Commentary
Drivers
The current import penetration estimated to be at 172kg per capita (across food and beverages). There is
Consumer Goods
• AUD/USD (cyclical) some evidence that the increase in import penetration has coincided with a decline in manufacturing of food
(Food and
• Population (structural) and beverage products up to 2008. Continued import substation is assumed to increase at a linear rate over
Beverages)
the forecast horizon.
• AUD/USD (cyclical) This is a more diverse market. While the decline in manufacturing has coincided with an increase in import
Consumer Goods
• Retail Turnover penetration, this isn’t so clear cut as it is for food and beverages. Furniture in particular experienced
(Non-Food)
(structural) significant offshoring between 1998 and 2008, with the import penetration largely unchanged since.
• Machinery and
Capital Goods Historically, the import volumes (in TEUs) of capital goods (which is mostly Machinery and Equipment)
Equipment
(and Parts) track state expenditure on Machinery and Equipment. We use this as both a cyclical and structural driver.
Expenditure
Dominated by motor vehicle consumables (like tyres and lead acid batteries), stock of vehicles is the
• AUD/USD (cyclical)
Parts for Motor dominant driver. Historically, volumes imported per capita was very dependent upon the exchange rate, but
• Stock of Motor
Vehicles it may no longer be as relevant since the closure of the domestic motor vehicle manufacturing plants and
Vehicles (structural)
shuttering of many supporting industries.
• State building activity
(cyclical) Dwelling and non-dwelling building requires significant volume of containerised imported building materials.
Building Materials
• State final demand Longer term, we use state final demand of the need for goods.
(structural)
• Employment (cyclical) Other intermediate goods are used across the manufacturing and service sectors. Historically, import
Other Intermediate
• State final demand volumes have been highly sensitive to changes in employment (almost 10x) through a cycle, but structurally
Goods
(structural) have grown roughly in line with general economic growth (measured as state final demand for goods).
14 14Forecasting Methodology
Having generated mass tonnes, we undertake further analysis to undertake projections in TEUs.
1 Australian tonnes
Each of the six categories has a cyclical and structural driver which are used over the short/medium
term and long-term forecasts respectively. This is assigned to forecasts of mass tonnes.
Historical calculations of the Port of Melbourne’s market share use the ABS’s definition of the share of
2 Port Tonnes
tonnes for the BoPBEC subset, with confidential ports statistics allocated to individual ports by BISOE.
Forecast tonnes use the Port of Melbourne’s own statistics, and grow in line with the forecast market
share and national tonnes.
3 Port Containerised Tonnes
Cargo is split between containerised and bulk. The forecast for all six major BoPBEC subsets is for the
containerised share to remain unchanged over the forecast horizon.
4
Historical share (by mass tonnes) are cargo in 20s is calculated as a share of total containerised cargo
Containerised 20s vs 40s by cargo type. The shift away from 20s is most pronounced for consumer goods, and least pronounced
(but still material) for intermediate goods. This trend is observed at all east-coast ports.
When evaluated separately for 20s and for 40s at all east-coast container ports, BISOE does not
5 Tonnes per Container
observe a change in the mass per container over time (by BoPBEC subset). This is in sharp contrast to
earlier estimates which examined individual ports in isolation. However, as there is a shift from 20s to
40s in all commodity classes, the average mass per TEU does decline.
15 15History – Consumer Goods (Food & Beverages)
Food & Beverages make up 12% of import TEUs at the Port of Melbourne (and 16% by mass), and
mass per container have remained unchanged since 2005 at 16.2 tonnes
Botany's market share settled in at Until the GFC, imports per capita were 20ft share of containers have been
around 40% for the past 15 years. growing at 7.1% p.a., but only 2.0% after declining by 2.8% p.a. since 2005
Market share MEL/AUS 200 AUD/USD 20 share tonne/container
50% AUS kg/capita (annualised) tonne/TEU Expon. (20 share)
180
AUS kg/capita (pre-GFC) 90% 18.0
45% AUS kg/capita (post-GFC)
160
80% 16.0
40%
140
70% 14.0
35%
120
60% 12.0
30%
100 High AUD/USD overlaps
50% 10.0
25% with periods of above-trend
import volumes.
Sudden increases market 80
40% 8.0
20% share in late 2020 were
related to industrial action
at Port Botany. 60
30% 6.0
15%
40
10% 20% 4.0
Market share is important
for food and beverages
Botany is overweight (I.e. 20
5% 10% 2.0
imports more food than is
consumed in NSW)
0
0% 0% 0.0
Sep-92
Sep-94
Sep-96
Sep-98
Sep-00
Sep-02
Sep-04
Sep-06
Sep-08
Sep-10
Sep-12
Sep-14
Sep-16
Sep-18
Sep-20
Jul-92
Jul-94
Jul-96
Jul-98
Jul-00
Jul-02
Jul-04
Jul-06
Jul-08
Jul-10
Jul-12
Jul-14
Jul-16
Jul-18
Jul-20
16 16History – Other Consumer Goods
Other consumer goods make up 27% of import TEUs at Port of Melbourne (and 15% by mass).
Mass per container have averaged 8.2 tonnes since 2005.
Melbourne's market share settled in at Until the GFC, imports per retail turnover 20ft share of containers have been falling
around 34% for the past 9 years. were growing by 4.7% p.a. (0.1% p.a. after) at an annual rate of 3.4% p.a. (since 2005)
Market share MEL/AUS AUS tonnes / $million (annualised) 20 share tonne/container
60% AUS tonnes / $million (pre-GFC) tonne/TEU Expon. (20 share)
AUS tonnes / $million (post-GFC) 60% 10.0
100
Decline in market share in late Increases in mass tonnes 9.0
50% 2020 is seen as temporary, per dollar spend in recent
due to industrial action at Port 90 quarters reflect the change 50%
Botany in consumption mix post- 8.0
80 COVID, with an increase in
furniture and decline in
40% 7.0
clothing. 40%
70
6.0
60
30%
30% 5.0
50
Post-GFC, stronger
imports per $ spend have 4.0
40 coincided with high
20%
AUD/USD (and vice versa) 20%
30 3.0
Between 1998 and 2008, the volume of furniture
20 2.0
10% imported increased 10-fold, reflecting an offshoring of 10%
that industry and a growing market. There are no
10 further offshoring trends observed since the GFC for 1.0
non-food consumer goods.
0
0% 0% 0.0
Sep-92
Sep-94
Sep-96
Sep-98
Sep-00
Sep-02
Sep-04
Sep-06
Sep-08
Sep-10
Sep-12
Sep-14
Sep-16
Sep-18
Sep-20
Jul-92
Jul-94
Jul-96
Jul-98
Jul-00
Jul-02
Jul-04
Jul-06
Jul-08
Jul-10
Jul-12
Jul-14
Jul-16
Jul-18
Jul-20
17 17History – Motor vehicle parts
Motor vehicle parts make up 5% of import TEUs at Port of Melbourne (and 3% by mass).
Mass per container has trended down, but is assumed to remain FY20 levels (7.9 tonnes).
Melbourne's market share has eased since Until the GFC, imports per capita were 20ft share of containers has been falling
the closure of domestic manufacturing. increasing by 4.6% p.a. by 2.6% p.a. since 2005
Market share MEL/AUS AUD/USD (right hand side) 20 share tonne/container
60% NSW kg per capita (annualised) tonne/TEU Expon. (20 share)
NSW kg per capita (pre-GFC) 40% 12.0
NSW kg per capita (post-GFC)
50% 60 120 35%
Imports per capita have stabilised
following the closure of domestic
motor vehicle manufacturing.
50 100 30%
40%
Imports very exchange 8.0
rate sensitive
25%
40 80
30%
20%
30 60
Victoria has approximately 15%
20% 25% of the vehicle stock, so 4.0
the Port of Melbourne is 20 40
overweight with an average
10%
of 31% of the market share in
10% recent years.
10 20
5%
0 0
0% 0% 0.0
Sep-92
Sep-94
Sep-96
Sep-98
Sep-00
Sep-02
Sep-04
Sep-06
Sep-08
Sep-10
Sep-12
Sep-14
Sep-16
Sep-18
Sep-20
Jul-92
Jul-94
Jul-96
Jul-98
Jul-00
Jul-02
Jul-04
Jul-06
Jul-08
Jul-10
Jul-12
Jul-14
Jul-16
Jul-18
Jul-20
18 18History – Capital Goods & Parts
Capital goods make up 15% of import TEUs at Port of Melbourne (and 9% by mass).
Mass per container have averaged 9 tonnes/container since 2005.
Melbourne's market share has roughly The ratio of imports to expenditure has 20ft share of containers have been
averaged 27% for the past decade. increased with large Solar PV installations. declining by 5.4% p.a.
Market share MEL/AUS AUS tonnes / $million (annualised) 20 share tonne/container
45% AUS tonnes / $million (pre-GFC) tonne/TEU Expon. (20 share)
AUS tonnes / $million (post-GFC) 100% 14.0
40% 80
90%
12.0
35% 70
80%
30% 60 70% 10.0
25% 50 60%
8.0
20% 40 50%
6.0
15% 30 40%
20 30% 4.0
10%
20%
10
5%
2.0
10%
0
0%
Sep-92
Sep-94
Sep-96
Sep-98
Sep-00
Sep-02
Sep-04
Sep-06
Sep-08
Sep-10
Sep-12
Sep-14
Sep-16
Sep-18
Sep-20
Jul-92
Jul-94
Jul-96
Jul-98
Jul-00
Jul-02
Jul-04
Jul-06
Jul-08
Jul-10
Jul-12
Jul-14
Jul-16
Jul-18
Jul-20
0% 0.0
Jul-13 Jul-15 Jul-17 Jul-19
19 19History – Building Materials
Processed Industrial goods make up 18% of import TEUs at Port of Melbourne (and 21% by mass).
Mass per container have averaged 14.9 tonnes/container since 2008.
Melbourne's market share has roughly After the GFC, imports averaged 53 tonnes 20ft share of containers have been
reflected relative building activity per $million in building activity declining by 1.6% p.a.
Market share MEL/AUS AUST tonnes / $million 20 share tonne/container
45% (pre-GFC) tonne/TEU Expon. (20 share)
(post-GFC) 80% 20.0
40% 70
70%
35% 60 16.0
60%
30%
50
50%
25% 12.0
40
40%
20%
30 8.0
30%
15%
20
10% 20%
4.0
10
5% 10%
0
0% 0% 0.0
Sep-92
Sep-94
Sep-96
Sep-98
Sep-00
Sep-02
Sep-04
Sep-06
Sep-08
Sep-10
Sep-12
Sep-14
Sep-16
Sep-18
Sep-20
Jul-92
Jul-94
Jul-96
Jul-98
Jul-00
Jul-02
Jul-04
Jul-06
Jul-08
Jul-10
Jul-12
Jul-14
Jul-16
Jul-18
Jul-20
20 20History – Other Intermediate Goods
Other intermediate goods make up 24% of import TEUs at Port of Melbourne (and 33% by mass).
Mass per container have averaged 16.3 tonnes/container since 2005.
Botany’s share of other intermediate goods The ratio of imports to economic activity 20ft share of containers have been
imports is the lowest of call categories (non-service) continue to decline declining by 1.6% p.a. since 2005
Market share MEL/AUS AUS tonnes / $million (annualised) 20 share tonne/container
45% AUS tonnes / $million (pre-GFC) tonne/TEU Expon. (20 share)
AUS tonnes / $million (post-GFC) 80% 20.0
40% 30
70%
35%
25 16.0
60%
30%
20 50%
25% 12.0
40%
20% 15
8.0
30%
15%
10
10% 20%
4.0
5
5% 10%
0
0% 0% 0.0
Sep-92
Sep-94
Sep-96
Sep-98
Sep-00
Sep-02
Sep-04
Sep-06
Sep-08
Sep-10
Sep-12
Sep-14
Sep-16
Sep-18
Sep-20
Jul-92
Jul-94
Jul-96
Jul-98
Jul-00
Jul-02
Jul-04
Jul-06
Jul-08
Jul-10
Jul-12
Jul-14
Jul-16
Jul-18
Jul-20
21 21Forecasts – Food & Beverages
Food and Beverage imports are expected to continue to outpace population growth, and the shift
from 20s to 40s is projected to add approximately 1.0% to TEU growth p.a.
Forecast TEU growth Per capita import volumes
+ contribution to growth (kg, quarterly) 20ft share of containers
6% 300 100%
Import penetration
5% Population
Container composition 90%
4% Forecast TEU Growth
250
3% 80%
2%
kg / capita (quarterly, annualised)
70%
1% 200
0%
Jun-21 Sep-21 Dec-21 Mar-22 Jun-22 60%
150
50%
Forecast TEU
40%
2,000 100
Thousand TEUs
1,800
1,600 30%
1,400
1,200
1,000 50 20%
800
600
400
10%
200
0 0
0%
Jun-05 Jun-10 Jun-15 Jun-20
22 22Forecasts – Other Consumer Goods
Other consumer goods imports will be negative in the medium term as the shift away from clothing
and footwear to furniture unwinds (declines in the import penetration, i.e. tonnes per $ spend).
Consumption basket will take two years to return to its pre-COVID mix.
Forecast TEU growth Per capita import volumes
+ contribution to growth (kg, quarterly) 20ft share of containers
25% 350 100%
Import penetration
20% Retail Changes in the consumption mix will
Container composition lower tonnes per $ spend as furniture
15% 90%
Forecast TEU Growth imports slow and clothing picks up.
10% 300
5% 80%
0%
-5% 250
kg / capita (quarterly, annualised)
70%
-10%
-15%
Jun-21 Sep-21 Dec-21 Mar-22 Jun-22 200 60%
Forecast TEU 50%
(and Historical Tonnes) 150
40%
2,000 COVID-19
Thousand TEUs
1,800 consumption bump
1,600 100
30%
1,400
1,200
1,000 20%
800 50
600
400
10%
200
0 0
0%
Jun-05 Jun-10 Jun-15 Jun-20
23 23Forecast – Motor vehicle parts
Motor vehicle parts (chiefly lead acid batteries and tyres) are forecast to grow in line with underlying
population growth of Australia.
Forecast TEU growth Per capita import volumes
+ contribution to growth (kg, quarterly) 20ft share of containers
Import penetration
20% 90 100%
Population
15% Container composition
90%
Forecast TEU Growth 80
10%
80%
70
5%
70%
kg / capita (quarterly, annualised)
0% 60
Jun-21 Sep-21 Dec-21 Mar-22 Jun-22
60%
-5%
50
50%
Forecast TEU
(and Historical Tonnes) 40 40%
500
Thousand TEUs
450 30 30%
400
350
300 20%
250 20
200
150 10%
100 10
50
0 0%
Jun-05 Jun-10 Jun-15 Jun-20
0
Jun-93 Jun-98 Jun-03 Jun-08 Jun-13 Jun-18
24 24Forecast – Capital Goods & Parts
Capital goods expenditure is expected to rebound over the coming year following the uncertainty of
2020.
Forecast TEU growth Per capita import volumes
+ contribution to growth (kg, quarterly) 20ft share of containers
20% 160 100%
15% Import
penetration
10% 90%
M&E 140
5%
0%
Container 80%
-5% composition
120
-10%
Forecast TEU
-15% 70%
kg / capita (quarterly, annualised)
Growth
-20%
100
-25% 60%
Jun-21 Sep-21 Dec-21 Mar-22 Jun-22
80 50%
Forecast TEU
(and Historical Tonnes) 40%
60
1,000
Thousand TEUs
900 30%
800
700 40
600 20%
500
400 20
300 10%
200
100
0 0 0%
Jun-05 Jun-10 Jun-15 Jun-20
25 25Forecasts – Building Materials
The building market is forecast to have peaked in 2018 in NSW, but continued shifting from 40s to
20s will support TEU growth of about 2% p.a.
20ft share of containers
Forecast TEU growth Per capita import volumes
+ contribution to growth (kg, quarterly)
Import penetration
15% 500 100%
Building
10% Container composition
450 90%
5% Forecast TEU Growth
0% 400 80%
-5%
350 70%
kg / capita (quarterly, annualised)
-10% Forecast trough in apartment
building in VIC (Dec-22)
-15% 300 60%
Jun-21 Sep-21 Dec-21 Mar-22 Jun-22
250 50%
Forecast TEU
(and Historical Tonnes) 200 40%
4,500
Thousand TEUs
4,000 150 30%
3,500
3,000
2,500 100 20%
2,000
1,500 10%
50
1,000
500
0 0 0%
Jun-05 Jun-10 Jun-15 Jun-20
Per capita import volumes 26 26Forecasts – Other Intermediate Goods
Other intermediate goods are projected to mildly outpace population growth in line with the growth of
the goods economy.
20ft share of containers
Forecast TEU growth Per capita import volumes
+ contribution to growth (kg, quarterly)
Import penetration
10% Demand foir goods 600 100%
8% Container composition
Forecast TEU Growth
6% 90%
4%
2% 500
80%
0%
-2%
-4% 70%
kg / capita (quarterly, annualised)
400
-6%
-8% 60%
Jun-21 Sep-21 Dec-21 Mar-22 Jun-22
300 50%
Forecast TEU
(and Historical Tonnes) 40%
6,000 200
Thousand TEUs
30%
5,000
4,000
20%
3,000 100
2,000 10%
1,000
0 0 0%
Jun-05 Jun-10 Jun-15 Jun-20
27 27Near-term outlook to FY22
FY21 is artificially inflated from fundamentals as volumes in the September quarter have been
boosted by industrial action at Port Botany.
Medium-term outlook Forecast Imported Container Volumes by Class
Annual % Change 2016-17 2017-18 2018-19 2019-20 2020-21 2021-22
Almost all import classes are being impacted by
the impacts of COVID-19. Consumption (Food & Beverages) 7.5% 9.1% -2.7% -1.1% 6.4% -0.1%
Consumption (Non-Food) 2.4% 8.8% 4.8% -3.0% 24.6% -7.9%
Consumption (Food & Beverages) is escaping
unscathed. Capital Goods (& Parts) 3.4% 16.0% -0.4% -8.9% 22.1% -14.5%
Parts for Transport Equipment -4.7% -8.3% 1.0% -4.0% 8.0% -2.5%
Consumption (Non-Food) cannot sustain at
Processed Industrial Supplies 4.9% 12.2% 0.4% -4.3% 7.6% -12.2%
current levels as disposable income will fall back
and furniture’s share of consumption falls back. Other Intermediate Goods 2.3% 5.7% 3.5% -1.6% 2.9% -1.2%
Total Imports (excl. Bass Strait) 3.1% 8.5% 2.0% -3.3% 13.5% -1.7%
Capital Goods are impacted largely by
uncertainty and falling demand. This will be slow Forecast Imported Container Volumes by Class
to recover until COVID-19 is under control.
Parts for Transport Equipment are likely to 400,000
recover quickly in line with vehicle travel.
350,000
Processed Industrial Goods will fall as the 300,000
slowdown in construction activity extends Consumption (Food & Beverages)
additional years. 250,000
Consumption (Non-Food)
TEU
Other Intermediate Goods are impacted by the 200,000
Capital Goods (& Parts)
slowdown in the service sector, working from 150,000 Parts for Transport Equipment
home, and slow downs across manufacturing.
100,000 Processed Industrial Supplies
The sugar from the one-off purchases from
plexiglass screens, cleaning liquids, and 50,000 Other Intermediate Goods
dispensers / thermometers will unwind over 2021.
0
Jun-06
Jun-07
Jun-08
Jun-09
Jun-10
Jun-11
Jun-12
Jun-13
Jun-14
Jun-15
Jun-16
Jun-17
Jun-18
Jun-19
Jun-20
Jun-21
Jun-22
28 2802 CONTAINERISED EXPORTS (EXCL. BASS STRAIT)
Empties and
Overview Imports Exports Bass Strait Bulk Liquid Break Bulk Dry Bulk
Transhipments
Classifications and mapping
Similar to how we mapped containerised imports to a BoPBEC, we categorised each of the Port of
Melbourne exports into a sets with common drivers
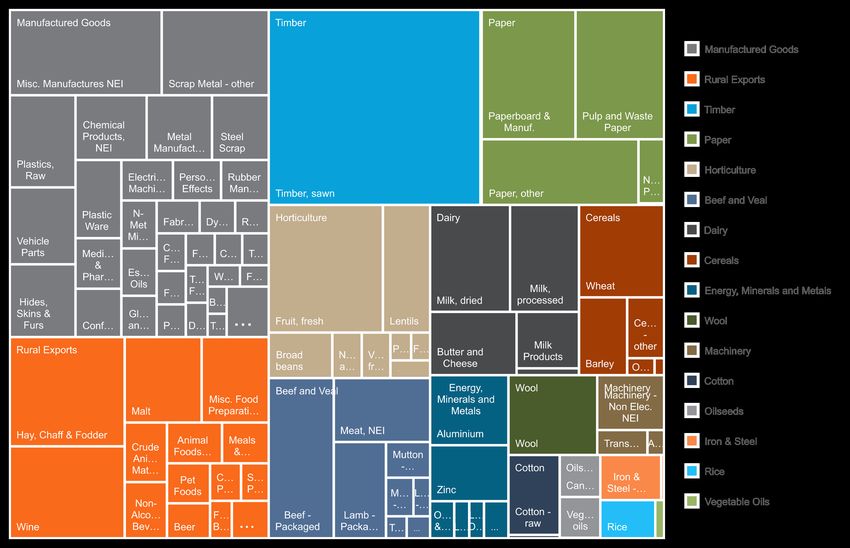
Key Drivers FY20 Full exports by Category (TEUs)
Sixteen different series are forecast for exports,
which are broadly grouped into five broad
categories:
1. Agriculture
≈ Horticulture
≈ Dairy
≈ Beef and Veal
≈ Cereals
≈ Wool
≈ Oilseeds
≈ Cotton
≈ Rice
≈ Vegetable Oils
2. Manufacturing
3. Other
≈ Energy, Minerals and Metals
≈ Rural Exports
≈ Machinery
≈ Iron & Steel
4. Paper
5. Timber
30 30Empties and
Overview Imports Exports Bass Strait Bulk Liquid Break Bulk Dry Bulk
Transhipments
Near-term outlook
The agricultural outlook has shifted in 2020 as not only has the drought broke in NSW, but the
Bureau of Meteorology has announced the commencement of a La Niña event.
ABARES’s crop report is for a stronger winter crop La Niña event announced by BOM in late September
Below average rainfall during winter is not expected to have substantially The Bureau of Meteorology has declared that La Niña has developed in the
reduced crop prospects in Victoria. Above average levels of lower layer soil Pacific Ocean, upgrading from a La Niña ALERT status to an active event.
moisture present at the beginning of winter are expected to have sustained This means that recent changes in ocean temperatures and weather
crops. In addition, timely August rainfall in western districts was sufficient to patterns over the Pacific are now likely to remain until at least the end of the
support crops in average to above average condition at the beginning of year.
spring. Root zone soil moisture in August was below average in south
western cropping regions. Sufficient and timely spring rainfall will be La Niña is the cool phase of the El Niño Southern Oscillation. It is
especially important in these regions to support grain formation. associated with cooler than average sea surface temperatures (SSTs) in the
central and eastern tropical Pacific Ocean.
Spring rainfall is likely to be above average in most cropping regions in
Victoria, according to thelatest three-month rainfall outlook (September to
La Niña events often form in autumn or winter, then decay in late summer.
November) issued by the Bureau of Meteorology on 3 September 2020.
The greatest impact normally occurs during the spring and early summer
September and October rainfall is expected to be average to above average period. La Niña events normally last for around a year, however they can be
in most cropping regions, supporting yield prospects. Yields are expected to shorter, or much longer.
be above average in most regions.
Recent observations and model forecasts show the central tropical Pacific
Winter crop production in Victoria is forecast to increase by 6% in 2020–21
Ocean is now 0.8°C cooler than normal, and that has resulted in changes to
to around 7.9 million tonnes. This mostly reflects an expected increase in
Trade Winds and pressure patterns. Climate models suggest these patterns
yields, driven by favourable seasonal conditions in autumn and the
will continue until at least the end of the year.
favourable spring outlook. The forecast increase in production also reflects
an estimated 8% increase in planted area to 3.4 million hectares in 2020–
La Niña typically results in above-average spring rainfall for Australia,
21, as a result of favourable seasonal conditions in autumn, particularly in
particularly across eastern, central and northern regions. It can also mean
marginal cropping regions. Significant area of wheat and barley crops is not
cooler days, more tropical cyclones, and an earlier onset of the first rains of
expected to be cut for hay and fodder because of the favourable seasonal
the wet season across the north.
conditions expected during spring and low hay prices.
The last La Niña event occurred from 2010-2012 and resulted in one of
Australia’s wettest two-year periods on record. Widespread flooding
occurred in many parts of Australia associated with the record rainfalls.
31 31Empties and
Overview Imports Exports Bass Strait Bulk Liquid Break Bulk Dry Bulk
Transhipments
Agricultural Seeds
Agricultural seeds (wheat and barley) are modelled on the basis of the Victorian harvest and the
historical tendency to export via bulk and container terminals at the Port of Melbourne. Note that
bulk is more common following strong harvests, and is more seasonal.
Victoria Wheat Production and Port of Melbourne Exports
4.80 400
(Thousand tonnes)
Annual Production
4.20
Monthly Exports
(Million tonnes)
3.60 300
3.00
2.40 200
1.80
1.20 100
0.60
0.00 0
Vic Production Melbourne (container) Melbourne (bulk) Melbourne (container forecast) Melbourne (bulk forecast)
Victoria Barley Production and Port of Melbourne Exports
3.00 250
(Thousand tonnes)
Annual Production
Monthly Exports
(Million tonnes)
2.40 200
1.80 150
1.20 100
0.60 50
0.00 0
Vic Production Melbourne (container) Melbourne (bulk) Melbourne (forecast)
32 32Empties and
Overview Imports Exports Bass Strait Bulk Liquid Break Bulk Dry Bulk
Transhipments
Agricultural Exports – Composition
As the drought breaks, a return to record export TEUs is not out of the question, but will take until
FY22 to materialise as a lag of Victorian and NSW wheat, barley, hay, cotton and rice harvests,
which are currently only half of their 120,000 TEU potential.
FY20 Agricultural goods - TEUs Historical volumes (TEUs)
400,000
Meals & Flours
350,000 Oil Seeds, Nuts, Kernels
Cereals - other
Vegetables, processed
300,000
Milk Products
Lamb - Packaged
250,000 Malt
Milk, processed
Butter and Cheese
200,000
Rice
Barley
150,000 Misc. Food Preparations
Cotton - raw
Meat, NEI
100,000
Beef - Packaged
Wool
50,000 Milk, dried
Hay, Chaff & Fodder
Fruit, fresh
0
Wheat
Dec-06
Dec-07
Dec-08
Dec-09
Dec-10
Dec-11
Dec-12
Dec-13
Dec-14
Dec-15
Dec-16
Dec-17
Dec-18
Dec-19
33 33Empties and
Overview Imports Exports Bass Strait Bulk Liquid Break Bulk Dry Bulk
Transhipments
Manufactured Exports – History
Substantial regional volatility from mining investment, populous industrial bases drive inflow trends
3500 Calendar Year Q3 2019 Q4 2019 Q1 2020 Q2 2020
35%
-5.5% -4.0% -2.9% -5.8% y/y
Tonnes (MAT, Thousands)
3000 30% Total
Moving Annual % Change
25% -4.4% 0.0% -6.2% -12% q/q
2500
20% 11.3% 10.2% 4.0% -1.0%
2000 Sydney
15% 2.6% 7.0% 0.2% -12.7%
1500 10% -10.6% -6.2% -0.8% -7.1%
1000 5% Melbourne
-6.6% 0.9% -3.0% -18.6%
500 0%
0.7% 0.9% -0.6% -1.8%
0 -5% Brisbane
6.1% -2.2% 1.5% -12.1%
-10%
1993
1995
1997
1999
2001
2003
2005
2007
2009
2011
2013
2015
2017
2019
-15% -10.2% -12.2% -7.8% -4.8%
Adelaide
-20% -5.0% -10.1% -1.1% -1.5%
Sydney Melbourne Brisbane -16.3% -11.6% -8.4% -5.8%
1993
1995
1997
1999
2001
2003
2005
2007
2009
2011
2013
2015
2017
2019
Fremantle
Adelaide Fremantle Other -7.0% 6.6% -10.3% -11.2%
Melbourne Total -11.8% -14.4% -14.8% -17.4%
Confidential Other
-24.0% -10.7% -38.2% -0.6%
Overview Drivers Commentary
Sydney
. has been increasing it’s share of All states have experienced similar growth paths Manufacturing exports have seen a slight
Manufacturing exports since 2014. over the past two decades. However, over the past weakening over the past two years. This is due
two years, Sydney has been cannibalizing to lost market share in the key destinations of
Over this same time, Melbourne has seen a
Melbourne’s markets share of Manufacturing China, the US, and New Zealand despite a
decrease in the volume of Manufacturing exports
exports. This is due to significant manufacturing falling dollar. This is an area of concern and will
(which is more than just the lost of Visy paper
located in the Riverina and nearby areas which are be monitored.
products).
able to be serviced by both ports.
There has been a tendency for Australian
Declines in the last quarter of 2020 is largely due
Changes in market share between Melbourne and manufacturing to move away from low value bulk
to a shortage of sailing vessels, as opposed to
Sydney dominate changes on a year-to-year basis items into higher value goods. This may be the
change in the productive capacity of Australian
as opposed to changes in Australia’s productive underlying cause of the underperformance in
manufacturing.
capacity. TEU volumes against growth in our trading
partners.
34 34Empties and
Overview Imports Exports Bass Strait Bulk Liquid Break Bulk Dry Bulk
Transhipments
Manufactured Exports – Composition
The recent fall in manufactured exports is primarily due to a decline in plastics, and to a lesser
extent, scrap metal. This is attributed to decreased economic activity in Victoria during lockdowns.
FY20 Manufacturing Exports
(Port of Melbourne classifications) TEUs Historical volumes
140,000
120,000
Cork, raw, waste
Dyeing & Coloring Materials
Rubber, other
100,000
Fabrics
N-Met Minerals & Manuf. NEI
80,000 Textile/Fibre Waste
Glass and Glassware
Rubber Manufactures
60,000
Iron & Steel - Shapes
Steel Scrap
40,000 Metal Manufactures
Hides, Skins & Furs
Plastics, Raw
20,000
Scrap Metal - other
Misc. Manufactures NEI
0
Dec-06
Dec-07
Dec-08
Dec-09
Dec-10
Dec-11
Dec-12
Dec-13
Dec-14
Dec-15
Dec-16
Dec-17
Dec-18
Dec-19
35 35Empties and
Overview Imports Exports Bass Strait Bulk Liquid Break Bulk Dry Bulk
Transhipments
Other Exports – Composition
Wine imports have fallen slightly over the last 12 months while general Other imported have
increased since CY17 as they recover from the high Australian dollar
FY20 Rural Exports
(Port of Melbourne classifications) TEUs Historical volumes
140,000
120,000 Lead
Builders Hardware
Chemical Elements and Comp, NEI
100,000 Crude Fert & Minerals, NEI
Furniture
Transport Equipment, NEI
Essential Oils
80,000
Non-Alcoholic Beverages
Electrical Machinery
Confectionery
60,000
Medical & Pharm. Prods
Personal Effects
Beer
40,000 Plastic Ware
Aluminium
Machinery - Non Elec. NEI
Chemical Products, NEI
20,000
Vehicle Parts
Wine
0
Dec-06
Dec-07
Dec-08
Dec-09
Dec-10
Dec-11
Dec-12
Dec-13
Dec-14
Dec-15
Dec-16
Dec-17
Dec-18
Dec-19
36 36Empties and
Overview Imports Exports Bass Strait Bulk Liquid Break Bulk Dry Bulk
Transhipments
Paper Exports – Composition
Paper exports have fallen to decade lows due to lost market share to competing container ports and
a shrinking overseas market for waste paper. Outlook is for maintenance of current volumes.
FY20 Paper exports
(Port of Melbourne classifications) TEUs Historical volumes
140,000 Fibreboards
Fibres - other
Newsprint Paper
120,000
Paperboard & Manuf.
Paper, other
100,000 Pulp and Waste Paper
80,000
60,000
40,000
20,000
0
37 37Empties and
Overview Imports Exports Bass Strait Bulk Liquid Break Bulk Dry Bulk
Transhipments
Timber Exports – Composition and History
The decline of timber exports as was expected 12 months ago has not materialised, and has only hit
new highs in the most recent quarter.
Exports volumes and ocellated significantly in the aftermath of the 2019 bushfires, with declines in part due to COVID-19 related slowdowns in building activity in
China and reduced sailing early in February / March 2020, and then surged from June with record volumes through to October. From November, import restrictions
by China plunged exports, falling by 75% between October and December, with South Korea and India now taking the majority of exports (albeit at a lower level).
The outlook for FY21 and FY22 is a continuation of the current 5-month average export volumes.
FY20 Timber Exports
(Port of Melbourne classifications) TEUs Historical volumes
14000
China
Taiwan
12000
South Korea
Malaysia
10000 India
Thailand
Vietnam
8000
Western Australia
Saudi Arabia
6000
New Zealand
Indonesia
4000 Singapore
Japan
Philippines
2000
Hong Kong
Queensland
0 U.S.A.
Jan
Jan
May
Sep
Jan
May
Sep
Jan
May
Sep
Jan
May
Sep
Jan
May
Sep
Jan
May
Sep
Sri Lanka
2015 2016 2017 2018 2019 2020 2021
38 38Empties and
Overview Imports Exports Bass Strait Bulk Liquid Break Bulk Dry Bulk
Transhipments
Outlook
Agricultural exports are expected to rebound from drought conditions over the forecast horizon
Annual % Change 2016-17 2017-18 2018-19 2019-20 2020-21 2021-22 300,000
Agriculture 13.9% 5.1% -19.2% -0.9% 12.6% 15.5%
Manufacturing 8.1% 3.2% 0.8% -2.5% -4.4% 6.2%
Paper -7.0% 8.5% -15.5% -11.3% -9.7% 0.0%
250,000
Timber 22.8% 18.8% 2.6% -1.9% -10.9% 14.4%
Other 0.2% 9.9% 2.6% 1.0% -5.2% 2.9%
Total Exports (excl. Bass Strait) 7.7% 7.3% -7.9% -2.2% -0.5% 9.2%
200,000
Agriculture
Sectoral Outlook to 2022 Manufacturing
TEUs
Growth in most sectors is expected to increase over the next five years. 150,000
Paper
Agriculture is expected to rebound quickly from drought conditions and is expected to Timber
approach normal levels of production by 2021-22. Other
This growth trend is then expected to continue over the long term forecast horizon.
100,000
Paper exports are expected to now hold flat (a downgrade from earlier forecasts).
Timber exports will maintain current low levels through to the end of FY22, and then
incrementally improve thereafter.
Manufactured and Other goods exports have not explicitly been impacted by COVID-19, 50,000
and will continue to be monitored.
0
Jun-06 Jun-11 Jun-16 Jun-21
39 3903 BASS STRAIT TRADE
Empties and
Overview              Imports            Exports             Bass Strait                                        Bulk Liquid        Break Bulk            Dry Bulk
                                                                                    Transhipments

 Bass Strait – Outlook
 Bass Strait exports are constrained by population growth, which is expected to weaken over the
 long-term. Imports have been modelled on a similar basis as the Port of Melbourne's international
 exports
 Annual changes and CAGRs                                                                           Bass Strait Imports
                                                                                                           60,000
Annual % Change                 2016-17 2017-18 2018-19 2019-20 2020-21 2021-22
Agriculture                      -8.3%      18.5%   -24.0%      7.6%       -10.7%    0.4%
Manufacturing                    -1.7%     -28.8%   38.4%       1.5%       11.5%     6.2%
                                                                                                           50,000
Paper                            7.2%       -7.3%   -7.6%       1.4%       55.9%     0.0%
Timber                           3.8%       51.4%   -33.2%     -38.7%      4.9%      14.4%
Other                            -3.1%      11.1%   4.4%       -9.0%       4.3%      3.3%                  40,000
Bass Strait Imports              -2.3%      2.9%    3.1%       -4.8%       9.1%      3.1%
Bass Strait Exports              -2.7%      5.5%    0.8%        3.4%       9.4%      -5.9%                                                      Agriculture

                                                                                                    TEUs
Bass Strait (Full)               -2.6%      4.5%    1.7%        0.2%       9.3%      -2.5%                 30,000                               Manufacturing
                                                                                                                                                Paper
                                                                                                                                                Timber
                                                                                                                                                Other
                                                                                                           20,000

                                                                                                           10,000

                                                                                                               0

                                                                                                                    Jun-06
                                                                                                                    Jun-07
                                                                                                                    Jun-08
                                                                                                                    Jun-09
                                                                                                                    Jun-10
                                                                                                                    Jun-11
                                                                                                                    Jun-12
                                                                                                                    Jun-13
                                                                                                                    Jun-14
                                                                                                                    Jun-15
                                                                                                                    Jun-16
                                                                                                                    Jun-17
                                                                                                                    Jun-18
                                                                                                                    Jun-19
                                                                                                                    Jun-20
                                                                                                                    Jun-21
                                                                                                                    Jun-22
                                                                                                                              41          41
04 EMPTIES AND TRANSHIPMENTS
Empties and
Overview Imports Exports Bass Strait Bulk Liquid Break Bulk Dry Bulk
Transhipments
Transhipments
Transhipments are modelled on the basis of % of full TEU holding constant over the forward outlook.
Outbound Transhipments Inbound Transhipments Mainland and International
Bass Strait, Share of Full Bass Strait Exports Bass Strait, Share Full Imports Share Full Imports
12% 60% 12% Full Outward
Full Inward
10% 50% 10%
8% 40% 8%
6% 30% 6%
4% 20% 4%
2% 10% 2%
0% 0% 0%
2006
2007
2008
2009
2010
2011
2012
2013
2014
2015
2016
2017
2018
2019
2020
2006
2007
2008
2009
2010
2011
2012
2013
2014
2015
2016
2017
2018
2019
2020
2006
2007
2008
2009
2010
2011
2012
2013
2014
2015
2016
2017
2018
2019
2020
Transhipments to Tasmania account for Transhipments from Tasmania are approximately Transship imports make up approximately 3% of
approximately 8% of full exports. This has 30% of full imports. full mainland and international imports.
declined form the 11% of total exports in 2017.
43 43Empties and
Overview Imports Exports Bass Strait Bulk Liquid Break Bulk Dry Bulk
Transhipments
Empties – Reefers
20’ Reefer – Net Trade Flows
The Port of Melbourne is exporting increasing Net Imports Full Net Exports Empty
number of empty reefers – both 20’ and 40’.
0
The net export of full reefers is slightly higher than -2,000
the empties for both 20’ and 40’. This implies -4,000
higher levels of containers being exported than -6,000
imported. As previously, this can be explained by -8,000
reefers being sourced in other import terminals -10,000
(e.g. Port Botany) and being loaded for export -12,000
through Port of Melbourne. -14,000
Agricultural exports are largely responsible for -16,000
this trend.
40’ Reefer – Net Trade Flows
Net Imports Full Net Exports Empty
10,000
5,000
0
-5,000
-10,000
-15,000
-20,000
-25,000
44 44Empties and
Overview Imports Exports Bass Strait Bulk Liquid Break Bulk Dry Bulk
Transhipments
Empties – Dry
Commentary 20’ Dry Containers – Net Trade Flows
The major container ports in Australia import Net Imports Full Net Exports Empty
more full containers than they export. This is
160,000
particularly the case for 40ft containers, which are
140,000
ideal for the consumer and light-weight 120,000
intermediate goods imported from overseas, but 100,000
sub-optimal for the heavier (denser) items that 80,000
60,000
Australia tends to exports (preferring instead 20ft
40,000
containers, which are being generally phased out 20,000
along most trade routes. 0
Over the forecast period, BISOE maintains the
difference between full and empty containers as
observed in 2019 and maintains this over the
forward outlook, running it off of the modelled full 40’ Dry Containers – Net Trade Flows
exports and imports.
450,000
400,000
350,000
300,000
250,000
200,000
150,000
100,000
50,000
0
Net Imports Full Net Exports Empty
45 45Empties and
Overview Imports Exports Bass Strait Bulk Liquid Break Bulk Dry Bulk
Transhipments
Empties – Forecasts (excl. Bass Strait)
Stronger forecast growth in full imports vs full exports means than empty exports must grow at a
faster rate.
Commentary Forecast Composition of Trade (excl. Bass Strait)
Modelling of empties is undertaken using the following logic: 100%
• Net imports = total imports less total exports
90%
• Net imports over the forward outlook remains unchanged from the most recent 12-
month total
80%
• Empty imports are calculated as a percentage of full imports, calculated at the
most recent 12-month total and held constant over the forward outlook 70%
• Empty exports are calculated using the full imports, full exports, empty imports and
Containerised Full - inward
net imports. 60%
Containerised Empty -
Annual % Change 2016-17 2017-18 2018-19 2019-20 2020-21 2021-22 50% inward
Containerised Full - outward
Transhipment Imports 4.8% 8.8% 14.4% -24.4% 46.0% -0.6%
40%
Transhipment Exports 5.5% 18.2% 9.9% -25.6% 25.6% -3.3% Containerised Empty -
Transhipment Empties 6.3% -0.7% 18.1% -20.5% -11.2% -0.6% outward
30%
Empty Imports -12.0% 10.3% 8.5% 10.7% -15.6% -1.3%
Empty Exports -4.3% 8.9% 25.8% -9.9% 29.4% -9.1% 20%
10%
0%
2021 2022
46 46You can also read