European Tourism amid
the Crimea Crisis
←
→
Page content transcription
If your browser does not render page correctly, please read the page content below
European Tourism amid the Crimea Crisis
European Tourism amid the Crimea Crisis

                 European Tourism
              amid the Crimea Crisis

  A report produced by the European Travel Commission
and Tourism Economics (an Oxford Economics Company)

                               Brussels, October 2014

                                                          2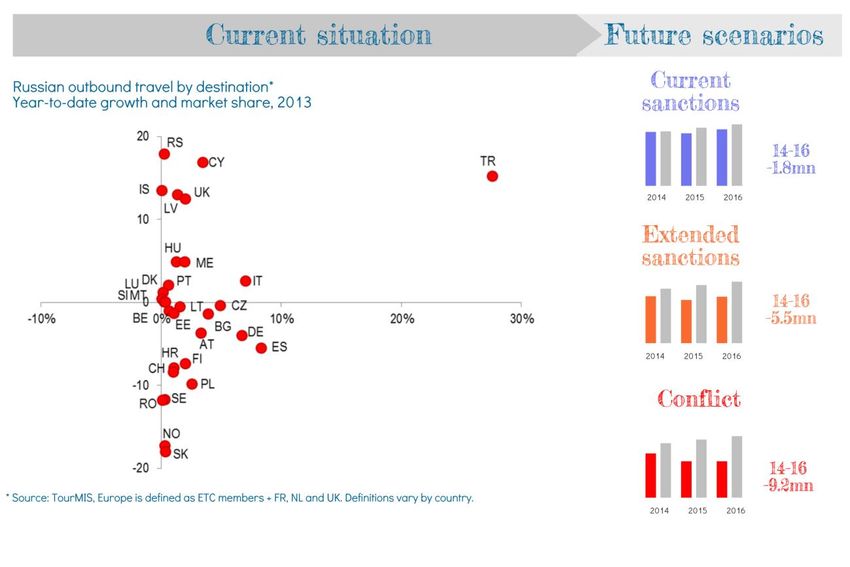
European Tourism amid the Crimea Crisis

Copyright © 2014 European Travel Commission

European Tourism amid the Crimea Crisis

All rights reserved. The contents of this report may be quoted, provided the source is
cited accurately and clearly. Distribution or reproduction in full is permitted for
personal or internal use only. While we encourage distribution via publicly accessible
websites, this should be done via a link to ETC's corporate website, www.etc-
corporate.org, referring visitors to the Research/Trends Watch section.

The designations employed and the presentation of material in this publication do
not imply the expression of any opinions whatsoever on the part of the Executive
Unit of the European Travel Commission.

  Data sources: This report includes data from the TourMIS database /
  www.tourmis.info, STR Global, IATA, and UNWTO.

  Economic analyses and forecasts are provided by Tourism Economics and
  should be interpreted by users according to their needs.

Published and printed by the European Travel Commission
Rue du Marché aux Herbes, 61, 1000 Brussels, Belgium
Website: www.etc-corporate.org
Email: info@visiteurope.com

ISBN No: 978-92-990067-4-0

This report was compiled and edited by:
Tourism Economics (an Oxford Economics Company)
on behalf of the European Travel Commission. A note of thanks to all ETC members
who contributed to this report.

Cover: EU and Russian flag on the background of old locked doors© Borislav Bajkic

                                                                                         3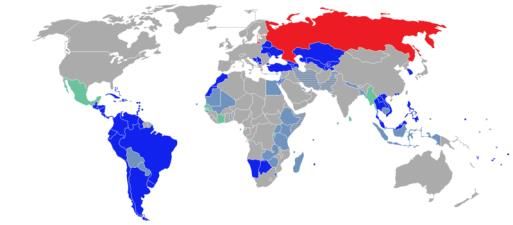
European Tourism amid the Crimea Crisis
FOREWORD
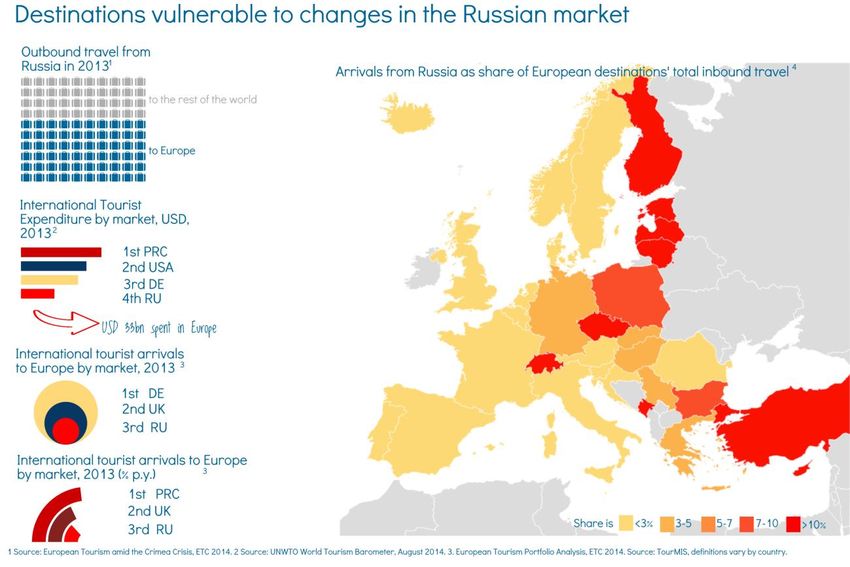
In recent years, Russia has become the third largest source market for
Europe. European destinations received nearly 32 million arrivals from
Russia in 2013, with forecasts pointing towards a 3.6% growth for 2014.
However, the escalation of the crisis between Ukraine and Russia over
Crimea is abruptly changing trends in travel from this market in the short
term.
While the European tourism sector is not a direct target of international
sanctions introduced in response to the crisis, it does suffer indirectly.
The weakening Rouble, partly a by-product of deteriorating trade
relationships, has progressively reduced outbound travel from Russia.
The climate of economic uncertainty, fear of hostile attitudes towards
Russians and deteriorated visa processing, amplified by media coverage,
contribute to diverting travel from Russia to non-European destinations.
National Tourism Organisations can play a crucial role in containing the
negative impact of this crisis by addressing the information needs of
travellers and all industry stakeholders in an efficient, timely and
responsible manner.
With this report, the European Travel Commission wishes to provide
timely information to its members and support in co-ordinating actions
and mitigating the impact of this crisis.
ETC Executive Unit
4
European Tourism amid the Crimea Crisis

                                     5
European Tourism amid the Crimea Crisis
THE CRIMEA CRISIS IS AN INTERNATIONAL
European Tourism amid the Crimea Crisis
CRISIS OVER THE CONTROL OF THE
CRIMEAN PENINSULA PRINCIPALLY
INVOLVING THE RUSSIAN FEDERATION
AND UKRAINE.
EXECUTIVE SUMMARY
Over the past decade, Russia has become a key contributor to tourism growth in
Europe. In 2013, European destinations received nearly 32 million arrivals from
rd
Russia, becoming Europe’s 3 largest market (6% of Europe and 4% of ETC
rd
destinations' total inbound travel). Russia is also Europe’s 3 fastest growing market
(+13% in 2013).
Over the past decade, Russian outbound travel to Europe has grown by an average
of 11% per year, a pace faster than the market average (9%). As a result, Europe has
strengthened its position, attaining a share of 60% of all outbound travel from
Russia in 2013.
The underlying fundamentals for outbound travel from Russia remain strong,
although deteriorated economic conditions and uncertainty - partly a by-product of
the conflict over Crimea – will necessarily affect travel from this market. According
to the IMF, geopolitical tensions are slowing the economy, which is already
weakened by structural bottlenecks. Russian GDP is expected to grow by only 0.2%
in 2014 and 0.5% in 2015, thus having a negative impact on consumption.
Travel demand from Russia dropped as the year progressed. After a good start in
Q1, travel from Russia fell during Q2 by an estimated 6%. Air bookings point to a
recovery of demand in Q3, although values remain below 2013 level. Q3
performance shall be interpreted as the effect of longer travel lead times for main
holidays rather than as an early sign of recovery. If no changes occur, Russian
outbound to Europe will grow by a modest 3% (+500.000 visits). This is 1.2mn short
of the volumes forecast for 2014 before the outbreak.
A fall in leisure spending is also expected. Inflationary pressure is expected to erode
incomes and spending power even further. This may impact modestly on travel, but
will certainly affect leisure spending and choice of destinations. Overnights have
moved broadly in line with arrivals in data to date, giving no evidence for changes in
the length of stay.
For better or for worse, the crisis will be felt most by destinations with a strong
presence of Russian travellers in their guest mix. Finland, Lithuania, Switzerland and
Czech Republic are threatened by this year negative performance of the market. At
the other end of the spectrum, Cyprus, Turkey - who adopted a neutral position in
the conflict- and Latvia -host to a large Russian diaspora- report growth in line with,
or even exceeding, expectations.
The crisis will hit most in 2015. For next year, inbound travel from Russia to Europe
is expected at some 10% lower than what it would have been, had the crisis not
occurred. Some faster growth can be expected for 2016, under the assumption that
more normal trends resume. Spain, Czech Republic, Poland Finland, Germany and
Turkey are the destinations expected to shoulder the largest burden over the period
2014-2016.
6European Tourism amid the Crimea Crisis
7European Tourism amid the Crimea Crisis
THE FUNDAMENTALS OF RUSSIAN OUTBOUND TRAVEL GROWTH
In the early 1990s, the end of the Cold War (1991) and the collapse of the Soviet Union released a huge pent-up
demand for travel to Western countries. After the initial euphoria, the impact of the transition from a planned to a
market-based economy was felt by the middle-class, and travel to Europe slowed down for all but the ultra-rich.
The modernisation of the Russian economy led to a dramatic reform of the tourism industry and market. A more
open economy and surging oil prices have contributed to improving the economic wellbeing of Russia middle-class
since the 2000s. Real GDP per capita rose from 7,700 USD in 1995 to 18,400 USD in 2014, and is projected to reach
the 20,000 USD threshold by 2016 – a threshold which is estimated to make international travel affordable (although
recent downward revisions of Russian GDP growth suggest that this target may be hit slightly later).
The market-oriented development of the Russian tourism sector has stimulated outbound travel from the country,
thanks to the expanded activity of foreign tour operators in the country, in conjunction with the rise of Russian tour
operators and agencies, the development of tourist-oriented services (e.g. banking, insurance) and the development
if ICT.
The introduction of simplified visa regimes with a number of countries
(coloured in blue or green on the map to the right), coupled with
improved transportation and travel infrastructure connections has
provided fertile ground for travel from Russia to boom.
Changes in lifestyle, with more Russians seeing holiday as part of their
standard of living, also stimulated outbound travel, especially to Countries and territories with visa-free or visa-on-arrival entries for
European destinations. Ambition to a healthy lifestyle, in particular, holders of regular Russian passports.
gave a boost to demand for ski holidays and spa tourism.
These underlying fundamentals remain strong still today, but have been overwhelmed by current events.
Deteriorated consumer confidence and purchasing power, as well as burdensome visa procedures (a by-product of
the conflict), are likely to halt demand from this market, albeit only on a temporary basis.
The crisis may lead to changes in travel behaviour. After 20 tour operators and agencies in Russia went bankrupt
earlier this year, and with experts predicting a reorganisation of the sector and more dissolutions, independent
travel has surged this year. The current situation is also accelerating the shift to online booking. Part of Russian travel
demand may be diverted to non-EU or domestic destinations, but it is expected to return to Europe once the
situation normalises.
Purchasing power will be a crucial factor in influencing travel demand flows amid the crisis. The depreciation of the
Rouble against the Euro made many destinations less affordable to Russian travellers. Finland, for instance, was
affected the most due to its proximity to North-West Russia and the predominance of cross-border traffic. Until the
devaluation of the Rouble, large numbers of Russians from the nearby region made same-day trips to Finland to
purchase goods that were cheaper than in Russia, but this is no longer the situation. On the other end, European
destinations that are not too costly to visit and are relatively close to Russia have enjoyed a general increase in the
number of visitors. Turkey, Greece and Hungary are among them.
8European Tourism amid the Crimea Crisis
COMPETITIVE ENVIRONMENT
1
Outside of Europe, only a few destinations hold a significant share of arrivals from Russia . Among market leaders, Egypt
(with a market share of 8%) has seen quite a modest growth rate in Russian inbound travel. China (7% share) reports a
decrease in numbers of Russians; travel to Thailand (4% share) has also slowed, most likely due to troubles at the
destination. South Korea (Russian Travel to Europe:
Impact of Crisis and Conflict in
Ukraine
10Contents
1 Background ..................................................................................... 12
1.1 Russian contribution to European tourism ................................................12
1.2 Economic trends .......................................................................................15
1.3 Key events and scenario assumptions .....................................................17
2 Direct impacts to date .................................................................... 19
2.1 Russia as a destination .............................................................................19
2.2 Russia-Ukraine tourism flows ...................................................................20
2.3 European destinations ..............................................................................21
2.4 Competitor destinations ............................................................................25
3 Alternative scenarios for European destinations ........................ 30
3.1 Baseline & counterfactual outlook.............................................................31
3.1 Extended sanctions ...................................................................................34
3.2 Conflict ......................................................................................................36
ETC Member Organisations .................................................................... 38
111 Background
1.1 Russian contribution to European tourism
Travel from Russia has grown massively over the past twenty years, in line with
economic growth and wealth accumulation, and Europe has been a key beneficiary.
Growth followed the dissolution of the USSR and the introduction of market reforms
and a more open economy, while the higher oil prices over the past ten years raised
export earnings. A much larger proportion of the Russian population is now able to
afford international travel, with a large increase in the proportion of households earning
over the US$20,000 threshold identified as a point at which international travel
becomes affordable. Oxford Economics estimates that over a third of Russian
households earn in excess of this threshold, more than double the number of
households in receipt of this level of income ten years ago, in constant inflation-
adjusted terms.
Total Russian outbound travel, 1990-2014
Overni ght visitor a rrivals from Russia by destination
45
World to Europe*
40
No. of outbound tourists (mns)
35
30
25
20
15
10
5
0
1995 2000 2005 2010
* Europe is defined as ETC members plus France, Netherlands and UK
Source: Tourism Economics
The above chart shows the evolution of total Russian travel and that to European
destinations. In this context, and in the entirety of this report, Europe is defined as ETC
members plus UK, France and Netherlands. Growth is notable since 2000 1, and it is 0F
particularly clear in the most recent five year period, during which time European
destinations have gained share of the Russian outbound market. European
destinations now receive over 45% of all reported travel from Russia, up from around
35% ten years ago.
1
There is some uncertainty in the data prior to 2000 and new surveys and data collection methods have
been put in place since then.
12Over the past decade Russia became a key contributor to European inbound arrivals
growth. Between 2004 and 2013, outbound travel from Russia grew from 24.5 million
to 54.5 million, or 9% on average over the decade. At the same time, arrivals to
Europe as a whole grew from 12.3 million to 31.8 million, growing by 11% on average.
Previous analysis by ETC and Tourism Economics 2 showed that in 2013 Russia 1F
became the third biggest source market for Europe in terms of absolute arrivals behind
the UK and Germany accounting for 6% of all arrivals in Europe. Russia was also the
third fastest growing source market behind Turkey and China, growing by 13% in 2013
over the previous year (chart on the left).
Origin market growth vs size: 2013, Europe Source market contribution to growth in Europe, 2008-13
% growth 2013 % of total Europe inbound arrivals growth 2008-13
United Kingdom
30% Poland
Note: bubble size illustrates number of
Italy
CHN arrivals from each origin market in Spain
25%
2013 India
Canada
20%
TUR Netherlands
Japan
15% Denmark
RUS Sweden
BRA Negative Positive
10% USA Austria
SWE Brazil contribution contribution
CAN Turkey
5% NOR CHE FRA GBR
United States
Norway
DEU Germany
0%
IND ITA NLD France
ESP Belgium
-5% China
Switzerland
-10% Russia
-4% -2% 0% 2% 4% 6% 8% 10% 12% 14% 16% 18% -10% -5% 0% 5% 10% 15% 20% 25%
% share of foreign arrivals to Europe, 2013
Source: Tourism Economics
As an emerging market, at least within the context of Europe, Russia was much less
affected by the global recession of 2008/09 than some of the traditional tourism
source markets in Europe. The chart on the right shows that during the period 2008-
13, Russia accounted for 20% of the increase in travel to European destinations 3 – 2F
more than thrice the amount of the next biggest contributor, Switzerland. The
recession and the years following impinged hugely on the ability of many European
households to travel abroad as incomes were pinched and jobs were cut. On the
other hand, Russia’s economy continued to boom, with rising household incomes
providing many households a newfound ability to afford a foreign holiday.
With the recession now behind us however, many of the traditional source markets of
European travel are expected to re-assert themselves in coming years in line with
economic trends. Nonetheless, Russia has established itself a key source market for
many European destinations.
2
ETC (2014), European Tourism Portfolio Analysis.
3
Russia’s contribution to European arrivals growth is calculated as the net change in European arrivals
from Russia as a share of the net change in total arrivals to Europe.
13Rising tensions through 2014 between Ukraine and Russia, and subsequently between
the EU and Russia, have had notable impacts on travel flows. As tensions have risen
and sanctions have been imposed, demand for travel between Russia and European
destinations has softened and in many cases has fallen. This may have large
implications for European destinations which have developed a reliance on Russian
demand. Booking data show that after a good start to the year, the number of Russian
outbound air passengers remarkably fell as the crisis unfolded (i.e. since March 2014),
compared to the previous year. This suggests that the crisis has to at least some
degree deterred Russians from committing to outbound air travel, perhaps fearful of
how events might unravel. Falls in arrivals by air in April and May were particularly
large following the annexation of Crimea in late March and rising tensions in Eastern
Ukrainian regions. Arrivals by air recovered during Summer, mostly because of
relatively long lead times for main holidays. Falls are likely to be observed in the last
months of 2014, as current events are likely to negatively impact on bookings and
future arrivals hence. Short-term travel for short-haul destinations have seen largest
falls.
At the time of writing, some fighting remains ongoing, particularly in the vicinity of the
strategically important Donetsk airport. This is despite the official ceasefire, which has
otherwise held and there remains a risk of further escalation.
141.2 Economic trends
Some of the slowdown in international travel demand from Russia in 2014 is
attributable to the economic slowdown and particularly the large rouble depreciation at
the start of the year. Depreciation has continued through the year, broadly in line with
expectations. The rouble is expected to be around 13% weaker against the euro for
2014 as a whole, which will erode purchasing power of potential Russian travellers.
GDP is expected to be unchanged from 2013 levels for the year as a whole, with only
moderate growth in household income and spending. These economic factors have
been identified by Tourism Economics as important indicators of tourism demand and
are key drivers of tourism forecasts.
Outbound travel demand by market can be forecast as a function of key economic
indicators identified in modelling by Tourism Economics. Equations track historic
performance on average and also correctly identify peak and trough years for
outbound travel growth. These factors point to weaker outbound travel performance for
2014 as a whole, with a fall in outbound spending, denominated in US$ terms.
The rouble depreciated heavily in early 2014 amid wider concerns regarding
emerging market debt levels. The prospect of tapering of the Federal
Reserves’ quantitative easing program in the US resulted in a re-appraisal by
international investors of risk and return from emerging markets. This lower
value better reflects the medium-term growth prospects and the rouble was
arguably over-valued in prior years. Hence, strong growth in Russian travel in
the years to 2013 was likely boosted by the increased purchasing power from
a strong currency. Reduced spending power from the depreciation alone is
estimated to reduce outbound travel from Russia by over 4% according to
historic estimated relationships.
Economic activity within Russia has also slowed in early 2014, with only
moderate expectations for growth into 2015, at least partly in response to the
currency movement. Inflationary pressure from the depreciation will erode
incomes and spending power, while monetary easing has been deferred at
best. Combined with softer export demand from other emerging markets, there
will be a notable slowdown in business activity and particularly in investment.
Income and consumer spending will also be weaker than previously
anticipated, as the slower activity results in some employment losses and
lower aggregate earnings and subsequently spending. Even if international
tourism spending retained a constant share of total household expenditure a
fall in leisure spending would be expected in real terms.
Leisure travel would also be adversely affected by some loss in consumer
confidence as unemployment is set to rise and some substitution towards
lower cost domestic travel or other spending would be expected.
15The detrimental effect of these weaker economic trends were already factored into
Tourism Economics’ forecasts made earlier in the year, prior to the current crisis which
can be used as a counterfactual outlook representing a plausible view of activity in the
absence of more recent events. The impact of the current crisis can be isolated by
comparison with this counterfactual scenario. Sanctions announced and enforced to
date will have some macroeconomic impact, and notably in 2015. A sizable inflation
effect is expected from disruption to Russian food supplies due to the counter
sanctions and the import bans on certain agricultural products from the EU. However,
these macroeconomic changes are likely to be relatively small compared to the
previous trends. The main impacts of sanctions will be from changes in sentiment.
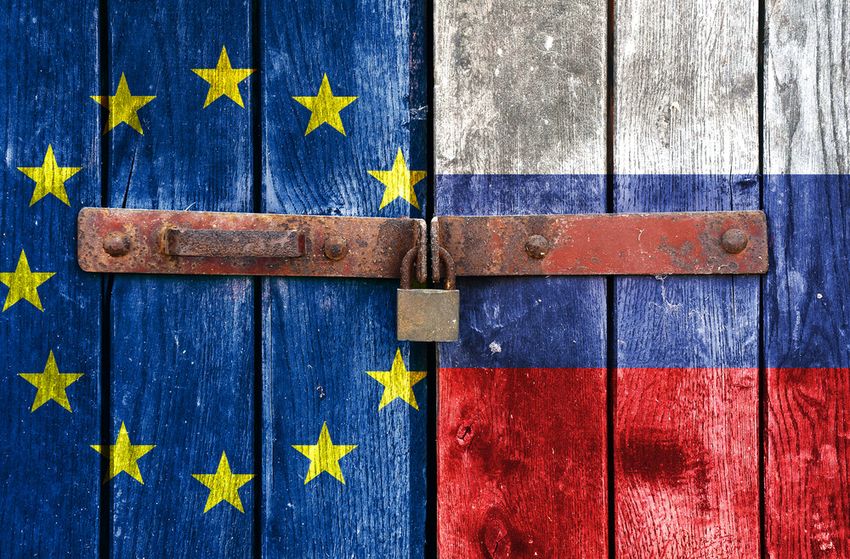
European inbound arrivals from Russia, 2010-16
Pre-crisis expectations
Inbound arrivals from Russia
45000 Inbound arrivals from Russia (% growth) 30.0%
40000
25.0%
Inbound arrivals from Russia (% growth)
35000
Inbound arrivals from Russia (000s)
30000 20.0%
25000
15.0%
20000
15000 10.0%
10000
5.0%
5000
0 0.0%
2010 2011 2012 2013 2014 2015 2016
Source: Tourism Economics
The above chart illustrates this counterfactual outlook using pre-crises data and
forecasts showing that European arrivals from Russia were expected to slow
significantly in 2014 as a whole and in subsequent years. Growth was estimated to be
in the region of 4.5% through to 2016. This is a marked slowdown from the double-digit
growth achieved in each of the four years prior. However, it should be noted that this
outlook is still for continued growth and the 2016 volumes were expected to be almost
twice that of 2010 at 38.2m arrivals (compared to 20.1m in 2010). The long-run trend
of household income growth means that further households continue to be able to
enjoy international travel for the first time, to partly outweigh some of the negative
short-run cyclical impacts.
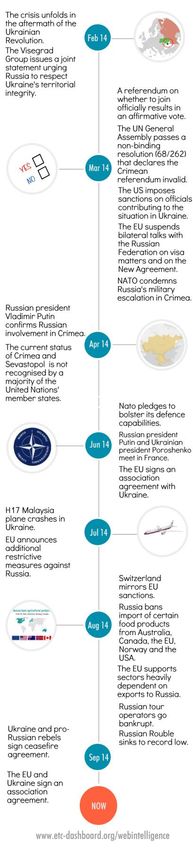
161.3 Key events and scenario assumptions
The escalation of tensions between Ukraine and Russia surrounding the sovereignty of
Crimea throughout 2014 has resulted in an imposition of sanctions against the latter by
the EU and other Western states with associated changes in sentiment and
implications for bilateral travel demand. Counter-measures from Russia have been
imposed while further measures may yet be implemented by both sides and significant
uncertainty remains.
While the ceasefire within Ukraine continues to hold at the time of writing there
remains the possibility that tensions could re-escalate. If this happens, harsher
sanctions, further deterioration and hardening of sentiment against countries and, at
the extreme level, a full-blown international conflict, are all prospects.
Economic sanctions and restrictive measures to date have been imposed upon Russia
in an effort to de-escalate the crisis. They also serve as a tangible manifestation of the
general ill-sentiment and condemnation of Russia’s violation of Ukrainian sovereignty
and territorial integrity.
Sandwiched between Crimea’s successful secession referendum and Russian
President Vladimir Putin’s bill absorbing it into the Russian Federation, 17 March 2014
marked the introduction of the first travel bans and asset freezes against Russian and
Ukrainian officials. Further to the above, diplomatic measures were also utilised;
Russia was excluded from June’s G8 Summit, having both its right to attend and right
to host rescinded – what was due to be a G8 Summit in the Russian city of Sochi
became a G7 Summit held instead in Brussels. Talks surrounding Russia’s integration
into the OECD and the International Energy Agency were suspended. The EU-Russia
Summit was also cancelled as were bilateral talks with Russia on visa matters.
An embargo on any goods originating from Crimea unless accompanied by a
certificate of origin from the Ukrainian authorities has been imposed and trade and
investment restrictions are in place which will chiefly affect infrastructure projects in
transport, telecommunications, and energy with an embargo on exportation of related
capital goods for the same sectors as well as related finance and insurance services.
EU citizens and companies can no longer trade new bonds, equity, or similar financial
instruments with a maturity exceeding 90 days which would be issued by any major
state-owned Russian banks. Services related to the issuing of any such financial
instruments, such as brokering, are also prohibited. Furthermore, any import or export
of arms and related material to and from Russia is prohibited as are exports of dual
use goods and technology for military use. Restrictions have been placed on access to
international capital markets for Russian state-owned companies and banks while
exports from the EU to the Russian oil industry have also been constrained.
In response to sanctions imposed by the West, Russia counter-sanctioned with a full
ban on the import of beef, pork, poultry, fish, cheese, milk, dairy products, vegetables,
and fruit from Australia, Canada, the EU, the US, and Norway. This self-imposed
supply-side shock sparked inflation fears, some worrying that Russia’s already fragile
economy would struggle to meet demand.
17Sanctions announced and imposed to date will have some impact on macroeconomic
activity, but the main impact on travel trends, at least in the current announced
sanctions, will be through changes in sentiment towards specific destinations.
Visa processing has long been a potential impediment to travel from Russia to
European destinations. Lengthy visa processing times have been identified in previous
analysis as a deterrent to travel 4, as numerous examples show that visa facilitation
3F
measures are followed by large increases in visitor volumes. Given the importance of
Russia as an origin market for many European destinations there was a significant
upside aspect to the outlook in recent periods from the possibility of easier visa
access. However, with the onset of hostilities this option is likely to have been
postponed at best. There also remains the possibility that visa processing will be
tightened in conjunction with sanctions, but clear data on visa issuance is not readily
available for 2014 to date. One available example of visa issuance to Russian
travellers is for the UK which shows that visitor visas in the year to March rose by 20%,
but in the year to June they fell by 3%. However, within this it is not reported whether
this was due to a reduction in applications or an increase in refusals.
In order to properly consider the impacts of the above and any further augmentations
thereof, we will compare various possible scenarios as below:
Counterfactual of no sanctions – this will incorporate the outlook for Russian
related travel prior to any escalation of tension. This scenario includes the
effects of the known economic slowdown and weaker rouble that began to
impact travel in early 2014.
Baseline – this will incorporate known travel trends for 2014 to date, including
the marginal effects on economic conditions. An assumed path for future travel
sentiment by country will be imposed into 2015 and 2016 according to likely
continued sanctions and visa regulations.
Extended sanctions – this will consider the impact on European travel of
further sanctions as well as counter sanctions by Russia;
Conflict – this will consider the impact of a full-blown conflict in the region and
the knock-on impacts this would have on travel to and from Russia. The final
section will also consider the indirect effects of this scenario on intra-European
travel as well as from other origin markets.
4
http://www.wttc.org/focus/research-for-action/policy-research/the-impact-of-visa-facilitation/
182 Direct impacts to date
Using latest year-to-date (YTD) arrivals information provided by TourMIS for
participating countries, as well as other data from national data sources and industry
data, we can estimate how the outlook for travel from Russia has changed
compared to Tourism Economics’ beginning of year estimates.
2.1 Russia as a destination
Russia has enjoyed strong inbound arrivals growth over the past number of years.
International tourist arrivals grew by 10.2% and 13.5% in 2012 and 2013. Since the
turn of the year however, arrivals growth has slowed substantially, with year-to-date
growth of 1.8% based on the first six months of the year. This is despite the
weakening Russian rouble which would make international travel to Russia relatively
more affordable. Therefore, it is reasonable to argue that the Russia-Ukraine crisis
has largely cancelled out one of the only benefits associated with a depreciating
currency by deterring potential international tourists from taking advantage of a now
relatively more affordable holiday destination.
This argument is bolstered by tourism receipts data showing international tourism
spending in Russia fell 8% on the same period last year according to data for the
first six months of 2014. Moreover, in the first three months of the year, tourism
receipts were in fact up on the same period in 2013 (albeit by only 0.8%), whereas
in the three months following tourism receipts plummeted 15.2% on the same three
months one year previous. There will be some impact here from the currency
movement as reported data are in US$ and the fall in local currency terms will be
less drastic. Nonetheless, this still suggests a fall in average spending per visitor in
real terms. It is no coincidence that this fall in tourism receipts coincides with the
climax of the crisis to date.
Additionally, YTD industry data point to falling international demand, while domestic
demand remains robust and even potentially growing faster than economic trends
would suggest. There may even be some substitution from international to domestic
travel.
Air passenger data for 2014 to date 5 show that domestic travel within Russia
4F
remained in double-digit growth rate territory, similar to that in the previous year.
International air travel to and from Russia slowed significantly at the same time.
Meanwhile, hotel data provided by STR Global shows hotel occupancy rates fell by
12% in the year to August, with the fall beginning in April/May and a large estimated
contribution from international demand rather than domestic demand. Domestic
demand carries a large weight in total hotel demand within Russia, and the 2014 Q1
followed the expected trend closely in modelling, consistent with the growth in other
industry data. It can therefore be assumed that domestic demand continued to grow,
5
Source: IATA
19albeit at a slower rate, in Q2 and into Q3 consistent with the economic and air
passenger trends. Hence, the inbound demand for hotel rooms is estimated to have
fallen 30-40% in this period.
The larger falls in average spending per visit and in hotel demand relative to visitor
arrivals indicates that the largest impact has been to higher spending visitors. Hotel
demand is often heavily reliant on high spending business travellers. In the case of
Russia, modelling of hotel performance shows a correlation over type between oil
export values and prices and an implied large impact from related business travel
for this key industry sector.
Visits to friends and relatives may be largely unaffected, as these types of visitors
tend to be less deterred by geo-political events and will continue to visit, supporting
the lower impact on total arrivals.
2.2 Russia-Ukraine tourism flows
It should of course be noted that Ukraine itself has historically been a large source
market for Russia, as well as vice versa. Ukraine has typically provided over 20% of all
overnight tourist arrivals in Russia, while in the other direction Russia has typically
provided around 40% of Ukrainian arrivals. Disruption to these flows would make a
large impact on total arrivals performance, although data to evaluate this fully are not
readily available.
The impact on Ukraine is lesser known in arrivals terms, however, international tourism
receipts for Q1 2014 were reportedly down 18% on 2013.
While the focus of the tension tends to be on the annexation of Crimea in mid-March, it
is important to note that tensions have been high between Russia and Ukraine,
particularly on the Crimean peninsula, since the early 1990s. The added difficulty in
assessing the impact of the crisis on Ukrainian tourism flows lies in its geographical
distinction following the annexation of the Crimea and separatist movements in
Eastern regions. Anecdotal evidence and netnographic research carried out by ETC
would suggest that in light of the sanctions, many Russians are instead choosing to
travel within their own borders.
202.3 European destinations
Latest year to date data for Russian travel to ETC members plus Netherlands, France,
and the UK (charted below), shows large variances across the board.
40.0%
Russian arrivals and overnights growth
Based on latest TourMIS YTD information†
Arrivals Nights
30.0%
20.0%
10.0%
0.0%
100%>
-10.0%
-20.0%
Iceland
Denmark
Latvia
Romania
Bulgaria
Cyprus
Greece
Serbia
Lithuania
Hungary
Austria
Slovakia
Sweden
Montenegro
Portugal
Luxembourg
Italy
Poland
United Kingdom
Czech Rep.
Belgium
Netherlands
Estonia
Slovenia
Germany
Malta
Spain
Finland
Switzerland
Croatia
Norway
†
Source: TourMIS TourMIS latest available data
But there are some large observed differences in the year to date performance of
travel from Russia and how this has evolved through the year.
While it is hard to determine the sanctions as a direct causal factor in Russian travel
demand, it is an indicator of the level of sentiment between Russia and a given
country. There also appears to be some correlation between the degree to which
sanctions are imposed by EU member states and travel from Russia. Sanctions are
agreed collectively at the EU level but some measures “such as arms embargoes and
travel bans, are implemented directly by member states 6”. There have been some 5F
clear differences in implementation of the sanctions to date, which appear to explain at
least some of the differential travel effects by country.
6
EU restrictive measures factsheet:
http://www.consilium.europa.eu/uedocs/cms_data/docs/pressdata/EN/foraff/135804.pdf
2130
Russian arrivals and overnights
PP change in YTD growth since Crimea Annexation*
20 Arrivals Nights
10
< -62
< -88
0
-10
-20
-30
-40
Netherlands
Romania
Bulgaria
Latvia
Serbia
Cyprus
Iceland
Sweden
Lithuania
Poland
Austria
Montenegro
Italy
Hungary
Czech Rep.
Estonia
Malta
Croatia
United Kingdom
Denmark
Slovenia
Germany
Spain
Switzerland
Norway
Source: TourMIS *Includes reporting TourMIS countries only
The chart directly above shows the percentage point difference between growth
reported for the year to March (i.e. before the Annexation of Crimea), and the latest
YTD information for arrivals from Russia. This is reported for countries reporting data
through TourMIS with sufficient recent data beyond that which was posted in March.
As shown, there have been some sizeable percentage point (PP) revisions in YTD
arrivals and overnights growth across the vast majority of reporting 7 European 6F
countries since tensions between Russia and Ukraine began to rise. The reporting
countries comprise around 75% of all Russian travel to European destinations (defined
as before as ETC members plus France, Netherlands and UK). Weaker trends are
evident for most reporting European destinations, with slower growth in many countries
and also falling arrivals. This can partly be explained by the imposition of travel bans
for many Russian public sector employees and their family to 150 countries, including
most European destinations.
While most of these changes have been downward, interestingly, there has also been
some upward movement. Travel to Cyprus is a notable example as it has a relatively
high reliance on Russian travel and traditionally receives a significant proportion of
visitors to Europe from this market. However, it should be noted that this is from a
relatively low base in 2013 and there is significant volatility following the banking crisis
in Cyprus which hit Russian savings there. The chart above illustrates the percentage
point difference in year-to-date arrivals and overnights from Russia before and after
the crisis.
7
The source for tourism statistics used in this section is the ETC information management system
TourMIS (www.tourmis.info).
22The larger EU destinations included in the previous chart show that travel from Russia
deteriorated as the year progressed. Taking a weighted average across these markets
(using 2013 Russian arrivals as weights) suggests that Q2 performance was around
6% weaker than in Q1. The more volatile markets at both ends of the spectrum are
outliers as particularly small destinations for Russian travellers. This is confirmed by air
bookings showing that air travel from Russia to almost all Western European cities was
lower than in the previous year in the period April to August 2014.
Russian arrivals to Turkey
% growth on previous year
30%
25%
20%
15%
10%
5%
0%
Jan-14 Feb-14 Mar-14 Apr-14 May-14 Jun-14
Source: Ministry of Culture & Tourism
The previous analysis of falling travel from Russia to European destinations excludes
Turkey which is a special case as a particularly large destination for Russian travel,
which has also seen improvement in demand as the years have progressed, gaining
share of Russian travel. EU candidate countries are invited to share in sanctions being
imposed, however Turkey has refused to follow suit and in fact was among the first to
step in to fill supply shortage. This may partly explain Turkey’s performance in this
market. Russian inbound arrivals had been slowing until March 2014, in line with total
demand, but began to grow steadily afterwards. June saw growth of 19% on the same
month one year previous. Such growth is also confirmed in air passenger data for
Russian travel to Turkish cities in the period April-August 2014. However, this growth is
slower than expected in the prior forecasts, notably for earlier in the year and some
impact may be felt in Turkey.
Outbound spend from Russia has continued to grow throughout the first half of the
year, albeit with a major slowdown in Q2. The drop in average spending is partly
explained by the loss of spending power from the weaker exchange rate but may also
be due to a change in the mix of traveller. However, so far there is limited information
available to draw any firm conclusions. Overnights have moved broadly in line with
arrivals in data to date giving no evidence for changes in the length of stay, while
booking data are also inconclusive.
The chart below shows how the expected changes in Russian outbound travel to
European destinations in 2014 would be spread across countries. It is estimated that
Europe as a whole may lose out on around 1.3 million inbound arrivals from Russia for
232014 in the latest baseline outlook compared to the counterfactual. However, not every
constituent country is shouldering the burden of this loss equally. We can see that, in
fact, some European countries, based on Tourism Economics’ beginning of year
estimates will actually gain, with notable improvement in Turkey.
Greece and Cyprus also appear to be prospering, at least partly offsetting the fall in
Russian inbound to Europe. Greece has declared that it would not impose any of the
EU’s recommended sanctions upon Russia. The same is true for Cyprus, a well-known
holiday destination for Russians. However, air passenger data suggest some falls on
these routes in the months to August.
Poland is expected to experience the largest fall in arrivals from Russia having taken a
hard line in imposing sanctions as a key provider of agricultural products. 32% of the
net fall in Russian travel is to be shouldered by Poland.
Other large destinations will experience notable falls in visitor volumes despite similar
percentage point growth deterioration. Germany and Italy are experiencing large
slowdown in Russian demand, with a fall in travel to Germany, despite both countries
having taken a lackadaisical view to imposing sanctions to date, along with some other
Western European countries.
Spain is also undergoing a slowdown in Russian arrivals moving into the peak summer
season with some moderate falls estimated for this period. This follows robust 5%
growth in early months of 2014. Spain is the second largest ETC destination for
Russian travellers (after Turkey) and may be suffering from being a top of mind
destination within Western Europe as sentiment turns against the EU.
Falls and gains 2014-16
Arrivals falls/gains as a % of net change in Russian outbound resulting from current sanctions
Spain
Czech Rep.
Poland
Finland
Germany
Turkey
Estonia
Bulgaria
Italy
Sweden
Austria
Croatia
Montenegro
Norway
France
Lithuania
Romania
Netherlands
Switzerland
Belgium
Slovakia
Denmark
Malta
Luxembourg
Slovenia
United Kingdom
Hungary
Latvia
Serbia
Cyprus
Greece
-25% -20% -15% -10% -5% 0% 5% 10%
Source: Tourism Economics, TourMIS
242.4 Competitor destinations
Countries considered in this section include developed competitors outside of Europe
who have chosen to impose sanctions, as well as those emerging markets competitors
who have decided to remain on more friendly terms politically. In most cases these
markets rely on Russia for less than 1% of total arrivals. Thailand is a notable
exception, where arrivals from Russia represent just under 7% of total arrivals, as is
UAE where Russians account for just under 4% of total arrivals. While every effort has
been made to include countries who receive a substantial share of Russian outbound
travel the availability of up-to-date data has, to some degree, also swayed the
selection countries featured in this section.
It is clear that Russian travel demand has slowed for most global destinations
throughout 2014 as expected from recent developments in economic activity and
notably exchange rate depreciation. The greatest slowdown throughout 2014 to date is
to US and Canada, both of which have imposed sanctions. Travel to Thailand has
slowed, but this is more related to events within its borders. The more modest
slowdown for most of the other competitor markets implies some gain in their market
and potentially some diverted travel that would otherwise have gone to Europe.
The United States has been at the front line with the EU in reacting to Russia’s
involvement in the crisis. It was quick to impose sanctions on Russia, doing so before
the annexation of Crimea which served as the catalyst for the EU adopting similar
measures. Sanctions authorised by the US imposed restrictions on the travel of certain
individuals and officials. Somewhat counterintuitively, however, latest YTD data to
June shows that arrivals from Russia has seen double digit growth every month this
year compared to 2013, with YTD growth at 20.5%. That said, a “growing but slowing”
trend can be observed, with growth of 10% in June a far cry from the 36% growth
enjoyed in January. Given flights to longer haul destinations will generally be booked
further in advance, any impact on longer haul destination will be delayed and it may be
another few months before this lag plays out to show the true impact of the crisis on
Russian inbound to the US. A comparison of Q1 arrivals growth of 30% with Q2’s 13%
suggests that a sizeable impact is in the pipeline.
It is of course, worth noting that these sizable percentage changes relate to a much
smaller base of Russian arrivals compared to that of Europe. Currently, the ratio
between the two is in the region of 1:100 in Europe’s favour.
25Russia arrivals to USA
% growth on previous year
40%
35%
30%
25%
20%
15%
10%
5%
0%
Jan-14 Feb-14 Mar-14 Apr-14 May-14 Jun-14
Source: US Office of Travel & Tourism Industries
Russian outbound to Canada has plummeted somewhat since the beginning of the
year. In this instance, given that Russian arrivals to Canada began to fall in February
2014 compared to February 2013 – a month before the Crimea crisis reached its
climax, it’s hard to say for certain exactly how much of the fall we can attribute to any
imposition of sanctions against Russia. Nonetheless, outbound travel from Russia to
Canada deteriorated further after March, after having shown some signs of recovering
from February’s poor performance. This sharp deterioration reached depths of -17% in
July 2014 compared to July 2013.
Russia arrivals to Canada
% growth on previous year
5%
0%
Jan-14 Feb-14 Mar-14 Apr-14 May-14 Jun-14
-5%
-10%
-15%
-20%
Source: Canadian Tourism Commission
Russian arrivals to Japan paint an interesting picture. Below we can see that arrivals
are in strong positive growth territory in January to March 2014 compared to the same
months one year previous. After the pinnacle of the crisis, observe Russian outbound
26to Japan falling off a cliff in April and still floundering in May, compared to the same
months one year previous, with growth of -7% and -2% respectively. After this point,
however, we see a recovery of sorts with growth returning to strong positive growth
territory in June and July with 21% and 9% respectively.
Anecdotal evidence suggests that ill-sentiment and contempt towards Western nations
imposing sanctions has festered, with many Russians claiming to avoid such
destinations as a matter of principle. Yet, this doesn’t appear to be the case for many
destinations in Europe and elsewhere. Japan exemplifies this well: despite having also
imposed sanctions as a gesture of solidarity with the United States and the EU,
Russian inbound has been growing beyond an initial fall in April and May. Indeed, as is
the case with any longer haul destination, it is possible that growth from April onwards
is a result of Russians following through on holidays that were booked pre-crisis.
However, the full impact of any such lags will not become apparent until the release of
data for the remainder of the year.
Russia arrivals to Japan
% growth on previous year
25%
20%
15%
10%
5%
0%
Jan-14 Feb-14 Mar-14 Apr-14 May-14 Jun-14 Jul-14
-5%
-10%
Source: Japan National Tourism Organisation
Travel to Thailand has also been clearly affected. Although posting strong YTD growth
of 5% based on eight months’ worth of data, this was largely driven by strong Q1
growth in the region of 20%. Arrivals from Russia fell sharply in April after having
enjoyed this strong growth at the beginning of the year, the Russia-Ukraine crisis
seemingly causing a bigger fall in arrivals growth than the political coup which took
place in Thailand in May.
27Russia arrivals to Thailand
% growth on previous year
40%
30%
20%
10%
0%
Jan-14 Feb-14 Mar-14 Apr-14 May-14 Jun-14 Jul-14 Aug-14
-10%
-20%
-30%
Source: Thailand Department of Tourism
South Korea has not yet implemented any degree of economic or diplomatic sanctions
against Russia. The chart below demonstrating the merit of such a stance, at least as
far as tourism is concerned. Steady acceleration in arrivals is evident in the months to
March, at which point it levels out to a degree until it picks up again from May onwards,
with arrivals growing by 22%, 33%, and 38% to July, gaining some share of the
Russian market from Europe.
Russia arrivals to South Korea
% growth on previous year
45%
40%
35%
30%
25%
20%
15%
10%
5%
0%
Jan-14 Feb-14 Mar-14 Apr-14 May-14 Jun-14 Jul-14
Source: Korea Tourism Organisation
28The United Arab Emirates has seen somewhat of a mixed bag this year. Arrivals to
Dubai have been falling since the beginning of the year, most dramatically in February
by 19%, with the months after offering little in the way of a reprieve. Travel to Abu
Dhabi remains in positive growth territory however, albeit YTD growth rates have fallen
as the crisis has developed. The three bars below showing YTD growth as it was in
March, July, and the other showing the inferred level of arrivals growth since March.
This offers a better indicator of post-crisis arrivals growth by factoring out the strong
growth which was observed prior, and demonstrates that Abu Dhabi has seen some
negative impact as a result of the crisis.
Russian YTD arrivals growth to Abu Dhabi
40%
35%
30%
25%
% growth
20%
15%
10%
5%
0%
YTD growth to March YTD growth to July Post-crisis growth*
2014 2014
Russia arrivals to Dubai
% growth on previous year
0%
Jan-14 Feb-14 Mar-14 Apr-14 May-14 Jun-14
-5%
-10%
-15%
-20%
-25%
Source: Dubai Tourism, Abu Dhabi Tourism & Culture Authority
293 Alternative scenarios for European
destinations
Scenarios quantify alternative paths for travel from Russia to European destinations
under different assumptions reflecting some of the current uncertainty in the outlook.
The chart below illustrates this in terms of share of total European arrivals. Russia
would still be likely to comprise a substantial share of arrivals even under the conflict
scenario with a proportion of travel to visit friends and relatives or to short haul
destinations. Some European destinations take a large share of Russian outbound
travel and are heavily favoured and it is unlikely that travel demand would disappear
altogether even with conflict.
Divergence of scenarios, ETC arrivals
Counterfactual Current sanctions Increased sanctions Conflict
24000
European arrivals from Russia (000s)
22000
20000
18000
16000
14000
12000
10000
2012 2013 2014 2015 2016
Scenario summary table
Total Russian outbound to Europe (000s visits) Percentage change
2013 2014 2015 2016 2013 2014 2015 2016
Counterfactual 18,136 19,906 21,236 22,460 16% 10% 7% 6%
Current sanctions 18,136 18,698 19,192 20,636 16% 3% 3% 8%
Increased sanctions 18,136 17,140 15,787 16,969 16% -5% -8% 7%
Conflict 18,136 16,153 13,298 13,291 16% -11% -18% 0%
*Europe is defined as ETC members plus France, Netherlands and UK
Source: Tourism Economics
303.1 Baseline & counterfactual outlook
The chart below shows the percentage change in the number of Russian arrivals to
Europe from 2014 to 2016 in a situation which assumes no further sanctions in the
short to medium term. Because the first quarter of 2014 was relatively unaffected by
the crisis, there is some reprieve in terms of the losses suffered. However, we
expect the biggest fall in 2015; down by 10% compared to the counterfactual
outlook as Russian sentiment towards Europe will still remain low even as some of
the sanctions expire. Some impact will be carried into 2016 before the market
recovers from the crisis as it exists in its current capacity. Note however, that while
we expect a fall in the number of absolute arrivals to Europe from Russia, we would
still expect some growth from this market across the period for Europe as a whole
albeit weaker than in the counterfactual at first. For 2016 some faster growth would
be expected as the impact lower sentiment passes under the assumption of a
resumption to more normal trends with some convergence with pre-crisis
expectations in the longer term. Oxford Economics places around 60% probability
on this outcome.
% change in Russian arrivals to Europe, current sanctions scenario
0.0%
2014 2015 2016
-2.0%
% change to counterfactual outlook
-4.0%
-6.0%
-8.0%
-10.0%
-12.0%
Source: Tourism Economics
The baseline assumption is that travel from Russia to most European destinations
remains weaker than would otherwise be expected into Q3 and for the remainder of
the year. Specifically, the drag on growth by country is expected to continue with
some moderate improvement on Q2 estimates in line with the above profile.
Effects will vary considerable by country according to the year-to-date performance.
For countries which do not report any year-to-date data, such as France, an
adjustment is added to the counterfactual forecast consistent with the regional
average. Spain is expected to shoulder a large burden, as over 15% of the fall in
Russian travel to European destinations will be felt there. This is consistent with the
sizable year to date fall in travel to this large, top-of-mind destination.
31Other countries which will experience large falls will unsurprisingly be the Eastern
destinations which also attract large volumes of Russian travellers. Poland will have
a notable impact following the strict imposition of sanctions.
The negative impact on Turkey relative to counterfactual is notable, although this
still involves some large growth over 2013 levels albeit moderately weaker than in
the counterfactual. Due to the very large size of Turkey as a destination for Russian
travel any small change in percentage growth rates will be associated with a large
number of people and a large share of any changes at the total European level.
Greece and Cyprus are assumed to continue to experience growth in line with the
counterfactual case, albeit form a higher level given the very positive trend in data
for 2014 to date.
In the charts on the following pages the expected scale of the change in Russian
arrivals by European destination is displayed. The scatter plot also shows the
expected difference as well market size. Those destinations in the bottom right
quadrant stand to lose the most as large destinations for Russian travel expected to
experience much lower arrivals than would otherwise be expected. These
destinations are all favoured by Russian travellers and are larger than average
destinations in terms of visits. Falls for these destinations, including Spain, Poland,
Czech Republic, and Finland will be more significant than the large changes in
arrivals for Sweden and Norway due to current reliance on the Russian market.
Note that upon initial inspection, a country’s position on the scatter graph might
wrongly suggest that that country is now seeing a fall in the numbers of arrivals from
Russia due to sanctions. However, because this chart shows the percentage
change in arrivals compared to our counterfactual outlook, this is not necessarily
true. In the case of Turkey for example, pre-crisis growth in arrivals from Russia was
expected to be 17.3% in 2014, but owing to more recent data this has since been
revised down to (a still very strong) 13.7%.
The same is also true for the bar chart which shows just the percentage change in
Russian arrivals, comparing the 2014 counterfactual level to new estimates for the
number of Russian arrivals in 2014 based on the impact of the current sanctions.
Under this scenario the level of Russian arrivals to ETC constituent countries is
expected to be 1.8 million lower in 2016 from our counterfactual estimate of 22.5
million to 20.6 million.
32Percentage change in Russian arrivals from counterfactual in 2014
Sizing of market is also considered based on no. of visits in 2014
35%
Serbia
25%
Cyprus
15%
% change
Hungary Greece
5%
Turkey
-5% Italy
Germany
Spain
-15% Finland Poland
Sweden Czech Rep.
Norway
-25%
0 500 1000 1500 2000 2500 3000 3500 4000 4500 5000
No. of visits (000s)
Percentage change in Russian arrivals from counterfactual in 2014
Based on the impacts of current sanctions
Norway
Czech Rep.
Sweden
Croatia
Romania
Poland
Finland
Belgium
Germany
Netherlands
Montenegro
Spain
France
Austria
Slovakia
Estonia
Malta
Luxembourg
Denmark
Italy
Bulgaria
Lithuania
Turkey
Switzerland
United Kingdom
Slovenia
Latvia
Hungary
Greece
Cyprus
Serbia
-30% -20% -10% 0% 10% 20% 30% 40%
% change
Source: Tourism Economics
333.1 Extended sanctions
The probability of some sort of escalation in the conflict, including increased
sanctions and a worse outcome than in the baseline, is valued by Oxford
Economics’ at around 30%, encompassing either this scenario outcome or the
worse conflict scenario.
Based on the observed impact of the current round of sanctions on Russia, this
scenario considers what would happen if all European countries uniformly adopted
more restrictive measures. This would give a further resulting fall in arrivals from
Russia from all countries and notably it is assumed that Turkey also imposes
sanctions giving one of the largest differences from the baseline.
In this scenario we see the majority of the effect in 2015 as the new sanctions would
take likely effect in late 2014 and effects would linger into the following year. The
estimated change in market share calculated to 2014 is assumed to persist further
into 2015 before some partial recovery in 2016. 2016 will only bear the residue of
the impacts as we expect sanctions and associated ill-sentiment to eventually be
forgotten about in the longer term.
The increased sanctions would likely deter Russian travel by a greater amount than
in the baseline outlook with a fall in arrivals expected for both 2014 and 2015 as a
whole. Arrivals would be almost 15% lower than counterfactual in 2014 and around
25% lower than counterfactual in both 2015 and 2016 as any growth is expected to
be consistent with baseline expansion, retaining the gap in terms of visits. In the
longer term, travel is still expected to converge to pre-crisis arrivals levels to some
extent as relationships normalise. This process will take much longer than in the
baseline outlook.
% change in Russian arrivals to Europe, increased sanctions
0.0%
2014 2015 2016
-5.0%
% change to counterfactual outlook
-10.0%
-15.0%
-20.0%
-25.0%
-30.0%
Source: Tourism Economics
34You can also read