Life-history characteristics of the eastern shovelnose ray, Aptychotrema rostrata (Shaw, 1794), from southern Queensland, Australia
←
→
Page content transcription
If your browser does not render page correctly, please read the page content below
CSIRO PUBLISHING

Marine and Freshwater Research, 2021, 72, 1280–1289
https://doi.org/10.1071/MF20347

     Life-history characteristics of the eastern shovelnose ray,
     Aptychotrema rostrata (Shaw, 1794), from southern
     Queensland, Australia

                              A,B,C
     Matthew J. Campbell            , Mark F. McLennan A, Anthony J. Courtney A and
                            B
     Colin A. Simpfendorfer
     A
       Queensland Department of Agriculture and Fisheries, Agri-Science Queensland, Ecosciences
       Precinct, GPO Box 267, Brisbane, Qld 4001, Australia.
     B
       Centre for Sustainable Tropical Fisheries and Aquaculture and College of Science and
       Engineering, James Cook University, 1 James Cook Drive, Townsville, Qld 4811, Australia.
     C
       Corresponding author. Email: matthew.campbell@daf.qld.gov.au

     Abstract. The eastern shovelnose ray (Aptychotrema rostrata) is a medium-sized coastal batoid endemic to the eastern
     coast of Australia. It is the most common elasmobranch incidentally caught in the Queensland east coast otter trawl fishery,
     Australia’s largest penaeid-trawl fishery. Despite this, age and growth studies on this species are lacking. The present study
     estimated the growth parameters and age-at-maturity for A. rostrata on the basis of sampling conducted in southern
     Queensland, Australia. This study showed that A. rostrata exhibits slow growth and late maturity, which are common life-
     history strategies among elasmobranchs. Length-at-age data were analysed within a Bayesian framework and the von
     Bertalanffy growth function (VBGF) best described these data. The growth parameters were estimated as L0 ¼ 193 mm
     TL, k ¼ 0.08 year1 and LN ¼ 924 mm TL. Age-at-maturity was found to be 13.3 years and 10.0 years for females and
     males respectively. The under-sampling of larger, older individuals was overcome by using informative priors, reducing
     bias in the growth and maturity estimates. As such, the results can be used to derive estimates of natural mortality for this
     species.

     Keywords: life history, growth, age-at-maturity, elasmobranch, Aptychotrema rostrata.

     Received 4 December 2020, accepted 26 March 2021, published online 7 May 2021

Introduction                                                           the QECTOF catch (Courtney et al. 2006; Courtney et al. 2008),
The Queensland east coast otter trawl fishery (QECOTF) is the          some of which are of conservation concern, such as sea turtles
largest penaeid-trawl fishery in Australia. This fishery targets       (McGilvray et al. 1999).
shrimps (Penaeidae: Melicertus spp., Penaeus spp., Metape-                 Elasmobranchs (i.e. sharks and rays) are one component of
naeus spp.), sea scallops (Pectinidae: Ylistrum balloti), bugs         penaeid-trawl discards that have received increasing attention in
(Scyllaridae: Thenus spp. and Ibacus spp.) and squid                   the past two decades (Dulvy et al. 2017). Elasmobranch life-
(Teuthoidea) with demersal otter trawl gear. In 2019, logbook          history strategies, including late maturity, few offspring, long
data indicated that 299 vessels fished 35 950 days and landed          life spans and slow growth (Dulvy et al. 2008), make this group
,5986 t of product for sale at both domestic and international         vulnerable to over-exploitation (Stevens et al. 2000). Twenty-
markets. Further, two vessels target stout whiting (Sillago            five per cent of elasmobranchs have an elevated risk of extinc-
robusta), using Danish seine and fish trawl gear, in southern          tion as a result of capture in fisheries (Dulvy et al. 2017;
Queensland and are subject to an annual total allowable catch          Simpfendorfer and Dulvy 2017) and the species of Rhinopris-
(TAC) of ,1100 t.                                                      tiformes (wedgefishes and guitarfishes) are of a particular
   It has been estimated that 55% of the global catch from             concern (Kyne et al. 2020). The introduction of turtle excluder
penaeid trawls is discarded (Gilman et al. 2020). The discard          devices (TEDs) has gone some way to reduce this risk in
rate from the QECOTF is higher at 70%, resulting in .25 000 t          penaeid-trawl fisheries, particularly for larger species: however,
being discarded annually (Wang et al. 2020), representing              TEDs remain ineffective for smaller elasmobranchs (Campbell
28.5% of Australia’s total annual discards (Kennelly 2020).            et al. 2020).
Consequently, quantifying and mitigating discards have been                The TEDs used in the QECOTF have no effect on the catch
the subjects of significant research efforts in Queensland since       rate of the eastern shovelnose ray (Trygonorrhinidae: Aptycho-
the mid-1990s (e.g. Robins-Troeger 1994; Robins and McGilv-            trema rostrata, Shaw 1794; Courtney et al. 2008). This is the
ray 1999). Hundreds of species comprise the discarded potion of        most common elasmobranch in the discarded portion of the

Journal compilation Ó CSIRO 2021 Open Access CC BY                                                       www.publish.csiro.au/journals/mfr
Ó The State of Queensland (through the Department of Agriculture and Fisheries Queensland) [2021] and The Authors 2021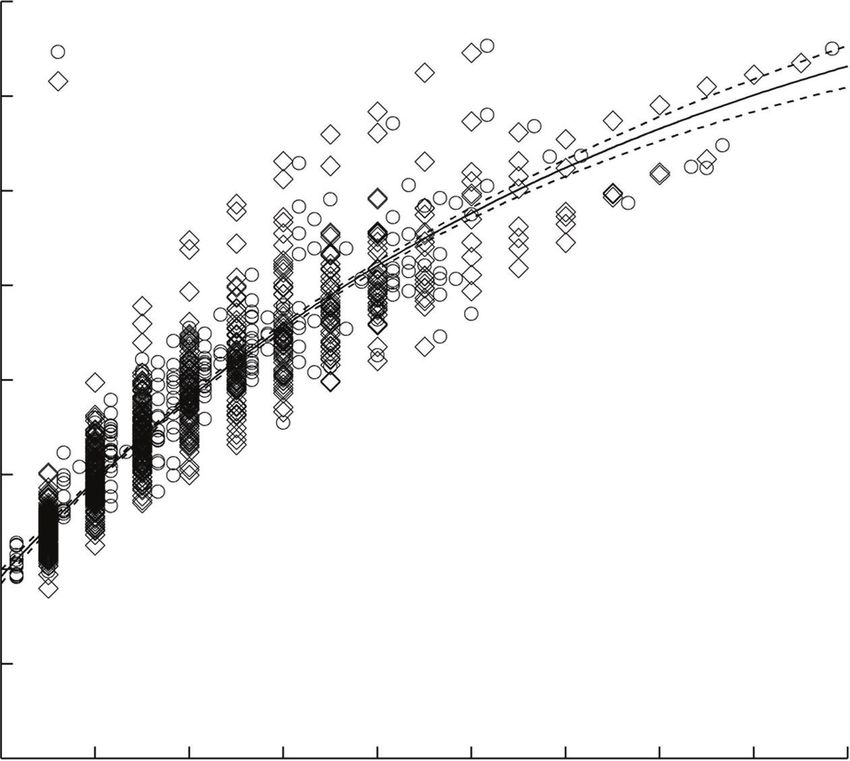
Life history of A. rostrata in Queensland                                                      Marine and Freshwater Research         1281

penaeid-trawl (Kyne et al. 2002) and S. robusta (Rowsell and         the period between April 2016 and November 2017. The
Davies 2012) catches in southern Queensland (.228S). Apty-           San Antone II is a 17 m steel twin-hulled vessel powered by two
chotrema rostrata is endemic to the eastern coast of Australia       148 kW diesel engines. The Danish seine gear consisted of two
between Halifax Bay in northern Queensland (188300 S) and            2500 m sweeps separated by a single net with a headline length
Merimbula in southern New South Wales (368530 S). The species        of 34.75 m, with a mesh size of 85 mm in the wings and 55 mm in
rarely exceeds 1 m total length (TL), generally in depths of         the codend. Samples were collected in southern Queensland
,100 m (Last and Stevens 2009), and feeds on crustaceans,            waters between Sandy Cape (24842.0430 S, 153816.0270 E) and
teleost fish and squid (Kyne and Bennett 2002a). In southern         Coolangatta (28809.8440 S, 153832.9420 E) in depths between
Queensland, parturition occurs in November and December              35 and 50 m. During commercial operations, A. rostrata indi-
after a gestation period of 3–5 months, with litter sizes of         viduals were removed from the catch and stored whole in the
4–18 pups (Last et al. 2016).                                        vessel’s freezer for processing in the laboratory.
    In Queensland, the incidental capture of A. rostrata in the          Sample collection on the San Antone II was supplemented by
QECOTF is the main source of fishing mortality, although post-       specimens obtained during the post-trawl survival (PTS) experi-
release survival is high (Campbell et al. 2018). In 2010, the two    ments conducted by Campbell et al. (2018).
vessels targeting S. robusta caught 3075 A. rostrata individuals,
of which ,22% were released alive (Rowsell and Davies 2012).         Laboratory processing
Recreational anglers land A. rostrata (Kyne and Stevens 2015);       All A. rostrata individuals were thawed, sexed, weighed
however, the catch is negligible in Queensland (J. Webley,           (0.01 g) and measured (total length, TL, 0.1 cm). In accor-
Fisheries Queensland, pers. comm.).                                  dance with Pierce and Bennett (2009), a segment of four or five
    Despite its frequent occurrence in trawl catches, age and        vertebrae, located at the posterior of the abdominal cavity, was
growth studies on A. rostrata are lacking. Diet (Kyne and            excised. Each segment was cleaned following Goldman et al.
Bennett 2002a), dentition (Gutteridge and Bennett 2014), sen-        (2004) and air dried. The neural and haemal arches were
sory characteristics (Hart et al. 2004; Wueringer et al. 2009) and   removed, along with any remnant connective tissue. After dry-
post-trawl survival (Campbell et al. 2018) have been the subject     ing, each segment was embedded in polyester resin and sec-
of recent research. Although reproductive strategies were            tioned with a Buehler IsoMet Low Speed cutting saw (www.
described in two studies (Kyne and Bennett 2002b; Kyne               buehler.com/isoMet-low-speed-cutter.php), at a width of
et al. 2016), no previous study has quantified growth and age-       ,200 mm, and mounted on a microscope slide. The vertebral
at-maturity.                                                         sections were examined with a Leica M60 stereo microscope
    The lack of these data and the absence of information            (www.leica-microsystems.com/products/stereo-microscopes-
regarding the number of A. rostrata individuals caught annually      macroscopes/p/leica-m80/) under reflected light on a matt black
are the main impediments for the assessment of population            background, and photographed with a Leica IC90 E digital
status. Currently, the IUCN Red List of Threatened Species           camera (www.leica-microsystems.com/products/microscope-
categorises A. rostrata as ‘Least Concern’ (Kyne and Stevens         cameras/p/leica-ic90-e/).
2015). In Australia, all fisheries are subject to environmental         The maturity of each individual was assessed according to
assessment, whereby jurisdictions are required to demonstrate        Kyne et al. (2016). Maturity in males depended on the calcifi-
that the impacts on individual species, both target and non-         cation of the claspers, categorised as immature (possessing
target, are sustainable in the long-term. Failure to do so can       short, flexible, uncalcified claspers) or mature (rigid, calcified
result in the revocation of export privileges, prohibiting access    and elongated claspers). A mature female A. rostrata possessed
to lucrative international markets.                                  one or more of the following: developed ovaries with yellow
    Previous qualitative ecological risk assessments (ERAs)          vitellogenic follicles of $5 mm diameter, fully developed
have indicated that trawling in Queensland (Pears et al. 2012;       oviducal glands and uteri, uterine eggs, and embryos in situ.
Jacobsen et al. 2018) and New South Wales (Astles et al. 2009)       Immature females were categorised by undifferentiated ovaries,
poses a high ecological risk to A. rostrata in the respective        undeveloped oviducal glands and thin uteri.
jurisdictions. These ERAs rely on qualitative assessments of a
species’ exposure and resilience to trawling, rather than empiri-    Ageing
cal data, to assess risk. Generally, qualitative ERAs overesti-      Nominal age was estimated by two readers on the basis of the
mate the ecological risk posed by fishing than the quantitative      number of band pairs. A band pair was defined following Fig. 1c
ERAs when compared with results from formal stock assess-            from Rolim et al. (2020) as one (narrow) translucent band and one
ments (Zhou et al. 2016). As such, life-history data are funda-      wide (opaque) band, combined. Initially, the birth mark was
mental to assessing stock status and form the basis of               defined as an angle change along the corpus calcareum (White
quantitative ERAs, an improved method for assessing data-            et al. 2014), associated with the first distinct opaque band after the
poor species such as A. rostrata. The aim of the present study,      focus (called the ‘birth mark’, Campana 2014). However, pre-
therefore, was to estimate the growth parameters and age-at-         liminary investigation showed that the birth mark and the change
maturity of A. rostrata.                                             of angle was absent or difficult to identify in a high proportion of
                                                                     individuals. As such, the first growth band (i.e. 1 year of age) was
Materials and methods                                                identified using a method described by Campana (2014). The
Specimens of A. rostrata were primarily obtained from the            mean distance between the waist and distal edge of the first
operator of a Danish seine vessel, the FV San Antone II, tar-        growth band was calculated by measuring this distance for those
geting S. robusta in southern Queensland on an ad hoc basis in       1-year-old animals (,,25 cm TL) where the birthmark was
1282 Marine and Freshwater Research M. J. Campbell et al.
0.25
Females, n = 102
Males, n = 110
0.20
0.15
Proportion
0.10
0.05
150 200 250 300 350 400 450 500 550 600 650 700 750 800
Total length (mm)
Fig. 1. Length–frequency (TL, cm) distribution for 212 Aptychotrema rostrata individuals caught in
south-eastern Queensland, Australia, between April 2016 and November 2017, as a function of sex.
visible. This distance was measured with the Leica Application ‘wide’. A ‘new’ edge was one where an opaque zone occurred at
Suite software associated with the camera used to view centrum the distal edge of the centrum irrespective of the width of the
images. A line of this length was superimposed on the image of opaque band. An edge of a centrum with any translucence visible
each sectioned centrum to determine the expected location of the beyond the last complete band pair was categorised as ‘interme-
first complete opaque band after the birth mark. diate’ and an edge was classified as ‘wide’ if the width of the
Counts were made without knowledge of the size or sex of translucent band beyond the last complete band pair was $2/3 the
the animal and the readability of each section was qualitatively width of the previous translucent band. A chi-square test was used
assessed in accord with Officer et al. (1996). Where counts to compare the observed frequency of each edge type, as a
differed between readers, the count by the experienced reader function of month, with the expected frequencies. In this case,
was accepted. The following three measures of precision were the null hypothesis of the test was that the frequency of edge type
calculated to assess consistency between readers: (1) percentage was not dependent on month of capture.
agreement (PA); (2) average percentage error (APE, Beamish
and Fournier 1981); and (3) average coefficient of variation Growth
(ACV, Chang 1982). Further, Bowker’s test of symmetry was Band pair counts (i.e. nominal age) were adjusted for growth
used to assess bias among readers. beyond the last complete band pair on the basis of edge type
(Pierce and Bennett 2009). Nominal age was increased by
Marginal increment ratio (MIR) 0.33 year for intermediate edges and by 0.66 year for wide edges.
To determine the periodicity of band formation, monthly MIR Initial analysis indicated that younger individuals were
was calculated following Natanson et al. (1995), who defined under-sampled. As such, back-calculation techniques were used
MIR as MIR ¼ (CR – CRn) / (CRn – CRn–1), where CR is the to increase the sample size of smaller size classes. The linear-
centrum radius, CRn is the radius of the final complete band pair modified Dahl–Lea method (Francis 1990) was used to estimate
and CRn–1 is the radius of the next to last complete band pair. the total length (La) of each individual at age a, as follows:
Given this method, MIR was calculated only for animals aged
$2 years. Following (Simpfendorfer et al. 2000), MIR was b þ mCRa
La ¼ Lc
compared among months using the Kruskal–Wallis one-way b þ mCRc
analysis of variance on ranks.
Edge type was qualitatively assessed to provide further evi- where Lc is the length at capture; CRa is the centrum radius at
dence of band formation periodicity (Cailliet et al. 2006) and was age a; CRc is the centrum radius at capture; and b and m are the
classified into three levels, namely, ‘new’, ‘intermediate’ and coefficients of the linear regression between CRc and Lc. ThisLife history of A. rostrata in Queensland Marine and Freshwater Research 1283
method was preferred to the Dahl–Lea direct proportions the ‘Bayesplot’ package (Gabry 2020; accessed 18 February
method because the CRc – Lc relationship did not pass through 2021) in R.
the origin (Goldman 2005). Following Goldman (2005), the The models were fit with a normal residual error structure
quadratic-modified Dahl–Lea method (Francis 1990) was used (s). Prior distributions for the L0 and LN estimates were
for comparison with the linear-modified Dahl–Lea method to informed by data published by Last et al. (2016). These authors
determine the most appropriate approach for estimating La as a reported the maximum size of A. rostrata as 1200 mm TL and
function of CRa. Francis (1990) defined the quadratic-modified with a length-at-birth (L0) of 130–150 mm TL. Given this
Dahl–Lea equation as information, priors were set at LN ,N(1200, 50) and L0 ,
N(140, 10). A non-informative prior was used for s and a
d þ eCRa þ fCRa 2 common non-informative prior was used for the growth coeffi-
La ¼ Lc cients of candidate models (k, g1 and g2, Table 1). An upper
d þ eCRc þ fCRc 2
bound was nominated for the uniform distributions of s and k
where d, e and f are the quadratic regression estimates. The mean of 100 and 0.3 year1 respectively. The common non-
observed lengths and the mean back-calculated lengths, as a informative prior for the growth coefficients allowed for
function of age, were compared using two-sample Student’s comparison of the three candidate growth functions, each with
t-tests where sample size permitted. In this case, the observed identical priors. Leave-one-out-information-criterion weights
lengths were restricted to those animals where new or interme- (LOOICw), calculated within the ‘BayesGrowth’ package
diate edges occurred at the distal edge of the centrum. using the ‘loo’ R package (Vehtari et al. 2020), were used to
In accord with Smart et al. (2016), the following three growth determine the most appropriate candidate model. As with the
functions were used to estimate mean length-at-age: von Berta- Akaike weights in the frequentist approach, the candidate
lanffy growth function (VBGF), logistic function and Gompertz model with the highest LOOICw was considered the most
function (Table 1). In all instances, the biologically relevant appropriate.
length-at-birth (L0) was estimated, rather than the age when
length is zero (i.e. t0), as recommended for elasmobranchs by Maturity
Cailliet et al. (2006). Relevant parameters were estimated via To overcome the under-sampling of larger, older animals,
non-linear least-squares regression: however, the under- Beverton–Holt life-history invariants (BH–LHI) were used to
sampling of larger individuals resulted in an under-estimate of estimate of age-at-maturity (t50) and length-at-maturity (L50).
LN. As such, a Bayesian approach using Markov-chain Monte Life-history ratios described by Jensen (1996) and Frisk et al.
Carlo (MCMC) was used to estimate biologically appropriate (2001) were used to estimate t50 and L50 by using natural mor-
growth parameters (Emmons et al. 2021). tality (M) and the previously defined k and LN (L50/LN ¼ 0.66,
Bayesian models were fit using the ‘BayesGrowth’ package ln(M) ¼ 0.42 ln(k) – 0.83 and M t50 ¼ 1.65).
(Smart 2020; accessed 18 February 2021), by using R statistical
software (ver. 3.6.1, R Foundation for Statistical Computing, Results
Vienna, Austria, see https://www.R-project.org/, accessed 18 Overall, 214 A. rostrata individuals were collected to assess
February 2021), in accord with methods described by Smart growth; 142 were collected by the crew of the San Antone II and
and Grammer (2021) and Emmons et al. (2021). The ‘Bayes- 72 were collected as part of the PTS experiments conducted by
Growth’ package uses the ‘Stan’ computer program (Carpenter Campbell et al. (2018). The animals caught during the PTS
et al. 2017), via the ‘Rstan’ package (Stan Development Team experiments had significantly smaller TL than those caught on
2020) to perform MCMC using no U-turn sampling (NUTS). the San Antone II (t ¼ –4.180, d.f. ¼ 166.7, P , 0.001). Two
Four MCMC chains with 10 000 simulations, with a burn-in animals were excluded from the analysis, because age could not
period of 5000 simulations, were used to determine parameter be determined from the respective vertebral centra. Of the 212
posterior distributions. Model convergence was assessed using animals assessed for growth, 102 were female with a mean TL of
the Gelman–Rubin test and diagnostic plots generated using 403 mm (s.e. ¼ 11.00, range ¼ 192753) and 110 were male
with a mean TL of 413 mm (s.e. ¼ 11.16, range ¼ 193671).
No significant difference in size was detected between sexes
Table 1. Equations of the three candidate growth functions used to (t ¼ –0.670, d.f. ¼ 209.9, P ¼ 0.504; Fig. 1).
assess the growth of 212 Aptychotrema rostrata individuals caught in
south-eastern Queensland, Australia, between April 2016 and Novem- Ageing
ber 2017 Generally, ageing between readers was consistent
Lt, the length at Age t; LN, the asymptotic length; L0, the length at t ¼ 0; and
(PA ¼ 82.67%, ACV ¼ 4.21, APE ¼ 2.97), with the age bias plot
k, g1 and g2, coefficients of the respective growth functions to be estimated
showing little variation from the 1:1 line of equivalence
(Supplementary material Fig. S1, available at the journal’s
Model Growth function
website). Further, Bowker’s test of symmetry showed no
Von Bertlanffy Lt ¼ L0 þ ðL1 L0 Þ 1 ekt
between-reader bias (x2 ¼ 13.93, d.f. ¼ 12, P ¼ 0.305). The
Ln L1
ð1eg1 t Þ nominal age (i.e. the number of complete band pairs) range of
Lt ¼ L0 e
L0
Gompertz function males and females was 0–15 years and 0–17 years respectively.
L1 L0 eðg2 tÞ
Logistic function Lt ¼ The oldest female was 750 mm TL and the two males assigned
L1 L0 eðg2 t1Þ
the nominal age of 15 years were 624 and 648 mm TL.1284 Marine and Freshwater Research M. J. Campbell et al.
Marginal increment ratio whereas the youngest mature animals were 6 years. Using the
Marginal increment ratio was lowest during August and Sep- BH–LHI described by Jensen (1996) and Frisk et al. (2001), age-
tember (Fig. S2). New edges were also most likely to occur at-maturity for both sexes combined was 10.9 years, and 13.3
during these months. The Kruskal–Wallis test on ranks indicated and 10.0 years for females and males respectively. Further,
that MIR varied significantly among months (x2 ¼ 23.927, length-at-maturity was 609 mm TL for both sexes combined,
d.f. ¼ 4, P , 0.001). Mean MIR decreased from March through and 753 and 555 mm TL for females and males respectively.
to August, before increasing in September. The highest mean
MIR occurred in November, at the end of the austral spring. Discussion
Wide edges were also most likely to occur in November; The results from the current study represent the first estimates of
however, the frequency of each edge type was not dependent on growth and age-at-maturity published in the primary literature
the month (x2 ¼ 12.67, d.f. ¼ 8, P ¼ 0.124). for A. rostrata. Slow growth and late maturity are common
among elasmobranchs (Dulvy et al. 2008), making this group
Growth vulnerable to over-exploitation (Stevens et al. 2000). These
characteristics, combined with intense fishing pressure, have
The relationship between TL and CR was best described
resulted in an increasing concern for Rhinopristiformes, many of
by the quadratic-modified Dahl–Lea method
which are at an extremely high risk of extinction (Kyne et al.
(TL ¼ 0.038CR2 þ 12.312CR 17.01, R2 ¼ 0.964). Back-
2020). The landings and catch rates of Rhinopristiformes spe-
calculated and observed lengths-at-age were not significantly
cies have declined by up to 80% throughout most of their ranges
different (Supplementary material Table S1). As such, the
(D’Alberto et al. 2019); however, a combination of reduced
observed and back-calculated data were combined, resulting in a
fishing pressure, prohibiting the retention of shark products and
dataset containing 1112 measures of length-at-age.
networks of marine protected areas have been shown to mitigate
The VBGF was found to best fit the length-at-age data
risk for this group (Kyne et al. 2020). This is especially the case
(Table 2, LOOICw ¼ 1). There was no support for either the
for A. rostrata, which is considered abundant because of its
Gompertz (LOOICw ¼ 0) or the Logistic (LOOICw ¼ 0) growth
diverse habitat use and the extent of refuges across its range
functions. With the sexes combined, the estimated VBGF
(Kyne and Stevens 2015). Significant reduction in shrimp trawl
parameters were LN ¼ 923 mm TL, L0 ¼ 193 mm TL and
effort since 2000 (Wang et al. 2020) is also likely to have had a
k ¼ 0.08 year1 (Table 2, Fig. 2, Fig. S3). Estimates of LN and
positive effect on the species’ abundance in Queensland.
L0 were higher for females (1141 and 193 mm respectively) than
These factors ensure the continued high levels of abundance
males (813 and 187 mm respectively; Fig. 3). The growth
in Queensland despite this species’ low productivity. Delayed
coefficient for females (k ¼ 0.05 year1) was half of that for
maturity and small maximum size imply a low maximum
males (k ¼ 0.10 year1).
intrinsic population growth rate (rmax) in Rhinopristiformes
(D’Alberto et al. 2019). These authors evaluated population
Maturity productivity in nine Rhinopristiformes and concluded that the
Of the 212 A. rostrata individuals used to assess growth, only trygonorrhinids exhibit low rmax values compared with larger
nine females and nine males were sexually mature. The oldest species such as the giant shovelnose ray (Glaucostegus typus)
immature animals (female and male) were .10 years of age, and bottlenose wedgefish (Rhynchobatus australiae), both of
Table 2. Relative performance and mean parameter estimates for the three candidate growth functions used to assess the growth of
212 Aptychotrema rostrata individuals caught in south-eastern Queensland, Australia, between April 2016 and November 2017
After back-calculation, a total of 1112 length-at-age measures was assessed. The parameter estimates shown are the mean values of the posterior distributions of
the respective parameters generated by the ‘BayesGrowth’ package via R statistical software. LOOIC, the leave-one-out-information-criterion; LOOICw, the
LOOIC weights; LN, the asymptotic length; L0, the length at t ¼ 0; k and g, the growth coefficients of the von Bertalanffy, Gompertz and Logistic functions (see
Table 1); and s, the estimated residual error. Numbers in parentheses are the 95% credible intervals of the respective parameters from their posterior
distributions
Function LOOIC LOOICw LN (mm) L0 (mm) k/g (year1) s
von Bertlanffy
All 11 428.5 1 923 (843–953) 193 (185–200) 0.08 (0.06–0.09) 40.8 (39.2–42.6)
Female 1141 (1047–1175) 190 (183–197) 0.05 (0.05–0.06) 40.0 (37.7–42.6)
Male 813 (724–934) 187 (175–199) 0.10 (0.07–0.12) 40.6 (38.2–42.2)
Gompertz
All 11 442.9 0 726 (691–766) 202 (195–208) 0.17 (0.16–0.19) 41.0 (39.3–42.7)
Female 985 (895–1083) 210 (203–217) 0.11 (0.10–0.13) 40.9 (38.5–43.5)
Male 652 (622–687) 192 (183–201) 0.22 (0.19–0.24) 40.2 (37.9–42.6)
Logistic
All 11 452.3 0 666 (643–692) 210 (204–215) 0.27 (0.25–0.28) 41.4 (39.8–43.2)
Female 853 (786–931) 218 (211–226) 0.20 (0.18–0.22) 41.4 (39.0–44.1
Male 631 (618–648) 207 (202–212) 0.29 (0.28–0.30) 40.6 (38.3–41.3)Life history of A. rostrata in Queensland Marine and Freshwater Research 1285
800
Observed
Back-transformed
700
600
500
Total length (mm)
400
300
200
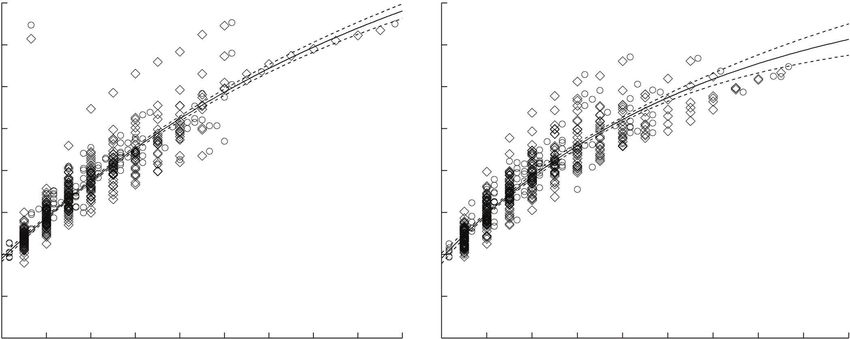
100 L• = 924 mm; k = 0.08 year–1; L0 = 193 mm; n = 1112
0 2 4 6 8 10 12 14 16 18
Adjusted age (years)
Fig. 2. Von Bertalanffy growth curve for 212 Aptychotrema rostrata individuals caught in
south-eastern Queensland, Australia, between April 2016 and November 2017. Shown are both
the observed and back-calculated lengths-at-age, which resulted in 1112 measures of length-at-
age. Priors were set at LN ,N(1200, 50) and L0 ,N(140, 10). Dashed lines represent 95%
credible intervals.
(a) (b)
800 Female Male
Observed
700 Back-transformed
600
Total length (mm)
500
400
300
200
100 L• = 1141 mm; k = 0.05 year–1; L0 = 193 mm; n = 533 L• = 813 mm; k = 0.10 year–1; L0 = 187 mm; n = 579
0 2 4 6 8 10 12 14 16 18 0 2 4 6 8 10 12 14 16 18
Adjusted age (years)
Fig. 3. Von Bertalanffy growth curve for (a) female and (b) male Aptychotrema rostrata individuals caught in south-eastern Queensland, Australia,
between April 2016 and November 2017. Shown are both the observed and back-calculated lengths-at-age, which resulted in 533 and 579 measures of
length-at-age for females and males respectively. Priors were set at LN ,N(1200, 50) and L0 ,N(140, 10) for both sexes. Dashed lines represent 95%
credible intervals.
which co-occur with A. rostrata. This is due to the ability of productivity and the t50 derived for A. rostrata using the BH–
these larger species to produce numerous and large offspring. LHI is higher than the estimates for all nine species assessed by
Age-at-maturity was also found to be negatively correlated with D’Alberto et al. (2019).1286 Marine and Freshwater Research M. J. Campbell et al.
Maximum intrinsic population growth rate was calculated Sexual bimaturism is a common life-history strategy among
for only nine species of Rhinopristiformes because of the lack of viviparous elasmobranchs (Colonello et al. 2020) because of
reliable life-history information. Only three of the eight species less investment by females in growth to compensate for attain-
that comprise Trygonorrhinidae have published growth infor- ing a larger size to support pups (Cortés 2000). The higher L50
mation, namely, southern fiddler ray (Trygonorrhina dumerilii), and t50 derived here for female A. rostrata are consistent with
shortnose guitarfish (Zapteryx brevirostris) and banded guitar- Kyne et al. (2016), who estimated a higher L50 for female
fish (Zapteryx exasperata). The VBGF growth coefficient A. rostrata. Similarly, Jones et al. (2010) reported a higher L50
derived in the current study, k ¼ 0.08 year1, is lower than for females for the congeneric A. vincentiana caught in southern
any of those published for Trygonorrhinidae. Values of k have Western Australia. Delayed female maturity has been reported
been published for T. dumerilii and Z. brevirostris at 0.13 year1 for the confamilial banded guitarfish (Zapteryx exasperate)
(Izzo and Gillanders 2008) and 0.12 year1 (Carmo et al. 2018) caught in Mexico (Cervantes-Gutiérrez et al. 2018).
respectively. Cervantes-Gutiérrez et al. (2018) reported a higher The MIR analysis suggested that band pair formation occurs
growth coefficient for male and female Z. exasperata of annually. Ideally, sampling should have occurred throughout the
k ¼ 0.174 year1 and k ¼ 0.144 year1 respectively. Addition- year to ensure a complete analysis of the periodicity of band pair
ally, Caltabellotta et al. (2019) reported faster growth in the formation; however, the seasonal nature of fisheries that catch
smaller Z. brevirostris of k ¼ 0.24 year1. A. rostrata as by-catch resulted in irregular access to samples
Only T. dumerilii has a higher published estimate of LN than during the study period. Similarly, Cervantes-Gutiérrez et al.
that presented here. Izzo and Gillanders (2008) reported an LN (2018) reported that fishery closures hampered year-round
for T. dumerilii of 1129 mm TL for females and males combined. sampling of Z. exasperata in Mexico and published incomplete
The LN (1157 mm TL) for female T. dumerilii is similar to that measures of marginal increments; however, these authors
derived in the current study for female A. rostrata (1141 mm TL), assumed annual band pair formation when quantifying growth.
despite T. dumerilii reaching a higher maximum size (1460 mm Caltabellotta et al. (2019) suggested annual band formation for
TL, Last et al. 2016). Cervantes-Gutiérrez et al. (2018) reported Z. brevirostris by using MIR and, like in the previous studies on
estimates of LN for female and male Z. exasperata of 1007 mm the growth of trygonorrhinids (Izzo and Gillanders 2008; Carmo
and 898 mm respectively. In contrast, Caltabellotta et al. (2019) et al. 2018), this assumption is also reasonable for A. rostrata.
reported an LN of 624 mm and 602 mm for female and male The minimum MIR occurred in August, indicating a period of
Z. brevirostris, whereas Carmo et al. (2018) derived smaller slow somatic growth coinciding with minimum monthly mean
values of 56.0 cm and 50.4 cm respectively. In accord with other sea-surface temperature (Meynecke and Lee 2011) and high
elasmobranchs, the published estimates of LN for the trygonor- reproductive activity (Kyne et al. 2016). The chi-square test
rhinids were higher for females; Cortés (2000) found that the conducted on the edge frequency data somewhat contradicted
maximum size of males was, on average, ,10% smaller than that the results from the MIR analysis and, as such, further sampling
of females in 164 shark species. should be undertaken throughout the year to confirm that band
Kyne et al. (2016) reported an L50 for male A. rostrata of pair formation occurs annually.
597.3 mm. This is comparable to the present study: however, The back-calculated lengths-at-age were not significantly
their L50 for females (639.5 mm) is lower than the L50 reported different from the observed values. However, the mean back-
here. This difference in L50 may be a result of using the BH– calculated lengths were higher than the observed mean lengths
LHIs calculated using the estimates of k and LN derived here. for ages 0–6 years because of the inclusion of those vertebral
The under-sampling of large, mature females resulted in biased centra where intermediate edges were observed. The low
estimates of female L50, necessitating the use of the BH–LHI. number of vertebral centra with new edges at each age
This under-sampling may have been due to the selectivity of the necessitated the inclusion of the centra with intermediate edges
sampling gears used in the respective studies. Kyne et al. (2016) for robust comparison between back-calculated and observed
conducted sampling using shrimp (Melicertus plebejus) trawls lengths-at-age.
in water depths to 100 m. In contrast, samples in the present The under-sampling of older animals resulted in biased growth
study were predominantly (67%) collected on the San Antone II, parameter estimates. However, estimating the VBGF parameters
which deploys Danish seine gear to target S. robusta in water of in a Bayesian framework allowed for the use of informed priors to
,50 m. The Danish seine used in this fishery is characterised by estimate LN, overcoming the lack of larger animals sampled.
slow haul speeds and short haul times (Rowsell and Davies Similarly, back-calculation increases the number of measures of
2012), which may allow larger A. rostrata to escape capture. length-at-age for smaller size classes, resulting in improved
The difference in water depth is unlikely to be the cause of the growth parameter estimates for elasmobranchs where age data
under-sampling of large animals. Kyne and Bennett (2002b) are sparse for smaller individuals (e.g. Smart et al. 2013;
collected A. rostrata individuals from Moreton Bay, adjacent to D’Alberto et al. 2017; Carmo et al. 2018). These two techniques
the grounds in the current study, and reported that 41 of 48 allowed for the estimation of reasonable growth parameters for
(,85%) females sampled were mature. These authors used rod- use in assessing the population status of A. rostrata.
and-reel in water depths of 3–10 m and reported a female L50 Various methods correlate k and LN to natural mortality
similar to that in Kyne et al. (2016). The number of mature (M, e.g. Pauly 1980; Frisk et al. 2001; Then et al. 2015). As such,
females was higher than from the current study; only 9 of the 102 biased estimates of growth result in biased estimates of M
females caught aboard the San Antone II were mature and no (D’Alberto et al. 2019), leading to inaccurate assessments of
mature animals were collected during the PTS experiments stock status (Pardo et al. 2013). Estimating growth parameters in
conducted by Campbell et al. (2018). a Bayesian framework overcomes this bias (Smart and GrammerLife history of A. rostrata in Queensland Marine and Freshwater Research 1287
2021). Campbell et al. (2017) quantified the ecological risk assistance is gratefully acknowledged. Sophie Eammons provided an earlier
posed to A. rostrata by the ECOTF, by using the sustainability version of her tiger shark growth study, which helped in the analysis of the
assessment for fishing effects (SAFE) quantitative ERA devel- length-at age data here. We sincerely thank Zalee Bates and Pat Abbott for
oped by (Zhou et al. 2009). In this instance, risk was quantified their continued diligence in sourcing and supplying relevant literature. We
via comparison between the level of fishing mortality (F) and thank two reviewers whose comments and suggestions improved this paper.
This work was authorised under the Queensland Department of Agriculture
the maximum sustainable fishing mortality (Fmsm), where
and Fisheries General Fisheries Permit number 186281, The Queensland
Fmsm ¼ 0.41M (Zhou et al. 2012). Hence, the growth parameter National Parks and Wildlife Marine Parks permit QS2015/MAN322, and the
estimates derived here allow for the calculation of unbiased Queensland Animal Ethics Approval Number CA2015/06/867.
estimates M and Fmsm, which enable the accurate assessment of
the population status.
References
Campbell et al. (2017) assessed the risk posed to 47 elasmo-
branchs, only 18 of which had published growth estimates. Of Astles, K. L., Gibbs, P. J., Steffe, A. S., and Green, M. (2009). A qualitative
risk-based assessment of impacts on marine habitats and harvested
these 18, growth was quantified for seven species on the basis of
species for a data deficient wild capture fishery. Biological Conservation
samples collected within the study area. This reinforces the need 142(11), 2759–2773. doi:10.1016/J.BIOCON.2009.07.006
for basic life-history data to inform fishery impacts in batoids Beamish, R., and Fournier, D. (1981). A method for comparing the precision
(Kyne 2016) and elasmobranchs in general. In the absence of of a set of age determinations. Canadian Journal of Fisheries and
life-history information, previous studies (Zhou et al. 2013; Aquatic Sciences 38(8), 982–983. doi:10.1139/F81-132
Zhou et al. 2015) have used the ‘Life History Tool’ on the Cailliet, G. M., Smith, W. D., Mollet, H. F., and Goldman, K. J. (2006). Age
Fishbase website (www.fishbase.se) to determine values for M. and growth studies of chondrichthyan fishes: the need for consistency in
There is a need, therefore, to increase knowledge of life-history terminology, verification, validation, and growth function fitting. Envi-
information to ensure the accurate assessment of fishery impacts ronmental Biology of Fishes 77(3–4), 211–228. doi:10.1007/S10641-
on elasmobranchs with sparse catch data. 006-9105-5
Caltabellotta, F. P., Siders, Z. A., Murie, D. J., Motta, F. S., Cailliet, G. M.,
In conclusion, the current study has contributed to the
and Gadig, O. B. F. (2019). Age and growth of three endemic threatened
scientific knowledge of A. rostrata, and Rhinopristiformes more guitarfishes Pseudobatos horkelii, P. percellens and Zapteryx breviros-
broadly. Consistent with other elasmobranchs, A. rostrata tris in the western South Atlantic Ocean. Journal of Fish Biology 95(5),
exhibits slow growth, late maturity and a long lifespan. Despite 1236–1248. doi:10.1111/JFB.14123
this, the species is abundant in Queensland owing to its diverse Campana, S. E. (2014). ‘Age determination of elasmobranchs, with special
habitat use and the extent of refuges throughout its range. This reference to Mediterranean species: a technical manual. Studies and
result contrasts with other Rhinopristiformes, many of which are Reviews.’ (General Fisheries Commission for the Mediterranean:
at a high risk of extinction. The life-history characteristics Rome, Italy.)
derived from this research can be used in future studies to Campbell, M., Courtney, T., Wang, N., McLennan, M., and Zhou, S. (2017).
determine population status and inform management decisions. Estimating the impacts of management changes on bycatch reduction and
sustainability of high-risk bycatch species in the Queensland East Coast
Otter Trawl Fishery: final report for FRDC Project no. 2015/014. Queens-
Conflicts of interest land Department of Agriculture and Fisheries, Brisbane, Qld, Australia.
Colin Simpfendorfer is an Associate Editor for Marine and Available at http://frdc.com.au/Archived-Reports/FRDC%20Projects/
Freshwater Research. Despite this relationship, he did not at any 2015-014-DLD.pdf
Campbell, M. J., McLennan, M. F., Courtney, A. J., and Simpfendorfer, C. A.
stage have Associate Editor-level access to this manuscript
(2018). Post-release survival of two elasmobranchs, the eastern shovelnose
while in peer review, as is the standard practice when handling ray (Aptychotrema rostrata) and the common stingaree (Trygonoptera
manuscripts submitted by an editor to this journal. Marine and testacea), discarded from a prawn trawl fishery in southern Queensland,
Freshwater Research encourages its editors to publish in the Australia. Marine and Freshwater Research 69(4), 551–561. doi:10.1071/
journal and they are kept totally separate from the decision- MF17161
making process for their manuscripts. The authors declare that Campbell, M. J., Tonks, M. L., Miller, M., Brewer, D. T., Courtney, A. J.,
they have no further conflicts of interest. and Simpfendorfer, C. A. (2020). Factors affecting elasmobranch escape
from turtle excluder devices (TEDs) in a tropical penaeid-trawl fishery.
Fisheries Research 224, 105456. doi:10.1016/J.FISHRES.2019.105456
Declaration of funding
Carmo, W. P., Fávaro, L. F., and Coelho, R. (2018). Age and growth of
The Fisheries Research and Development Corporation (FRDC Zapteryx brevirostris (Elasmobranchii: Rhinobatidae) in southern Bra-
Project Number 2015/014) and the Queensland Department of zil. Neotropical Ichthyology 16(1), e170005. doi:10.1590/1982-0224-
Agriculture and Fisheries provided the funding for this work. 20170005
Our thanks go to these institutions for their continued support for Carpenter, B., Gelman, A., Hoffman, M. D., Lee, D., Goodrich, B.,
fisheries research. Betancourt, M., Brubaker, M., Guo, J., Li, P., and Riddell, A. (2017).
Stan: A Probabilistic Programming Language. 2017-01-11. Available at
https://www.jstatsoft.org/v076/i01
Acknowledgements Cervantes-Gutiérrez, F., Tovar-Ávila, J., and Galván-Magaña, F. (2018).
The authors extend sincerest thanks to Matt Wills, Master of the C-Rainger, Age and growth of the banded guitarfish Zapteryx exasperata
for his patience and enthusiasm for this research. We are grateful to Michael (Chondrichthyes: Trygonorrhinidae). Marine and Freshwater Research
Pinzone, Master of the San Antone II, and his crew for collecting samples. 69(1), 66–73. doi:10.1071/MF16403
The authors thank Sean Maberly, Master of the FRV Tom Marshall, for his Chang, W. Y. B. (1982). A statistical method for evaluating the reproduc-
contribution during the PTS experiments. Jonathan Smart provided advice ibility of age determination. Canadian Journal of Fisheries and Aquatic
on the analysis of the length-at-age data in a Bayesian framework and his Sciences 39(8), 1208–1210. doi:10.1139/F82-1581288 Marine and Freshwater Research M. J. Campbell et al.
Colonello, J. H., Cortés, F., and Belleggia, M. (2020). Male-biased sexual two species of elasmobranch. The Journal of Experimental Biology
size dimorphism in sharks: the narrowmouth catshark Schroederichthys 207(26), 4587–4594. doi:10.1242/JEB.01314
bivius as case study. Hydrobiologia 847(8), 1873–1886. doi:10.1007/ Izzo, C., and Gillanders, B. M. (2008). Initial assessment of age, growth and
S10750-020-04219-9 reproductive parameters of the southern fiddler ray Trygonorrhina
Cortés, E. (2000). Life history patterns and correlations in sharks. Reviews in fasciata (Müller & Henle, 1841) from South Australia. Pan-American
Fisheries Science 8(4), 299–344. doi:10.1080/10408340308951115 Journal of Aquatic Sciences 3(3), 321–327.
Courtney, A. J., Tonks, M. L., Campbell, M. J., Roy, D. P., Gaddes, S. W., Jacobsen, I., Zeller, B., Dunning, M., Garland, A., Courtney, T., and Jebreen,
Kyne, P. M., and O’Neill, M. F. (2006). Quantifying the effects of E. J. (2018). An ecological risk Assessment of the southern Queensland
bycatch reduction devices in Queensland’s (Australia) shallow water east coast otter trawl fishery and river and inshore beam trawl fishery.
eastern king prawn (Penaeus plebejus) trawl fishery. Fisheries Research Department of Agriculture and Fisheries, Brisbane, Qld. Available at
80(2–3), 136–147. doi:10.1016/J.FISHRES.2006.05.005 https://www.daf.qld.gov.au/__data/assets/pdf_file/0004/1402672/Sth-
Courtney, A. J., Campbell, M. J., Roy, D. P., Tonks, M. L., Chilcott, K. E., QLD-Trawl-ERA-Final.pdf
and Kyne, P. J. (2008). Round scallops and square-meshes: a comparison Jensen, A. L. (1996). Beverton and Holt life history invariants result from
of four codend types on the catch rates of target species and bycatch in optimal trade-off of reproduction and survival. Canadian Journal of
the Queensland (Australia) saucer scallop (Amusium balloti) trawl Fisheries and Aquatic Sciences 53(4), 820–822. doi:10.1139/F95-233
fishery. Marine and Freshwater Research 59, 849–864. doi:10.1071/ Jones, A. A., Hall, N. G., and Potter, I. C. (2010). Species compositions of
MF08073 elasmobranchs caught by three different commercial fishing methods off
D’Alberto, B. M., Chin, A., Smart, J. J., Baje, L., White, W. T., and southwestern Australia, and biological data for four abundant bycatch
Simpfendorfer, C. A. (2017). Age, growth and maturity of oceanic species. Fishery Bulletin 108(4), 365–381.
whitetip shark (Carcharhinus longimanus) from Papua New Guinea. Kennelly, S. J. (2020). Bycatch Beknown: Methodology for jurisdictional
Marine and Freshwater Research 68(6), 1118–1129. doi:10.1071/ reporting of fisheries discards–Using Australia as a case study. Fish and
MF16165 Fisheries 21(5), 1046–1066. doi:10.1111/FAF.12494
D’Alberto, B. M., Carlson, J. K., Pardo, S. A., and Simpfendorfer, C. A. Kyne, P. M. (2016). Ray conservation. In ‘Rays of the World’. Vol. 1. (Eds P.
(2019). Population productivity of shovelnose rays: inferring the poten- R. Last, W. T. White, M. R. de Carvalho, B. Séret, M. F. W. Stehmann,
tial for recovery. PLoS One 14(11), e0225183. doi:10.1371/JOURNAL. and G. J. P. Naylor.) pp. 21–24. (CSIRO Publishing: Melbourne, Vic.,
PONE.0225183 Australia.)
Dulvy, N. K., Baum, J. K., Clarke, S., Compagno, L. J. V., Cortés, E., Kyne, P. M., and Bennett, M. B. (2002a). Diet of the eastern shovelnose ray,
Domingo, A., Fordham, S., Fowler, S., Francis, M. P., Gibson, C., Aptychotrema rostrata (Shaw & Nodder, 1794), from Moreton Bay,
Martı́nez, J., Musick, J. A., Soldo, A., Stevens, J. D., and Valenti, S. Queensland, Australia. Marine and Freshwater Research 53(3), 679–
(2008). You can swim but you can’t hide: the global status and 686. doi:10.1071/MF01040
conservation of oceanic pelagic sharks and rays. Aquatic Conservation Kyne, P. M., and Bennett, M. B. (2002b). Reproductive biology of the
18(5), 459–482. doi:10.1002/AQC.975 eastern shovelnose ray, Aptychotrema rostrata (Shaw Nodder, 1794),
Dulvy, N. K., Simpfendorfer, C. A., Davidson, L. N. K., Fordham, S. V., from Moreton Bay, Queensland, Australia. Marine and Freshwater
Bräutigam, A., Sant, G., and Welch, D. J. (2017). Challenges and Research 53(2), 583–589. doi:10.1071/MF01063
priorities in shark and ray conservation. Current Biology 27(11), Kyne, P. M., and Stevens, J. D. (2015). Aptychotrema rostrata. The IUCN Red
R565–R572. doi:10.1016/J.CUB.2017.04.038 List of Threatened Species 2015: e.T161596A68609037. Available at
Emmons, S. M., D’Alberto, B. M., Smart, J. J., and Simpfendorfer, C. A. https://dx.doi.org/10.2305/IUCN.UK.2015-4.RLTS.T161596A68609037.en
(2021). Age and growth of tiger shark (Galeocerdo cuvier) from Western Kyne, P., Courtney, A., Campbell, M., Chilcott, K., Gaddes, S., Turnbull, C.,
Australia. Marine and Freshwater Research. doi:10.1071/MF20291 Van Der Geest, C., and Bennett, M. (2002). An overview of the elasmo-
Francis, R. I. C. C. (1990). Back-calculation of fish length: a critical review. branch bycatch of the Queensland East coast trawl fishery (Australia).
Journal of Fish Biology 36(6), 883–902. doi:10.1111/J.1095-8649.1990. Northwest Atlantic Fisheries Organisation NAFO SCR Document 2, 1–11.
TB05636.X Kyne, P. M., Courtney, A. J., Jacobsen, I. P., and Bennett, M. B. (2016).
Frisk, M. G., Miller, T. J., and Fogarty, M. J. (2001). Estimation and analysis Reproductive parameters of rhinobatid and urolophid batoids taken as
of biological parameters in elasmobranch fishes: a comparative life by-catch in the Queensland (Australia) east coast otter-trawl fishery.
history study. Canadian Journal of Fisheries and Aquatic Sciences Journal of Fish Biology 89(2), 1208–1226. doi:10.1111/JFB.13020
58(5), 969–981. doi:10.1139/F01-051 Kyne, P. M., Jabado, R. W., Rigby, C. L., Gore, M. A., Pollock, C. M.,
Gabry, J. T. M. (2020). bayesplot: Plotting for Bayesian Models. R package Herman, K. B., Cheok, J., Ebert, D. A., Simpfendorfer, C. A., and Dulvy,
version 1.7.2. Available at https://mc-stan.org/bayesplot. N. K. (2020). The thin edge of the wedge: extremely high extinction risk
Gilman, E., Perez Roda, A., Huntington, T., Kennelly, S. J., Suuronen, P., in wedgefishes and giant guitarfishes. Aquatic Conservation 30, 1337–
Chaloupka, M., and Medley, P. A. H. (2020). Benchmarking global 1361. doi:10.1002/AQC.3331
fisheries discards. Scientific Reports 10(1), 14017. doi:10.1038/S41598- Last, P. R., and Stevens, J. D. (2009). ‘Sharks and Rays of Australia.’
020-71021-X (CSIRO Publishing: Melbourne, Vic., Australia)
Goldman, K. J. (2005). Age and growth of elasmobranch fishes. FAO Last, P., Naylor, G., Séret, B., White, W., de Carvalho, M., and Stehmann,
Fisheries Technical Paper 474, 76–102. M. (2016). ‘Rays of the World.’ (CSIRO Publishing: Melbourne, Vic.,
Goldman, K. J., Cailliet, G. M., Andrews, A. H., and Natanson, L. J. (2004). Australia)
Age determination and validation in chondrichthyan fishes. In ‘Biology McGilvray, J. G., Mounsey, R. P., and MacCartie, J. (1999). The AusTED II,
of Sharks and their Relatives’. 2nd edn. (Eds J. C. Carrier, J. A. Musick, an improved trawl efficiency device 1. Design theories. Fisheries
and M. R. Heithaus.) pp. 423–450. (CRC Press: Boca Raton, FL, USA.) Research 40(1), 17–27. doi:10.1016/S0165-7836(98)00221-5
Gutteridge, A. N., and Bennett, M. B. (2014). Functional implications of Meynecke, J.-O., and Lee, S. Y. (2011). Climate-coastal fisheries relation-
ontogenetically and sexually dimorphic dentition in the eastern shovel- ships and their spatial variation in Queensland, Australia. Fisheries
nose ray, Aptychotrema rostrata. The Journal of Experimental Biology Research 110(2), 365–376. doi:10.1016/J.FISHRES.2011.05.004
217(2), 192–200. doi:10.1242/JEB.089326 Natanson, L. J., Casey, J. G., and Kohler, N. E. (1995). Age and growth
Hart, N. S., Lisney, T. J., Marshall, N. J., and Collin, S. P. (2004). Multiple estimates for the dusky shark, Carcharhinus obscurus, in the western
cone visual pigments and the potential for trichromatic colour vision in North Atlantic Ocean. Fishery Bulletin 93(1), 116–126.Life history of A. rostrata in Queensland Marine and Freshwater Research 1289
Officer, R. A., Gason, A. S., Walker, T. I., and Clement, J. G. (1996). Sources Smart, J. J., Chin, A., Tobin, A. J., and Simpfendorfer, C. A. (2016).
of variation in counts of growth increments in vertebrae from gummy Multimodel approaches in shark and ray growth studies: strengths,
shark (Mustelus antarcticus, and school shark, Galeorhinus galeus): weaknesses and the future. Fish and Fisheries 17, 955–971.
implications for age determination. Canadian Journal of Fisheries and doi:10.1111/FAF.12154
Aquatic Sciences 53(8), 1765–1777. doi:10.1139/F96-103 Stan Development Team (2020). RStan: the R interface to Stan. R package
Pardo, S. A., Cooper, A. B., and Dulvy, N. K. (2013). Avoiding fishy growth version 2.21.2. http://mc-stan.org/
curves. Methods in Ecology and Evolution 4(4), 353–360. doi:10.1111/ Stevens, J. D., Bonfil, R., Dulvy, N. K., and Walker, P. A. (2000). The effects
2041-210X.12020 of fishing on sharks, rays, and chimaeras (chondrichthyans), and the
Pauly, D. (1980). On the interrelationships between natural mortality, implications for marine ecosystems. ICES Journal of Marine Science
growth parameters, and mean environmental temperature in 175 fish 57(3), 476–494. doi:10.1006/JMSC.2000.0724
stocks. ICES Journal of Marine Science 39(2), 175–192. doi:10.1093/ Then, A. Y., Hoenig, J. M., Hall, N. G., and Hewitt, D. A. (2015). Evaluating
ICESJMS/39.2.175 the predictive performance of empirical estimators of natural mortality
Pears, R. J., Morison, A. K., Jebreen, E. J., Dunning, M. C., Pitcher, C. R., rate using information on over 200 fish species. ICES Journal of Marine
Courtney, A. J., Houlden, B., and Jacobsen, I. P. (2012). Ecological risk Science 72(1), 82–92. doi:10.1093/ICESJMS/FSU136
assessment of the East Coast Otter Trawl Fishery in the Great Barrier Reef Vehtari, A., Gabry, J., Magnusson, M., Yao, Y., Bürkner, P.-C., Paananen,
Marine Park: technical report. Great Barrier Reef Marine Park Authority, T., and Gelman, A. (2020) loo: Efficient leave-one-out cross-validation
Townsville, Qld, Australia. Available at http://elibrary.gbrmpa.gov.au/ and WAIC for Bayesian models. R package version 2.4.1. https://mc-
jspui/bitstream/11017/1148/1/ECOTF_ERA_Technical_web.pdf stan.org/loo/
Pierce, S. J., and Bennett, M. B. (2009). Validated annual band-pair Wang, N., Courtney, A. J., Campbell, M. J., and Yang, W.-H. (2020).
periodicity and growth parameters of blue-spotted maskray Neotrygon Quantifying long-term discards from Queensland’s (Australia) east coast
kuhlii from south-east Queensland, Australia. Journal of Fish Biology otter trawl fishery. ICES Journal of Marine Science 77(2), 680–691.
75(10), 2490–2508. doi:10.1111/J.1095-8649.2009.02435.X doi:10.1093/ICESJMS/FSZ205
Robins, J. B., and McGilvray, J. G. (1999). The AusTED II, an improved White, J., Simpfendorfer, C. A., Tobin, A. J., and Heupel, M. R. (2014). Age
trawl efficiency device 2. Commercial performance. Fisheries Research and growth parameters of shark-like batoids. Journal of Fish Biology
40, 29–41. doi:10.1016/S0165-7836(98)00222-7 84(5), 1340–1353. doi:10.1111/JFB.12359
Robins-Troeger, J. B. (1994). Evaluation of the Morrison soft turtle Wueringer, B. E., Tibbetts, I. R., and Whitehead, D. L. (2009). Ultrastructure
excluder device: prawn and bycatch variation in Moreton Bay, Queens- of the ampullae of Lorenzini of Aptychotrema rostrata (Rhinobatidae).
land. Fisheries Research 19(3-4), 205–217. doi:10.1016/0165- Zoomorphology 128(1), 45–52. doi:10.1007/S00435-008-0073-5
7836(94)90039-6 Zhou, S., Griffiths, S. P., and Miller, M. (2009). Sustainability assessment
Rolim, F. A., Siders, Z. A., Caltabellotta, F. P., Rotundo, M. M., and Vaske- for fishing effects (SAFE) on highly diverse and data-limited fish
Júnior, T. (2020). Growth and derived life-history characteristics of the bycatch in a tropical prawn trawl fishery. Marine and Freshwater
Brazilian electric ray Narcine brasiliensis. Journal of Fish Biology Research 60(6), 563–570. doi:10.1071/MF08207
97(2), 396–408. doi:10.1111/JFB.14378 Zhou, S., Yin, S., Thorson, J. T., Smith, A. D. M., and Fuller, M. (2012).
Rowsell, N., and Davies, J. (2012). At-sea observation of the stout whiting Linking fishing mortality reference points to life history traits: an
fishery 2009–10. Technical report. Department of Agriculture, Fisheries empirical study. Canadian Journal of Fisheries and Aquatic Sciences
and Forestry, Brisbane, Qld, Australia. Available at http://era.daf.qld. 69(8), 1292–1301. doi:10.1139/F2012-060
gov.au/id/eprint/6552/1/FOP%20Stout%20Whiting%20Report%202012% Zhou, S., Daley, J., Fuller, M., Bulman, C., Hobday, A., Courtney, T., Ryan,
20final.pdf P., and Ferrel, D. (2013). ERA extension to assess cumulative effects of
Simpfendorfer, C. A., and Dulvy, N. K. (2017). Bright spots of sustainable fishing on species. Final report on FRDC Project 2011/029, Canberra,
shark fishing. Current Biology 27(3), R97–R98. doi:10.1016/J.CUB. ACT, Australia. Available at http://frdc.com.au/research/Final_Reports/
2016.12.017 2011-029-DLD.pdf
Simpfendorfer, C. A., Chidlow, J., McAuley, R., and Unsworth, P. (2000). Zhou, S., Buckworth, R. C., Miller, M., and Jarrett, A. (2015). A SAFE
Age and growth of the whiskery shark, Furgaleus macki, from south- analysis of bycatch in the Joseph Boneparte Gulf fishery for red-legged
western Australia. Environmental Biology of Fishes 58(3), 335–343. banana prawns. CSIRO Oceans and Atmosphere Flagship, Brisbane,
doi:10.1023/A:1007624828001 Qld, Australia. Available at http://www.afma.gov.au/wp-content/
Smart, J. J. (2020) BayesGrowth: Estimate fish growth using MCMC uploads/2014/02/JBG-SAFE-Report-2015_05_21-final.pdf
analysis. R package version 0.3.0. Available at https://github.com/ Zhou, S., Hobday, A. J., Dichmont, C. M., and Smith, A. D. M. (2016).
jonathansmart/BayesGrowth. Ecological risk assessments for the effects of fishing: a comparison and
Smart, J. J., and Grammer, G. L. (2021). Modernising fish and shark growth validation of PSA and SAFE. Fisheries Research 183, 518–529.
curves with Bayesian length-at-age models. PLoS One 16(2), e0246734. doi:10.1016/J.FISHRES.2016.07.015
doi:10.1371/JOURNAL.PONE.0246734
Smart, J. J., Harry, A. V., Tobin, A. J., and Simpfendorfer, C. A. (2013).
Overcoming the constraints of low sample sizes to produce age and
growth data for rare or threatened sharks. Aquatic Conservation 23(1),
124–134. doi:10.1002/AQC.2274 Handling Editor: Bradley Wetherbee
www.publish.csiro.au/journals/mfrYou can also read