MALAYSIA SELECTED ISSUES - IMF

 
CONTINUE READING
MALAYSIA SELECTED ISSUES - IMF
IMF Country Report No. 18/62

             MALAYSIA
             SELECTED ISSUES
March 2018
             This Selected Issues Paper on Malaysia was prepared by a staff team of the International
             Monetary Fund as background documentation for the periodic consultation with the
             member country. It is based on the information available at the time it was completed on
             January 25, 2018.

                              Copies of this report are available to the public from

                               International Monetary Fund • Publication Services
                                     PO Box 92780 • Washington, D.C. 20090
                                Telephone: (202) 623-7430 • Fax: (202) 623-7201
                             E-mail: publications@imf.org Web: http://www.imf.org
                                          Price: $18.00 per printed copy

                                     International Monetary Fund
                                           Washington, D.C.

             © 2018 International Monetary Fund
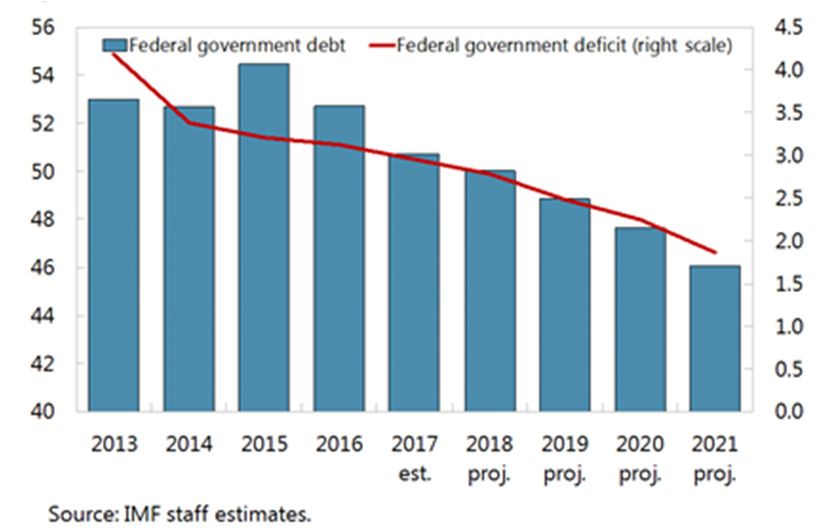
MALAYSIA SELECTED ISSUES - IMF
MALAYSIA
                   SELECTED ISSUES
January 25, 2018

                     Approved By                 Prepared by Souvik Gupta and Juan Manuel Jauregui (both
                     Asia and Pacific            APD)
                     Department

                      CONTENTS

                   AN OVERVIEW OF THE MALAYSIAN LABOR MARKET_______________________________ 2
                   A. Labor Supply ________________________________________________________________________ 3
                   B. Employment ________________________________________________________________________ 4
                   C. Unemployment ____________________________________________________________________ 13
                   D. Labor Compensation and Productivity _____________________________________________ 15
                   E. Conclusion _________________________________________________________________________ 17

                   TABLES
                   1. Selected Targets Under the 11th Malaysia Plan (2016–20) _________________________ 2
                   2. Minimum Wages___________________________________________________________________ 15

                   CALIBRATION OF FISCAL OBJECTIVES FOR MALAYSIA ____________________________ 19
                   A. Debt Targets and Likelihood of Breaching the Debt Ceiling _______________________ 20
                   B. Operational Targets: Calibration of the Fiscal Deficit ______________________________ 23
                   C. Conclusion _________________________________________________________________________ 25

                   FIGURES
                   1. Balance Calibration Consistent With 34 Percent of GDP Debt Target ______________ 24
                   2. Sensitivity Analysis _________________________________________________________________ 25
                   3. Balance Calibration Consistent With 45 Percent of GDP Debt Target ______________ 25

                   TABLES
                   1. Assumptions for Balance Calibration ______________________________________________ 23
MALAYSIA SELECTED ISSUES - IMF
MALAYSIA

AN OVERVIEW OF THE MALAYSIAN LABOR
MARKET1,2
Malaysia’s economy and its labor market have undergone significant shifts in the last three
decades. The labor market is now more urban and has a higher share of female workers and
workers with tertiary education. Employment has kept pace with labor supply, keeping the
unemployment rate stable for more than a decade. Meanwhile, reliance on non–citizen workers has
also increased against the backdrop of slower growth in citizen population. Continuing with its
economic transformation, Malaysia aspires to achieve high–income status, with a labor market that
is ready for the economy of the future: a market that can support more female workers, more
skilled jobs, and a higher labor productivity growth.

1.      The 11th Malaysia Plan (11MP, 2016–20) marks the final five years of Malaysia’s
Vision 2020. One of the aspirations under the Vision, launched in 1991, is Malaysia reaching
high–income status. The 11MP incorporates strategies and targets toward that aspiration. With
respect to the labor market, these strategies and targets include boosting productivity,
improving labor market efficiency and institutions, encouraging female labor force participation,
creating higher-skilled jobs, and reducing reliance on low-skilled non-citizen workers. Against
this backdrop, this analysis takes stock of the key developments in the Malaysian labor market,
including a focus on female labor force participation and the role of the non-citizen workforce.

                  Table 1. Malaysia: Selected Targets Under the 11th Malaysia Plan
                                              (2016–20)
                                                                                10MP      11MP       2016
                                                                               actuals    goals     actuals
                  Real GDP growth (percent, average)                             5.2       5-6        4.2

                  Per capita GDP (U.S. dollars, end of period)                 10,440    15,690      9,850

                  Labor’s share in income (percent, end of period)              ~35         40         …

                  Female labor force participation (percent, end of period)     54.1        59       54.3

                  Share of skilled employment (percent, end of period)          25.5        35       27.3

                  Labor productivity growth (percent, average)                   1.8       3.7        3.5

                  Total factor productivity growth (percent, average) 1/         1.8       2.3        0.1
                 Sources: Economic Planning Unit, Prime Minister’s Department; Department of Statistics,
                 Malaysia; World Bank; and IMF staff calculations.
                 1/ IMF staff estimates for the 10th Malaysia Plan period (10MP, 2011–15) and 2016. See IMF
                 Country Report No. 17/101 (Appendix III) for methodological discussion. Labor productivity
                 growth was higher in 2017.

1
    Prepared by Souvik Gupta with the assistance of Justin Flinner.
2
 Malaysia-specific data used in this analysis come from various data publications by the Department of Statistics,
Malaysia. Examples of such data publications include Labor Force Surveys, Salaries and Wages Surveys, the 2016
Economic Census for various sectors of the economy, Informal Sector Surveys, etc.

2       INTERNATIONAL MONETARY FUND
MALAYSIA SELECTED ISSUES - IMF
MALAYSIA

A. Labor Supply

2.       The evolution of Malaysia’s labor supply reflects the underlying changes in the
economic and socio–economic structures of the country. In the last three decades, Malaysia’s
labor force has become predominantly urban and the share of tertiary–educated workers in the
labor force has quadrupled, reflecting growth in urbanization and gains in educational
attainment. Nearly three–fourths of Malaysia’s
                                                       Malaysia: Selected Characteristics of the Labor Market
population now live in urban areas (mid–1980s:         (Shares in percent of the total labor force)
                                                         100
about 50 percent) and average years of                    90
                                                          80
                                                                                         1984-1999 (simple average)
                                                                                                                                                                       77
                                                                                                                                                                                                                                                                                                      85

                                                                                         2000-2015 (simple average)
                                                          70
schooling, an indicator of educational
                                                                                                                                                       61
                                                          60                             2016                                                                                                                                                                                  55
                                                          50                                                                                                   39

attainment, has also increased from below
                                                          40                                                                                                                                              34
                                                                                                                                                                                                                                                                                          28
                                                          30                                                                                                                     23
                                                                                                                                                                                            18
                                                                                                                                                                                                                         23            25
                                                          20                                                                                                                                                                                                        14                                             15

7 years in the mid–1980s to about 10½ years               10                                                                                                                                                                                             3
                                                           0

                                                                                                                                                     Male

                                                                                                                                                                                                                                                                          Secondary
                                                                                                                                                                                      15-24 years

                                                                                                                                                                                                    25-34 years

                                                                                                                                                                                                                   35-44 years

                                                                                                                                                                                                                                 45-64 years

                                                                                                                                                                                                                                                                                                 Citizens
                                                                                                                                                                                                                                                                Primary

                                                                                                                                                                                                                                                                                      Tertiary

                                                                                                                                                                                                                                                                                                            Non-citizens
                                                                                                                                                            Female

                                                                                                                                                                                                                                               No formal edu.
                                                                                                                                                                     Urban

                                                                                                                                                                              Rural
by 2010. This shows that the younger cohorts
         3

of the labor force have become increasingly
more educated. Thus, the share of 15–24–year                       By         By                By                  By             By
                                                                   sex   geography             age             education       residency
old participants in the labor force has declined      Sources: Department of Statistics, Malaysia; and IMF staff calculations.

over time, leading to a higher share of workers
in the 25–34 year age bracket. Female labor force participation rates have improved in recent
history, but males seeking work continue to represent a larger share of the labor force. The share
of non–citizens in the labor force has also increased.

3.      More recently, despite gains in the overall labor force participation rate, the rate of
Malaysia’s labor force expansion has trended downward. Labor force growth peaked in 2010
and has declined steadily since 2013. The deceleration in labor supply growth in the post–Global
Financial Crisis (GFC) period has been partly driven by slower growth in working–age population
(15–64 years of age). Over 2002–09, working–age population grew at compound annual growth
of about 2.9 percent. By 2017, it had slowed down to 1.6 percent. The slowdown in population
growth was partly offset by an increase in the labor force participation rate, which reached close
to the all–time high of nearly 68 percent of the working–age population in 2016. In particular,

   Malaysia: Selected Indicators of the Labor Market                                                                                        Malaysia: Contributions to Labor Force Growth
   (In percent)                                                                                                                             (In percentage points; year-on-year)
    18                                                                                                                                 90    7
                Annual growth (left axis)            Labor force participation rates           Share of non-citizens in the                                                                                                                                        Statistical discrepancies 1/
                                                              (right axis)                        labor force (left axis)                    6
    16                                                                                                                                 84
                                                                                                                                             5                                                                                                                     Change in participation
    14             Labor force                                                    Male                                                 78                                                                                                                          rates: female
                                                                                                                                             4
                   Employment
                                                                                                                                                                                                                                                                   Change in participation
    12                                                                                                                                 72    3
                   Unemployment rate
                                                                                Overall                                                                                                                                                                            rates: male
    10                                                                                                                                 66    2                                                                                                                     Population growth: female
                                                                                                                                             1                                                                                                                     (15-64 years)
     8                                                                                                                                 60                                                                                                                          Population growth: male
                                                                                Female                                                       0                                                                                                                     (15-64 years)
     6                                                                                                                                 54
                                                                                                                                            -1                                                                                                                     Growth in labor force (in
     4                                                                                                                                 48   -2                                                                                                                     percent)

     2                                                                                                                                 42          2011      2012            2013         2014                    2015                2016

     0                                                                                                                                 36   Sources: Department of Statistics, Malaysia; CEIC Data Co. Ltd.; and IMF staff
                                                                                                                                            calculations.
         2001
                2004
                       2007
                              2010
                                     2013
                                            2016
                                                   2001
                                                          2004
                                                                 2007
                                                                        2010
                                                                               2013
                                                                                      2016
                                                                                             2001
                                                                                                    2004
                                                                                                           2007
                                                                                                                  2010
                                                                                                                         2013
                                                                                                                                2016

                                                                                                                                            1/ Statistical discrepancies are due to differences in labor force participation rates
  Sources: Department of Statistics, Malaysia; and IMF staff calculations.                                                                  between the population-based estimates and labor force survey-based estimates.

3 Barro, Robert and Jong-Wha Lee, 2013, "A New Data Set of Educational Attainment in the World, 1950–2010."

Journal of Development Economics, Vol. 104, pp.184-198. Latest available data are as of 2010.

                                                                                                                                                               INTERNATIONAL MONETARY FUND                                                                                                                                 3
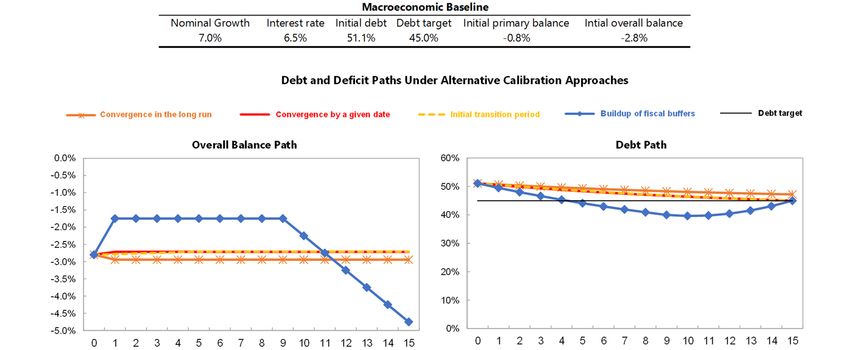
MALAYSIA SELECTED ISSUES - IMF
MALAYSIA

female labor force participation rate has notably improved in the last few years to about
54¼ percent in 2016 from 49½ percent in 2012.

4.       The share of non–citizen workers has                                               Malaysia: Labor Force by Residency Status, 2016
also increased since 2010, reaching about                                                   (In percent)
                                                                                            100                                            94

15½ percent of the total labor force in 2016.                                                90                                                                                                        Citizens                                  Non-citizens
                                                                                                                             84

                                                                                             80           69                                           68
                                                                                             70                                                                67

Non–citizens’ share in the labor force remained
                                                                                             60
                                                                                             50                                                                                                   42                                                      43         42
                                                                                             40                    31                                                  33
                                                                                                                                                                                    28
                                                                                             30
largely stable between 9½ percent and                                                        20
                                                                                             10
                                                                                                                                                                                                                20
                                                                                                                                                                                                                              10              9
                                                                                                                                                                                                                                                                                   5

                                                                                              0
10 percent over 2000–09. The non–citizen labor

                                                                                                                          Overall
                                                                                                       Male

                                                                                                                                      Male

                                                                                                                                                                                                                                                                 Secondary
                                                                                                                                                                              15-24 years

                                                                                                                                                                                            25-34 years

                                                                                                                                                                                                          35-44 years

                                                                                                                                                                                                                        45-64 years

                                                                                                                                                                                                                                                       Primary

                                                                                                                                                                                                                                                                              Tertiary
                                                                                                                Female

                                                                                                                                                  Female

                                                                                                                                                            Urban

                                                                                                                                                                                                                                      No formal edu.
                                                                                                                                                                    Rural
force, as compared to the citizens, has a higher
share of male or rural job seekers; significantly
higher participation rates for both gender; and                                                            By
                                                                                                           sex
                                                                                                                                By         By
                                                                                                                          participation geography
                                                                                                                                                                                                    By
                                                                                                                                                                                                   age
                                                                                                                                                                                                                                                          By
                                                                                                                                                                                                                                                       education

is younger, but has less years of schooling.                                                                                   rate
                                                                                            Sources: Department of Statistics, Malaysia; and IMF staff calculations.

B. Employment

5.       The Malaysian economy witnessed
                                                                                            Malaysia: Net Changes in Employment
net employment creation every year since                                                    (In millions of people)

the 1980s. The services sector now accounts for                                             1200

a higher share in the economy, both in overall
                                                                                            1000

                                                                                             800
value–added and in employment. Meanwhile,
                                                                                             600
the share of employment accounted for by the
                                                                                             400
agriculture, forestry, and fishing sector has                                                200
declined. Gains in employment shares                                                             0

between 2010 and 2016 were concentrated in
                                                                                                      1983

                                                                                                               1985

                                                                                                                         1987

                                                                                                                                    1989

                                                                                                                                                1992

                                                                                                                                                        1995

                                                                                                                                                                1997

                                                                                                                                                                       1999

                                                                                                                                                                                   2001

                                                                                                                                                                                                2003

                                                                                                                                                                                                             2005

                                                                                                                                                                                                                         2007

                                                                                                                                                                                                                                      2009

                                                                                                                                                                                                                                                       2011

                                                                                                                                                                                                                                                                 2013

                                                                                                                                                                                                                                                                             2015
the following sectors: wholesale and retail trade;                                          Sources: Department of Statistics, Malaysia; and IMF staff caculations.
                                                                                            1/ Changes in 1992 and 1995 are over two-year periods due to non-availability of

accommodation and beverage services
                                                                                            data for 1991 and 1994.

activities; administrative and support services;
and human health and social work activities.

    Malaysia: Employment by Sectors                                                          Malaysia: Change in Shares of Total Employment, 2010-16
    (Share in percent of total employment)                                                   (In percentage points)
    100                                                                                                     Accommodation and food and beverage service activities
                                                                  Agriculture, forestry,
     90                                                                                                                       Human health and social work activities
                                                                  and fishing                                           Administrative and support service activities
     80                                                                                        Wholesale and retail trade; repair of motor vehicles and motorcycles
                                                                  Mining and quarrying                                                           Mining and quarrying
     70                                                                                                                Professional, scientific and technical activities
     60                                                                                                                                          Other service activities
                                                                  Manufacturing                                                                    Real estate activities
     50                                                                                                           Electricity, gas, steam and air conditioning supply
                                                                                                                                                              Education
     40                                                                                       Water supply; sewerage, waste management and remediation activities
                                                                  Construction
     30                                                                                                                               Information and communication
                                                                                                                                    Arts, entertainment and recreation
     20                                                                                                                                     Transportation and storage
                                                                  Services and other 1/                                                                    Construction
     10                                                                                                                      Financial and insurance/takaful activities
       0                                                                                                                                                 Manufacturing
                                                                                                       Public administration and defence; compulsory social security
              1984-99          2000-15            2016                                                                          Activities of households as employers
                                                                                                                                       Agriculture, forestry and fishing
    Sources: Department of Statistics, Malaysia; and IMF staff calculations.
    1/ Includes a small share of activities of households as employers since 2001. Simple                                                     -3    -2     -1     0                                                                                                  1                 2
    avearges of shares for each sector across time for the pre-2016 periods.                Sources: Department of Statistics, Malaysia; and IMF staff calculations.

4          INTERNATIONAL MONETARY FUND
MALAYSIA

   As of 2016, manufacturing and wholesale and retail trade sectors accounted for most of labor
    demand, totaling a little over one–third share in overall employment. In the manufacturing
    sector, a key contributor to Malaysia’s exports, share in economy-wide employment declined
    between 2011 and 2015 as the economy adjusted to external shocks, most notable of which
    were global trade slowdown, concerns on China’s economy, and a significant drop in oil
    prices. However, it reversed partially in 2016 and 2017 as external trade improved. Decline in
    the public administration and defense reflects, in part, a hiring freeze.

   By skills, the share of skilled–workers                              Malaysia: Employment by Occupational Skills
    increased slightly in 2016, reaching                                 (Share in percent of total employment)
                                                                                                 Skilled                    Semi-skilled                       Low-skilled

    27¼ percent of total employment (2011–15
                                                                         100.0
                                                                          90.0
                                                                          80.0
    average: about 25 percent; 2001–10                                    70.0
                                                                          60.0
    average: about 26¼ percent).                                          50.0
                                                                          40.0
                                                                          30.0
                                                                          20.0

    Small and medium enterprises (SME), which
                                                                          10.0
                                                                          0.0

                                                                                 2001

                                                                                        2002

                                                                                               2003

                                                                                                      2004

                                                                                                             2005

                                                                                                                    2006

                                                                                                                           2007

                                                                                                                                  2008

                                                                                                                                         2009

                                                                                                                                                2010

                                                                                                                                                       2011

                                                                                                                                                              2012

                                                                                                                                                                     2013

                                                                                                                                                                            2014

                                                                                                                                                                                   2015

                                                                                                                                                                                          2016
    are predominantly in the services sector and
                                                  Sources: CEIC Data Co. Ltd.; and IMF staff calculations.
    are micro–sized (i.e., annual turnover less   1/ Skilled workers are defined as legislators, senior officers, and managers;
                                                  professionals; and technicians and associate professionals.
    than RM 300,000 and less than 5 full–time     2/ Semi-skilled workers are defined as clerical workers; service, shop, and market
                                                  sales workers; and skilled agricultural and fishery workers.
    employees), accounted for about
    40½ percent share in total employment in the economy in 2015, compared to about
    33¼ percent in 2010.

   Additionally, employment in the non–agricultural informal sectors accounted for about
    11½ percent of total employment in 2015, and increase from 8.2 percent in 2012, but still
    significantly lower than other emerging market economies in the region.4 More than two–
    thirds of this type of employment comprised self-employed workers and employers.

4
 Based on information for Indonesia, the Philippines, Thailand, and Vietnam in the Key Indicators of the Labor
Market (KILM) database, published by the International Labor Organization. The definitions of the non–
agricultural informal sector in the Malaysian data and in the KILM database are similar.

                                                                                               INTERNATIONAL MONETARY FUND                                                                       5
MALAYSIA

Employment of the female workforce

6.      In the post–GFC period, female
employment has grown at a faster pace than                                 Malaysia: Female Employment by Industry
                                                                           (In percent)

male employment. Over 2010–16, female                                               10
                                                                                                                                                                             Human health and social
                                                                                                                                                                                work activities

employment grew at a compound annual rate
                                                                                                                                       Administrative and support

                                                                             Compound annual average growth rate
                                                                                                                   8                       service activities
                                                                                                                                                                                                               Wholesale and retail trade;
                                                                                                                                                                                                                repair of motor vehicles
                                                                                                                                                                            Accommodation and food
                                                                                                                                                                                                                   and motorcycles
                                                                                                                                                                              and beverage service

of about 4½ percent, compared to about
                                                                                                                            Mining and quarrying
                                                                                                                   6                                                               activities

                                                                                       over 2012-16
                                                                                                                                  Professional, scientific and
                                                                                                                                     technical activities

2 percent rate for male employment. Faster
                                                                                                                                                                                                                      Manufacturing
                                                                                                                   4                                                                  Education
                                                                                                                            Construction
                                                                                                                                              Public administration and

female employment growth took place mostly                                                                         2                          defence: compulsory social
                                                                                                                                                        security

in the health and hospitality services and in the                                                                  0
                                                                                                                                                                    Agriculture, forestry, and
                                                                                                                                                                             fishing
                                                                                                                                                                                                  Other services

public sector. Higher female employment                                                                            -2
                                                                                                                        0                             5                          10                           15                             20

since 2012 explained most of the increases in                                                                                                      Sectoral share in total female employment, 2016

                                                                           Sources: Department of Statistics, Malaysia; and IMF staff calculations.
three of the four sub–sectors of the economy
that saw the largest increases in their shares in
total employment.5

7.      Female contribution to growth has
                                                     Malaysia: Contributions to Real GDP Growth
increased at a faster pace in recent years.          (In percentage points)
                                                     10
Based on a growth accounting exercise with                                                                         Physical capital

human capital formation, staff finds that              8
                                                                                                                   Human capital (male)

contribution from female employment to real            6                                                           Employment (male)

GDP growth has more than trebled. While in
                                     6                 4                                                           Human capital (female)

the 2001–08, female workers accounted for              2                                                           Employment (female)

4 percent, on average, of real GDP growth, their       0                                                           Total factor productivity

contribution increased to 14 percent over 2011–       -2
                                                                                                                   Real GDP growth (in
                                                                                                                   percent)
16. Meanwhile, contributions by male workers               2010 2011 2012 2013 2014 2015 2016
                                                     Sources: Department of Statistics, Malaysia; and IMF staff estimates.
increased from about 7 percent to about
13 percent. Not only women’s share in total employment has increased, but also the gender gap
in average years of schooling has shrunk, leading to additional contributions to growth through
human capital formation.7 Gross school enrollment ratios in secondary and tertiary education are

5
 Rise in female employment explained between 53 percent and 85 percent of the increases in employment in
accommodation and food and beverage service activities; wholesale and retail trade, and repair of motor
vehicles; and human health and social work activities. Female workers accounted for most of the rise in
employment in the health sector.
6
  For details on the growth accounting framework using human capital please see IMF Country Report 17/101
(Appendix III). The analysis here extends that framework to break down the total contribution of labor by gender.
Data from the official Salaries and Wages Survey Reports and employment by gender are used to split the overall
labor–share of income by gender. Educational attainment, a proxy for human capital, by gender is obtained from
the Barro–Lee database. Staff assumes that the historical trend in years of schooling over 1985–2010 continued
into 2016 for both the genders. Returns to education are assumed to be same for males and females.
7
 By 2010, average years of schooling for females had almost caught up (lower by 0.2 years) with their male
counterparts, declining from 1.4 fewer years of schooling in the mid–1980s.

6      INTERNATIONAL MONETARY FUND
MALAYSIA

also higher for females, particularly in tertiary education. This is likely reflected in the higher
share of skilled occupations in female employment.

     Malaysia: Gross School Enrollment Ratios, 2015                                      Malaysia: Employment by Occupation, 2016 1/
     (In percent; ratio of total enrollment to the population of the age group that      (Shares in percent)
     corresponds to the level of schooling. A high ratio may include enrollment by                               Skilled             Semi-skilled                        Elementary occupation
     overage and/or underage students)                                                     100
     120                                                                                    90
     100                                                                                    80
                                                                                            70
      80                                                                                    60
      60                                                                                    50
                                                                                            40
      40                                                                                    30
      20                                                                                    20
                                                                                            10
       0                                                                                     0
              Male         Female       Male        Female        Male         Female                            Overall                              Male                              Female
                     Primary                Secondary                    Tertiary        Sources: Department of Statistics, Malaysia; and IMF staff calculations.
                                                                                         1/ Skilled-workers are defined by the following occupations: managers, professionals,
    Source: United Nations Educational, Scientific, and Cultural Organization (UNESCO)   technicians and associate professionals. Semi-skilled workers are those who are
    Institute for Statistics.                                                            neither in skilled occupation nor in elementary occupations.

8.      Malaysia has potential for further           Selected ASEAN Countries and OECD: Female Labor Force,
improving female labor force participation.          2016
                                                     (In percent)

Although the female labor force participation        100
                                                       90
                                                               Female participation rate

rate has improved in recent years, it remains          80
                                                       70
                                                               Ratio to male participation rate

                                                       60
low, both in absolute terms and relative to the        50
                                                       40
male participation rate, when compared with            30
                                                       20
some of the regional economies or the OECD             10
                                                        0

average. Under the 11MP, Malaysia aspires to
                                                                                                   Philippines

                                                                                                                                                                             Thailand
                                                                                                                                                             Singapore

                                                                                                                                                                                                   average
                                                                                                                                                                                        Vietnam
                                                                                                                    Indonesia

                                                                                                                                Malaysia

                                                                                                                                           Malaysia

                                                                                                                                                                                                    OECD
                                                                                                                                 (2006)

improve the female labor participation rate by
                                                    Sources: Department of Statistics, Malaysia; OECD.Stat; World Economic Forum, the
5 percentage points to 59 percent by 2020. If       Global Gender Gap Report, 2016; CEIC Data Co. Ltd.; and IMF staff calculations.

the female labor force participation rate had not
changed since 2012, the direct impact would have led to a 3½ percent smaller labor force
by 2016 and real GDP would have been about 1 percent lower (average growth lower by
0.2 percentage points). The World Bank (2012) also found that improvement in female labor
force participation rates helped real GDP growth.8 Higher female labor force participation should
help offset the impact of slowing population growth going forward.

8
    World Bank, 2012, “Unlocking Women’s Potential”, Malaysia Economic Monitor, November 2012.

                                                                                                                 INTERNATIONAL MONETARY FUND                                                                 7
MALAYSIA

9.       While socio-cultural factor could                  Malaysia: Reasons for Being Outside of Labor Force, 2016
potentially be at play, further policy actions              (In percent of people outside of labor force by sex)
                                                                        Schooling       Housework/family responsibility        Other reasons
may help improve female labor force                        100
                                                              90
participation. Studies have shown that beyond                 80

demographic factors, such as number of
                                                              70
                                                              60

children, household size, etc., policy                        50
                                                              40
interventions can also help boost female labor                30

force participation. In Malaysia, official statistics
                    9                                         20
                                                              10
reveal that housework or family responsibility is              0
                                                                            Overall                    Male                     Female
the dominant factor for women not seeking                  Sources: Department of Statistics, Malaysia; and IMF staff calculations.

employment, both in urban and rural areas. This
is also correlated with a faster decline in the participation rates among married women aged 30
years and above (the 2010 Population and Housing Census report the average age for females at
marriage was about 26 years). In contrast, in OECD countries, female labor force participation
rates do not fall until later in the life cycle. Relative to males, female labor force participation
rates are particularly low for less–educated women.

    Malaysia and OECD: Female Labor Force Participation, 2016                                               Malaysia: Labor Force Participation Rates by Sex and by
    (In percent)
                                                                                                            Educational Attainment, 2016
                                  Malaysia                         OECD average                             (In percent)
     90
     80                                                                                                       100
                                                                                                                                                                      Male   Female
     70                                                                                                        90
     60
                                                                                                               80
     50
                                                                                                               70
     40
     30                                                                                                        60
     20
                                                                                                               50
     10
               Female labor force participation rates       Ratio to male labor force participation rates      40
       0
           15–19
           20–24
           25–29
           30–34
           35–39
           40–44
           45–49
           50–54
           55–59
           60–64

                                                               15–19
                                                               20–24
                                                               25–29
                                                               30–34
                                                               35–39
                                                               40–44
                                                               45–49
                                                               50–54
                                                               55–59
                                                               60–64

                                                                                                               30
                                                                                                                    No formal               Primary       Secondary     Tertiary
                                                Age groups, in years                                                education
    Sources: Department of Statistics, Malaysia; OECD.Stat; and IMF staff calculations.                     Source: Department of Statistics, Malaysia.

       IMF (2012) reports that female labor supply
        is more responsive to taxes than male labor supply. It finds that higher tax exemption for
        female workers than men and/or replacing family taxation, which usually leads to higher tax
        wedges for the secondary earners (e.g., women earners in many cases), by individual taxation
        have the potential to help improve female labor participation.

       In Malaysia, given women’s dominant reason for not seeking employment mentioned above,
        particularly during the child–bearing or child–rearing ages, increased access to childcare
        facilities and family–friendly labor laws could help boost female labor participation. The
        Government Transformation Program 2.0 has set an ambitious target of 25 percent childcare
        enrollment by 2020 from 4 percent in 2012, but there has been limited success so far. Tax

9
  For example, Gonzales, C.; S. Jain-Chandra; K. Kochhar; and M. Newiak, 2015, “Fair Play: More Equal Laws Boost
Female Labor Force Participation”, IMF Staff Discussion Notes, SDN/15/02, International Monetary Fund; and
IMF, 2012, “Fiscal Policy and Employment in Advanced and Emerging Economies”, Policy Paper, International
Monetary Fund, June 2012.

8          INTERNATIONAL MONETARY FUND
MALAYSIA

       incentives to companies for setting up childcare facilities and/or encouraging them to allow
       flexible work arrangements could help retain married women workers.

      IMF (2012) documents that a shift away from labor to consumption taxes could potentially
       boost labor demand by reducing non–wage labor costs. In the Malaysian context, this would
       imply further upgrading the Goods and Services (GST) tax framework, including reduction in
       the number of exempt items and raising the tax rate. Use of the additional revenues on
       growth–enhancing items, including physical and human capital, could potentially have a
       positive effect on long–term growth and labor demand.

      Policies should also continue to strive toward achieving a gender–neutral employment law. In
       this context, while Malaysia has made improvements in recent years, including amendments
       to maternity benefits, announcing that termination of the services of a female employee
       during her maternity leave would be an offence in situations other than closure of the
       employer’s business, and a new sexual harassment regime. However, certain restrictions
       remain on employment of women, for example, for night work and/or for certain industries.

      Some of the Budget 2018 measures have the potential of further incentivizing female labor
       force participation. These measures include, for example, (a) increasing the duration of
       maternity leave for the private sector to 90 days to match that of the public sector; (b) a
       minimum of 30 percent participation of women in Boards of government-linked companies
       and investment companies by end-2018; and (c) personal income tax exemptions on a
       maximum of 12 months consecutive salary for women with a career break of at least 2 years
       who intend to return to the workforce between 2018 and 2020.

Employment of non–citizen workers

10.      Non–citizen workers are mostly employed in lower–skilled jobs. This reflects their
relatively higher share in labor supply for such occupations compared to citizens. Citizens’ higher
education level are likely related to their relatively higher labor supply for higher–skilled jobs.

    Malaysia: Employment by Residency Status, 2016                                                                                                                                              Malaysia: Share of Non-Citizen Employment by Market
    (In percent)                                                                                                                                                                                Segments, 2016
    100                                                                                                                                                                                         (In percent of each market segment)
     90                                                                                                              Citizens                        Non-citizens
     80                                                                                                                                                                                          60
                             70                                                                                                                                                                                                                                                                     51                                               51
     70      67
                                                                                                                                                                                                 50                                                                                                                46                                                46

     60                                                                                                                                                                      53
     50                                                        42                                                      44         43                         43
                                                                                                                                                                                                 40
     40              33
                                     30                                                                                                                                                          30                                        26

     30                                          28                                                                                                                                                             22
                                                                                                                                                                                                                                                         19

     20
                                                                             20
                                                                                                                                                                                                 20     14
                                                                                                                                                                                                                        18
                                                                                                                                                                                                                                   12                                  13                                                    12
                                                                                           10              9
     10                                                                                                                                        5                                          4      10                                                                                   6
                                                                                                                                                                                                                                                                                                                                          3                                        2
      0                                                                                                                                                                                           0
                                                                                                                                                                       Semi-skilled
                                           15-24 years

                                                         25-34 years

                                                                       35-44 years

                                                                                     45-64 years
                           Male

                                                                                                                                                                                      Skilled
                                                                                                                    Primary

                                                                                                                              Secondary
                                  Female

                                                                                                   No formal edu.

                                                                                                                                                       Elem. Occup.
                                                                                                                                          Tertiary
           Urban

                   Rural

                                                                                                                                                                                                                       Male

                                                                                                                                                                                                                                                                                                                                                                  Semi-skilled
                                                                                                                                                                                                                                                                                                                           Secondary
                                                                                                                                                                                                                                        15-24 years

                                                                                                                                                                                                                                                      25-34 years

                                                                                                                                                                                                                                                                    35-44 years

                                                                                                                                                                                                                                                                                  45-64 years

                                                                                                                                                                                                                                                                                                                 Primary

                                                                                                                                                                                                                                                                                                                                       Tertiary

                                                                                                                                                                                                                                                                                                                                                                                 Skilled
                                                                                                                                                                                                                                                                                                No formal edu.
                                                                                                                                                                                                       Urban

                                                                                                                                                                                                                               Female

                                                                                                                                                                                                                                                                                                                                                  Elem. Occup.
                                                                                                                                                                                                               Rural

             By               By                                 By                                                    By                                              By                                By                  By                                By                                                   By                                            By
          geography           sex                               age                                                 education                                         skills                          geography              sex                              age                                                education                                       skills

    Sources: Department of Statistics, Malaysia; and IMF staff calculations.                                                                                                                    Sources: Department of Statistics, Malaysia; and IMF staff calculations.

                                                                                                                                                                                                                       INTERNATIONAL MONETARY FUND                                                                                                                                         9
MALAYSIA

11.     Demand for non–citizen workers varies by sectors and states. Data from the 2016
Economic Census reveal that non–citizen workers are primarily employed in three sectors:
agriculture, forestry, and fishing; manufacturing; and construction, with the latter two sectors
accounting for about two–thirds of the total non–citizen employment.

    A large share of workers in the agricultural sector are non–citizens, primarily employed on a
     full–time basis and are involved in sector–specific skilled work or in elementary occupation.10
     In the construction sector, non–citizen workers are mainly involved in construction of
     buildings, both residential and nonresidential.

    In the manufacturing sector, about one–quarter of the workers are non–citizens. Within
     manufacturing, the shares of non–citizen workers are relatively higher in furniture and wood–
     work related occupations; textiles; and plastic and rubber products etc., reflecting social
     factors influencing citizen’s willingness to work in some of these occupations. In electrical
     and electronics (E&E) manufacturing (electronic components and board; computers and
     peripheral equipment; communication equipment; consumer electronics; electric motors etc.)
     — an important sector in Malaysia’s economy (in 2016 this sector accounted for about one–
     third of total goods exports and manufacturing employment, and about 6¼ percent of GDP)
     — non–citizen workers account for between 20 and 30 percent of the workforce, and about
     two–thirds of them are females.

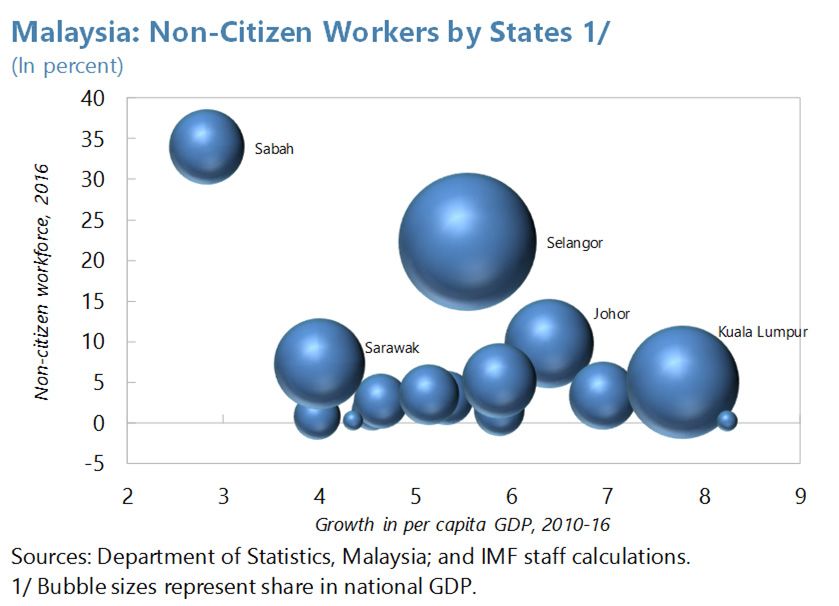
    Labor Force Survey data show that five
     states accounted for nearly 80 percent share
     in total non–citizen employment in 2016. In
     contrast, these states accounted for a
     combined 64 percent share in national GDP.
     The eastern state of Sabah (about
     34 percent share in total non–citizen
     employment, with only 6.7 percent share in
     national GDP) and the peninsular state of
     Selangor (about 22 percent share in total
     non-citizen employment, similar to its share
     in national GDP), together accounted for more than half of overall non–citizen employment
     in 2016.

12.     There are concerns in the public discourse that the influx of non–citizen workers
has led to depressed wages and reduced job opportunities for lower–skilled workers.
However, without establishing any causality, the data suggest that non-citizen workers have
helped increase the labor force, contributing to GDP growth; while employment for lower-skilled

10
  According to Malaysia Standard Classification of Occupations 2008 (MASCO 2008), elementary occupations are
those that require skill levels equivalent to primary education. These includes cleaners and helpers; laborers in
agricultural, forestry, farming, fishery, mining, manufacturing, construction, and transportation sectors; food
preparation assistants; street and related sales and services workers; and refuse and other elementary workers.

10    INTERNATIONAL MONETARY FUND
MALAYSIA

workers kept pace with their labor supply and their wage gap with higher skilled workers has
declined, and the process of capital deepening proceeded at a faster pace. Indeed, the following
were observed in Malaysia since the GFC:

   The rise in the non–citizen workforce has
                                                                         Malaysia: Population Growth by Selected Age Groups
    happened against the backdrop of slowing                             (In percent; mid-year population)
                                                                              3.5
    working–age population growth. Citizen                                    3.0
                                                                                                                                                                                0-14 years

                                                                                                                                                                                15-64 years
    population growth has nearly halved from                                  2.5

                                                                              2.0
    2 percent y/y in 2003 to 1.1 percent                                      1.5
    y/y 2017 (mid–year population estimates).                                 1.0

    Population growth by age groups shows                                     0.5

                                                                              0.0
    that it has been largely negative for the                              -0.5
    youngest (0–14 years) age group, implying a                            -1.0
                                                                                           2007 2008 2009 2010 2011 2012 2013 2014 2015 2016 2017
    risk of declining future labor force. As                             Sources: Department of Statistics, Malaysia; and IMF staff calculations.

    discussed earlier, working–age population
    growth has also slowed.

   During 2011–16, if the non–citizen labor
    force had grown at the lower rate observed                           Malaysia: Contributions to Labor Force Growth by
                                                                         Residency
    over 2001–09, the total labor force would                            (In percentage points)
                                                                         10
    have been smaller by about 7 percent                                   9      Citizens
                                                                          8                Non-citizens
    by 2016 and the average real GDP growth                               7                Total labor force growth (in percent)
                                                                          6
    would have been lower by 0.4 percentage                               5
                                                                          4
    points (assuming no additional changes in                             3

    the capital/labor ratio and/or in total factor                        2
                                                                          1

    productivity, and the same unemployment                               0
                                                                         -1

    rate for non-citizens as observed during this
                                                                                    2001

                                                                                            2002

                                                                                                   2003

                                                                                                          2004

                                                                                                                 2005

                                                                                                                        2006

                                                                                                                               2007

                                                                                                                                      2008

                                                                                                                                             2009

                                                                                                                                                    2010

                                                                                                                                                           2011

                                                                                                                                                                  2012

                                                                                                                                                                         2013

                                                                                                                                                                                2014

                                                                                                                                                                                       2015

                                                                                                                                                                                              2016
    period).                                                             Sources: Department of Statistics, Malaysia; and IMF staff calculations.

   The economy-wide capital/labor ratio has
                                                      Malaysia: Capital-Labor Ratio and Non-Citizen Employment
    grown at a slightly faster rate in the post–      (Compound annual growth rate; in percent)
                                                        8
    GFC period. This is not surprising given a          7
                                                               2001-08

    rise in the share of labor income in total          6
                                                               2010-16

                                                        5
    income (i.e., a higher wage/rental ratio) over      4

    this period. At the industry level, in              3

    agriculture and construction, two sectors           2
                                                        1
    that rely relatively more on non–citizen            0
                                                               Overall     Agriculture Manufacturing Construction
    workers, capital/labor ratios have grown at a                              Capital/labor ratio                          Non-citizen

    faster pace over 2010–16. However, in the                                                                              employment
                                                     Sources: Department of Statistics, Malaysia; and IMF staff calculations.
    manufacturing sector there has been a
    slowdown in growth in the capital/labor ratio. In the E&E sub–sector, fixed investment has
    grown at slower pace than the manufacturing sector as a whole since 2010. As labor’s share

                                                                                                   INTERNATIONAL MONETARY FUND                                                                       11
MALAYSIA

           in total income rises over the medium term, overall capital/labor ratio should go up,
           supporting higher productivity.

          Despite a higher growth in the non–citizen workforce, workers with no formal education and
           primary education have seen a continued decline in their share in the total pool of
           unemployed workers, reflecting in part a decline in their share in total labor supply. Also,
           unemployment rates for these workers have remained lower than the national average,
           except between 2010 and 2015 when the unemployment rate for workers with no formal
           education was higher. However, the latter has declined at the fastest pace since 2013.

     Malaysia: Laborers with No Formal Education or with                                                                    Malaysia: Unemployment Rate by Educational Attainment
     Primary Education                                                                                                      (In percent)
     (In percent)                                                                                                           5.0
     35                                                                                                                     4.5
                      Share in total labor supply                    Share in the unemployment pool
     30                                                                                                                     4.0
                                                                                                                            3.5
     25
                                                                                                                            3.0
     20                                                                                                                     2.5
     15                                                                                                                     2.0

     10                                                                                                                     1.5
                                                                                                                            1.0                 Overall                                           No formal education
       5                                                                                                                                        Primary                                           Secondary
                                                                                                                            0.5
       0                                                                                                                                        Tertiary
                                                                                                                            0.0
            2001

                   2002

                          2003

                                 2004

                                        2005

                                               2006

                                                      2007

                                                             2008

                                                                    2009

                                                                           2010

                                                                                  2011

                                                                                         2012

                                                                                                2013

                                                                                                       2014

                                                                                                              2015

                                                                                                                     2016

                                                                                                                                  2001

                                                                                                                                         2002

                                                                                                                                                2003

                                                                                                                                                       2004

                                                                                                                                                              2005

                                                                                                                                                                     2006

                                                                                                                                                                            2007

                                                                                                                                                                                   2008

                                                                                                                                                                                          2009

                                                                                                                                                                                                 2010

                                                                                                                                                                                                        2011

                                                                                                                                                                                                               2012

                                                                                                                                                                                                                      2013

                                                                                                                                                                                                                             2014

                                                                                                                                                                                                                                    2015

                                                                                                                                                                                                                                           2016
     Sources: Department of Statistics, Malaysia; and IMF staff calculations.                                               Sources: Department of Statistics, Malaysia; and IMF staff calculations.

          In recent years, average salaries and wages
                                                              Malaysia: Supply of and Demand for Workers with No
           for lower–skilled or less– educated workers        Formal Education or with Primary Education
           have grown at a relatively faster pace than
                                                              (In percent)
                                                                                Growth in labor supply           Growth in employment
                                                                15
           the highest–earning workers (see more
                                                                10
           below). Given that employment growth for               5

           these workers kept pace with labor supply,             0

           rising average salaries and wages point to            -5

           complementarity in skills between citizens          -10

                                                               -15
           and non–citizen workers in these jobs and                 2010     2012      2014      2016       2010      2012        2014  2016

           the impact of implementation of a minimum                   Laborers with no formal education      Laborers with primary education
                                                              Sources: Department of Statistics, Malaysia; and IMF staff calculations.
           wage policy from 2013. Between 2010
           and 2016, for sectors that rely relatively more on non–citizen workers, nominal average
           salaries and wages for all workers, relative to the national average of 5.4 percent compound
           annual rate, went up at a faster pace in agriculture, forestry, and fishing (7.4 percent rate); at
           a similar pace in the manufacturing sector; and at a slightly lower pace in the construction
           sector (5.1 percent rate). A World Bank study also found a positive impact of immigration on
           overall employment and wages for Malaysian citizens. However, this study also finds that a
           10 percent rise in immigration has a small negative impact on wages of the less–educated
           Malaysian workers, but about five and half times larger negative impact on immigrant
           workers’ wages.11

11
     World Bank, 2015, “Immigrant Labour”, Malaysia Economic Monitor, December 2015.

12          INTERNATIONAL MONETARY FUND
MALAYSIA

13.     Reforming non–citizen worker policies and processes will involve structural shifts in
certain key sectors and should be phased in. Malaysia remains an attractive destination for
immigrant workers in the region and, as Malaysian citizens get more educated and seek
employment in higher–skilled occupations, non–citizen workers can help fill in the vacancies in
the lower–skilled occupations. However, the authorities aim to increasingly rely on higher–skilled
non–citizen workers within an overall limit, and encourage increased employment in high–skilled
jobs and adoption of technology as the economy moves up the value chain. While the aim is to
improve productivity, changes in non–citizen worker policies should be phased in to allow
important sectors of the economy time to adjust. The authorities should continue consultation
with industries on the pace of adjustment and should rely on market–based mechanisms, as fixed
numerical limits tend to lose relevance over time and lead to distortions and/or misreporting.

C. Unemployment

14.      The economy-wide unemployment rate has been largely stable since the late 1990s.
In the last one and half decade, employment growth has been largely in line with labor supply
growth, helping keep the unemployment rate stable. Earlier, faster average employment growth
over nearly a decade preceding the Asian Financial Crisis helped lower the unemployment rate
from above 7 percent in the mid–1980s to 2.4 percent in 1997. Since then the unemployment
rate has remained within a range of 2.9 percent and 3.7 percent, with 2016 witnessing an uptick
to 3.4 percent. In the ten months of 2017, the unemployment rate was largely stable around
3.4 percent.

  Malaysia: Unemployment Rate                                                                                          Malaysia: Labor Force, Employment, and Unemployment
  (In percent)                                                                                                         (In percent; growth rates are in compound annual rates for the pre-2016 periods)
   8                                                                                                                             Growth in labor force    Growth in employment       Unemployment rate
                                                                                                                        5.0
   7
                                                                                                                        4.5
   6                                                                                                                    4.0
                                                                                                                        3.5
   5
                                                                                                                        3.0
   4                                                                                                                    2.5
   3                                                                                                                    2.0
                                                                                                                        1.5
   2
                                                                                                                        1.0
   1                                                                                                                    0.5

   0                                                                                                                    0.0
                                                                                                                                 1984-99        2000-05         2006-10         2011-15          2016
       1983

              1985

                     1987

                            1989

                                   1992

                                          1995

                                                 1997

                                                        1999

                                                               2001

                                                                      2003

                                                                             2005

                                                                                    2007

                                                                                           2009

                                                                                                  2011

                                                                                                         2013

                                                                                                                2015

                                                                                                                       Sources: Department of Statistics, Malaysia; CEIC Data Co. Ltd.; and IMF staff
 Source: Department of Statistics, Malaysia.                                                                           calculations.

                                                                                                                                       INTERNATIONAL MONETARY FUND                                        13
MALAYSIA

15.     However, certain segments of the labor market are exposed to higher
unemployment rates than the national average. For example, in 2016, unemployment rates
were higher for workers below the age of 30 years (youth unemployment); and more so for
females than males in this age group. Also, females in rural areas and workers with tertiary
education experienced higher rates of unemployment. Some of these patterns have remained for
several years now pointing to structural factors that include skills mismatch. Unemployment of
non–citizen workers was lower than that for citizens on average, reflecting that the demand–pull
factors are playing a greater role than the supply–push factors in the employment of non–citizen
workers.

  Malaysia: Unemployment Rates, 2016                                                                                                                                                                                                    Malaysia: Share in Total Unemployment by Education Level
  (In percent of total labor force in respective segments)                                                                                                                                                                              (In percent; simple annual averages)
     18                                                                                                                                                                                                                                            No formal education       Primary      Secondary   Tertiary
     16
     14                                                                                                                                                                                                                                 100
     12                                                                                                                                                                                                                                  90
     10
      8                                                                                                                                                                                                                                  80
      6                                                                                                                                                                            National average
                                                                                                                                                                                                                                         70
      4
      2                                                                                                                                                                                                                                  60
      0
                                                                                                                                                                                                                                         50
                                                                                                                                                                                                              Citizens
                                                                          Female (overall)

                                                                                                                                                                                       Secondary
                                              20-24 years

                                                            25-29 years

                                                                                                                20-24 years

                                                                                                                              25-29 years

                                                                                                                                                                             Primary

                                                                                                                                                                                                   Tertiary

                                                                                                                                                                                                                         Non-citizens
                                                                                                                                                            No formal edu.
                                                                                                                                            Urban
          Male (overall)

                           o/w: 15-19 years

                                                                                             o/w: 15-19 years

                                                                                                                                                    Rural

                                                                                                                                                                                                                                         40
                                                                                                                                                                                                                                         30
                                                                                                                                                                                                                                         20
                                                                                                                                                                                                                                         10
                                                            By                                                                                 By                               By                                By                      0
                                                       sex and age                                                                          geography                        education                        residency                           1997-2001           2002-2006          2007-2011       2012-2016
 Source: Department of Statistics, Malaysia.                                                                                                                                                                                            Sources: CEIC Data Co. Ltd; and IMF staff calculations.

16.      The rising share of tertiary–educated workers in the unemployment pool suggests
skills mismatch that needs to be addressed. Public spending on education, as a share of GDP,
is much higher in Malaysia than in peer countries. But the quality of education needs
improvement and the authorities are paying attention (see, for example, Malaysia Education
Blueprint, Pre–School to Post–Secondary Education, 2013–2025 and Malaysia Education Blueprint,
Higher Education, 2015–2025). Further improving the quality of education and better alignment
of learning opportunities with evolving business needs should help lower skills mismatch,
although achieving a 35 percent share for skilled employment by 2020 appears optimistic given
the pace of improvements so far. Additionally, while the gender gap in school enrollment has
been bridged, the overall level of enrollment in higher education remains significantly below the
average for high–income countries, an income group Malaysia aspires to join. The authorities
should continue to implement policies toward improving access to education and vocational
training; modernizing course contents, including in consultation with industries; training the
teachers; implementing dual language program to strengthen soft skills like English language
literacy; and improving the infrastructural facilities in educational institutions.

14        INTERNATIONAL MONETARY FUND
MALAYSIA

D. Labor Compensation and Productivity

Labor compensation

17.     Labor’s share in national income has increased in the last decade. Labor’s share in
national income has increased from 30 percent in 2005 to about 35 percent by 2015. Over 2011–
16, average real salaries and wages have increased at 3 percent compound annual rate. In
nominal terms, average salaries and wages are highest in the mining and quarrying sector, which
also has the highest labor productivity, followed by services sub–sectors of real estate;
information and communication; education; and financial activities. Average salaries and wages
in the manufacturing and wholesale and retail sales sectors were lower than the national average.

18.      Malaysia has a much smaller gender earnings gap than most advanced and
emerging market economies.12 In 2016, female workers’ average salaries and wages were about
4 percent below the average for male workers. Industry–wise, female workers earned about
30 percent less than males in agriculture, forestry, and fishing, whereas their average salaries and
wages were higher in the construction sector, reflecting a higher share of female workers in
skilled and semi–skilled occupations in that sector. Earning premia for higher–educated workers
and skilled workers have declined slightly over 2011–16, partly because of the implementation of
a minimum wage framework since 2013 that
                                                           Table 2. Malaysia: Minimum Wages
benefitted lower wage earners. State–wise, the
                                                                       (Monthly; in ringgit)
gap between the states with the lowest and the
highest average earnings has declined                                                   2013–15  2016
somewhat. However, slower increase in average           Peninsular Malaysia                  900 1000
salaries and wages in rural areas has contributed       Sabah, Sarawak, and the              800  920
to a larger gap with urban areas.                       Federal Territory of Labuan
                                                                                             Source: Attorney–General’s Chambers, Malaysia, Official

  Malaysia: Earnings Gaps by Type of Workers 1/                                              Malaysia: Salaries and Wages by Type of Workers
  (Based on ratios of lowest and highest average salaries and wages within each              (Percent changes in average monthly salaries and wages by categories)
  category; higher ratio implies improvement toward equality)
  100                                                                                                            Ranges of annual percent changes over 2011-16                                                                             2016
                                                                                               20
   80                                                                2010    2016              15
   60                                                                                          10
                                                                                                5
   40                                                                                           0
   20                                                                                          -5
                                                                                                               Male

                                                                                                                                                                           Secondary

                                                                                                                                                                                                                  Semi-skilled

                                                                                                                                                                                                                                 Skilled

                                                                                                                                                                                                                                            Citizens
                                                                                                                                                                                                  Elem. Occu.
                                                                                                                                                                 Primary

                                                                                                                                                                                       Tertiary

                                                                                                                                                                                                                                                       Non-citizens
                                                                                                                      Female

                                                                                                                                                No formal edu.
                                                                                                                                Urban
                                                                                                      (mean)

                                                                                                                                        Rural

           Gender     Rural-urban     States     Education      Skills 2/   Residency
  Sources: Department of Statistics, Malaysia; and IMF staff calculations.
  1/ Ratio of average salaries and wages of: female workers to male workers (gender
  gap); rural workers to urban workers (rural-urban gap); the state with lowest mean
  payments to the state with highest payments (state-wise gap); relative to payments
  to tertiary-educated workers, averaged across workers with no formal education or                 Overall       By              By                                By                                             By                           By
  primary education (education-related gap); workers in elementary occupation to                                  sex          geography                         education                                      skills 1/                   residency
  skilled workers (skill-related gap); and non-citizens to citizens (residency based gap).   Sources: Department of Statistcis, Malaysia; and IMF staff calculations.
  2/ Data on skills cover 2012-16 period. Skilled-workers are defined by the following       1/ Data by skills cover 2013-16 period. Skilled-workers are defined by following
  occupations: managers, professionals, technicians and associate professionals. Semi-       occupations: managers, professionals, technicians and associate professionals. Semi-
  skilled workers are those who are neither in skilled nor in elementary occupations.        skilled workers are those who are neither in skilled nor in elementary occupations.

12
   See Table C2 in Appendix C of the World Economic Forum’s Global Gender Gap Report, 2016 for female-to-
male earnings ratios in other countries.

                                                                                                                  INTERNATIONAL MONETARY FUND                                                                                                                         15
MALAYSIA

Labor productivity

19.     Since 2014, labor productivity growth has recovered. Labor productivity growth
weakened over 2009–13, but improved to about 3½ percent per annum average rate over 2014–
16.13 Following Klyuev (2015), a decomposition
                                                       Malaysia: Labor Productivity
of Malaysia’s labor productivity growth shows          (Year-on-year change, in percent)
                                                          8
that within–sector productivity improvements
                                                          6
have played a leading role in explaining overall
                                                          4
productivity growth.14 Sectoral reallocation of           2

labor played a smaller role, except over 2006–10          0

when a productivity decline in the mining and            -2

quarrying sector during 2008–09 lowered the              -4

total contribution of within–sector productivity.        -6

                                                                                                           2001

                                                                                                                  2002

                                                                                                                         2003

                                                                                                                                2004

                                                                                                                                       2005

                                                                                                                                              2006

                                                                                                                                                     2007

                                                                                                                                                            2008

                                                                                                                                                                   2009

                                                                                                                                                                          2010

                                                                                                                                                                                 2011

                                                                                                                                                                                        2012

                                                                                                                                                                                               2013

                                                                                                                                                                                                      2014

                                                                                                                                                                                                             2015

                                                                                                                                                                                                                    2016
The manufacturing sector (particularly
                                                       Sources: Department of Statistics, Malaysia; and IMF staff calculations.
during 2001–05) and the services sector have
been the main contributors to within–sector productivity gains, with the agricultural sector
maintaining a small, but positive, contribution. The negative contribution from the interaction
term reflects primarily the decline in productivity, on average, in the mining and quarrying
sectors, while in 2016 it shows the impact of the lower combined shares in employment by the
mining and manufacturing sectors, which offset the turnaround in productivity in the former.

     Malaysia: Contributions to Overall Within-Sector Labor                                         Malaysia: Contributions to Labor Productivity Growth
     Productivty Growth by Sector                                                                   (In percentage points; simple averages across time for the pre-2016 periods)
     (In percentage points; simple averages for the pre-2016 periods)                                4.0
                                                                                                                                                                                                 Interaction
      4                                                                                              3.5
                                                               Services
                                                                                                     3.0
      3
                                                               Construction
                                                                                                     2.5                                                                                         Intersectoral
      2                                                                                              2.0                                                                                         reallocation of
                                                               Manufacturing
                                                                                                                                                                                                 labor
      1                                                                                              1.5
                                                               Mining and quarrying                                                                                                              Within sector
                                                                                                     1.0                                                                                         productivity
      0
                                                               Agriculture, forestry, and fishing    0.5
     -1                                                                                              0.0                                                                                         Oveall labor
                                                               Overall within-sector
                                                               productivity growth (in percent)     -0.5                                                                                         productivity
     -2                                                                                                                                                                                          growth (in percent)
             2001-       2006-       2011-        2016                                              -1.0
             2005        2010        2015                                                                   2001-2005           2006-2010            2011-2015              2016
     Sources: Department of Statistics, Malaysia; and IMF staff estimates.                          Sources: Department of Statistics, Malaysia; and IMF staff estimates.

13
  Labor productivity is defined as the ratio of value–added across all industries (i.e., the real GDP) to total
employment. It is not adjusted for hours worked and/or quality of labor inputs. Labor productivity growth was
about 4 percent on a year-on-year basis in the first nine months of 2017.
14
  Klyuev, Vladimir, 2015, “Structural Transformation—How Does Thailand Compare?”, IMF Working Paper, WP
15/51, International Monetary Fund.

16         INTERNATIONAL MONETARY FUND
MALAYSIA

20.     However, during 2010–16, labor productivity growth, on average, lagged the rise in
real labor earnings. During this period, average labor productivity has improved at a much
slower pace of about 1½ percent per annum, which was about 1–1½ percentage points slower
than the average rise in real earnings for workers or in unit labor costs. Sectors that experienced
highest negative gaps between labor productivity and labor real earnings accounted for close to
one–third of total employment. For the two largest employing sectors (viz., manufacturing and
wholesale and retail trade), productivity and real wage growth were broadly similar, on average.
On the other hand, in the construction and information and communication sectors labor
productivity gains were faster than real labor earnings growth. In the first nine months of 2017,
labor productivity growth outpaced real wage growth.

  Malaysia: Real Labor Cost and Labor Productivity                                Malaysia: Changes in Labor Productivity and Real
  (Percent change)                                                                Salaries and Wages by Industry
    5.0                                                                           (In percent; compound annual average rate over 2010-16)
             Real earnings
    4.5      Unit labor cost 1/                                                         10

                                                                                   Changes in average real salaris and wages
    4.0      Labor productivity                                                                                                                                                                                        Agriculture, forestry and
                                                                                                                               8                                                          Accommodation and food
    3.5                                                                                                                                                                                     and beverage service
                                                                                                                                                                                                 activities
                                                                                                                                                                                                                                fishing
                                                                                                                                                                                                                                  Professional, scientific and
    3.0                                                                                                                        6                                 Real estate activities
                                                                                                                                                                                                                 Education            technical activities
                                                                                                                                         Mining and quarrying
    2.5                                                                                                                        4                             Administrative and support
                                                                                                                                                                 service activities
                                                                                                                                                                                                                                                     Construction
    2.0                                                                                                                        2          Human health and social
                                                                                                                                                                                   Financial and
                                                                                                                                                                                                                      Manufacturing
                                                                                                                                                                             insurance/takaful activities
    1.5                                                                                                                                       work activities                                                       Transportation and storage     Information and
                                                                                                                                                                                                                                                    communication
                                                                                                                               0
    1.0                                                                                                                                  Changes in labor            Electricity, gas, steam and air
                                                                                                                                         productivity smaller             conditioning supply
    0.5                                                                                                                        -2        than changes in real                                  Wholesale and retail trade;
                                                                                                                                         salaries and wages                                   repair of motor vehicles and
    0.0                                                                                                                        -4                                    Changes in labor                  motorcycles              Water supply; sewerage,
                                                                                                                                                                     productivity larger
                      2010-15 2/                             2016                                                              -6                                    than changes in real
                                                                                                                                                                                                                                waste management and
                                                                                                                                                                                                                                 remediation activities
                                                                                                                                                                     salaries and wages
 Sources: Department of Statistics, CEIC Data Co. Ltd.; Malaysia; and IMF staff
                                                                                                                               -8
 calculations.
                                                                                                                                    -8           -6             -4           -2              0              2            4            6              8              10
 1/ Computed as growth in the ratio of total payments for salaries and wages to
                                                                                                                                                                               Changes in labor productivity
 gross domestic product.

21.      Given its importance in the economy, the services sector should play a leading role
in sustaining future increases in productivity. While the overall labor productivity growth
in 2016 and the first nine months of 2017 met the 11MP aspirations, a sustained rise in the
services sector productivity to 4.1 percent under the Plan’s objectives seems optimistic given
earlier performance (2001–15 average: 2.3 percent; 2016: 2.8 percent). In this context,
productivity improvements in the following sub–sectors could have a greater impact on sectoral
and economy–wide productivity: wholesale and retail trade; accommodation and food and
beverages; education; transportation and storage; and healthcare. The Malaysia Productivity
Blueprint has identified nine subsectors that are considered critical for improvements in
productivity. Overall, staff’s medium–term baseline projects a modest improvement in economy-
wide labor productivity, between 2 and 3 percent per annum on average (faster than the
historical average of about 2 percent, but slower than that assumed under the 11MP)
accompanied by capital deepening.

E. Conclusion

22.    The labor market in Malaysia has evolved and performed strongly in the last three
decades, but there is room for further policy action to strengthen its performance. The
labor market has evolved in line with economic and social transformations over the past three
decades. Employment has kept pace with labor supply, helping maintain a stable unemployment

                                                                                                                                              INTERNATIONAL MONETARY FUND                                                                                                17
MALAYSIA

rate since the late 1990s. Labor’s share in income has also gone up in recent years. However,
some structural frictions remain and addressing them would help in realizing medium–term
economic aspirations. As outlined in the 11MP and in several blueprints, policies should continue
to be holistic with special focus on improving delivery of conventional and vocational education
and their quality; creating skills that meet industry’s needs; encouraging R&D; and incentivizing
further female labor force participation. Any reform to foreign labor policies, aimed at inducing
firms to switch to more capital-intensive technology, should be market-based, clearly
communicated, and gradually phased-in to allow sectors that rely on foreign workers to adjust.
Improved labor market outcomes, along with updated public infrastructure and regulatory
framework will help further improve the business environment, support higher private
investment, and contribute to lower external imbalances.

18   INTERNATIONAL MONETARY FUND
MALAYSIA

CALIBRATION OF FISCAL OBJECTIVES FOR MALAYSIA1
1.      The analysis in the paper illustrates the implications of the debt limit for the conduct
of fiscal policy. It finds that, under unchanged policies, maintaining public debt below the policy
objective over time would require a significant reduction in today’s debt-to-GDP ratio. Otherwise,
the policy response to shocks may be more restricted than in the past. The debt reduction can be
achieved with a low deficit sustained over the long term.

2.      Fiscal deficit reduction is driving               Malaysia: Gross Nominal Public Debt
Malaysian debt down consistently. As shown in             (In percent of GDP)
                                                             p
the Debt Sustainability Analysis (DSA) in                  60

Appendix IV of the companion Staff Report, the             50

Federal Government Debt is expected to fall to less        40
than 45 percent of GDP by 2022. The debt is
                                                           30
expected to fall in the baseline and under a variety
of shocks. Even the most severe shocks would lead          20

to sustainable debt levels.                                10
                                                                    projection
                                                            0
3.       Fiscal policy is currently anchored by              2016    2017    2018   2019   2020   2021    2022   2023

debt and deficit targets. The Malaysian
authorities are conducting fiscal policy with an
                                                          Malaysia: Medium-Term Fiscal Outlook
objective of achieving a near balance over the            (In percent of GDP)
medium term. This objective has been the driver of
the continuous fiscal deficit reduction over the past
several years. Together with this objective, the
ceiling of 55 percent of GDP for federal
government debt, has been a major anchor for
fiscal policy.

4.      The framework that limits the overall
level of public sector debt is based on several
laws that limit several aggregates. There is a
legal ceiling of 55 percent of GDP for government securities, that is, Malaysian Government
Securities (MGS), which are regular securities, and Malaysian Government Investment Issue (MGII)
and Malaysian Islamic Treasury Bills (MITB), which are securities based on Islamic legislation. In
addition, external debt and Treasury Bills are subject to ceilings of 35 billion ringgit and 10 billion
ringgits respectively. The authorities have conveyed their policy of maintaining overall federal
government debt below 55 percent of GDP but have not established this objective in legislation.

5.    The definition of a fiscal framework for the long term would be very beneficial. A
framework that ensures fiscal sustainability and is well communicated to markets would foster

1
    Prepared by Juan Manuel Jauregui.

                                                                      INTERNATIONAL MONETARY FUND                       19
MALAYSIA

investment and growth. By anchoring market expectations, it can increase demand for government
securities, reducing interest rates. Lower interest rates can increase domestic investment by reducing
the cost of financing. A well-defined fiscal framework can also increase private investment by
informing market participants about the level of taxation in the long term. This paper aims at
providing a quantitative analysis that can help the authorities in defining long-term policy targets.
The analysis is illustrative and complements the advice provided in the companion Staff Report,
which factors in the entire macroeconomic policy mix.

A. Debt Targets and Likelihood of Breaching the Debt Ceiling

6.      The analysis follows a methodology developed by FAD. A detailed explanation is
presented in “How to Calibrate Fiscal Rules: A Primer” by FAD. This stochastic analysis estimates a
multivariate normal distribution of the variables involved in a debt accumulation equation. It
complements the DSA, which is based on the baseline debt projections and deterministic shocks
applied to the baseline. Annual data covering the 20-year period from 1997 to 2016 are used to
estimate the distribution of the variables involved in the evolution of public debt. The multivariate
normal distribution of a k-dimensional vector of macroeconomic variables can be written as:

                                      ~    ,Σ

                                                        with the k-dimensional mean vector

                                                ,           ,… ,

                                                        and the         covariance matrix

                                  Σ                 ,       , for all   1,2, … , ;       1,2, … ,

7.      A set of macroeconomic variables are forecast over a 6-year projection horizon N
times by drawing from the calibrated multivariate distribution of macroeconomic variables
each year. The N sets of macroeconomic variable forecasts are used to generate N trajectories of
the primary balance, using the estimated fiscal reaction function (FRF) and the level of debt in the
preceding year. The FRF applicable for either an advanced or emerging market economy is based on
the specification of Bohn (1998)2. The coefficients of the FRF are estimated econometrically to
capture historical fiscal behavior. The estimation is carried out using separate panels for advanced
and emerging market economies, so that the estimated FRF coefficients differ between income
groups. The estimated specification is:

                                                                                     1

where       is the primary balance (as a ratio of GDP) of country i in year t,    is debt (as a ratio of
GDP),          is the output gap,    is an indicator variable taking the value of one when the output
gap is positive, is the country specific intercept term (fixed effect) and      is a random error term,

2
    Bohn, H. 1998, “The Behavior of U.S. Public Debt and Deficits,” Quarterly Journal of Economics, 87.

20      INTERNATIONAL MONETARY FUND
You can also read