Unfinished Business: Barriers and opportunities for older workers
←
→
Page content transcription
If your browser does not render page correctly, please read the page content below
Unfinished Business:
Barriers and opportunities
for older workers

Giselle Cory

August 2012
© Resolution Foundation 2012

                               E: info@resolutionfoundation.org   T: 020 3372 2960   F: 020 3372 2999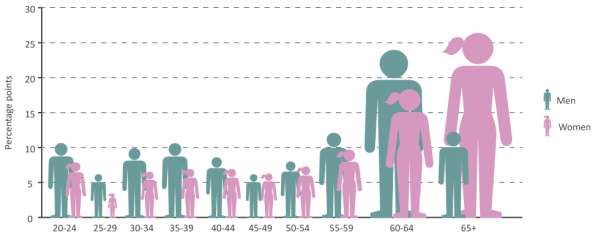
Contents
Executive summary ......................................................................................................................................... 3
Introduction ...................................................................................................................................................... 5
Section 1 – The level of older employment has risen, but there is room for improvement .................. 8
Section 2 – The UK lags behind similar countries .................................................................................. 24
Section 3 – There are significant barriers to employment for older people ..................................... 31
Conclusion: The need to support longer working lives ......................................................................... 40

This work contains statistical data from ONS which is Crown Copyright. The use of the ONS statistical
data in this work does not imply the endorsement of the ONS in relation to the interpretation or
analysis of the statistical data. This work uses research datasets which may not exactly reproduce
National Statistics aggregates.

                                                                                                                                                       2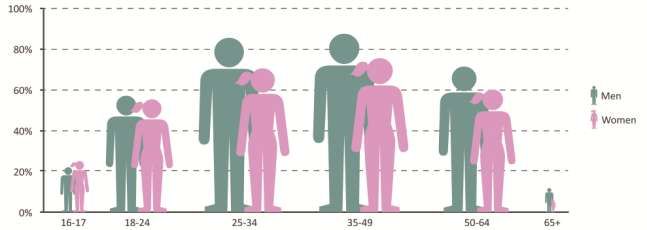
Executive summary
Older workers are a significant and growing part of the UK workforce. More over-50s are working
now than in the recent past and many are working for longer. This is a welcome trend as many older
people want to work beyond state pension age. However, there are also strong financial imperatives
to extend working lives. The cost of living is high and rising. People are living longer, healthier lives
but pension schemes are no longer offering generous provision for older age, placing an onus on
people to provide for themselves. Given that the majority of household saving for retirement is done
after people reach age 50, extending working lives is critical to avoiding poverty in later life. Put
these factors together and longer working lives become vital for many households to maintain a
decent standard of living into retirement.

There are clear signs that the UK could improve the employment situation of older people. The over
50s are less likely to be employed than younger people and we know internationally that this does
not need to be the case. They are also more likely to be long-term unemployed than younger
workers and face greater barriers to finding a job than their younger counterparts. Furthermore,
there is a large employment gap for older people between the UK and some of our international
competitors. The average employment rate for 55 to 64 year olds in the five best performing
countries – Iceland, New Zealand, Sweden, Norway and Switzerland - is around 15 percentage points
higher than in the UK. If we were to match the average employment rate of older people in those
countries in the OECD that currently outperform us, 1.5 million more 50 to 64 year olds would be in
work.

Two groups of older people in the UK face particular barriers to employment and have benefited less
from the recent growth in employment rates. Over 50s living in low to middle income households
(LMIs) are less likely to be in work than those living in higher income households. However, they face
greater financial pressures to remain in work in order to keep saving for later life. Older women are
less likely to be employed than older men. Though this partly reflects a difference in the state
pension age, the gender gap widens for people in their 50s, well before either sex reaches
pensionable age.

Planned increases in the state pension age over time, particularly for women, will create new
financial incentives for older workers to remain in employment. However, without parallel changes
to tackle the other barriers to older employment, this change will hinder rather than help some
older women who are unable to find or keep employment. The employment gap between the UK

                                                                                                            3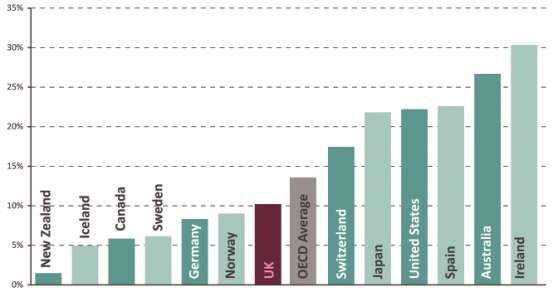
and our international competitors for those in their 50s suggests that other factors work against
employment among the over fifties.

Poor health and caring responsibilities are two of the major factors that push older people out of the
labour market. Better access to flexible working opportunities will be critical to tackling both barriers
but women and those on low to middle incomes who most need flexibility are least likely to benefit
from it. A lack of targeted support for older unemployed people to find work coupled with age
discrimination in the workplace can also prevent or disincentivise longer working lives. Beyond the
state pension age, there are a series of other financial incentives, such as the availability of
alternatives to retirement benefits such as Employment Support Allowance and the structure of age-
related national insurance contributions, that could be strengthened or better aligned to promote
longer working lives.

As the population ages and both the proportion of older workers and the demand for informal care
rise, the need for government and employers to facilitate extended working lives will only become
greater. The barriers to older employment are not insurmountable. A second report, to be published
later this year, will give detailed policy recommendations designed to increase opportunities for
older people to have longer working lives.

                                                                                                       4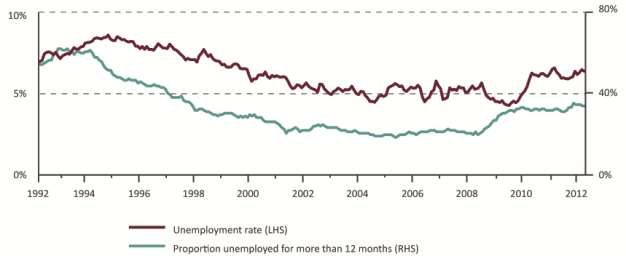
Introduction
Older workers are a significant group within the UK’s workforce. Over the last two decades,
employment among the over 50s has grown by a third with many of those who choose to work,
working for longer.1 Although the recession has seen unemployment among the group double, with
an aging population, we would expect the number of older people in work to continue to increase in
the future.

There are many reasons to suggest that longer working lives are the result of positive changes –
longer, healthier lives, improvements in healthcare and a more skilled workforce. But beyond the
good news, there is also a pressing need to extend working lives. For many people on low to middle
incomes, a longer working life is simply a necessity to maintain a decent standard of living, rather
than a choice.2 The cost of living is rising, while wages have stagnated for all but the richest
households3 and long-term growth in salaries for 50 to 59 year olds is lagging behind that of 30 to 49
year olds.4 Most importantly, for many, the majority of their saving for retirement is done after they
turn 50 which makes the later working years critical to building sufficient savings to avoid poverty in
retirement.5 This is especially important because income from the state pension is low relative to
other comparable countries6 and two in three are not contributing to a private pension7. In fact, only
one in four people in work aged between 50 and SPA are likely to be able to meet their target
income in retirement if they stop working at SPA.8

From a national rather than a household perspective, long working lives are equally critical. An aging
population and rising life expectancy will put a strain on the taxpayer-funded public pension system.
Public spending on pensions more than doubled between 1980 and 20109 in real terms and is
projected to rise further to £250bn by 2050.10 However, the forecast for public spending on pensions
in the UK is favourable when compared to some of our nearest neighbours. The comparatively high

1
  ONS, “Labour market statistics”, June 2012
2
  Adults in low to middle income households (LMIs) have a household income that is below the median but are broadly
independent of state support
3
  Resolution Foundation, “Growth without gain? The faltering living standards of people on low-to-middle incomes”, 2011
http://bit.ly/N0adsj
4
  Resolution Foundation analysis of ASHE: Refers to gross weekly pay for full-time employees, 1975 – 2010
5
  Cabinet Office, “Winning the generation game”, 2000
6
  OECD, “Pensions Outlook”, 2012
7
  Resolution Foundation analysis of the Family Resources Survey 2009/10; Private pension refers to personal or
occupational pension
8
  Pensions Policy Institute, “Retirement income and assets: the implications for retirement income of Government policies
to extend working lives”, 2012
9
  DWP, “A sustainable state pension”, 2010
10
   ONS, “Pension trends”, Chapter 5: State pensions, 2012
                                                                                                                        5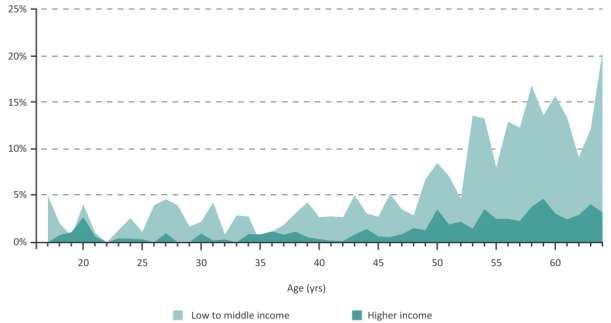
replacement rates afforded by state pensions in much of Western Europe coupled with faster rates
of population aging leave these countries worse off.

It is, therefore a concern that employment for the over 50s still lags behind that of core ages and
behind many of our international competitors. Although the UK is a good performer by continental
European standards, we fall behind in comparison to Scandinavian and North American countries.
The average employment rate for the over 50s in the top five performing countries for older
employment is 72.3 per cent, around 15 percentage points higher than the UK rate. Over a million
more older people would be in work if the UK matched the employment rate for 50 to 64 year olds
of better performing countries in the OECD.11

Of course, some of this gap in performance is linked to the low female state pension age that the UK
has had up until now. Raising the state pension age will no doubt increase employment among older
people by creating a strong financial incentive to remain in work. However, it is not a panacea.
Without parallel changes in the employment support on offer for older people, this change will
hinder rather than help some older women. Furthermore, the presence of significant employment
gaps between the UK and the best performers in the OECD for those in their fifties, five to 10 years
before state pension age, suggests that ill-health, caring responsibilities, access to employment
support and the availability of flexible working are also important barriers. The majority of older
people want to work past state pension age, yet too many are faced with major barriers to working
in later life.

Barriers are particularly high for certain groups. Although the growth in employment rates among
older women has outstripped that of men over the last twenty years, there is still a significant
gender gap in employment for this age group and a large gender pay gap.12 Older people in the low
to middle income group also fall behind their more affluent peers, with potentially severe
consequences for standards of living in retirement.13 The majority of this group are not eligible for
means-tested pension benefits yet are unable to build sufficient savings to maintain a comfortable
standard of living in retirement. As a consequence, more than one in three low to middle income
households is worried about managing financially in retirement. 14

11
   Resolution Foundation analysis based on OECD data
12
   ONS, “Labour market statistics”, June 2012
13
   Resolution Foundation analysis based on the Family Resources Survey 2009/10
14
   Unpublished: polling for Resolution Foundation of 2,000 British adults carried out face to face by Ipsos MORI during 30
March – 5 April 2012. Data are weighted to the national profile. Other results from the poll can be found in Resolution
Foundation’s press release, 25 April 2012 http://bit.ly/LIHtVe
                                                                                                                             6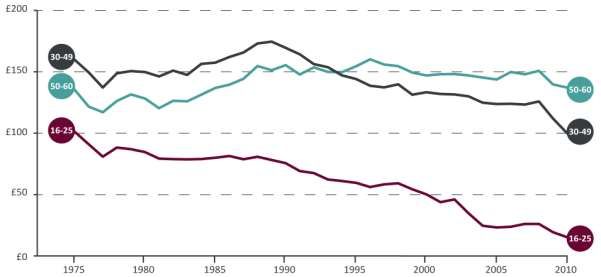
The overall policy framework for older people, whether working or retired, has evolved in a highly
piecemeal fashion and much of it feels dated. High levels of poverty in the 1980s and much of the
1990s still forms the back-drop to the way older people are treated in the tax and benefit system.
This approach was successful in reducing poverty among this group – pensioner poverty is now at its
lowest level since 198415. And it is of course the case that for many pensioners poverty remains a
pressing problem that needs to be addressed. But it is also the case that the economic position of
older people, including pensioners, is dramatically more diverse that in was in the past. Yet aspects
of benefits policy still treat pensioners as if they were a relatively homogenous group. And the rise in
state pension age and abolition of the default retirement age, though welcome developments, have
not been coupled with a wider labour market policy that reflects and promotes longer working lives.
Current reforms to the employment support system, predominantly through the Work Programme,
and to the benefits system through the introduction of Universal Credit, are an opportunity to
address the barriers faced by older workers – but they risk being an opportunity missed. The social
care system is yet to be reformed – or a new funding system agreed – so that it is able to meet the
impending increase in demand and support more people to stay in employment. The challenges we
face in extending working lives will only become more profound as the nation ages. In fact, there is a
risk of exacerbating current inequalities in retirement incomes if we fail to address barriers to older
employment, particularly for women and those on low to middle incomes.

This report is the first of a major study into the older workforce who are a critical to maintaining
living standards now and into the future. This report describes the older workforce, with a particular
focus on older people in low to middle income households who have the greatest need to remain in
work and also face the highest barriers. A second report, with detailed policy recommendations, will
be published later this year.

This report is structured in three sections. Section 1 sets out the situation for older workers in the UK.
Section 2 compares the employment of older people in the UK with that of other, similar countries in
the OECD. Section 3 identifies the key barriers to employment for older workers in the UK.

15
     IFS, “Living standards, poverty and inequality in the UK: 2012” for JRF, 2012
                                                                                                          7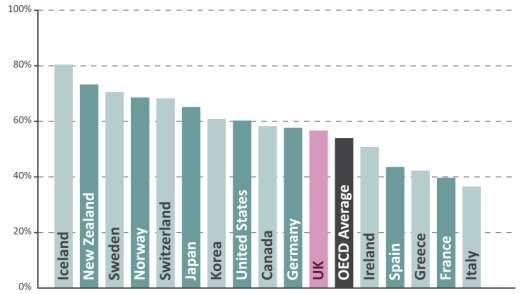
Section 1 – The level of older employment has risen,
but there is room for improvement
There are currently 8.4m people over the age of 50 in work, making up 29 per cent of the
workforce.16 Following a strong trend to early retirement in the 1970s and 80s, the employment rate
of older people (aged 50 to 64) rose steadily until 2003. From 2003 to 2008, the employment rate
improved only slightly, before falling in 2008 as shown in Figure 1. The number of older people17 in
employment increased from 5 million in 1992 to 7.5 million in 2012, a rise of 50 per cent. The
corresponding rise in the employment rate from 56.5 per cent to 65.7 per cent was less stark
because the number of over 50s in the population was simultaneously increasing as the baby
boomers moved towards retirement. Not only are more people in work, but many are also working
for longer: the average retirement age rose by a year for men and by two years for women between
1984 and 2010.18 Men now retire on average a few months before the male state pension age (SPA)
at 64 years 7 months, and women retire more than two years after the female SPA, at 62 years 4
months.19

                  Figure 1: Employment and inactivity rates for 50 to 64 year olds from 1992 to 2012 (UK)

                                    Source: ONS, “Labour market statistics”, June 2012

16
   Resolution Foundation analysis based on the Labour Force Survey
17
   Older people refers to those aged 50-64 unless otherwise stated
18
   ONS, “Pension trends”, Chapter 4: The labour market and retirement, 2012; Refers to the effective retirement age, which
is the age at which someone retires rather than the official retirement age or state pension age (SPA)
19
   ibid
                                                                                                                        8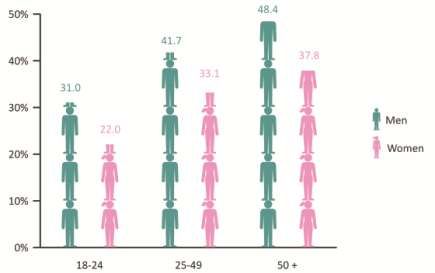
Around two in three older people are in work, compared to four out of five of the 25 to 49 year old
age group. Figure 2 shows the employment rates of each age group for men and women. While
some of the difference in employment levels is the result of retirement decisions, particularly the
sharp drop in employment post-65, retirement does not account for the entire employment gap
between the generations. The majority of those leaving their jobs between 50 and 64 move into
unemployment or onto disability benefits rather than retirement.20 The employment gap between
older and younger people is partly explained by factors that take older people out of the labour
market – the nature of work-related financial incentives including pensions, caring responsibilities
and poor health – as well as factors that form barriers to entry for older jobseekers, including
inadequate back-to-work support, age discrimination and lack of training opportunities. These
barriers are discussed in more detail in Section 3.

                                     Figure 2: Employment rate by age and gender (UK)

                                     Source: ONS, “Labour market statistics”, June 2012

20
     OECD, “Pensions at a Glance: Retirement-income systems in OECD and G20 countries”, 2011
                                                                                                       9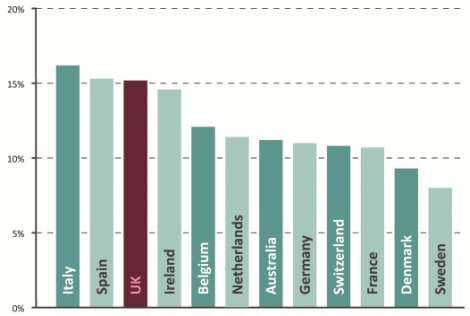
As well as the likelihood of being in work, the nature of work also varies with age. Figure 3 shows the
share of different types of employment by age. As we might expect, the proportion of workers who
are full time employees falls with age, while the proportion in part time employment rises. Full and
part-time self-employment is more common among older groups.
Figure 3: Share of employment by whether full or part time employed or self-employed, by age (UK)
Source: Resolution Foundation analysis based on the Family Resources Survey 2009/10
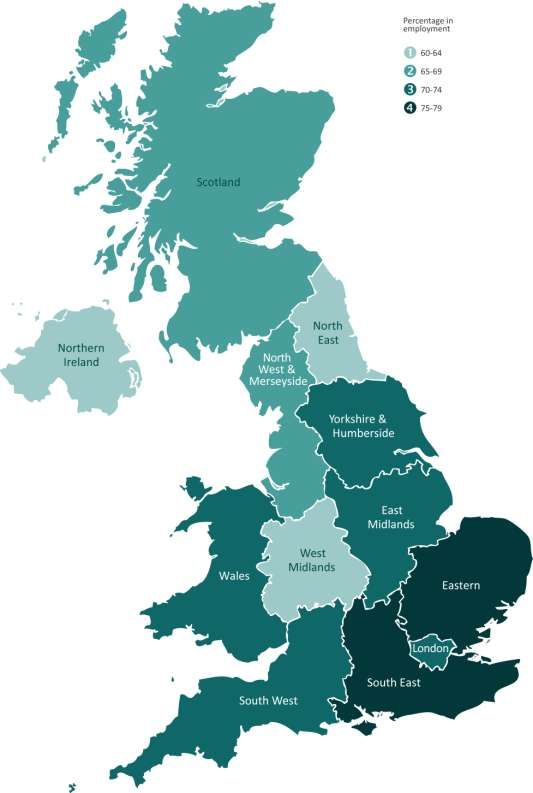
There are also significant regional differences in the employment levels of people aged 50 to SPA as
shown in Figure 4. The regional employment rate for this group varies from 60 per cent in the North
East and Northern Ireland to a high of 77 per cent in the Eastern region.21 This level of regional
variation is more than twice that of 16 to 49 year olds.
The prevalence of different types of employment also varies significantly between regions. For
example, self-employment is most common in the Southern and Eastern regions, and lowest in the
North East and North West. Unsurprisingly, the areas with the lowest employment rates also have
the highest permanent sickness and disability rates as well as the highest proportion of retired
people.
21
Resolution Foundation analysis based on the Family Resources Survey 2009/10; Employment includes full-time and part-
time employed and self-employed
10Figure 4: Employment rates for those are aged 50 to SPA for each Government Office region of the UK
Source: Resolution Foundation analysis based on the Family Resources Survey 2009/10
Notes: Employment includes full-time and part-time for both employment and self-employment
11Unemployment among older workers
The proportion of the group that is unemployed has fallen over recent decade and appears low
compared to younger generations. However, it is notoriously difficult to measure unemployment
among older people. The normal way to understand unemployment is by looking at the
unemployment rate, which is a measure of people who are not in work and are actively seeking it.
Amongst the young, this rate encapsulates the vast majority of people who are not working but
would like to be. The same cannot be said of the over-50s. This is because some older people do not
classify themselves as unemployed, despite wanting to work. Considering the difficulties older
people face in finding work, some chose to associate themselves with a less stigmatized label. One
estimate finds one in four older people (50 to SPA) who aren’t in work want to be, despite not
seeking it. 22 These people are not counted in the official unemployment rate, making it artificially
low.
Although the true level of unemployment among older people is difficult to quantify, it is clear that
finding a new job is tough. In fact, the older a person is the less likely they are to find a job.23 This is
reflected in the high proportion of older jobseekers who are unemployed for more than a year.
Around half of older unemployed people are in this position and, as Figure 5 shows, this is a higher
proportion than for any other age group for both men and women.
Figure 5: Proportion of the unemployed that have been so for over a year, by age group
Source: ONS, “Labour market statistics”, June 2012
22
A. Humphrey, P. Costigan, K. Pickering, N. Stratford, M. Barnes, National Centre for Social Research with IFS for
DWP, ”Factors affecting the labour market participation of older workers”, 2003
23
P. Stam and K. Long for ONS, “Explaining exits from unemployment in the UK, 2006–09”, 2009
12While this long term unemployment rate is high, it does not give the full scale of the difficulties older
people face finding work. This is because it does not include the significant proportion of older
people who have effectively given up their job search. In fact, one in two older unemployed people
become economically inactive (retirement or ill-health status), rather than moving back into work.24
Modelling by Herbertsson (2001) suggests that a 5 percentage point increase in the rate of older
unemployment results in a 2.5 percentage point fall in the participation rate of the group. In other
words, half of those who become unemployed give up their job search and leave the labour market
entirely.
Long-term unemployment has an immediate and significant impact in the form of loss of income and
status and an associated drop in standard of living, as well as its long-term effect on the likelihood of
future employment.25 Recent analysis by Policy Exchange shows that for those who do eventually
find work after a period of long-term unemployment in later life, the negative effect of
unemployment on future wages is considerably greater than it is for younger or middle-aged
workers.26
Older workers in recessions
Unemployment among older people soared at the onset of the financial crisis. Since 2008, the
number of unemployed people aged 50 to 64 has risen by 53 per cent. Over the course of the
economic slump, it has also become more difficult for the older unemployed to find work. The
proportion of the older unemployed group that is unemployed for over a year has risen from 33.2
per cent to 44.5 per cent as shown in Figure 6.27 Older workers have also seen the biggest increases
in redundancies over the course of the recession.28
24
OECD, “Pensions at a Glance”, 2011
25
S. Machin and A. Manning, “The Causes and Consequences of Long-Term Unemployment in Europe”, 1998
26
Policy Exchange, “Too Much to Lose: Understanding and Supporting Britain’s Older Workers”, 2012
27
ONS, “Labour market statistics”, June 2012
28
ibid
13Figure 6: Unemployment rate and proportion that are long-term unemployed for 50-64 year olds
Source: ONS, “Labour market statistics”, June 2012
However, the impact of the current recession has been less severe than that of previous ones for
several reasons. Industrial change and the predominance of older workers in part-time roles have
limited the adverse impact of weak labour demand. Conversely, greater job protection and the
reduced value of pension pots have led to older workers remaining in work for longer. A summary of
these factors is given in Table 1.
As Figure 7 shows that the proportion of workers of all ages in traditional industries has fallen from
nearly three in ten to one in ten since 1978. As older workers are more likely to be in these
industries, it is likely that this long-term decline has mostly affected the older workforce. Thousands
of older workers have become skilled in roles and industries that no longer exist, leaving a legacy of
high unemployment and inactivity among older people in some parts of the country. However, there
is also a more positive outcome of this shift. These sectors are vulnerable in recessions and tend to
see high levels of unemployment.29 A fall in the proportion of older workers in these industries
suggests a parallel fall in the vulnerability of the cohort to unemployment during recessions. Overall,
this shift from manufacturing to services should leave the older cohort less affected during
recessions.
29
The Work Foundation, “Recession and the Knowledge Economy”, 2009
14The increase in the prevalence of part-time work among
older people may also partly mitigate against the impact
of a recession. Over the last twenty years, it has become
much more common for older workers to be in part-time
roles. As these are also the type of roles that have shown
the most growth in the recent recession, it is not
surprising that older workers have fared better than in the
past.
Third, older workers have more employment protection
now than in the past (see table 1). Although major
Figure 7: Proportion of workforce jobs in concerns about age discrimination remain, the UK no
traditional industries, 1978 and 2012 longer has a default retirement age and has gained anti-
Source: ONS, “Labour market statistics”, June
discrimination legislation.
2012
Note: Traditional industries are defined here Finally, poor economic conditions reduce the value of
as agriculture, forestry & fishing, mining & pension savings. This in turn tends to affect the retirement
quarrying, and manufacturing
decisions of some would-be-retirees and can act as a
countervailing force to weak labour market demand. Left with a smaller pension pot than
anticipated, some people chose to stay in the workplace to bolster their savings. This effect is partly
behind the fall in the number of people retiring since 2008.30 These four factors do not act alone.
However they are likely to be key in explaining the impact of the current recession on older
employment as summarised in Table 1.
30
ONS, “Labour market statistics”, June 2012
15Table 1. Comparison of selected factors in 1980s and 2010s.
Then and…. Now
Industrial 28 per cent workers in traditional …Falling to 10 per cent in these industries
change industries (1978)… in 2010
Job The predominant measure affecting The removal of the default retirement age
protection employment decisions of older workers at in October 2011, which was introduced in
this time was the Job Release Scheme 2006 so that employees could be
(1977-88), intended to stimulate demand dismissed on reaching the state pension
for younger recruits by encouraging older age, means older workers can no longer
people to retire early.31 Employees had no be made redundant solely on the grounds
specific rights against age discrimination. of age. Anti-discrimination legislation also
protects older workers by making it illegal
to discriminate in recruitment or training
on the grounds of age.
Part-time 21.2 per cent of 55-64 year olds were in …rising by a third to 28.3 per cent in 2012.
roles part time roles (1983)…
Sources: ONS, “Labour market statistics”, June 2012
What do older workers want?
There is a considerable demand from employees to work beyond state pension age. Over half of
working age adults (56 per cent) want to continue working once they reach pensionable age.32 When
they do come to retire, many older people would like their retirement to be phased in rather than a
single event. Four out of five would find it appealing to combine part-time work with taking a partial
pension.33
31
Though since recognised to be a misguided attempt at easing the high youth unemployment of the time, the
scheme, had a significant effect on older employment rates which fell considerably over the period.
32
European Commission, "Active Ageing: Special Eurobarometer 378", 2012
33
D. Smeaton, S. Vegeris and M, Sahin-Dikmen, Policy Studies Institute for the Equality and Human Rights Commission,
“Older workers: employment preferences, barriers and solutions”, 2009
16Women and men have very similar preferences about working past SPA. Two thirds (64 per cent) of
older employed women would like to retire after 60. The same proportion of men would like to
retire at or after 65. However, this reflects SPA as it has been, not as it will be. With the female state
pension age rising, it is instructive to look at women’s attitudes to working beyond their mid-sixties.
Two thirds of older women would like to retire before the equivalent male SPA of 65.34 However,
this still leaves significant room for progress on older employment given the large numbers who
want to continue to work between 60 and 65.
Whatever older workers may want, many are not able to meet their preferences. For example, a
significant minority of retirees feel that they were forced to retire early. Conversely, some people
have to work longer than they would like out of financial necessity. Around one in ten of those
intending to retire after SPA felt that they had been forced to do so because they could not afford to
retire any earlier.35 This diversity of experience shows that older workers are not a homogenous
group. This reinforces the need to enable people to work or to retire, given their needs and
preferences.
Which groups of older workers are most affected?
While there are barriers to employment for older workers in general, people in low to middle
income households and women face particular challenges.
Older people in low to middle income households
Differences in employment within the older age group are more marked than those between age
groups.36 One quarter of adults living in low to middle income households are aged 50 or over. These
three million over-50s are less likely to be in work than those living in higher income households of
the same age, as Figure 8 shows. Older people in low to middle income households are also more
likely to be unemployed and, of the unemployed, are more likely to be long-term unemployed. Of
those who are not in work, the majority are in poor health or looking for work rather than retired.37
34
ibid
35
A. Humphrey, P. Costigan, K. Pickering, N. Stratford, M. Barnes, National Centre for Social Research with IFS for
DWP, ”Factors affecting the labour market participation of older workers”, 2003
36
D. Smeaton, S. Vegeris and M, Sahin-Dikmen, Policy Studies Institute for the Equality and Human Rights Commission,
“Older workers: employment preferences, barriers and solutions”, 2009
37
Resolution Foundation analysis based on the Family Resources Survey 2009/10
17Figure 8: Employment status for over-50s in low to middle income and higher income households
Source: Resolution Foundation analysis of the Family Resources Survey 2009/10
As well as the likelihood of being employed, the nature of work for low to middle income older
people is distinct from that of older people in higher income households. Older workers on low to
middle incomes are over-represented in traditional industries and are, therefore, more likely to face
unemployment during a recession.38 Furthermore, they are likely to be more directly affected by
projected falls in public sector employment over the next five years than their higher income
peers.39 Many in the group, especially women, work in the public sector in areas such as education,
health, social care and public administration.40
Older people in the higher income group tend to be in more senior positions and in professional
occupations, partly reflecting higher level skills and qualifications.41 Older low to middle income
workers tend to be in routine or semi-routine, sales and service and administrative and secretarial
roles42, jobs in which a higher proportion of workers feel that their job is less than ideal.43 The
benefits of high quality work are significant across all age groups. However this issue is particularly
38
Resolution Foundation analysis of the Family Resources Survey 2009/10
39
OBR, “Economic and fiscal outlook”, March 2012
40
Resolution Foundation analysis based on the Family Resources Survey 2009/10
41
ibid
42
ibid
43
D. Smeaton, S. Vegeris and M, Sahin-Dikmen, Policy Studies Institute for the Equality and Human Rights Commission,
“Older workers: employment preferences, barriers and solutions”, 2009
18relevant to extending working lives given that the employment rates of older people are related to
the quality of their employment.44
Women
Overall around 60 per cent of the growth in older employment over the last three decades has been
due to a rise in female employment.45 Over the last twenty years, older women’s employment rates
rose by 28 per cent while older men’s employment rates grew by only 8 per cent. It is to be expected
that older women’s employment rates have grown proportionately more than older men’s as each
successive cohort of women since the middle of the last century has had a greater degree of labour
market attachment than its predecessors, raising female employment rates at all ages. As with the
current younger generation, the movement of older female workers into the labour market has
made a significant contribution to household living standards. However, despite this growth, older
women remain less likely to be employed than older men: 60.1 per cent are employed compared to
71.6 per cent of men.46
The UK gender gap – the difference between the employment rates of men compared to women – is
greater for the over-55s than for any other age group. In part, this reflects changing attitudes to
female employment over time. As it becomes more acceptable and possible for women to have a
career and a family, more women will move into and stay in work. This means that the gender gap
among older people will always be larger than among younger age groups. It is, therefore, more
relevant to look at differences between similar age groups.
The employment gap between men and women between 60 and 64 years old is particularly large, at
20 percentage points. In part, this reflects differences in the state pension age. With the female
state pension age previously 60 and the male SPA 65, it is not surprising that the gender gap in
employment for 60 to 64 year olds is so high. However, there is still a 10 percentage point gap in
employment between men and woman before SPA, between 55 and 59 years.47 The gender gap
shown in Figure 9 reflects differences in overall employment rates for men and women and does not
take into account differences in hours worked. As older women (much like those in their 30s and
44
L. Davoine “The Employment rate of “seniors” and employment quality throughout the life cycle: A comparative
approach”, 2005
45
Resolution Foundation analysis based on the Labour Force Survey
46
ONS, “Labour market statistics”, June 2012
47
Resolution Foundation analysis based on the Labour Force Survey
1940s) are much more likely to be in part-time roles than men, the gender gap in full-time equivalent
employment would be much greater.
Figure 9: UK gender gap for employment rates (percentage point addition for men)
Source: Resolution Foundation analysis based on the Labour Force Survey
Notes: Data refers to 2010
The female SPA is currently rising to equalise with the male SPA at 65, after which both will increase
incrementally to 68 by 2046.48 As there is a strong correspondence between the pension age and
labour market exit49, the rise in female SPA is likely to significantly increase the level of older
participation among women. This will also have a knock on effect on older men’s participation as
employment decisions tend to be taken on a household, rather than an individual, level, with men
more likely to work if their female partners also work. Around one third of the increase in
participation among married men aged 55 to 64 from the late 1990s to the late 2000s can be
explained by an increase in the labour market participation of their wives.50
However, the presence of a substantial employment gap before age 60 suggests that equalising the
SPA alone will not close the gender employment gap and several other important factors are at play.
48
The Government have suggested that this may be bought forward to 2036.
49
J. Gruber and D. Wise for NBER, “Social Security and Retirement Around the World: Micro-Estimation”, 2004; Blundell
2004
50
T Schirle, “Why have the labour force participation rates of older men increased since the mid-1990s?”, 2008
20First, women tend to have greater caring responsibilities which can contribute to decisions to stop
working. This is discussed in more detail in Section 3. Second, the income to be gained from a longer
working life tends to be less for women than for men due to the typically weaker labour market
attachment of working in part-time (and usually lower-skilled and lower paid) jobs.51 This is reflected
in a gender pay gap for older workers. The pay gap among older people remains higher than for
younger groups, and more stubborn, as Figure 10 shows. Since 1975, the pay gap has nearly
disappeared for 16 to 29 year olds and has shrunk for 30 to 49 year olds (in real terms, 2010).
However, for 50 to 60 year olds, the gap increased throughout the 1980s and early 1990s, and has
remained broadly constant since. However, it is important to note that this is a raw pay gap covering
all earners within each age group and does not take into account the relative skill level of earners or
the nature of their jobs. This raw pay gap persists for older workers in part because older women are
more frequently found in lower skilled roles than older men.
51
Resolution Foundation, “Growth without gain? The faltering living standards of people on low-to-middle incomes”, 2011
http://bit.ly/N0adsj
21Gross weekly pay gap (2010 real terms)
Age group 1975 2010 Change
16-29 £101 £15 -£86
30-49 £160 £100 -£60
50-60 £135 £137 £2
Figure 10: Raw pay gap at median earnings, relative to male earnings
Source: Resolution Foundation analysis based on ONS Annual Survey of Hours and Earnings
Notes: Pay refers to gross weekly pay for full-time employees
As well as being less likely to be in employment than older men, for those women who are in work,
the nature of employment in later life is very different to that of older men. This is particularly the
case for older women in low to middle income households. As Figure 11 shows, those aged 50 to 59
are less likely to be in full time employment than men, and they are less likely to be in the higher
quality form of flexible work: self-employment.
Older women are much more likely to be in part-time work than older men (this gender divide in
part-time work is apparent throughout the generations). Though many older workers want to work
flexibly in later life, part-time work in and of itself is not flexible work if it does not meet the needs of
the employee. Many of the part-time roles taken by older women in low to middle income
22households are likely to be part-time to fit the needs of employers. Where an employee’s
circumstances are taken into account in job design, part-time employment is to be welcomed.
Figure 11: Employment status for men and women aged 50 to 59 who are living in low to middle income households
Source: Resolution Foundation analysis of the Family Resources Survey 2009/10
Note: The 50 to 59 age group are used here, rather than 50 to SPA
There are three factors that indicate that the UK could improve the employment situation of older
people. First, the older employment rate is still below that of 25 to 49 year olds. Second, finding a job
is particularly difficult for unemployed older people resulting in significant levels of long term
unemployment among older people. Third, the rise in employment over the last three decades has
not benefited all groups of older people equally. To provide some indication of the magnitude of
progress that we could make on older employment, the next section looks at how the UK compares
to other developed countries.
23Section 2 – The UK lags behind similar countries
The UK ranks 15th out of 34 OECD countries for employment among 55 to 64 year olds. It lags behind
Scandinavian and North American countries while out-performing much of continental Europe.
Figure 12 shows the 55 to 64 year old employment rates for selected OECD countries.
Figure 12: Employment rates for 55 to 64 year olds for selected OECD countries
Source: OECDStat
From 2003 to 2008, the employment rates of 55 to 64 year olds in the UK remained fairly stagnant.
Since the financial crisis of 2008, older52 employment rates have fallen. This trend has been in
contrast to some other comparable economies which saw stronger growth in older employment
rates over the same period, such as Canada, Germany and Australia. The result has been a fall in the
relative position of the UK in terms of older employment rates since 2008. This suggests that older
employment has been more affected in the UK than elsewhere during the economic downturn.
To understand how the UK compares to other countries in terms of older employment, two
comparator groups of countries are used:
The “better performing countries” are those that outrank the UK on older employment. These
are (in descending order of employment rates): Iceland, New Zealand, Sweden, Norway,
Switzerland, Japan, Korea, Australia, United States, Israel, Canada, Chile, Germany and Denmark.
52
Within this section, “older employment rates” refer to the 55 to 64 age group unless otherwise indicated
24The average older employment rate of these countries is 64.3 per cent compared to 56.7 per
cent in the UK.
The “best performing countries”, those that rank in the top five for older employment have an
average older employment rate of 72.3 per cent. They are (in descending order of employment
rates): Iceland, New Zealand, Sweden, Norway and Switzerland. These countries older
employment rates are 12 to 24 percentage points higher than that of the UK.
Looking at the top performing countries, Table 2 shows that they share some similar characteristics
such as high overall employment rates and relatively high life expectancy. A high level of older
employment goes hand-in-hand with good overall employment and a healthy population. Any
measure to further either of these goals is likely to promote extended working lives. However, the
top performers also have much to distinguish them from each other. The countries have very
different levels of GDP per capita as well as different demographic circumstances and stark
differences in rates of pensioner poverty, as shown in Figure 13. Nearly one in five pensioners live in
poverty in Switzerland, while this number is less than one in fifty in New Zealand. This brief
comparison indicates that countries with differing underlying characteristics can arrive at the
similarly strong levels of older employment. This should provide strong motivation for policymakers
in the UK that improvements in older employment can be made and are not entirely dependent on a
particular set of labour market institutions that the UK lacks and is unlikely to create.
Figure 13: Rates of pensioner poverty (Percentage of people 65+ with incomes less than 50% of median household
disposable income)
Source: Resolution Foundation analysis based on OECD data
25The size of the employment gap
There is a substantial gap between the older employment rate of the UK and that of better
performing countries. On average, these countries have an employment rate 3.6 percentage points
above that of the UK for 50 to 54 year olds, rising to 12.5 percentage points for 60 to 64 year olds.
Using the more ambitious comparator group of the best performers, the gap grows to 6.6 percentage
points and 20.3 percentage points for 50 to 54 year olds and 60 to 64 year olds respectively. This
comparison provides an indication of how much room for improvement the UK has, recognising that
closing the gap entirely may not be practical given other policy priorities and constraints.
Figure 14 shows the gap between the employment rate in the UK and that achieved by the best
performing countries in the OECD for each age group (therefore the comparator group may not be
the same for each age band). While it is well known that the UK lags behind the best performers for
the 30 to 39 year old age group largely because of poor maternal employment, Figure 14 shows that
this gap is smaller than the gap for those over 55.
Figure 14: Performance gap in comparison to top 5 countries
Source: Resolution Foundation analysis based on OECD data
Note: The comparator groups vary for each age band
26Who are the “missing” workforce?
For the older age group, as for all age groups, women would make up the majority of the “missing”
older workforce. In Figure 15, the male and female employment rates in the UK are compared to the
average male and female employment rates of the best performing countries in each age band. This
shows us that the performance gap for men is greater than that for women for all age groups other
than the over-65s. However, given that there are more older women in the population than older
men, just over half of the performance gap for those aged 50 to 64 years is in female employment.
In contrast to the best performing countries in the OECD, the UK has had a relatively low female
state pension age, although a similar male state pension age. For women in the five years before the
female SPA of 60 years, the UK ranks 8th in the OECD for employment, while for men of this age we
are further behind at 14th. However, for women in the five years following their SPA, the UK falls
behind to rank 13th, a similar rank to men of this age. This considerable difference in the relative
position of the UK for women aged just before and after their state pension age suggests that this
comparatively early entitlement threshold is behind much of the performance gap of 60 to 64 year
old employment. In fact, the UK has a high employment rate of 60 to 64 year old women (relative to
the overall employment rate) of all countries with similarly low female state pension ages.
However, as discussed earlier state pension entitlement is not a cure all and does not fully explain
the employment gap we see for older workers. First, most women want to work beyond 60, and
many do. The actual retirement age of women is higher than the official retirement age.53 This
suggests that other factors beyond SPA are significant in explaining why many women want to but
do not work and that bringing the female SPA into line with the best performers will reduce rather
than eliminate the gap. Second, looking five years before SPA, female employment in the UK is 10
percentage points behind that of the top five performers. Third, the performance gap for 60 to 64
years olds is larger for men than women, and this is before men reach state pension age.
53
ONS, “Pension trends”, Chapter 4: The labour market and retirement, 2012
27Figure 15: Performance gap of UK in comparison to top 5 countries by gender
Source: Resolution Foundation analysis based on OECD data
Note: The comparator groups vary for each age band
Counting the “missing” older workforce
If the UK matched the older employment rates of the best five performing OECD countries, around
1.5 million additional 50 to 64 year olds would be in work. This would bring 14 per cent of the UK’s
11.2 million 50 to 64 year olds into work. Though it cannot be assumed that all of this “missing”
workforce would want to move into work, this gives an indication of the magnitude of the progress
we could make.
This analysis includes both full- and part-time employees and the self-employed. The share of part-
time work is another important factor in assessing our position internationally. The UK has a
relatively high level of older people in part-time employment, 35 per cent compared to an OECD
average of 27 per cent. Therefore, the gap in full-time equivalent employment would be even
greater than that shown. However, just as it cannot be assumed that the “missing” workforce will all
want to work, it cannot be assumed that most older part-time workers would move to full-time work.
Most are in this type of work voluntarily, rather than because they could not find full-time work. The
OECD reports that only 3.7 per cent of those aged 55 and above who work part-time are doing so
involuntarily compared to 9.6 per cent for 15 to 24 year olds and 6.7 per cent for the overall
population. However, the true proportion is likely to be higher. The UK Office for National Statistics
estimates that 15 per cent of part-time workers could not get a full-time job.
Although this analysis is purely indicative, it demonstrates the significant gains to the workforce that
could be made through increased employment of older people. In fact, increasing older employment
28is an important and necessary factor in achieving higher employment overall and will be important
to living standards over the next decade, especially in the likely scenario that wage growth continues
to be muted. To illustrate this, we can also calculate the rise in the overall employment rate in the
UK to match the average overall employment rate of the top five performing countries for older
workers. Were the UK to mimic the average overall employment rate of the top five countries for
older employment, the overall employment rate would rise from 70.3 per cent to 75.6 per cent and
over 2 million more people would be employed (of course this hypothetical example assumes there
are sufficient jobs to absorb these new entrants). Of this 2 million, older workers would make up the
majority of the total missing workforce.
Increasing older employment could make a significant contribution to overall employment as well as
maintaining the living standards of individual households. The next section looks at the major
barriers to getting more older people working. This report will be followed by a more detailed
exploration of the latent characteristics and policy mechanisms that drive high rates of older
employment.
29Table 2. Background characteristics for top performing countries and the UK
Country Overall Older 60 to 64 State Average age at Proportion of Life expectancy at Older people Long-term care
56
employment employment gender gap pension labour market population over official living in beds per 1 000 of
54 55 57 58 59 60 61 62
rate (%) rate (%) (%pts) age exit (yrs) 50 (%) entitlement age poverty (%) 65+ population
(yrs)
M F M F
Iceland 78.9 80.5 10.8 67 69.7 65.4 29 16.8 19.2 5.0 69.3
New 72.3 73.3 16.8 65 67.1 65.0 31 18.1 20.9 1.5 60.9
Zealand
Sweden 72.7 70.6 10.3 65 66.0 63.6 37 17.9 21.1 6.2 81.7
Norway 75.4 68.6 8.1 67 64.7 64.5 34 15.7 18.9 9.1 62.9
Switzerland 78.6 68.3 22.1 65 (63) 65.7 63.5 37 18.9 24.1 17.6 67.8
UK 70.3 56.7 20.7 65 (60) 64.3 62.1 34 16.9 24.5 10.3 55.1
OECD 64.6 54.0 16.1 63.3 (61.9) 63.9 62.4 33 18.5 23.3 13.5 49.5
average
54
OECD, “Employment Outlook 2011”, 2011: Data refers employment to population ratio of 15 to 64 population in 2010
55
OECD, “Employment Outlook 2011”, 2011: Data refers employment to population ratio of 55 to 64 population in 2010
56
Resolution Foundation analysis data from the OECD Family database (LMF1.4.A: Age-employment profiles by gender) and refers to 2010. Data gives the difference in employment rates of men and
women aged 60-64 (a positive difference indicates employment rates among men are higher than among women)
57
OECD, ”Pensions outlook 2012”, 2012: state pension ages given for 2010. Numbers in brackets refer to female SPA where different from male
58
OECD, “Pensions at a Glance 2011: retirement-income systems in OECD and G20 countries”, 2011
59
Resolution Foundation analysis based on OECDstat data
60
OECD, “Pensions at a Glance 2011: retirement-income systems in OECD and G20 countries”, 2011: life expectancy in 2010
61
OECD, “Pensions at a Glance 2011: retirement-income systems in OECD and G20 countries”, 2011: Percentage of people aged 65+ with incomes less than 50 per cent of median household disposable
income
62
OECD, “Health at a Glance 2011”, 2011: data refers to 2009 or nearest year
30Section 3 – There are significant barriers to employment
for older people
For those who are not in work and would like to be, there are a number of barriers to employment in the UK:
lack of adequate financial incentives to remain in, or return to, work;
poor health;
caring responsibilities;
age discrimination
the lack of employment support to move back into work, including training;
limited access to flexible working opportunities.
Financial incentives to work
Financial incentives have a significant impact on work decisions for 55 to 70 year olds.63 Incentives operate
through the tax system, for example exemptions from national insurance contributions and until recently,
age-related personal allowances and tax credits, and through the benefit system, for example pensions,
means-tested old age benefits (such as the savings guarantee) and wage subsidies for older workers.
Whatever their format, financial incentives can affect three distinct groups in different ways. They can
encourage older workers to stay in work, motivate older unemployed or inactive people to move into work
and incentivise employers to hire or retain older workers.
The state pension in particular has a strong impact on the employment decisions of people nearing or at
state pension age.64 Since there is strong correspondence between the pension age and labour market exit,
the rise in the female state pension age is likely to significantly increase the level of older people’s
participation.65 This is a clear and powerful mechanism to extend working lives and is a step in the right
direction. However, incentives are only one element of a broader picture. The SPA increase will benefit older
women only if it is coupled with greater support to find and stay in work.
Other financial incentives also play a role to influence work decisions in later life, such as the tax treatment
of pension income, the availability of alternatives to retirement benefits such as Employment Support
Allowance, and the structure of age-related national insurance contributions. National insurance
contributions stop being payable by employees and self-employed people when they reach the state
63
J. Gruber and D. Wise for NBER, “Social Security and Retirement Around the World: Micro-Estimation”, 2004; Blundell 2004
64
ibid
65
ibid
31pension age. This effectively increases the take-home pay for an employee as they pass this age and
increases the potential financial reward of staying in work.
Where financial mechanisms act as a disincentive, this can be a barrier to employment. Three mechanisms in
particular can act as disincentives to work in older age:
Perceived or actual financial disincentives to gradual retirement: Gradual retirement (a transition
from work to retirement through flexible working) can help older workers to adjust to retirement
and enables a longer working life for those who cannot or do not want to continue in a full-time role.
Those who wish to have a gradual retirement need access to flexible work, which will be discussed
later on in this section. Many people also need another source of income to compensate for lost
earnings due to reduced hours. This can come in the form of a partial pension, and much has been
done in the UK to facilitate partial pension drawdown. However, barriers remain, particularly in
terms of information and guidance. A significant proportion of older people are not aware that
partial drawdown options are available to them, or they believe these are financially punitive when
this is not the case.66
Access to early retirement pathways: Benefits, such as Employment Support Allowance (previously
Incapacity Benefit) can act as alternative pathways to retirement. By providing an alternative source
of income, these benefits can permit discouraged older workers or those with particular barriers to
employment to exit the labour market. This is a particular problem for those who are not offered
appropriate support to get back into work in parallel with these benefits, and for those for whom
income from work would be too low to act as an incentive.
Lack of financial incentives for employers to take on older workers: As has been said, older people
(especially those on low to middle incomes) may lack the skills needed in growing sectors, such as
basic IT literacy. For businesses recruiting new staff, the cost of training older workers can be a
disincentive. Coupled with age discrimination, this can make it very difficult for unemployed people
to find work in later life.
These disincentives can be avoided by better design of the tax and benefits system. The introduction of
Universal Credit in 2013 is an opportunity to better incentivise older people to stay in work.
Poor health
66
S. Vickerstaff, “What do older workers want? Gradual Retirement?”, Social and Public Policy Reviewl, 2007
32Poor health is a major barrier to work for many older people. In a survey by Humphrey (2003) around half of
over-50s that had taken early retirement did so because of ill health.67 It is also common for people with
health problems to be pushed out of the labour market. More than a third of respondents with health
problems reported being forced to leave a job or retire because of their health. Despite these barriers, a
survey by Smeaton (2009) shows that more than half of unemployed older people in poor health are
interested in going back to work.68
As Figure 16 demonstrates, poor health is much more common among older people in low to middle income
households than among those in higher income households. More than one in ten over-50s living in LMI
households is permanently sick or disabled compared to less than one in thirty older people in higher income
households.69 This stark difference is a reflection of both health inequalities across the income distribution
and the income penalty of being in poor health. Figure 16 is likely to underestimate actual levels of ill health
as it uses the International Labour Organisation’s definition of permanent sickness or disability, and so does
not include those who may not classify themselves this way despite being in poor health.
Figure 16: Rates of permanent sickness and disability among people living in low to middle income and higher income households
Source: Resolution Foundation analysis of the Family Resources Survey 2009/10
Note: This uses the International Labour Organisation’s definition of “permanent sickness or disability”
67
A. Humphrey, P. Costigan, K. Pickering, N. Stratford, M. Barnes, National Centre for Social Research with IFS for DWP, ”Factors
affecting the labour market participation of older workers”, 2003
68
D. Smeaton, S. Vegeris and M, Sahin-Dikmen, Policy Studies Institute for the Equality and Human Rights Commission, “Older
workers: employment preferences, barriers and solutions”, 2009
69
Resolution Foundation analysis of the Family Resources Survey 2009/10
33You can also read