Profile and Needs of the Ex-Service Community 2005-2020 - Summary and Conclusions of the Welfare Needs Research Programme
←
→
Page content transcription
If your browser does not render page correctly, please read the page content below

Profile and Needs of the
Ex-Service Community
2005-2020
Summary and Conclusions of the
Welfare Needs Research Programme

September 2006
Foreword
This report summaries the current and future scale, demographic profile and welfare needs of
the ex-Service community up to 2020, from research conducted in 2005. As one of the major
ex-Service charities, this piece of work has been instrumental in helping the Legion define its
welfare priorities for the short and medium term and we are confident that it will be useful in
assisting others working across this community.
The ex-Service community is still large and often overlooked by many in public life today. The
decreasing number of people with Service experience taking office in public life further isolates
veterans and their families. Expectations are also changing – hence the importance of this
work.
The context for this report is important. The UK now has a modern package of support for
those leaving the Armed Forces but there are still sizable numbers of people who leave today,
or have already left, who do not find the return to civilian life straightforward. Our research
shows that there are still deep pockets of need amongst veterans and their families which will
be with us for the next 15 years at least.
Veterans in the UK, unlike their counterparts in other nations, receive no special treatment
from the State in recognition of their contribution to defending their country. Whilst the
Veterans Minister, his policy staff and the Veterans Agency provide services to War
Disablement Pensioners and war widows, and good information sign-posting, the Legion and
other ex-Service charities continue to play a crucial role in meeting the wider social and welfare
needs of the serving and ex-Service community and are well placed to continue to monitor
changing needs.
The needs of disabled and older veterans are set against the general growth in older and
disabled people in the UK which is already putting unprecedented pressure on State health and
social care services.
Some changes are as yet difficult to quantify but are worth mentioning. One such issue is the
impact of the switch from the War Pensions Scheme to the Armed Forces Compensation
Scheme. The new Scheme is designed to reduce the number of people who receive a
continuous payment for their disablement and will force injured and ill Service leavers to return
to full-time employment. The impact of this scheme will not emerge for at least the next five
years.
The landscape of the Military is also changing. The global war on terrorism and the use of the
UK Armed Forces in peacekeeping roles is putting different pressures on serving personnel
and their families. With the overall Force at full stretch, deployments are longer and can be
more intense. Only now is the UK Government beginning to recognise the growing impact of
peacekeeping deployments on the mental health of serving personnel and their families.
Additionally, the Reserve Forces are deployed alongside Regular Forces more than ever before.
The needs of this group and their dependants are expected to increase.

Sue Freeth
Director Welfare
The Royal British Legion
September 2006

                                                1
Executive Summary
This report summarises twelve months of research into the welfare needs of the ex-Service
community. The findings of the Legion’s Welfare Needs Research Programme have been
detailed in a series of five reports; these have been published and are available on our website
www.britishlegion.org.uk.
The size of the ex-Service community in the UK is estimated at around 10.5 million people –
10.17m living in private residential households and around 0.4m in communal establishments.
Just under half or 4.8 million people in the ex-Service community are veterans and 5.37 million
are dependants. The size of the ex-Service community is expected to reduce over the next 15
years to an estimated 7.55 million people in 2020.
The average age of the adult ex-Service community is 63 years, compared with 47 years for
the general adult population. 60% of the adult ex-Service community are aged over 65 years,
compared with 20% of the national population. By 2020 there will be significant reductions in
all ages from 35–75 years. In contrast, a small increase in the 16–24 year old group is forecast
over this period, and a tripling of people aged over 85, to nearly 1 million.
Since the ex-Service community are characterised as elderly, a greater proportion own their
own home outright, and fewer have a mortgage, than in the general population. Nevertheless
the proportion of the ex-Service community who are renting from their local authority is similar
to that among the general population.
The unemployment rate among the ex-Service community of working age is comparable to the
general working age population. However, higher rates of employment among relatively older
members of the ex-Service community mask an unemployment rate twice the national
average among 18–49 year olds in the ex-Service community.
The average net reported household income of the adult ex-Service community is £15,000 per
annum. The number of people reporting a net household income of less than £5,000 per
annum is 927,000 and the number of people reporting a net household income of less than
£10,000 per annum is 3.88 million.
Over half (52%) of the ex-Service community have a long-term illness or disability, and over
one fifth (20%) have multiple conditions. This rate is much higher than that of the general
population, 35% of whom report a long-term health problem. The younger ex-Service
community, aged 25–64 years, are much more likely to report poor health than their peers.
The extent of mental health problems among the younger ex-Service community is much
higher when compared to their peers. In the 16–44 age group, the number of mental health
disorders is three times that of the UK population of the same age.
When considering the health of older ex-Service people, those aged 65–74 tend to be healthier
than their peers in the general population, whilst those aged 75+ have similar health to their
peers nationally. However, while this older group report being in better or similar health
generally, they are much more likely than their peers nationally to cite mental or sensory
disorders.
Within the ex-Service community, 7% of adults have another adult in the household who is
dependent on them for care because of a long-term illness, disability or old age. This is
equivalent to over half a million carers. The average age of carers is 65 and 23% are aged over
75 years.

                                                2
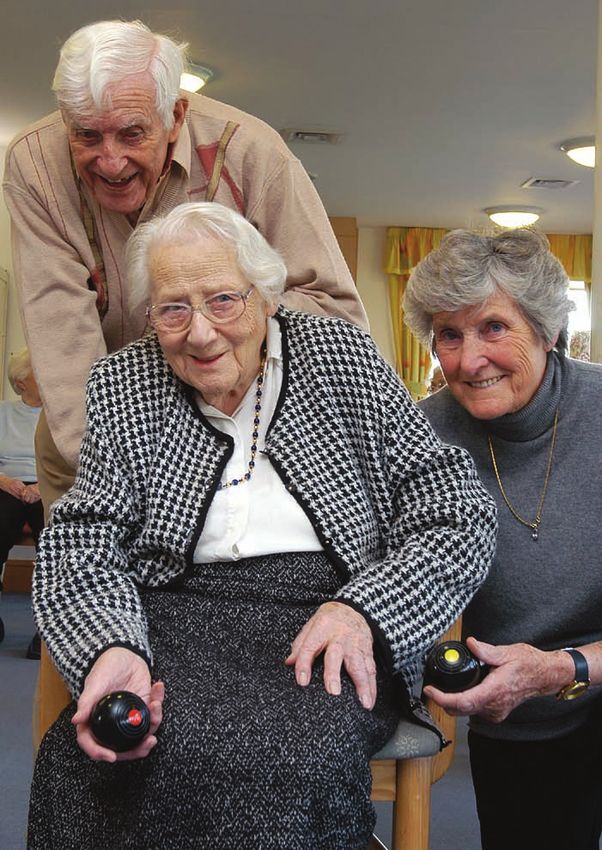
Over half (55%) of the adults in the ex-
Service community have experienced
at least one personal or household
difficulty in the 12 months preceding
the survey. The greatest needs include
mobility; house and garden
maintenance; depression, loneliness or
bereavement; financial difficulty; and
unemployment or low skills.
With regard to multiple problems, in
the 12 months prior to the survey,
almost 1.5 million people reported three
or more personal or household
difficulties and over half a million
reported five or more difficulties.
Among the younger ex-Service
community, below retirement age, the greatest needs include financial difficulty (both lack of
money and debt), unemployment or lack of skills and training, depression, mobility,
bereavement and mental health problems. The greatest needs among the older ex-Service
community include house and garden maintenance, mobility (at home and in the community)
and low incomes, followed by loneliness and depression.
Around 80% of the adult ex-Service community are aware (when prompted) of services or
sources of help or advice that are particularly for ex-Service people and their families. 72% of
the adult ex-Service community are aware of the Legion – the highest ranked organisation, but
only 33% are aware of Legion welfare services.
Over half (52%) of the adult ex-Service community received help or advice in the last 12
months from general sources of State or charitable assistance. Some 7% of the adult ex-
Service community reported that they received support from an ex-Service organisation in the
preceding year, whilst 15% expressed demand for Legion welfare now or in the near future
(equivalent to 1.29 million people).
In 2005 the Legion provided or funded welfare services for over 60,000 people. 70% of Legion
beneficiaries surveyed say that the assistance received made a lot of or a little improvement to
their quality of life.
Around 6% (530,000) people in the adult ex-Service community are experiencing difficulties
but are not receiving the help, advice or support they need – these are the people with unmet
needs.
People in the greatest need typically have no greater awareness of ex-Service organisations
offering assistance than members of the wider ex-Service community do. Overall, there is a
large gap between the needs of the ex-Service community and the current services provided
by ex-Service organisations.

                                               3
Contents

1. Introduction                                5        6. Use of Support Services                        22

Overview of the research                       5        Support from any source                           22
Limitations of the research                    5        Awareness of ex-Service organisations             22
Next steps                                     5        Support from ex-Service organisations             22
                                                        Legion support                                    22
                                                        Impact of Legion support                          23
2. Profile                                     6

Size of the community                          6
                                                        7. The Needs Gap                                  24
Age                                            7
Gender                                         8        Demand of Legion support                          24
Ethnicity                                      8        Multiple needs                                    24
Service connections                            8        Unmet needs                                       24
Length of Service and time since discharge     8        Unmet needs by age                                25
Geographic distribution                        9        Circumstances of those with unmet needs           25

3. Personal Circumstances                      10       8. Conclusions                                    26

Household composition                          10       Scale of welfare needs                            26
Tenure                                         10       Growth of the over 85s age group                  26
Working status                                 10       Growing importance of dependants                  26
Social grade                                   11       Health and the younger ex-Service community       26
Net household income                           11       Mental health                                     27
Satisfaction with standard of living           12       Preventative approaches                           27
                                                        Importance of raising awareness                   27
                                                        Immediate challenges for the voluntary sector     27
4. Health and Care Needs                       13
                                                        Longer term challenges for the voluntary sector   27
Overall health                                 13
Long-term illness or disability                14
                                                        Annex 1 – Glossary                                28
Health and the younger ex-Service community:
 under 65 years                                15
Health and the older ex-Service community:
 over 65 years                                 16
Caring responsibilities                        16
Future care needs                              16

5. Additional Welfare Needs                    17

Overall welfare                                17
Mobility                                       18
House and garden maintenance                   18
Depression, loneliness and bereavement         18
Financial difficulty                           18
Unemployment and low skills                    18
Future concerns                                18
Welfare needs and the younger ex-Service
 community: under 65 years                     19
Welfare and the older ex-Service community:
 over 65 years                                 20

                                                    4
1. Introduction

1.1 Overview of the research
This report summaries twelve months of research into
the welfare needs of the ex-Service community in the
UK.

We began by undertaking a review of existing research,
which concluded that there was little hard data about
the size, demographics or needs of this large group of
people. We then undertook a series of linked studies
that led to the following reports:

1.   Profile of the ex-Service community in the UK –
     a face-to-face omnibus survey of 6,000 UK adults
     which identified the size, demographics and welfare
     needs of the ex-Service community.

2.   Comparisons between the ex-Service                          Legion welfare services and external support for the
     community and the UK population – desk                      serving and ex-Service community.
     research which pinpointed the key differences
     between veterans, their dependants and the UK               1.2 Limitations of the research
     population.
                                                                 There are some limitations to the research that readers
3.   The Legion at work – a postal self-completion               should note. All surveys are subject to potential bias
     survey of over 1,200 beneficiaries of Legion welfare        and although we achieved good response rates we do
     services, asking their opinions of Legion assistance,       not know the views of non-responders.
     compared with awareness and use of other welfare
                                                                 The omnibus survey was representative of the UK adult
     services.
                                                                 population living in private residential households and so
4.   Greatest welfare needs of the ex-Service                    members of the ex-Service community living in
     community – secondary analysis of the research              institutions were excluded i.e. those living in prisons,
     findings which identified groups with the greatest          residential homes or nursing homes, hospitals,
     welfare needs and their characteristics.                    rehabilitation centres, temporary accommodation such
                                                                 as hostels, or on Armed Forces bases. The homeless
5.   Future profile and welfare needs of the                     sleeping rough were also out of scope.
     ex-Service community – a model forecasting
     changes in the community over the next 15 years             The beneficiary survey excluded one significant
     (developed by the Future Foundation), which                 category of beneficiary: 400 residents of the Legion’s
     identified how the needs of the whole ex-Service            nursing Care Homes, due to potential difficulties in
     community will transform as veterans and                    completing the survey.
     dependants from the Second World War and
                                                                 The proportions of people experiencing different welfare
     National Service come towards the end of their
                                                                 needs have been grossed up to population projections
     lives.
                                                                 to give a sense of the scale of the greatest problems.
This research was corroborated by an internal survey of          However, these projections should be treated as
Legion field staff and volunteers who reported on                indicative of the relative scale of different needs only,
welfare needs as viewed from the front line of service           rather than the absolute number of people affected.
delivery.
                                                                 1.3 Next steps
This report summarises the key findings of the reports
                                                                 We are now working on the Legion’s strategic plans for
(numbered one to five above) and draws some
                                                                 welfare. Our plans aim to realign our welfare services
conclusions for the Legion, voluntary organisations,
                                                                 with the greatest needs. Specifically, we are aiming to
government and policy makers.
                                                                 help more people; focus on the greatest needs; provide
The purpose of all this research is to provide good              a holistic response to need; and to work in partnership,
quality evidence to inform both the development of               where appropriate.

                                                             5
2. Profile                                                               Figure 2.2 Forecast size of the ex-Service community
                                                                         living in private households 2005–2020

                                                                                                    Total             Change            %
2.1 Size of the community                                                                      community           from 2005        change
                                                                                                    ‘000’s              ‘000’s   from 2005
The size of the ex-Service community in the UK is                        2005                     10,170
estimated to be just over 10.5 million people, made                      2010                      9,172                -998             -10
up of:                                                                   2015                      8,261              -1,908             -19
                                                                         2020                      7,551              -2,619             -26
●   10.17 million people living in private residential
    households                                                           The forecast predicts that there will be 1.7 million fewer
●   0.4 million people living in communal                                veterans in 2020 than in 2005; the veteran sub-group
    establishments such as residential and nursing                       within the ex-Service community is expected to see the
    homes, hospitals, prisons, rehabilitation centres,                   fastest decline. Dependent adults (aged over 18) are
    hostels and a small number sleeping rough.                           predicted to decline by about 0.9 million.

The ex-Service community represents 18% of the UK                        Figure 2.3 Forecast veterans and dependants
population.

                                                                                6   Millions
Figure 2.1 – UK ex-Service community – adults and
children (in private residential households) 2005                               5      4.8

                                                                                                   4.2
                                                                                4                            3.6                  Veterans

                                                                                      3.6                               3.1       Dependants
                                                                                3                 3.4                             aged16+
    Ex-Service community     Veterans                                                                        3.0
                             4.80 millions                                                                              2.8
    10.17 million                             Dependent                                                                           Dependants
                                              adults 16+                        2                                                 under 16
                                 8%           3.63 million
                                                                                      1.7         1.7        1.7         1.7
                                         6%                                     1
                                                      Dependent
                                              3%      children
                                                      1.74 million              0
                                                                                    2005          2010       2015       2020

                           83%                     Outside the           The resulting community of 5.8 million ex-Service adults
                                                   ex-Service
                                                   community             in 2020 will constitute 3.1 million veterans and 2.7
                                                   49.85 million
                                                                         million dependants over 18.

Base: UK population 60.02 million       Source: GAD

The 4.8 million veterans account for just under half of
the ex-Service community (47%) and the 5.37 million
dependants account for just over half (53%).
3.63 million dependants are adults (66%) and 1.74
million are children aged under 16 years (33%).

Of the dependent adults:

●   1.60 million are dependent spouses/partners of
    veterans
●   1.36 million are dependent widows or widowers
●   0.45 million are spouses/partners divorced or
    separated from veterans.

Looking to the future, our forecasting work predicts that
the total size of the ex-Service community (adults and
children) living in private residential households is set to
decrease from 10.17 million to 7.55 million in 2020.

                                                                     6
Figure 2.4 Forecast size of sub-groups Figure 2.6 Forecast age profile of veterans
12000 6 Millions
10.17m
10000 85+
17% 5 4.8m
7.55m
4.2m 75–84
8000 Child dependants 4 65–74
36% 22%
3.6m
6000 3.1m
55–64
3
Adult dependants
37% 45–54
4000
2 35–44
47%
Veterans
2000 41%
1 25–34
0 16–24
2005 2020 0
2005 2010 2015 2020
2.2 Age
The average age of the adult ex-Service community is The ballooning of the over 85 year old age group is a
63 years, compared with 47 years for the general adult one-off result of the final National Service generation
population. reaching old age at a time when life expectancy is
increasing. Similar growth is predicted amongst the
60% of the adult ex-Service community are aged over eldest dependants.
65, compared to 20% nationally.
Figure 2.7 below shows the predicted change in size of
Figure 2.5 Age profile of the ex-Service community the 85+ age group over the next 15 years. Notice how
compared with UK adult population the largest increase in over 85s is anticipated during the
next 5 years to 2010, peaking in 2015 at three times the
current numbers, and then tailing off.
1%
85+
3%
75–84 8% Figure 2.7 Size of the ex-Service community 64–85
25%
11%
plus 2005–2020
65–74 32%
55–64 15%
15%
15% Thousands
45–54 8% 3000
2663 2005 2010 2015 2020
19%
35–44 8%
2500
17% 2101
25–34 5%
2000 1885
14% 1759
16–24 3%
1399 1419
1500
0% 10% 20% 30% 40% 1140
1087
937 919
Ex-Service community Adult population (UK) 1000 800
500 288
0
This age profile drives other significant differences in 65–74 75–84 85+
the profile and needs of the ex-Service community – ^Post-war National Service veterans are currently (in 2005) aged 63–77
these are discussed later. *WW2 National Service veterans are currently (in 2005) aged 76 and over
The age profile of veterans will change dramatically by
2020. Significant reductions in all ages from 35–75 Base: Adult Ex-Service community
years will be offset by increases amongst the youngest
and oldest groups. Those aged 16–24 will increase from
just under 300,000 to 375,000 (up by 26%) and the 85+
age group will increase from 290,000 to 920,000 (up by
almost 220%).
7
The number of dependants aged under 16 is predicted                  2.4 Ethnicity
to remain broadly unchanged over the forecast period at
                                                                     The UK ex-Service community has fewer members from
around the 1.7 million mark. Therefore, child dependants
                                                                     non-white minority ethnic groups than in the general
will comprise an increased share of the total ex-Service
                                                                     population. The figures are 0.6% within the ex-Service
community. (Also see Figure 2.3)
                                                                     community compared to 8% of the general population.
Overall, the ex-Service community is forecast to remain
characterised as elderly, and particularly very elderly, but         2.5 Service connections
families will become an increasingly significant minority.           Around 83% of veterans have served in the UK Regular
                                                                     Forces and 16% in the Reserve Forces. 7% have served
Figure 2.8 Age profile of dependants                                 in other related ways which qualify for assistance from
                                                                     the Legion1.

         Millions                                                    Figure 2.10 Service connections of adult ex-Service
    6
          5.4m                                                       community
                     5.0m
                               4.7m                   85+
    5                                     4.5m
                                                      75–84
    4                                                 65–74
                                                      55–64                       Regular Forces                                             84%
    3                                                 45–54                                  Army                               50%
                                                      35–44
    2                                                                            Royal Air Force                      24%
                                                      25–34

    1                                                 16–24           Royal Navy/Royal Marines                  11%
                                                      Under 16                   Reserve Forces                  15%
    0
         2005       2010       2015      2020                                                    TA             9%

                                                                                    RAFR/RAFVR             2%

                                                                                RNR/RNVR/RMR               3%
2.3 Gender                                                                       Other Eligibility          7%

The adult ex-Service community is evenly divided                                                      0%        20%       40%   60%    80%    100%

between men and women. However, the vast majority
of veterans are men (84%) and dependants are
overwhelmingly women (94%).                                          Base: Adult ex-Service community

Figure 2.9 Gender of adult ex-Service community
                                                                     2.6 Length of service and time since discharge
          Adult
          ex-Service                                                 On average, veterans served with the Armed Forces for
          community         Veterans        Dependants               six years. Around three quarters of veterans served for
          % 8.43m           % 4.80m         % 3.63m                  more than two years but less than 10 years. 16%
Male      50 4.22m          84 4.03m        6   0.22m                served for more than 10 years.
Female    50 4.22m          16 0.77m        94 3.41m

                                                                     Figure 2.11 Veterans’ length of service
Our modelling shows that even with more women
joining the services, the small numbers leaving in
coming years will mean that the male to female ratio                                Less than 1 yr              4%
among veterans will only change marginally: to 83%                             1yr, less than 2 yrs                  7%
men and 17% women by 2020.                                                   2 yrs, less than 3 yrs                                   23%
                                                                             3 yrs, less than 5 yrs                                          27%
                                                                            5 yrs, less than 10 yrs                                   22%
                                                                           10 yrs, less than 15 yrs                  7%
                                                                           15 yrs, less than 20 yrs         3%
                                                                           20 yrs, less than 25 yrs         3%
                                                                           25 yrs, less than 30 yrs        2%
                                                                                            30 yrs         1%

                                                                                                      0%    5%       10% 15% 20% 25% 30%

1 It is possible for people to serve in more than one way so
figures add upto more than 100%.                                     Base: Veterans

                                                                 8
This large group of veterans, who served more than 2
years but less than 10 years, are predominantly National
Service veterans. This is better demonstrated when
considering length of service together with time since
discharge. National Service in the UK operated between
1939 and 1960 (1939–1949 service normally referred to
as “war service” but officially National Service). Three
fifths (59%) of veterans were discharged from military
service over 40 years ago, and most commonly
between 50–59 years ago, that is between 1946 and
1955.
Figure 2.12 Veterans’ time since discharge
Less than 5 yrs ago 4%
5–9 yrs ago 6%
10–19 yrs ago 9%
20–29 yrs ago 11%
30–39 yrs ago 10%
40–49 yrs ago 22%
50–59 yrs ago 30%
60–69 yrs ago 7%
0% 5% 10% 15% 20% 25% 30% 35%
Base: Veterans
2.7 Geographic distribution
In comparison to the UK population, a significantly
higher proportion of the ex-Service community live
in the South West, Yorkshire and Humberside and
the North West. A significantly lower proportion live
in London and the West Midlands.
Younger members of ex-Service community (16–44)
are slightly skewed toward the North East, North
West, East Midlands and Northern Ireland. The
higher unemployment rates in the north of England
may offer a partial explanation for this i.e. the Armed
Forces being an attractive employment option for
younger people. The North East and North West of
England are traditionally strong recruiting areas for
the Armed Forces.
Middle-aged ex-Service people (aged 45–64) are
slightly skewed towards the South West. This may
be explained by them serving for longer and staying
in the region within which they served.
93. Personal Circumstances The average age of the ex-Service community is the
most likely driver for the high number of people that
own their own home outright, 50% compared with 29%
of UK adults.
3.1 Household composition
Just under a third (31%) of the ex-Service community Within the ex-Service community there are comparative
live alone. Just under half live in a two-person numbers of people renting from local authorities and
household. significantly fewer from private landlords.
Figure 3.1 Household size among adult ex-Service
community compared with the UK population 3.3 Working status
Adult
Nearly two thirds (64%) of the adult ex-Service
ex-Service UK community are retired. Among the whole UK adult
community adults population only a quarter are retired.
% %
Household size Figure 3.3 Working status of adult ex-Service
(adults & children): community compared with UK population
1 31 19
2 47 33 Adult
3 11 19 ex-Service
4+ 11 29 community UK adults
% %
The comparatively higher number of one and two Working full- or part-time 26 52
Retired 64 25
person households in the ex-Service community is more
Other economically inactive 10 24
than likely explained by the relatively high average age
of the community when compared with the UK
However, when considering people of working age, the
population.
working status profile of the ex-Service community is
Just over one tenth of the adult ex-Service community very similar to that of the whole population.
have children aged 0–15 in their households, compared
with a third in the general population. Again, this is Figure 3.4 Working status of adult ex-Service
probably associated with the older age profile of the ex- community below retirement age, compared with
Service community. equivalent UK population
Adult
Base: People of working age ex-Service UK
3.2 Tenure (men 16–64, women 16–59) Community adults
Two thirds (68%) of the adult ex-Service community are % %
Employed: 64 65
owner occupiers, just under a quarter (23%) are council
Working full-time (30+ hrs) 51 51
tenants and 6% rent from private landlords.
Working part-time (8–29 hrs) 12 14
Working part-time (< 8 hrs) 1 1
Figure 3.2 Tenure of adult ex-Service community Unemployed: 6 5
compared with UK population Economically inactive: 31 30
Not seeking work 18 17
Adult
Higher education 2 6
ex-Service UK
Still at school 1 2
community adults
Retired 10 5
% %
Owner occupiers: 68 65
Own outright 50 29
The unemployment rate among adults of working age in
Bought with a mortgage 19 36 the ex-Service community is 6%, compared with 5% in
Rent from local authority 23 21 the general working age population. However, this hides
Rent privately 6 11 an unemployment rate twice the national average
Other 2 3 among 18–49 year olds in the ex-Service community.
10Figure 3.5 Unemployment rates among adults of Figure 3.6 Social Grade of the Adult Ex-Service
working age Community Compared with the UK Population
Adult Adult
Base: People of working age ex-Service UK ex-Service
(men 16–64, women 16–59) Community adults* community UK adults
% % % %
All of working age 6 5 A 5 4
16–17 14^ 26 B 13 17
18–24 23^ 12 C1 23 27
25–34 8 4 C2 19 20
35–49 6 3 D 14 14
56–64 (m) / 50–59 (f) 2 3 E 26 18
Row percentages. ^N.B. Low base – treat with caution The higher proportion in social grade E is related to the
*Source for UK adults: Labour Force Survey (Summer 2005, older age profile of the ex-Service community, since
not seasonally adjusted)
those entirely dependent on the State pension fall into
this category.
In the 25–34 cohort, veterans and their dependants
Considering those who are not retired, the ex-Service
have similar unemployment rates, whereas among
community has a higher proportion of skilled manual
35–49s, veterans have higher rates of unemployment
workers (C2) and a lower proportion of non-manual
than dependants (8% compared to 2%). This may
workers in grades B/C1 than the UK adult population.
indicate a lack of transferable skills coupled with an
unwillingness to re-train later in life. This may be indicative of the type of employment
available for non-commissioned officers in the Armed
Forces, particularly the Army, which accounts for the
3.4 Social grade2 largest proportion (43%) of veterans aged 16–64. This
highlights the importance of transferable qualifications
A quarter (26%) of the ex-Service community are in
and skills, and the need for life-long learning.
social grade E, 8% more than in the UK population.
Concomitantly there are 8% fewer in social grades
B/C1.
3.5 Net household income
The average reported net household income was
£15,500 per annum (pa)3. The number of adults in the
ex-Service community on the lowest incomes are as
follows:
● People reporting a net income of less than £5,000
per year (less than £100 per week) – 927,000
2 Assigned on the basis of the job details of the Chief Income
Earner in the household:
people or 11%
A: Professionals, very senior managers in business, top civil
● People reporting a net income of less than £10,000
servants. Retired people, previously grade A, and their widows. per year (less than £190 per week) – 3.88 million
B: Middle management executives in large organisations, with people or 46%.
appropriate qualifications. Retired people, previously grade B,
and their widows.
C1: Junior management, owners of small establishments, and Of those reporting a net household income of less than
all other non-manual positions. C1, and their widows. £10,000 per year:
C2: Skilled manual workers and manual workers with
responsibility for other people. Retired people, previously grade
● 49% also report receipt of means tested benefits4
C2, with pensions from their job. Widows, if receiving pensions ● 40% own their own home outright – these people
from their late husband’s job. are capital rich but income poor. Again, this is
D: Semi-skilled and un-skilled manual workers and related to the older age profile of the ex-Service
apprentices/trainees to skilled workers. Retired people, community.
previously grade D, with pensions from their job. Widows, if
receiving pensions from their late husband’s job.
E: All those entirely dependent on the State long-term, through 3 N.B. 44% of respondents declined to state their net
sickness, unemployment, old age etc. Those unemployed for a household income, which is typical in an omnibus survey of
period exceeding 6 months (otherwise classified on previous this type. However, there is no reason to believe that this
occupation). Casual workers with no regular income. would introduce significant bias in the income profile.
11Figure 3.7 Annual reported net household income of 3.6 Satisfaction with standard of living
adult ex-Service community
The majority of adults in the ex-Service community are
satisfied with their standard of living – 31% reporting to
£75,000 or more
be very satisfied with 54% reporting to be fairly
1%
£50,000–£74,999 2%
satisfied.
£40,000–£49,999 3%
Conversely, 5% are fairly dissatisfied and 2% are very
£30,000–£39,999 5%
£25,000–£29,999
dissatisfied (equivalent to 420,000 and 170,000 people
5%
£20,000–£24,999
respectively). The following sub-groups had significantly
8%
£15,000–£19,999 11%
larger proportions of people who were dissatisfied and
£10,000–£14,999 19% more than twice the average of 7%:
£7,500–£9,999 15%
£5,000–£7,499
● Veterans who were discharged 5–19 years ago
20%
Under £5,000 pa
(17%)
11%
● 35–44 year olds (15%)
0% 5% 10% 15% 20% 25%
● The most affluent, with net household income of
over £40,000pa (15%)
● The least affluent, with net household income of
Base: Adult ex-Service community who gave their less than £5,000pa (14%)
income (56%) ● With any dependent children aged under 16 (14%).
These sub-groups tend to be skewed toward the
A breakdown of net household income by age cohort is younger members of the ex-Service community. Their
in Figure 3.8 below. Those aged over 75 have the lowest greater dissatisfaction may be related to the higher
incomes. expectations of younger people.
Figure 3.8 Mean reported annual net household
income of the adult ex-Service community
All ex-Service £15,500
Veterans £16,300
Dependants £14,500
16–24 £15,200
25–34 £22,700
35–44 £25,400
45–54 £20,800
55–64 £18,100
65–74 £12,500
75–84 £9,400
85+ £9,000
Base: Ex-Service community who gave their income (56%)
The following sub-groups had over 70% of people
reporting a net household income of less than £10,000
per year:
● Those in social grade E (80%);
● Dependent widows or widowers (78%);
● Those receiving means tested benefits (76%); and
● Those aged over 75 (74%).
4 There is probably substantial under-reporting of benefits
received since people tend to overlook benefits deducted
before they receive their income and those on multiple
benefits are often unaware what particular components they
are receiving (e.g. DLA mobility component, Housing Benefit
etc.).
124. Health and Care Needs The survey of UK adults assessed the scale of various
health-related difficulties within the ex-Service
community. The following were deemed to be the
This chapter focuses on welfare needs relating to ill greatest health needs within the adult ex-Service
health and caring responsibilities. Other needs are community5:
considered in Chapter 5.
● 810,000 people suffer from exhaustion or pain
● 530,000 people have difficulty getting the medical
treatment needed for themselves or another
4.1 Overall health
household member
Three quarters (74%) of the adult ex-Service community ● 280,000 people have difficulty with self-care tasks
say that they have been in good health over the last 12 (washing, dressing, going to the toilet, preparing
months, whilst a quarter (25%) have not been in good meals etc.)
health. However, members of the ex-Service community ● 90,000 people report heavy drinking or drug-taking.
are much less likely to say they are in good health.
Looking to the future, our forecast model predicts that
20% of the ex-Service community say they are not in health difficulties and reported poor health are to remain
very good health and 5% say their health is not at all among the most common welfare needs. However, due
good (equivalent to 970,000 and 420,000 people to the decrease in overall size of the ex-Service
respectively). community the number of people reporting poor health
is predicted to decrease from 2.1 million people in 2005
Figure 4.1 Self reported health over the last to 1.5 million people in 2020.
12 months
Figure 4.2 Forecast health and long-term illness or
disability in 2005–2020
Adult Ex-Service Adult population*
community (GB) (GB)
1%
14%
25% 4.38
Long-term
38% illness /
27% disability
59% 2.92
36%
2005
2.12
Self-reported 2020
poor health
Good Fairly good Not good DK/Ref 1.45
0 1 2 3 4 5
Millions
*Source for GB adults: General Household Survey 2003
(directly comparable question)
Base: Adult ex-Service community
Sub-groups with significantly higher proportions in poor
health include people:
● Below retirement age but not seeking work (63%)
● With a long-term illness or disability (41%)
● Reporting a net household income between £5,000-
£7,499 (37%)
● Living as private tenants (36%) or council tenants
(35%).
5 Defined as greatest needs because they either affect the
most people within the adult ex-Service community or because
of their severity.
134.2 Long-term illness or disability
Significantly, just over half (52%) of the adult ex-Service
community have a long-term illness, disability or
infirmity, and a fifth (20%) have multiple conditions. This
is equivalent to 4.42 million people with any long-term
health problems and 1.73 million people with multiple
conditions.
Expectedly, the proportion reporting any long-term
health problems increases with age, from one fifth of
16–24 year olds to two thirds of those aged over 75.
The scale of need also increases with age:
● 0.38 million people aged 16–44
● 1.01 million people aged 45–64
● 1.44 million people aged 65–74 Figure 4.4 Long-term illnesses, disabilities or
● 1.59 million people aged 75+. infirmities of adult ex-Service community
Figure 4.3 Any long-term illnesses, disabilities or Adult UK ex-Service
infirmities, by age and gender community
% 8.43m
Any 52 4.42m
Multiple conditions 20 1.73m
ALL 35%
52% Any cardio-vascular 26 2.18m
Men
34% Any musculoskeletal 21 1.79m
50%
Any digestive/diabetes/
36%
Women progressive illness 12 1.01m
55%
64% Any sensory 8 0.64m
75+ 66%
Any mental 4 0.35m
60%
65–74 54% Any neurological 2 0.20m
41% Any other 6 0.49m
45–64 51%
21%
16–44 27%
Prevalence of the following conditions is significantly
0% 20% 40% 60% 80%
higher in the adult ex-Service community than the
Ex-Service community (GB) Adult population (GB)
general adult GB population6:
● Musculoskeletal (21% vs. 15%)
Source for GB adults: General Household Survey 2003 ● Cardio-vascular (21% vs. 15%)
(similar question wording)
● Respiratory (8% vs. 6%)
● Mental health (4% vs. 3%)
As demonstrated in Figure 4.3, overall incidence of any ● Sight (4% vs. 2%)
long-term illness, disability or infirmity is much higher ● Hearing (4% vs. 1%).
amongst the ex-Service community (52%) than in the
In 2020, long-term illnesses, disabilities or infirmities are
UK adult population (35%).
set to remain the most common source of welfare
Younger members of the ex-Service community (under need.
65 years) are significantly more likely to suffer from a
long-term illness, disability or infirmity than under 65
year olds nationally. Those over 75 also have a slightly
higher prevalence than their peers nationally.
In contrast, 65–74s in the ex-Service community have
significantly fewer incidences of long-term illness,
6 Source for the general population figures here is the General
disability or infirmity than 65–74s nationally.
Household Survey 2003 (similar question wording) and based
on GB adults. Incidence rates per thousand have been
converted to percentages. Figures quoted here for the adult ex-
Service community are also based on GB for direct
comparison.
14However, the number of people affected within the ex- Of note are the number of mental health problems
Service community is forecast to fall by over a million reported among the younger ex-Service community. In
adults, from 4.4 million in 2005 to 2.9 million in 2020 the 16–44 age cohort the proportion reporting long-term
(Figure 4.2). This is due to the shrinking size of the ex- mental health disorders is more than triple that in the
Service community over the next 15 years. UK population of the same age (over 9% compared
with just under 3% nationally). The reported prevalence
is higher among 16–44 year old veterans (who are
mainly men) at 11%, vis-à-vis their dependants (who are
4.3 Health of the younger ex-Service
mainly women) at 7%.
community: under 65 years
In the general population, women are more at risk of
As demonstrated by Figure 4.5, younger members of
mental health problems than men, across the age
the ex-Service community (those aged between 25–64)
spectrum. In the ex-Service community men appear to
are significantly more likely to report poor health than
be as vulnerable as women, and younger veterans
their peers in the general population; in some age
appear to be particularly at risk.
cohorts, more than double reporting poor health.
For those in the ex-Service community aged between
Figure 4.5 Self reported poor health compared with 45–64 years, their greatest welfare needs are related to
the adult population by age poor health. Musculoskeletal conditions are their most
common complaint but they are also at greater risk of
cardio-vascular and respiratory conditions than their
14%
ALL 25% peers nationally.
85+ 28%
28%
75–84 26% Cardio-vascular/respiratory problems, musculo-skeletal
31%
23%
problems, sensory problems and
65–74 21%
19%
digestive/diabetes/progressive illnesses are all more
55–64 30%
common among the over 55s and become more
45–54 14%
30% prevalent with increasing age.
35–44 10%
21%
25–34 7%
20%
For those aged 16–64, long-term illness or disability,
16–24 4% poor health and mental health issues will remain among
3%
0% 5% 10% 15% 20% 25% 30% 35%
the most common welfare needs in 2020. The overall
Ex-Service community (GB) Adult population (GB)
numbers of 16–64s experiencing these health
difficulties is forecast to decline over the next 15 years
with the decreasing size of the ex-Service community,
Source for GB adults: General Household Survey 2003 albeit at a slightly slower rate than among those aged
(identical wording). over 65.
Figure 4.6 Forecast welfare needs 16–64 years
Within the ex-Service community, relative to their peers 2005–2020
nationally:
● 16–44 year olds are more prone to mental health Long-term illness
problems Reported poor health
● 16–44 year old veterans have higher prevalence of Relationship/isolation
Psychological
musculoskeletal complaints
Difficulty with authorities
● 45–64 year olds are more prone to cardio-vascular Lack of money for daily living
or respiratory conditions Fear of violence/crime
2005
● men aged 45–64 who are economically inactive are Self-care/well being
2020
Debt
significantly more likely to have any long-term
Housing difficulties
health problems in the ex-Service community (82%) Mobility
than in the general population (68%) Unemployed
● Likewise, women who are economically inactive Caring responsibilities
Lack of training/skills
and aged under 65 are significantly more likely to
0 500 1000 1500 2000 2500 3000 3500
report ill health in the ex-Service community than in Thousands
the general population: particularly among the
16–44s, 45% of whom report ill health compared
with 27% of the same age in the wider population. Base: Adult ex-Service community aged 16–64
15
154.4 Health of the older ex-Service community: However the decreasing size of the over 65 year old ex-
over 65 years Service community is forecast to bring a gradual decline
in health related problems such that by 2020, there will
As shown in Figures 4.3 and 4.5, older ex-Service be a million fewer over 65s experiencing long-term
people, aged 65–74, tend to be healthier than their illness or disability (around two thirds the current
peers in the general population. However the oldest, numbers). Self-reported poor health should decline at a
aged 75 and above, are in similar health to their peers similar rate.
nationally.
However, these broad figures mask some significant
4.5 Caring responsibilities
differences when considering the type of health
condition: Within the adult ex-Service community, 7% have
another adult in their household who is dependent on
● 65–74 year olds in the ex-Service community are them because of a long-term illness, disability or old
less likely than their peers nationally to be afflicted age – equivalent to 570,000 carers. The proportion of
with the most common conditions i.e. carers is significantly higher among:
musculoskeletal or heart and circulatory problems.
In contrast, they are more likely than their peers to ● Those of working age but not seeking work (13%)
cite mental or sensory disorders (sight, hearing or ● Those reporting a net household income of
speech) between £7,500–£9,999pa (13%)
● Those in social grade E (12%).
● Those aged 75 or over in the ex-Service community
are more likely than their peers nationally to cite Caring responsibilities are concentrated among those
mental health problems or difficulty hearing. aged between 45–74. The average age of carers is 65
years, whilst 23% are aged over 75 (equivalent to
However, while the over 65s report being in better or 133,000 people). They are typically married, retired
similar health to their peers, illness, disability, and self- home owners who are on relatively low incomes.
reported poor health are, nevertheless, the most
common welfare needs among the over 65 age group.
Similar to the younger ex-Service community, the 4.6 Future care needs
hierarchy of need among the over 65s is set to remain Among those aged 45–74, caring responsibilities ranked
static over the coming years. In 2020, health and related as one of the key difficulties they face. In the context of
problems are predicted to remain the greatest welfare a retired ex-Service community that is predicted to
needs among this age group. decline in size, practical needs of over 65s, relating to
mobility, self-care and household maintenance are
Figure 4.7 Welfare needs of over 65s 2005–2020 forecast to become relatively more important.
In this smaller ex-Service community, the percentage of
Long-term illness people with caring responsibilities in 2020 is forecast to
Reported poor health remain quite static at 6%, or 348,000 people. However,
Mobility
as with the whole of the ex-Service community their
Self care/well being
Housing difficulties
age profile will be slightly older.
Fear of violence/crime
Relationship/isolation Also worth noting is the growing size of the over 85 age
2005
Difficulty with authorities
2020 group and their future care needs. As noted earlier, this
Psychological
group is forecast to triple in size over the next 15 years.
Caring responsibility
Lack of money for daily living
Additionally, this group, compared to their slightly
Debt younger counterparts, have particular difficulty with
Unemployed house and garden maintenance, mobility in and outside
Lack of training/skills
the home and self-care (see section 5.10). This will have
0 500 1000 1500 2000 2500 3000 3500
Thousands implications for future care provision.
Base: Adult ex-Service community aged 64+
165. Additional Welfare Needs Over half (55%) of adults in the ex-Service community
experienced at least one of the difficulties listed at
Figure 5.2 in the last 12 months. This is equivalent to
This chapter considers the additional welfare needs of 4.63 million people.
the ex-Service community, i.e. needs other than health
and care needs, which were covered in the previous Figure 5.2 Personal or household* difficulties
chapter. experienced in the last year
Adult ex-Service
community
5.1 Overall welfare % 8.43m
Fear of violence/crime* 16 1.43m
Our survey of UK adults asked those in the ex-Service
Any relationship/isolation difficulties: 16 1.31m
community, which, if any, from a prompted list of 24 Bereavement 7 0.57m
difficulties had they experienced in the last 12 months. Loneliness 6 0.55m
Lack of recreational facilities/social life* 3 0.27m
The top ten difficulties include fear of violence and
Marriage/relationship break-up 2 0.18m
crime, house and garden maintenance and getting Difficulty forming close relationships/
around outside the home. The full ranking is at getting on with people 1 0.08m
Figure 5.1. Any self-care/well-being difficulties: 14 1.18m
Exhaustion or pain 10 0.81m
Figure 5.1 Top ten difficulties experienced in the last Poor bladder/bowel control 4 0.35m
year by adult ex-Service community Difficulty looking after yourself
(washing, dressing, going to the toilet,
preparing meals etc.) 3 0.28m
Any housing difficulties: 13 1.10m
Fear of violence/crime 16% Difficulty with house and
House & garden maintenance 11% garden maintenance* 11 0.94m
Getting around outside the home 11% Poor housing/inappropriate for your
Exhaustion or pain 10% needs* 2 0.20m
Any psychological difficulties: 13 1.08m
Feeling depressed 9%
Feeling depressed 9 0.78m
Not enough money for daily living 9%
Lacking confidence/low self-esteem 5 0.39m
Bereavement 7%
Lack of hope for the future/lack of
Loneliness 6% purpose or direction in your life 3 0.27m
Getting around your home 6% Heavy drinking or taking drugs 1 0.09m
Difficulty getting medical treatment 6% Any mobility difficulties: 12 1.04m
0% 5% 10% 15% 20% Difficulty getting around outside
your home 11 0.93m
Difficulty getting around your home 6 0.53m
Any difficulties dealing with authorities: 12 1.04m
Base: Adult ex-Service community
Difficulty getting medical treatment
you need* 6 0.53m
Difficulty finding out about services
or benefits that you are entitled to* 5 0.45m
Difficulty dealing with personal affairs
(e.g. paying bills, filling in forms,
writing letters) 3 0.27m
Any financial difficulties: 12 1.04m
Not having enough money for day
to day living* 9 0.77m
Getting into debt* 5 0.40m
Any employment difficulties: 5 0.40m
Unemployment/fear of unemployment* 3 0.27m
Lack of training/qualifications/skills* 2 0.16m
* Asterisked items were experienced by self or household.
17Most welfare needs are forecast to decline in scale Some 550,000 people (6%) in the ex-Service
between 2005 and 2020, as a result of the decrease in community have suffered with loneliness in the last 12
size of the ex-Service community. months. They are typically aged 65 plus, widowed and
living alone.
The needs that are forecast to decline in scale most
slowly are those that are reported by younger adults Lastly, 570,000 people (7%) experienced difficulty
and by the most elderly ex-Service community coping with bereavement. These people are typically
members (see section 5.9 and 5.10). aged over 55 and retired.
The overall hierarchy of welfare needs within the ex-
Service community as a whole is forecast to remain 5.5 Financial difficulty
relatively unchanged by 2020.
The ex-Service community below pensionable age
The greatest needs include those affecting the largest reports an average net household income of £420 per
numbers of people and problems of greatest severity. week; in contrast to an average of £216 per week above
On this basis the greatest welfare needs (apart from pensionable age. Allowing for margins of error, this is
health and care needs) are: similar to the national average for pensioners of £223
per week net after housing costs7. Nationally, and in the
● Mobility
ex-Service community, risk of low income among
● House and garden maintenance
pensioners increases with age. Lone female pensioners
● Depression, loneliness and bereavement
have a higher risk of low income than their male
● Financial difficulty
counterparts.
● Unemployment or low skills.
In the last 12 months, 770,000 adults in the ex-Service
The scale of each of these areas of greatest need is
community (9%) have experienced lack of money for
highlighted in the following sections.
daily living and 400,000 (5%) have experienced
difficulty, getting into debt; the majority of whom are
below retirement age.
5.2 Mobility
During the 12 months prior to the survey, 930,000
adults in the ex-Service community had difficulty getting 5.6 Unemployment and low skills
around outside their home; two thirds of whom are
At the time of the survey 180,000 adults (2%) in the ex-
aged 65 or over.
Service community were unemployed job seekers.
A more extreme mobility problem is difficulty getting These are typically male veterans, aged 16–44, who are
around one’s own home; this affects 530,000 people. married/cohabitating.
A similar number, 160,000 (2%), cited lack of training,
qualifications or skills.
5.3 House and garden maintenance
House and garden maintenance can be a major
concern, particularly for older people where even a 5.8 Future concerns
small problem such as a leaking tap or a broken lock can
Turning to future welfare needs, over half (58%) of the
cause them major difficulties.
ex-Service community anticipated any of the future
Around 950,000 adults (11%) in the ex-Service difficulties listed at Figure 5.3 for them or their
community have difficulty with house and garden household in the next few years. Their greatest
maintenance. They are typically women aged over 75 concerns for the future were their ability to look after
who own their own home outright and are on relatively themselves, their houses or gardens.
low income.
5.4 Depression, loneliness and bereavement
Around 780,000 people (9%) in the ex-Service
community have suffered with depression in the last 12
months. They are typically retired women, aged over 55
years. 7 Source for GB adults: The Pensioner’s Income Series 2003/04
(National Statistics).
18Figure 5.3 Anticipated concerns over the next few Figure 5.4 Greatest needs of 16–44 year olds in 2005
years
Adult
ex-Service
Not enough money for daily living 22%
community
Feeling depressed 16%
% 8.43m
Any self-care/well-being difficulties: 28 2.38m Unemployment/fear of unemployment 14%
Poor health 22 1.84m Reported net h’hold incomeOver the next 15 years, welfare needs of 16–64s are set 5.10 Welfare needs and the older ex-Service
to decline in scale (see Figure 4.6 earlier). However, the
community: over 65 years
decline will be at a slower rate than the decline in
needs for the ex-Service community as a whole. The greatest needs of the 65–74 year olds (apart from
health and care needs) are related to house and garden
The needs that are forecast to decline most slowly are: maintenance, mobility and low income; followed by
psychological difficulties, lack of money for daily living, loneliness and depression.
lack of training/skills and unemployment (see Figure
5.6). Broadly, the type of problems faced by over 75s are
similar to those affecting 65–74s, yet larger in scale.
Figure 5.6 Needs of the 16–64 age group that are Mobility problems obviously become more severe with
forecast to decline slowly age, and therefore, the over 75s greatest needs
encompass difficulty getting around their own home as
well as out into the community.
Thousands
600
542 Figure 5.7 Greatest needs of 65–74 year olds in 2005
496
500 466
446
459
400 425 Psychological*
400
383
300
Lack of money
for daily living
House & garden maintenance
||||||||||||||||||| 12%
204
229
210 199 Unemployed
Difficulty getting around outside
|||||||||||||||| 10%
200
Lack of
Reported net h’hold incomeFigure 5.8 Greatest needs of over 75s in 2005 Figure 5.9 Needs of the 65 plus age group that are
forecast to decline slowly
House & garden maintenance 18%
Thousands
Reported net h’hold income6. Use of Support Services Figure 6.1 Prompted awareness of ex-Service
organisations, in the last 12 months
Adult ex-Service
6.1 Support from any source Community
%
Over half (52%) of the adult ex-Service community have
Royal British Legion 72
received help or advice in the last 12 months from SSAFA Forces Help 30
general sources of State or charitable assistance, Army Benevolent Fund 29
including health professionals, Citizens Advice, social Royal Air Force Association 28
workers, housing departments and job centres. Royal Air Force Benevolent Fund 23
Royal Naval Association 18
War Pensioners’ Welfare Service 16
6.2 Awareness of ex-Service organisations Royal Naval Benevolent Trust 14
The Regimental Association 12
Around 80% of the adult ex-Service community are The Officers Association 8
aware (when prompted) of any services or sources of Veterans Agency 8
help or advice that are particularly for ex-Service people Regular Forces Employment Association 7
and their families. In-Service welfare/Service Family Officers 6
Combat Stress 5
72% of the adult ex-Service community are aware of Ex-Service Homes Referral Agency 4
the Legion – equivalent to 6.07 million people – the Single Persons’ Accommodation Centre
highest ranked of any ex-Service organisation. However, for the ex-Services 3
awareness of Legion welfare is considerably lower: only Career Transition Partnership 3
a third (33%) are aware of generic Legion welfare,
which is equivalent to 2.78 million people.
Legion beneficiaries are most likely to have learnt that
Awareness of the Legion is significantly lower among the Legion might be able to help them through:
younger members of the ex-Service community: 40% ● A Legion branch (28%)
among 16–24 year olds and 58% among 25–34 year ● SSAFA Forces Help (24%)
olds. 16–24 year olds also have significantly below ● Word of mouth (20%)
average awareness of Legion welfare services (10%). ● The Veterans Agency (16%).
Awareness of Legion welfare is higher among veterans
(37%) than among dependent (ex-)spouses/partners
(31%) or dependent widows or widowers (26%). 6.3 Support from ex-Service organisations
Some 7% of the adult ex-Service community reported
Each specific welfare service is known to fewer than a
that they had received some kind of welfare support
quarter of adults in the ex-Service community, and most
from any ex-Service organisation(s) in the last 12
services are known to fewer than one in six.
months, equivalent to 590,000 people.
6.4 Legion support
In 2005, the Legion provided direct welfare services to
some 42,000 people8. In addition, 18,000 people
benefited indirectly through the funding provided to
other organisations; so a total of around 60,000 people
benefited from Legion welfare.
8 This was across the following Legion welfare
departments: Benevolence, Pensions and
Compensation, Careers Advice, Small Business Advice,
Welfare Breaks, Residential Care Homes and
Remembrance Travel.
22It should also be noted that people who received Figure 6.3 Improvement to quality of life from
information, advice, guidance or a home/hospital visit Legion support
are not included in the figures for direct welfare
services. At our broadest estimate the Legion receives
300,000 requests for assistance each year.
13%
Figure 6.2 Nature of direct Legion welfare received A lot
by Legion beneficiaries 11% A little
Not very much
7% 56%
Not at all
Any benevolence 35% Not stated
14%
Benevolence: financial/goods/services 21%
Benevolence: mobility/communication aids 15%
Pensions/compensation 29%
Residential care/welfare breaks 12%
Employment/careers advice 8%
Comradeship through branch/club 7%
Base: Legion beneficiaries
Remembrance travel 1%
Helping the homeless 1%
0% 10% 20% 30% 40%
Base: Legion beneficiaries
The majority (57%) of people that received assistance
from the Legion also received help from another ex-
Service organisation, the most common being SSAFA
Forces Help, the Veterans Agency, the War Pensioners’
Welfare Service, the Regimental Association and the
Army Benevolent Fund.
6.5 Impact of Legion support
Of the people receiving Legion support, 84% rate the
overall quality of the service received from the Legion
as excellent (57%) or very good (28%).
Beneficiaries typically report that the assistance that
they receive makes a big difference to their lives, with
70% saying it helped improve their quality of life a lot or
a little.
2323You can also read