Growth and Productivity Modeling of Seven Eucalyptus Species in Souiniet's Arboretum in the Northwestern of Tunisia
←
→
Page content transcription
If your browser does not render page correctly, please read the page content below
DOI: 10.5152/forestist.2021.20062
Forestist 2021: XX(XX): 1-16                                                                                                                       Original Article

Growth and Productivity Modeling of Seven Eucalyptus Species
in Souiniet’s Arboretum in the Northwestern of Tunisia
Sameh Mhamdi1 , Mohamed Tahar Elaieb2 , Naoufel Souayah3 , Mariem Khouja2 ,
Mohamed Larbi Khouja4 , Ali Aloui5 , Kévin Candelier6,7
1
 Laboratory of Forest Ecology, National Research Institute of Rural Engineering, Water and Forests, Carthage University, Amilcar,
Tunisia
2
 Laboratory of Management and Valorization of Forest Resources, National Research Institute of Rural Engineering, Water and Forests,
Carthage University, Amilcar, Tunisia
3
 Biology Department, College of Science and Arts, AlUla, Taibah University, Medina, Saudi Arabia
4
 Laboratory of Forest Ecology, National Research Institute of Rural Engineering, Water and Forests, Carthage University, Amilcar,
Tunisia
5
 Laboratory of Ecology and Biodiversity, Sylvopastoral Institute of Tabarka, Tabarka, Tunisia
6
 CIRAD, Research Unit BioWooEB, Montpellier, France
7
 BioWooEB, Univ. Montpellier, CIRAD, Montpellier, France

                                                       Abstract
                                                       This study consists of the development of tree growth models to deduce stands productivity and determine
                                                       the highest productive species in the conditions of the concerned plantation. Seven Eucalyptus, introduced
                                                       in the arboretum of Souiniet (north-west of Tunisia, wet Mediterranean bioclimate) in a Cork Oak natural for-
                                                       est, were studied. Stem analysis and non-linear growth modeling regression equations were used to predict
                                                       wood productivities. Gompertz and Chapman–Richards growth function appeared as being great numerical
                                                       models to estimate the Eucalyptus tree diameter and height evolutions, respectively. Moreover, an adapted
                                                       Chapman–Richards model allowed predicting the volume of trees in an efficient manner. The values of mean
                                                       annual volume productivity of the Eucalyptus spp.studied, allow us to classify them in order of increasing
                                                       annual productivity, as follows: E. sideroxylon, E. cinerea, E. maidenii, E. macrorhyncha, E. tereticornis, E. viminalis
                                                       and E. bicostata. The first three Eucalyptus spp. appeared as the best-adapted and most suitable Eucalyptus
                                                       trees for new plantations in this area. These species had the highest mean annual increments, ranged from
                                                       5 to 10 m3.ha−1.year−1 with 15 to 20 years of rotation. E. bicostata is the most promising, with annual average
                                                       production exceeding 10 m3.ha−1.year−1 after 25 years, and reaching 20 m3.ha−1.year−1 at 40 years old. These
                                                       modeling approaches provide additional knowledge on the productivity of the different Eucalyptus species,
                                                       thus enabling forestry operators to simulate the development of forest stands in order to optimize timber
                                                       production and harvesting.
                                                       Keywords: Annual mean increment, Eucalyptus, modeling, productivity, stem analysis, wet mediterranean
                                                       bioclimate
Cite this article as:
Mhamdi, S., Tahar Elaieb, M.,                                                                           Introduction
Souayah, N., Khouja, M.,
Larbi Khouja, M., Aloui, A., &                       Eucalyptus spp. have been widely planted in several regions around the world, thanks to their
Candelier, K. (2021). Growth                         high productivities, even in areas where drought and nutrient stress occur (Saadaoui et al., 2018).
and productivity modeling
                                                     Eucalyptus spp. are extensively used in significant plantations in temperate regions, more com-
of seven eucalyptus species
in souiniet’s arboretum in                           monly in subtropical and tropical regions all over the world. Their global estimation is over 20 mil-
the northwestern of tunisia.                         lion ha eucalypt plantations (excluding natural stands), of which 2.4 million ha are located in Africa
Forestist, August 27, 2021.                          (Hardwood, 2018). Morocco is the North African country with the largest Eucalyptus plantation area
DOI: 10.5152/                                        (215,000 ha), followed by Tunisia with about 55,000 ha (FRA, 2015; Hardwood, 2018). Eucalyptus
forestist.2021.20062.                                spp. constitute the largest share of hardwoods species and represent 5% of the total forest cover in
Corresponding Author:                                Tunisia, all species included. They are planted in forest production (40%) and forest protection (60%).
Kévin Candelier                                      Eucalyptus covers a surface of 28,500 ha in pure stands and 26,500 ha with mixed species (Zaibet,
e-mail: kevin.candelier@cirad.fr                     2016). Their area of plantations provides an annual wood volume of 3 m3.ha−1.year−1, which repre-
Received:                                            sents approximately 120,000 m3, making 25% of the annual volume harvested in Tunisian forests
December 18, 2020                                    (FAO, 2012).
Accepted:
March 22, 2021
Available Online Date:                               Such a woody resource needs forest management and numerical simulation to enable foresters
August 27, 2021                                      to evaluate the development of forest stands in order to optimize harvesting and timber produc-
             Content of this journal is licensed
             under a Creative Commons Attribution-   tion. Previous researches were carried out on various Tunisian wood species as Pinus halepensis and
             NonCommercial 4.0 International
             Licence.
                                                     Tectona grandis. These surveys highlighted that modeling estimations of dendrometric parameters

                                                                                            1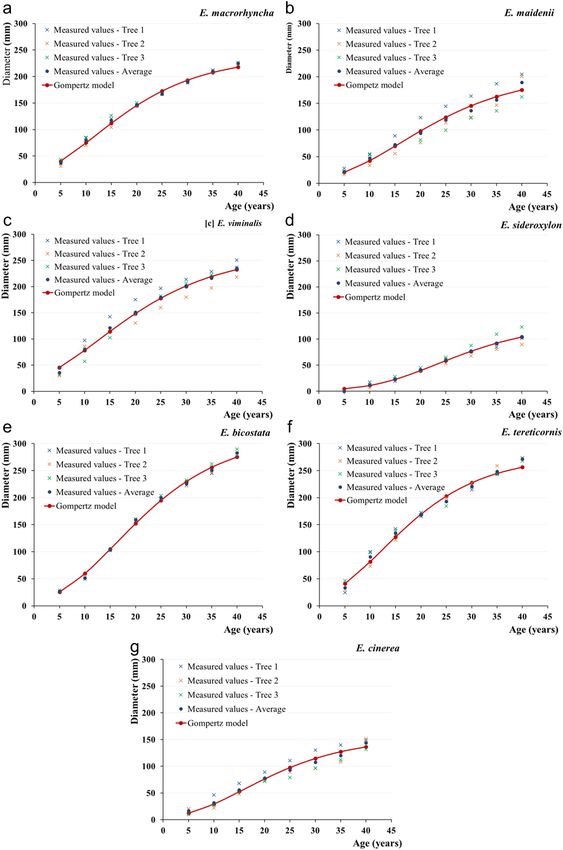
Mhamdi et al. Growth and Productivity Modeling of Eucalyptus
                                                    Forestist 2021: XX(XX): 1-16

Figure 1.
Current Classes of Tree Diameter Repartitions of the Seven Eucalyptus spp. plantations (a): E. macrorhyncha, (b): E. maidenii; (c):
E. viminalis; (d): E. sideroxylon; (e): E. bicostata; (f): E. tereticornis, and (g): E. cinerea

                                                                 2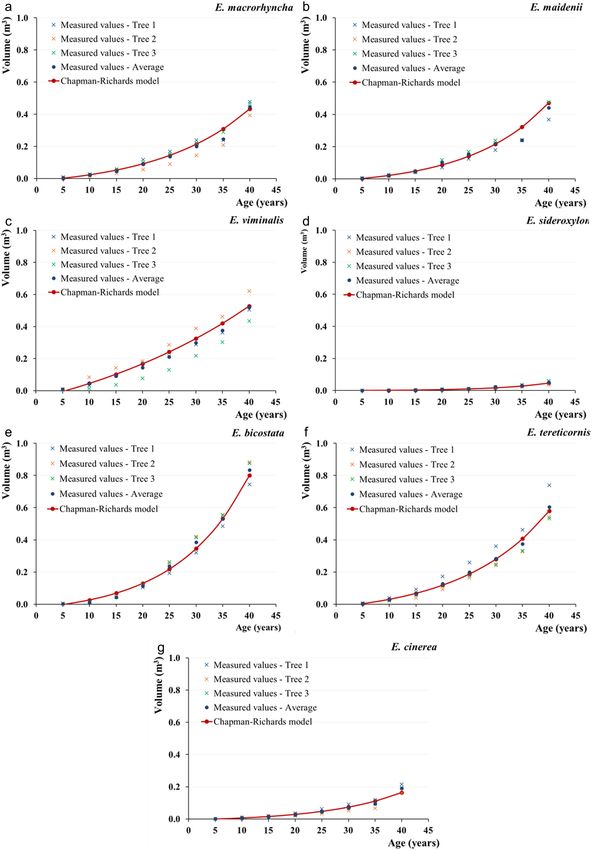
Mhamdi et al. Growth and Productivity Modeling of Eucalyptus
                                                      Forestist 2021: XX(XX): 1-16

during forest management allowed to improve considerably                  experimental site (from 1982 to 2012). The data are presented in
the timber production and the biomass yield of farm forestry              the climatic diagram in Figure 2. The average annual rainfall was
plantations (Curto et al., 2016; Fernández-Sólis et al., 2018;            1389 mm.year−1 (max: 227 mm in December; min: 2 mm in July).
Goubi et al., 2019). In this sense, several authors have developed        The mean annual temperature was 15.6°C, the hottest month
growth models for eucalypt plantations in temperate and tropi-            is August (24.9°C), and the coldest one is January (6.7°C). The
cal conditions (Delgado-Matas & Pukkala, 2014). These model               dry period usually extends from June to August. The number
equations have been extensively used in forest growth and                 of snow days was estimated to be 7 days per year. The under-
yield studies to characterize height-age and diameter-age and             story vegetation is dominated by Erica scoparia L. and Halimium
growth rate-age relationships (Corral-Rivas et al., 2004; Pienaar &       halimifolium (L.) Willk. The landscape is dominated by hydro-
Turnbull, 1973; Pommerening & Muszta, 2015; Pyo, 2017). Among             morphic soil and a clayey bedrock composed of sedimentary
the most used models, we can cite the following ones: Smalian,            from the Mio-Pliocene substrates and Oligocene. The arbore-
Gompertz, Weber, and Chapman–Richards for the height-age                  tum occupies part of the jbel Souiniet. The North Slope is made
modeling, and Logistic, Gompertz, and Chapman–Richards for                up of humus-rich soils of the leached brown to humus-rich mull
diameter-age modeling. Most of these equations have asymp-                to mull moder type. The South slope and the summit are made
totic functions, with two or three parameters that define a               up of less rich soils. Hydromorphy is present in places where the
sigmoid curve characterizing the different growth stages as               clay is close to the surface. Generally, the following three soil
influenced by biological processes and behaviors (Peng et al.,            types can be observed:
2001). These last models can be considered more suitable for
our present application than other functions describing empiri-           • Deep soil on the quaternary cover: It is a very deep soil up to
cal models (Sweda & Koide, 1981). A lot of equations used by sci-           3 m thick, with good physical quality (texture and porosity).
entific experts in tree log volume determination can be found               This soil offers the most favorable conditions for reforestation.
in the literature, such as Schumacher and Hall, Spurr, Kopezky-           • Moderately deep soil with hydromorphic depth: It is a thinner
Gehrhardt, Meyer, etc. (Melo et al., 2013; Miranda et al., 2014;            soil, and the clayey floor appears at less than 1.5 m. This type
Santos et al., 2012). All of these equations are dependent on the           of soil is suitable for the reforestation of a wide range of spe-
tree DBH. Owing to the importance of the Eucalyptus genus in                cies. It can be found on slopes and in small, slightly eroded
Tunisia (Elaieb et al., 2019), and the gap in growth modeling at            basins.
individual tree level, the objective of this work was to evaluate         • Hydromorphic soil with clayey bedrock: This soil is found in
and compare various diameter, height, and volume models for                 the most eroded areas where clay occurs within l m. This type
individual Eucalyptus maidenii, Eucalyptus bicostata, Eucalyptus            of soil is asphyxiating, and only species that are tolerant of
viminalis, Eucalyptus cinerea, Eucalyptus tereticornis, Eucalyptus          hydromorphy are suitable.
macrorhyncha and Eucalyptus sideroxylon trees introduced
since 1964 in the arboretum of Souiniet. All of these last species        Experimental Design and Data Collection
seem to have been well adapted to the extreme climatic condi-             The study was conducted on the seven following Eucalyptus spp.:
tions of this geographical area. Indeed, very little damages to           E. bicostata Maiden, Blakely & Simmonds; E. viminalis Labill.; E. tereti-
the growth of these tree species have been observed in these              cornis Sm.; E. macrorhyncha F. Muell. ex Benth.; E. maideni F. Muell.;
arboretums. As a result, these Eucalyptus species can be consid-          E. cinerea F. Muell. ex Benth.; and E. sideroxylon A. Cunn. ex Woolls.
ered very interesting in future reforestation programs based on
favorable levels of wood production compared to other exotic              These seven varieties of Eucalyptus were planted in a com-
or natural species. The target of this present project consists of        mon garden in 1969 in Souiniet Arboretum in association with
the development of a growth model of trees to deduce stands               Pinus nigra and Pinus pinaster species. The seeds used for the
productivity and determine the highest productive species in              Eucalyptus reforestation and acclimation test program were har-
the conditions of the concerned plantation. The models devel-             vested in 1968 by a Tunisian team in Australia, including about
oped through this study could enable foresters to simulate the            40 ecotypes representative of the whole range of the species
development of forest stands in order to optimize harvesting              in Australia.
and timber production while improving net income and eco-
nomic profitability.                                                      The growth and development of forest stands can be character-
                                                                          ized by various quantitative values, including measures of tree
                            Methods                                       height and mean diameter, determination of the number of
                                                                          trees per hectare, basal area per hectare, volume per hectare,
Study Area                                                                and various other derived quantities.
The study was conducted in the northwest of Tunisia on mid-
Khroumirie’s mountains at Souiniet’s arboretum (35.54° N,                 A set of data was obtained from seven permanent plots, estab-
8.48° E, 492 m alt.). The region is characterized by a low humid          lished for 40 years, in a continuous forest inventory of unthinned
Mediterranean bioclimate with rainy winters and dry sum-                  stands. These stands have not been managed, and no fire has
mers. The monthly maximum and minimum temperatures                        been detected since they were planted. Each plot was from
and total precipitation data were collected from Ain Draham               1000 to 1600 m2 with spacing between trees of 3 × 3 m2,
meteorological station located approximately 10 km from the               and the initial stand density was 1111 trees.ha−1. Each of the

                                                                      3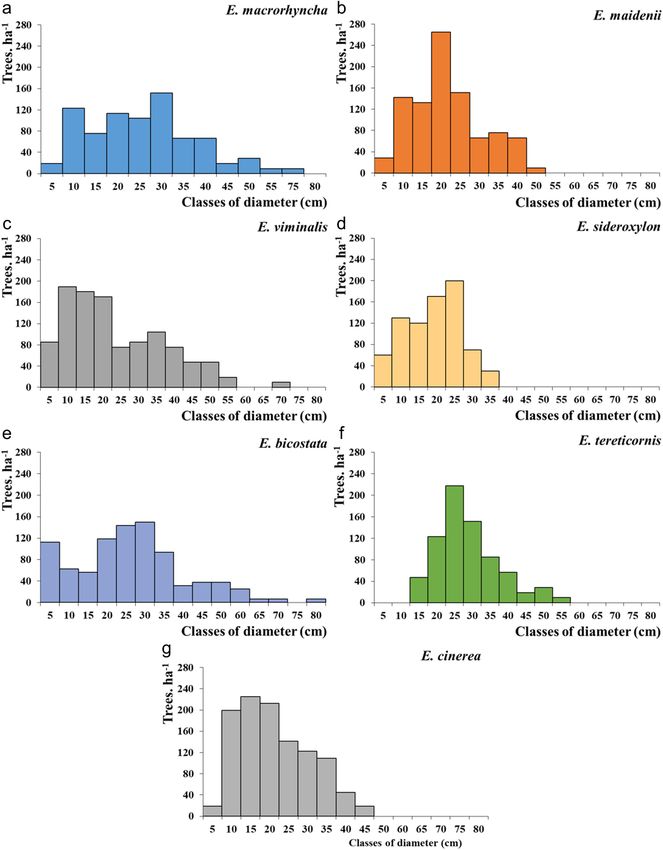
Mhamdi et al. Growth and Productivity Modeling of Eucalyptus
                                                      Forestist 2021: XX(XX): 1-16

Figure 2.
Comparing Measured Values and Estimated Values From Chapman–Richards Equation to (a) E. macrorhyncha, (b) E. maidenii,
(c) E. viminalis, (d) E. sideroxylon, (e) E. bicostata, (f) E. tereticornis, and (g) E. cinerea Heights According to the Age of the Trees.

                                                                    4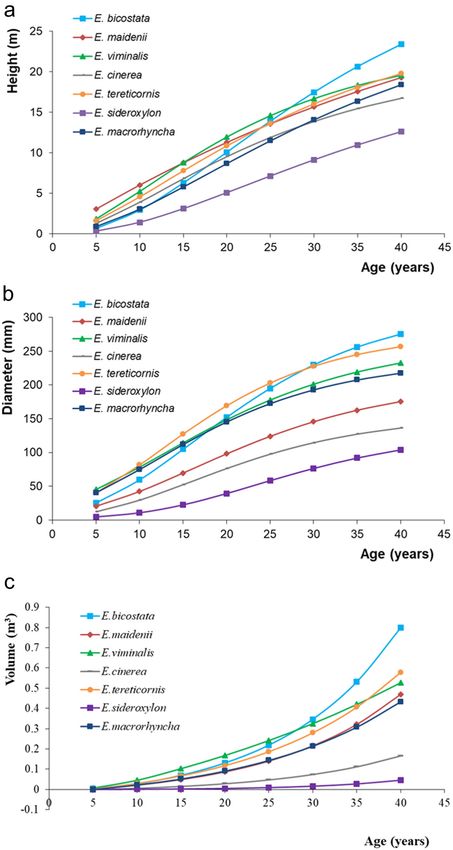
Mhamdi et al. Growth and Productivity Modeling of Eucalyptus
                                                          Forestist 2021: XX(XX): 1-16

 Table 1.
 Stand Characteristics of the Seven Eucalyptus spp. During 40 Years Located in the Arboretum of Souiniet, Northwest of Tunisia

                                                                                Current Density     Stand Basal Area      Mean Annual Mortality
 Species                Area of the Plot (m2)     Mean Diameter (cm)               (Tree/ha)            (m2/ha)              Rate (%/year)
 E. biscotata                   1600                       30.6                       887                  64.0                     0.42
 E. maidenii                    1056                       23.5                       937                  41.4                     0.56
 E. viminalis                   1056                       28.0                       1089                 64.4                     0.04
 E. cinerea                     1554                       23.4                       1094                 47.0                     0.04
 E. tereticornis                1056                       29.9                       738                  52.2                     1.17
 E. sideroxylon                 1000                       20.5                       780                  24.3                     1.01
 E. macrorhyncha                1056                       28.7                       786                  51.4                     0.86

Eucalyptus spp. studied in this work was planted in separate                    Eucalyptus (trees with a diameter equal or very close to the aver-
stands depending on the species considered. All the stands                      age diameter calculated on all the trees per species). For each
were, therefore, even-aged and monospecific.                                    species, three basal area averages of trees were then cut down
                                                                                in order to study the history of their growth. The three felled trees
Each plot has been characterized according to its area (m2),                    were cut into bolts on which one disk (5 cm in thickness) was
tree mean diameter (in centimeter, measuring at breast height                   sampled at the following levels: 0.20, 0.50, and 1.30 m then at
(DBH)), current density (tree per hectare), stand basal area                    every meter until the level of large diameter wood of 7 cm then
(meter square per hectare), and the mean annual mortality rate                  at each 50 cm until the end of the terminal bud of the main stem.
percentage per year). These parameters, for each Eucalyptus
wood species, are presented in Table 1. Trees with a diameter                   The measurements of the diameters (centimeter) were covered
at DBH smaller than 7 cm were not measured, but they were                       and the counting numbers of rings were performed on each
counted and considered in the data set.                                         disk sample on two perpendicular diameters. From two diam-
                                                                                eters, the mean diameter was calculated and adopted for mod-
                                                                                eling diameter growth.
Figure 1 illustrates an overview of the different Eucalyptus tree
diameter (at DBH) repartition within the plots. The determina-
                                                                                The analysis of each shot-down stem allowed us to determine,
tion of diameter distributions is essential to initialize individual
                                                                                at intervals of 5 years and across different analyzed levels, the
tree models. In addition, tree diameter distribution allows for
                                                                                diameter under bark and the total length of the stem.
more efficient harvest planning, which accounts for most of the
costs associated with wood production.
                                                                                Annual rings in Eucalyptus spp. sometimes need to develop
                                                                                technical processes to be identified (Naidoo et al., 2010). For
Figure 1 shows significant differences among the seven studied                  more accuracy, the growth rings have been analyzed by x-ray
plots. It appears that E. maidenii, E. cinerea, and E. tereticornis plan-       (SilviScanTM) analysis techniques as used in the previous studies
tations have trees with diameters centralized around 20–25 cm.                  from Downes et al. (2002) and Naidoo et al. (2010). The cores
While the distribution of the tree diameters from E. bicostata, E.              were air-dried and scanned with a high-resolution Itrax® x-ray
viminalis, E. sideroxylon, and E .macrorhyncha plantations seem                 densitometer. A density software program was used to mea-
to be more spread from 5 to 80 cm.                                              sure the annual rings and create a radial increment data file.
                                                                                The results of this identification are not included in this paper,
In E. maideni, E. cinerea, E. tereticornis, and E. sideroxylon stand,           but they were very useful to identify false rings and the limit of
100% of the trees had a DBH below 50 cm, while in the E. bico-                  adjacent small-growth rings of the annual rings closest to the
stata, E. viminalis, and E .macrorhyncha plots, the DBH reached                 bark end.
80 , 70, and 75 cm, respectively.
                                                                                Tree Height (H), Diameter (D), and Volume (V) Modeling
Description of Measurements                                                     Developing height and diameter growth curves for each
The determination of the volume productivity of the seven spe-                  Eucalyptus tree species were done by selecting various non-
cies of Eucalyptus was based on the stem measurements, widely                   linear models to compare the fitness of these models to data.
described and used by several authors to build wood productivity                We have selected different models among the most used in the
tables (Akossou et al., 2013; Miguel et al., 2018). This method is              literature. Four theoretical models (Smalian, Gompertz, Weber,
based on the evolution of the dendrometric characteristics of the               and Chapman–Richards) were fitted to develop height growth
tree (diameter, height, volume) as a function of time. The integral             equations, and three candidate equations (Logistic, Gompertz,
measurement of the diameter of all the trees made it possible in                and Chapman–Richards) were tested for the prediction of tree
a second step to choose three average trees in each species of                  diameter growth.

                                                                            5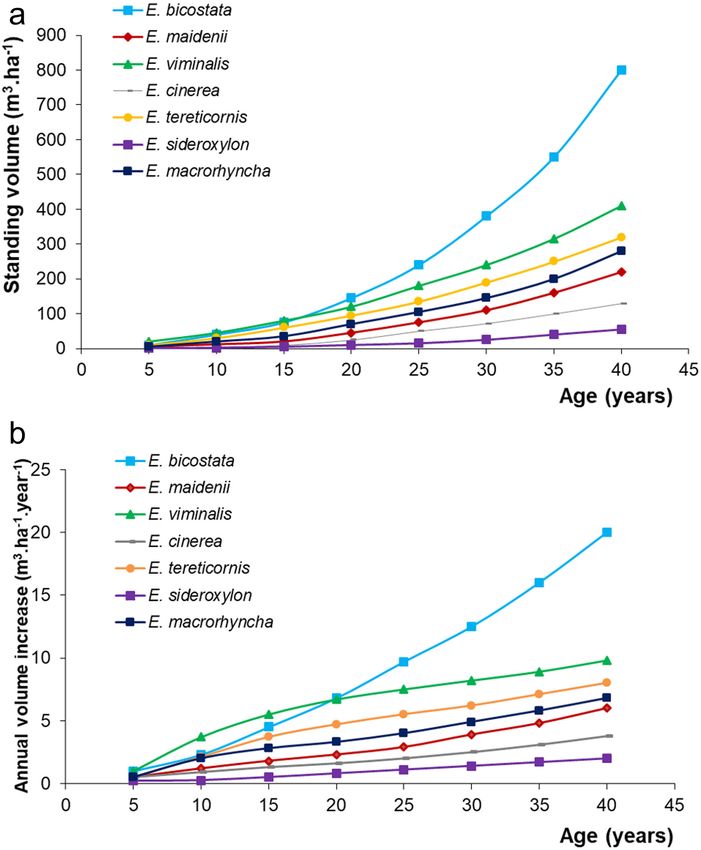
Mhamdi et al. Growth and Productivity Modeling of Eucalyptus
                                                       Forestist 2021: XX(XX): 1-16

The volume under the bark of the analyzed stems was deter-                 (prediction errors), respectively. BIAS (Ē), the mean absolute dif-
mined by the Smalian’s formula (Eq. 1):                                    ference (MAD), and the mean percent bias (MPB), representing
                                                                           the accuracy of the predictions, the statistical dispersion and the
     A1  A2                                                               average of percentage errors, respectively, were also evaluated for
V           L                                                  (1)
        2                                                                  each modeling equations developed in this study.

                                                                           These statistical evaluations were computed as follows:
where V is the volume of the log in m3; A1 is the area of the small
end of the log in m2; A2 is the area of the large end of the log in

                                                                                        X  X˘
                                                                                               n                               2
m2; L is the length of the log in m.
                                                                             2                i 1
                                                                                                               i       i
                                                                           R  1                                                                                (2)
                                                                                        X  X
                                                                                               n                               2
The Smalian’s formula has been adopted as a rule on a cubic                                                   i       i
                                                                                              i 1
scale to calculate the traces on the basis of a parabolic log. To do
that, the two inner diameters of the bark and the length were
                                                                                          X  X˘
                                                                                                   n                           2
measured. By multiplying the average of the areas of the two                                       i 1
                                                                                                                   i       i                                      (3)
                                                                           RMSE                                                   n
log ends by the log’s length, Smalian’s formula allows us to esti-
mate accurately the volume of a log.

                                                                                X  X˘
                                                                                    n
                                                                                               i           i
Most of the equations usually used in tree log volume model-               E       i 1                                                                          (4)
                                                                                           n
ing dependent on the tree DBH. The aim of the present work is
to evaluate tree volume growth according to the time (age of

                                                                                           n
tree). For this reason, we chose to test a developing exponen-                                         X i  X˘ i
tial equation that converts stem volume directly to the time-              MAD            i 1                                                                   (5)
dependent term ecx as the independent variable.                                                    n

The height-age, diameter-age, and volume-age equations used                        100  X˘ i  X i
                                                                           MPB                                                                                (6)
to develop models for the seven Tunisian Eucalyptus spp. were                       n  X i
presented in Table 2. For each model, the data set was com-
posed by results from all the 21 Eucalyptus trees (7 species x             where
3 trees x 9 ages = 189 samples). From this data set, mathemati-
cal models of growth for each variable were developed using                Xi = observed values (Height (H), Diameter (D) or Volume (V)) for
non-linear regression.                                                     the tree i;
                                                                           X̆ i
                                                                               = predicted values (Height (H), Diameter (D) or Volume (V))
Models Validation and Statistical Analyses                                 for the tree i;
The choice of the adequate model was carried out by the compar-
ison of the coefficients of determination (R²) and the root mean            X = observed mean values (Height (H), Diameter (D) or Volume
squared error (RMSE) representing the proportion of the variance           (V)) for the tree I;
in the dependent variable that is predictable from the inde-
pendent variable(s) and the standard deviation of the residuals            n = number of measures.

 Table 2.
 Candidate Equations of Regression Used for the Modeling of the Growth in Height (H), Under Bark Diameter (D), and Volume (V),
 Depending on the Age of the Tree. Where H Is the Total Height of the Dominant Tree in m; D is the Diameter of the Tree in m; V Is
 the Volume of the Log in m3; x Is the Tree Age in Year; and a, b, and c Are Model Parameters

 Modeling                         Name                                                                                                       Equation
 Height-Age Equation              Smalian                                                                                              H = x / (a + bx + cx^2)
                                  Gompertz                                                                                             H = a.exp(–b.exp(–cx))
                                  Weber                                                                                                 D = a [1 –exp(-bx)]
                                  Chapman–Richards                                                                                     H = a [1 –exp(-bx)]^c
 Diameter-Age Equation            Logistic                                                                                             D = a / [1 + c.exp( bx)]
                                  Gompertz                                                                                             D = a.exp(–b.exp(–cx))
                                  Chapman–Richards                                                                                     D = a [1 –exp(–bx)]^c
 Volume-Age Equation              Exponential time-dependent equation (derived from Chapman–Richards)                                     V = a + b exp(cx)

                                                                       6
Mhamdi et al. Growth and Productivity Modeling of Eucalyptus
Forestist 2021: XX(XX): 1-16
The under bark stem volume for each species per plot was cal- equation for these wood species are a really good predictor.
culated by 5-year intervals until 40 years whereas the total vol- Similar results were found by previous studies conducted in
ume of the plot is equal to the average volume of tree basal area other wood species, in some Eucalyptus spp. (Lumbres et al.,
multiplied by the current full number of alive trees of the plot 2018; Shater et al., 2011). In addition, the low values of AMD
disregarding the volumes of all the dead trees. (Mhamdi et al. Growth and Productivity Modeling of Eucalyptus
Forestist 2021: XX(XX): 1-16
Table 3.
Equations of Regression Used for the Modeling of the Growth in Height (H)
Species Retained Mathematical Models R2 RMSE (m) Ē (m) AMD (m) MPB (%)
Model Smalian
E. macrorhyncha H= x / [2.491 − 0.029x + 0.0005x^2*] 0.928 1.642 −0.602 1.323 23.982
E. maidenii H= x / [1.791 − 0.0189x + 0.0008x^2*] 0.966 0.924 0.180 0.743 −1.314
E. viminalis H= x / [1.9391 − 0.0279x + 0.00075x^2*] 0.945 1.435 0.039 1.050 13.345
E. sideroxylon H= x / [6.1391 + 0.0956x + 0.00055x^2*] 0.933 1.155 0.126 0.926 4.146
E. bicostata H= x / [2.234 − 0.0359x + 0.00065x^2*] 0.945 1.845 −0.421 1.575 42.680
E. tereticornis H= x / [2.1391 − 0.0379x + 0.00099x^2*] 0.988 0.641 −0.245 0.503 8.930
E. cinerea H= x / [2.8391 − 0.0479x + 0.00099x^2*] 0.969 0.902 0.342 0.878 0.878
Model Compertz
E. macrorhyncha H= 238.251*exp[−2.704 exp(−0.085x)] 0.936 1.551 0.547 1.249 0.643
E. maidenii H= 208.251 *exp[−3.104 exp(−0.075x)] 0.968 0.903 −0.005 0.718 2.876
E. viminalis H= 265.251 *exp[−2.554 exp(−0.074x)] 0.937 1.539 0.479 1.104 5.212
E. sideroxylon H= 455.102 *exp[−5.954 exp(−0.006x)] 0.942 1.070 0.002 0.831 1.572
E. bicostata H= 317.251 *exp[−3.784 exp(−0.082x)] 0.959 1.596 0.840 1.198 −0.407
E. tereticornis H= 278.574*exp[−3.015 exp(−0.090x)] 0.985 0.697 −0.236 0.521 0.456
E. cinerea H= 155.147 *exp[−3.884 exp(−0.085x)] 0.977 0.787 0.012 0.574 0.733
Model Weber
E. macrorhyncha H= 299.445 [1−exp(−0.0015x)] 0.912 1.815 0.128 1.533 19.298
E. maidenii H= 249.445 [1−exp(−0.0020x)] 0.914 1.478 0.809 1.250 −9.900
E. viminalis H= 223.467 [1−exp(−0.0025x)] 0.910 1.839 0.298 1.355 10.746
E. sideroxylon H= 215.241 [1−exp(−0.0014x)] 0.877 1.566 −0.636 1.422 27.578
E. bicostata H= 255.245 [1−exp(−0.0021x)] 0.903 2.452 0.374 2.145 42.083
E. tereticornis H= 184.452 [1−exp(−0.0028x)] 0.971 0.982 0.156 0.817 4.663
E. cinerea H= 145.441 [1−exp(−0.0031x)] 0.968 0.926 0.127 0.700 5.705
Model Chapman–Richards
E. macrorhyncha H= 28.645[1−exp(−0.041x)]^2.058 0.943 1.467 0.189 1.151 0.257
E. maidenii H=35.137 [1−exp(−0.021x)]^1.062 0.960 1.011 −0.172 0.821 0.929
E. viminalis H= 23.295 [1−exp(−0.061x)]^1.905 0.949 1.393 0.308 1.015 2.876
E. sideroxylon H= 21.278 [1−exp(−0.011x)]^2.535 0.950 0.999 0.238 1.036 −0.242
E. bicostata H= 35.648 [1−exp(−0.047x)]^2.550 0.973 1.288 0.171 1.017 −0.102
E. tereticornis H= 27.145 [1−exp(−0.045x)]^1.755 0.985 0.710 −0.215 0.482 0.553
E. cinerea H= 21.045 [1−exp(−0.055x)]^1.955 0.976 0.807 −0.101 0.610 −0.020
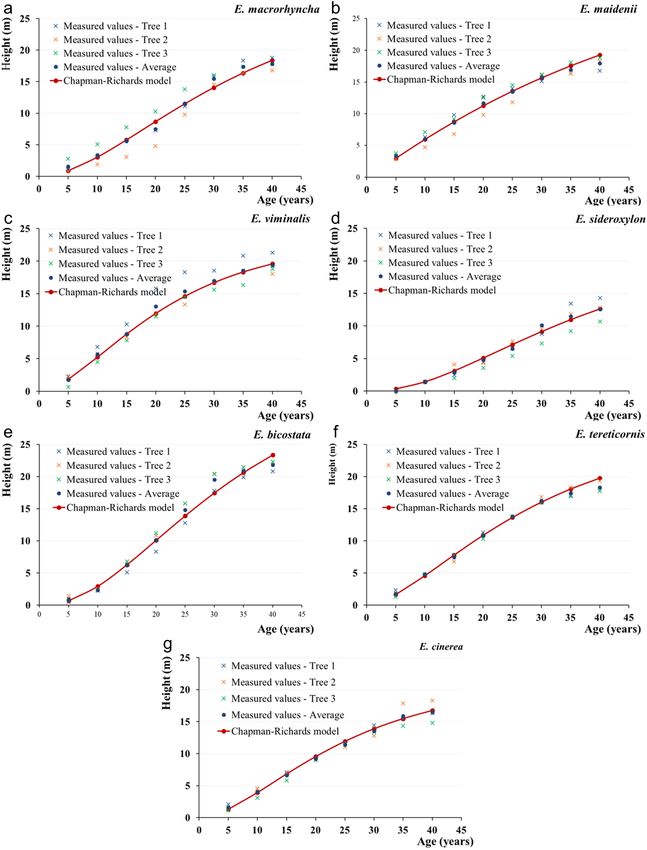
have been developed for young planting, whereas in our present Eucalyptus diameter evolution relating to the tree year’s old
work the stand age extended beyond 40 years. depends on the Eucalyptus genus. The diameter growing evolu-
tion curves of E. bicostata and E. tereticornis are similar and repre-
The predicted values from the Gompertz model and measured sent the largest diameters after 40 years which are respectively
values of diameter-age curves are presented in Figure 4, for each 275 mm and 256 mm (average values). The lowest diameter incre-
Eucalyptus spp. It appears that the Gompertz model developed ment curve was recorded in E. sideroxylon, with a tree diameter of
for the volume tree diameter prediction is lower accurate than up to 103 mm, after 40 years (average values). Then, the analysis of
the Chapman–Richards model developed to predict the height diameter growth curves at breast height during the first 40 years
of the tree. Most species had a rather constant increment in mean allows us to cluster into three different groups of the species from
tree diameter (Figures 4 and 3b). However, it clearly appears that the most successful to less successful as follows:
8Mhamdi et al. Growth and Productivity Modeling of Eucalyptus
Forestist 2021: XX(XX): 1-16
which suggests that the level of adaptation to site conditions is
different. Wamalwa et al. (2007) showed that there was a highly
significant difference in height, DBH, stem form, and branching
habit of various Eucalyptus spp. and clones within and between
sites in Kenya and more particularly depending on the altitude
of the site. In addition, depending on the genus, Eucalyptus spp.
adapt more or less well according to the climatic conditions and
the nature of the biotope. This statement is comparable with
the behavior of other wood species in Algeria (Ifticene-Habani
& Messaoudene, 2016).
Tree Volume-Age Modeling
As shown in Table 5, the R² statistic indicates that there was a
good fit of the volume-age based on an adapted Chapman–
Richards model, in which 0.903 (for E. viminalis) of the varia-
tion in the volume of trees was explained by the independent
variables. Each equation provided highly accurate estimates of
volume, with RMSE values lower than 0.054 m3 (obtained with
E. viminalis), absolute values of Ē lower than 0.017 m3 (obtained
with E. viminalis), AMD values lower than 0.042 (obtained with E.
viminalis), and MPB values lower than of 3.432% (obtained with
E. maidenii). We also observed on the volume-age model, as for
the diameter-age model, that the accuracy of predictions is not
always accurate for the highest tree ages. The comparison of real
total volumes of felled trees with those provided by the mathe-
matical model shows that these forecasts are tainted with a rela-
tive error ranging from −7.9 to 1.5 % (Table 6). The mathematical
models developed do not enable us to predict the volume of
the tree accurately when these Eucalyptus trees are more than 30
years old, especially for E. maidenii, E. sideroxylon, and E. cinerea.
The predicted values from the adapted Chapman–Richards
model and measured values of volume-age curves are pre-
sented in Figure 5, for each Eucalyptus spp.
The analysis of volume growth curves (Figure 3c) allows us to
classify also the Eucalyptus spp. into three groups:
Figure 3.
(a) Height Growth, (b) Under Bark Diameter at Breast Height
(DBH) Increment and (c) Volume Growth Curves of Different • Group 1 includes only E. bicostata as the most productive
Eucalyptus spp. Obtained According to the Age of the Tree. Eucalyptus species, with a volume of 0.800 m3, after 40 years.
• Group 2 includes E. tereticornis, E. viminalis, E .maidenii, and E.
• Group 1 includes two or four better-adapted species E. bico- macrorhyncha as medium productive Eucalyptus species, with
stata and E. tereticornis presented by the mean diameter a volume after 40 years of 0.579, 0.528, 0.470, and 0.434 m3,
developed faster through years. respectively.
• Group 2 presented by E. viminalis, E. maidenii, and E. macro- • Group 3 includes the two lower productive species which are
rhyncha presented by a medium diameter growing rate. the less adapted Eucalyptus spp. to the Khroumirie area con-
• Group 3 presented by E. cinerea and E. sideroxylon showed ditions. E. cinerea and E. sideroxylon showed a very slow volu-
slow diameter growth. Therefore, less adapted to the condi- metric increment curve, reaching only 0.165 m3 and 0.046 m3
tions of the Khroumirie medium mountain. after 40 years, respectively.
Growing in the same site, with respect to DBH, the studied The comparison of the growth rate in diameter, height, and vol-
Eucalyptus spp. showed similar DBH trends, as reported by vari- ume of the seven Tunisian Eucalyptus spp. allowed us to select E.
ous researchers for different Eucalyptus clones in Tanzania (Pima bicostata, E. viminalis, and E .tereticornis as well-adapted species
et al., 2016). According to Wamalwa et al. (2007), the differences to the site condition for reforestation, forest management, and
in DBH within a site may be attributed to the genetic difference silviculture treatment.
9Mhamdi et al. Growth and Productivity Modeling of Eucalyptus
Forestist 2021: XX(XX): 1-16
Table 4.
Equations of Regression Used for the Modeling of the Growth in Under Bark Diameter (D)
Species Retained Mathematical Models R2 RMSE (mm) Ē (mm) MAD (mm) MPB (%)
Model Logistic
E. macrorhyncha D= 258.014 / [1 + 5.986*exp(−0.092x)] 0.970 10.621 3.269 7.950 2.145
E. maidenii D= 227.267/ [1 + 9.086*exp(−0.088x)] 0.913 16.142 1.685 7.950 6.111
E. viminalis D= 237.267 / [1 + 8.086*exp(−0.128x)] 0.951 14.662 2.743 11.984 1.402
E. sideroxylon D= 117.267 / [1 + 11.858*exp(−0.102x)] 0.920 10.333 −3.383 8.487 18.828
E. bicostata D= 295.587 / [1 + 12.086*exp(−0.127x)] 0.988 9.770 −3.352 8.329 9.604
E. tereticornis D= 267.354 / [1 + 8.986*exp(−0.135x)] 0.973 12.451 0.278 10.523 4.477
E. cinerea D= 157.584 / [1 + 9.145*exp(−0.102x)] 0.934 10.823 −0.291 9.098 9.344
Model Compertz
E. macrorhyncha D= 238.251*exp[−2.704 exp(−0.085x)] 0.990 6.101 1.092 5.257 0.271
E. maidenii D= 208.251 *exp[−3.104 exp(−0.075x)] 0.913 16.201 −0.137 13.780 1.305
E. viminalis D= 265.251 *exp[−2.554 exp(−0.074x)] 0.958 13.614 0.314 10.945 3.480
E. sideroxylon D= 455.102 *exp[−5.954 exp(−0.006x)] 0.963 7.039 0.198 5.093 −0.548
E. bicostata D= 317.251 *exp[−3.784 exp(−0.082x)] 0.994 6.561 0.260 5.516 0.889
E. tereticornis D= 278.574*exp[−3.015 exp(−0.090x)] 0.981 10.518 1.105 9.011 2.064
E. cinerea D= 155.147 *exp[−3.884 exp(−0.085x)] 0.934 0.173 0.173 9.184 −1.383
Model Chapman–Richards
E. macrorhyncha D= 245.445 [1−exp(−0.065x)]^1.655 0.987 6.968 3.909 5.830 −4.575
E. maidenii D= 232.445 [1−exp(−0.051x)]^1.922 0.911 16.410 0.702 14.509 −3.560
E. viminalis D= 261.467 [1−exp(−0.061x)]^1.512 0.961 13.100 0.566 10.237 0.781
E. sideroxylon D= 255.241 [1−exp(−0.031x)]^2.420 0.959 7.412 −0.473 5.428 −0.084
E. bicostata D= 305.245 [1−exp(−0.078x)]^2.712 0.991 8.574 −0.172 7.257 −3.215
E. tereticornis D= 304.452 [1−exp(−0.0578x)]^1.567 0.986 9.042 2.044 7.515 −0.119
E. cinerea D= 185.441 [1−exp(−0.042x)]^1.512 0.938 10.485 −1.405 9.218 5.047
Productivity of Stands The first three species are more adapted to the site conditions.
Volumes on the foot of the stands were predicted directly from Between 15 and 20 years, we did not find a difference between
the mean values of the log volume multiplied by the num- E. bicostata and E. viminalis, with annual average productivity
ber of stems that constitute the stand (Westfall & McRoberts, between 5 and 10 m3/ha/year. The other species have lower
2017). This method is tainted with an error, which is added to average productivity than 5 m3/ha/year.
that caused by modeling. We estimated that this deviation was
about −4.1% by comparing the actual total volume of 21 felled
Only the annual average productivity of E. bicostata exceeds
trees (7.713 m3) to their total volume (7.392 m3) assumed to be
10 m3/ha/year after 25 years to reach annual average productiv-
equal to 21 times the unit volume (0.352 m3) of the tree medium
ity of 20 m3/ha/year at the age of 40 years.
basal area.
For short rotations of less than 25 years, E. bicostata and E .vimi-
Figure 6 shows the standing volumes (Figure 6a) and the aver- nalis are recommended for the study area. E. tereticornis can be
age annual production (Figure 6b), respectively, of the seven added with rotations of more than 25 years.
Eucalyptus spp. stands.
There were clear differences between the species regard-
In terms of wood production during the first 40 years of the ing growth, productivity, and other characteristics. On the
growth of trees, the results showed that the seven species of first 40 years of their life and in Khroumirie’s conditions, that
Eucalyptus were ranked from the most productive to the least as enabled us to give preference to the usage of E. bicostata.
follows: E. bicostata >E. viminalis> E. tereticornis >E. macrorhyn- E. viminalis keep track of E. teretecornis. This productivity
cha > E .maidenii > E. cinerea > E. sideroxylon. remains lower than the productivity average of 20 m3/ha/year
10Mhamdi et al. Growth and Productivity Modeling of Eucalyptus
Forestist 2021: XX(XX): 1-16
Figure 4.
Comparing Measured Values and Estimated Values From Chapman–Richards Equation to (a) E. macrorhyncha, (b) E. maidenii,
(c) E. viminalis, (d) E. sideroxylon, (e) E. bicostata, (f) E. tereticornis, and (g) E. cinerea Diameters According to the Age of the
Trees.
11Mhamdi et al. Growth and Productivity Modeling of Eucalyptus
Forestist 2021: XX(XX): 1-16
Table 5.
Equations of Regression Used for the Modeling of the Growth in Under Bark Volume (V) of the Tree Average Basal Area
Species Retained Mathematical Models R2 RMSE (m3) Ē (m3) MAD (m3) MPB (%)
Model Chapman–Richards
E. macrorhyncha H= −0.065 + 0.049 exp(0.058x) 0.942 0.034 −0.009 0.023 0.267
E. maidenii H= −0.046 + 0.034 exp(0.068x) 0.926 0.037 −0.010 0.024 −3.432
E. viminalis H= −0.388 + 0.337 exp(0.025x) 0.903 0.054 −0.017 0.042 −0.122
E. sideroxylon H= −0.002 + 0.001 exp(0.097x) 0.928 0.005 0.002 0.003 −0.592
E. bicostata H= −0.068 + 0.045 exp(0.074x) 0.983 0.036 0.005 0.029 −0.683
E. tereticornis H= −0.075 + 0.057 exp(0.061x) 0.946 0.046 0.002 0.030 −0.774
E. cinerea H= −0.016 + 0.011 exp(0.07x) 0.927 0.016 −0.001 0.011 -0.329
Table 6.
Comparison of Real Under Bark Volumes of Average Felled Trees (V1) to their Volumes Estimated by Mathematical Models (V2) at
the Age of 40 Years Old
V1 (m3) Real Means of Three V2 (m3) Estimated by the Mathematical
Species Trees Felled Models Precision (%) (V2–V1)/V1)100
E. macrorhyncha 0.445 0.434 −2.5%
E. maidenii 0.440 0.465 5.7%
E. viminalis 0.520 0.528 1.5%
E. sideroxylon 0.051 0.048 −5.9%
E. bicostata 0.835 0.800 −4.2%
E. tereticornis 0.605 0.579 −4.3%
E. cinerea 0.190 0.175 −7.9%
recorded in the world on Eucalyptus plantations (Brown et al., statement, the growth of trees seems to be affected by differ-
1997). ent factors such as species genotype, environmental conditions,
and forestry management. On average rotations comprised
On the other hand, growth differences have been found in between 15 and 20 years, the mean diameter under the bark of
other Eucalyptus species, tested under South African growing the Eucalyptus trees could be ranged from 10 to 15 cm and may
conditions (Gardner, 2001), highlighting the importance of site- only produce industrial woods, suitable for pulping or firewood.
species matching, as well as site provenance matching.
Researches on Eucalyptus forest management planning meth-
The cold winter and dry summer characterizing the mountain of ods have been expanded. Productivity of Eucalyptus planta-
Khroumirie decrease the growth rate of these sensitive species tions varies greatly, depending mainly on the genus, on the
to these two factors. Only cold sheltered stations on southern geographical location (Saïdi et al., 2011), and the soil compo-
slopes, stations in damp valleys may agree to allow these species sition (Barbier & Gbadoe, 2001). For example, mean annual
and probably increase productivity. In addition, Eucalyptus spp. increments of Eucalyptus globulus in Ethiopia of about 18 m3/
plantation yields in the drier tropics are often about 5–10 m³/ ha/year can be achieved in the best sites, whereas in medium
ha/year on 10–20 year rotations, whereas in moister regions, vol- and poor sites, the maximum mean annual increment is 13 and
umes up to 30 m³/ha/year may be achieved (Evans, 1992). For 5 m3/ha/year, respectively (Guzmán et al., 2012). Concerning
example, the mean values of annual increases in wood volume the wood species, Mughini (2000) highlighted that, in the same
produced by Eucalyptus camaldulensis plantations, with rota- plantation area, the productivity of E. globulus ranges from
tions ranging from 7 to 15 years, are very different depending 10 to 35 m3/ha/year, while those of E. occidentalis are comprised
on the countries and on the forestry methods implemented in between 3 and 8 m3/ha/year. Dimensional growth in terms
the stand (Lamprecht, 1990): 20–25 m³/ha/year in Argentina, of diameter and height is part of an individual tree growth
30 m³/ha/year in Israel (irrigated plantation), 17–20 m³/ha/year model, but it is subjected to strong and complex interactions
in Turkey (heartwood growth), 25–30 m³/ha/year in Turkey (1st (Martins et al., 2014). Several authors have developed typical
coppice generation), 3–11 m³/ha/year in Morocco, 2–10 m³/ha/ equations for tree growth models according to the different
year in Portugal, and 6–7 m³/ha/year in Italy. According to this plantations conditions, such as temperate climatic conditions
12Mhamdi et al. Growth and Productivity Modeling of Eucalyptus
Forestist 2021: XX(XX): 1-16
Figure 5.
Comparing Measured Values and Estimated Values From Chapman–Richards Equation to (a) E. macrorhyncha, (b) E. maidenii,
(c) E. viminalis, (d) E. sideroxylon, (e) E. bicostata, (f) E. tereticornis, and (g) E. cinerea Stem Volumes According to the Age of the
Trees.
13Mhamdi et al. Growth and Productivity Modeling of Eucalyptus
Forestist 2021: XX(XX): 1-16
less dry microclimatic conditions could ensure the ecological
requirements of these species and improve their productivity.
More intensive silvicultural could also improve the productive
efficiency of the performing species.
The Eucalyptus plantations in Tunisia occupy an area of 28,535 ha
and cover 3.4% of the total area of the forest field of the state,
mainly in humid and sub-humid bioclimate. The productivity
of these plantations could be improved using E. bicostata; E.
tereticornis, and E. viminalis and raise it by at least 285,350 m3/
year equivalents to 2/3 of the overall annual Tunisian forest pro-
duction. With an intensification of the silviculture of Eucalyptus
through soil preparation, adequate fertilization, and a better
selection of species, it is possible to reach the overall average
annual production of Eucalyptus plantations estimated at 20 m3/
ha/year.
For such development of Eucalyptus plantations, the economi-
cal (genetic improvement, wood materials for construction),
social (change of practices toward fast-growing plantations,
land-use planning), and environmental (carbon storage, soil
erosion and sterilization, biodiversity) aspects will be the essen-
tial components to be taken into consideration.
Figure 6. Our current study suffers from some limitations, such as the
Standing Volume (a) and Annual Average Volume Increment small number of samples of plots on only one site. It would be
of Eucalyptus Stands (b), at Souiniet Arboretum. very important to establish more experiments in order to access
the influence of the silvicultural treatments on Eucalyptus plan-
tation productivity as well as their interaction with the envi-
in Portugal (Soares & Tomé, 2002) and in northwestern Spain ronment. Likewise, the experiments should be extended to
(Garcia & Ruiz, 2003), but also in the tropical area (Brazil) (Pinto timber and wood characteristics. Our perspective is to expand
et al., 2005). These types of tree growth models are not focused sampling to other areas and to increase the number of popula-
only on Eucalyptus models but they are also developed for tions sampled across the entire geographic range of this species
many other tropical and subtropical wood species, all over the to provide a large- and medium-scale view of its behavior. In
world (Fernández-Sólis et al., 2018; Fétéké et al., 2015), and they addition, since Eucalyptus spp. in the study zone are currently
become a great tool in the management of agroforestry sys- concentrated in a homogenous area where there is no great
tems (Proces et al., 2017). variability in climatic and soil data, the future incorporation
into the model of information about plantations in neighbor-
Conclusion and Recommendations ing areas, including the respective environmental data (dry and
wet periods, soils composition, diseases, temperature variations,
Eucalyptus plantations in the world have revolutionized forestry in comparison with other wood species, etc.), would be of great
many tropical or Mediterranean countries. These Eucalyptus stands value in increasing data variability and facilitating readjust-
allow producing a huge amount of biomass, withstand rotations ments of the model.
averaging 10 years. These stand rotations can even be reduced to
3 years for the fastest-growing Eucalyptus spp. Compared with this However, these preliminary results obtained by these mod-
observation from the literature, the seven species of Eucalyptus eling approaches provide additional knowledge on the pro-
introduced into the Souiniet arboretum (humid Mediterranean ductivity of the different Eucalyptus spp. installed in Tunisia,
bioclimate with a temperate variant) seem to have rather low thus enabling forestry operators to simulate the develop-
growth rates, limiting their levels of wood production. ment of forest stands in order to optimize timber production
and harvesting. In addition, these comparative model results
From the trials reported above, it is clear that selected provenances show us that various effective models can be developed.
of E. bicostata, E. tereticornis, and E. viminalis have good potential for The equation used in the tree growth modeling can be dif-
plantation. These species have the highest annual average produc- ferent according to the Eucalyptus spp. In this sense, more
tivity in the region but did not exceed 20 years 10 m3/ha/year. comprehensive studies will be carried out in the near future,
which may involve more organizations and harvesters inter-
The rapid growth of discards in the first cut would slightly ested in such an approach to select the best model for each
increase these performances. The choice of stations under and Eucalyptus spp.
14Mhamdi et al. Growth and Productivity Modeling of Eucalyptus
Forestist 2021: XX(XX): 1-16
Peer-review: Externally peer-reviewed. • García, O., & Ruiz, F. A. (2003). Growth model for eucalypt in Galicia.
Spain. Forest Ecology and Management, 173(1–3), 49–62. [CrossRef]
Author Contributions: Concept – S.M., M.T.E., M.L.K.; Design – M.T.E., • Gardner, R. A. W., Gardiner, C., & Schofield, A. (2001). Combined
K.C.; Supervision – M.T.E., M.L.K., K.C.; Resources – M.L.K.; Materials – report on 1997 ICFR/CSIRO collaborative seed collection trip in
M.T.E., N.S., M.K., A.A., K.C.; Data Collection and/or Processing – S.M., N.S., Northern New South Wales. Australia. ICFR Internal Report No.
M.K., A.A., K.C.; Analysis and/or Interpretation – S.M., M.T.E., N.S., M.K., 02/2000. Pietermaritzburg: Institute for Commercial Forestry
M.L.K., A.A., K.C.; Literature Search – K.C.; Writing Manuscript – S.M., M.T.E., Research.
M.L.K., K.C.; Critical Review – M.T.E., M.L.K., K.C. • Goubi, M., Bentouati, A., Kherchouche, D., & Sghaier, T. (2019). Vol-
ume tables for individual specimens of Aleppo pine, Pinus halepen-
Conflict of Interest: The authors have no conflicts of interest to declare. sis Mill. in [In French]. Bois et Forêts des Tropiques, 339(339), 45–59.
[CrossRef]
Financial Disclosure: The authors declared that this study has received • Guzmán, G., Morales, M., Pukkala, T., & de-Miguel, S. (2012). A model
no financial support. for predicting the growth of Eucalyptus globulus seedling stands in
Bolivia. Forest Systems, 21(2), 205–209. [CrossRef]
• Hardwood, C. (2018). Sustainability of wood production from euca-
References lypt plantations in Asia. CAETS 2018 Conference, Uruguay, Monte-
video. Retrieved from http://caets2018.aniu.org.uy/wp-content/
• Akossou, A. Y. J., Arzouma, S., Attakpa, E. Y., Fonton, N. H., & Kokou, uploads/2018/09/5.-Harwood-Uruguay-2018-09-09.pdf
K. (2013). Scaling of teak (Tectona grandis) logs by the xylometer • Ifticene-Habani, N., & Messaoudene, M. (2016). Radial growth and
technique: accuracy of volume equations and influence of the log climate sensitivity of Atlas pistachio, Pistacia atlantica Desf. in Alge-
length. Diversity, 5(1), 99–113. [CrossRef] ria [In French]. Bois et Forêts des Tropiques 329, 3–15. [CrossRef]
• Barbier, C., & Gbadoe, E. (2001). Soil fertility and eucalyptus produc- • Lamprecht, H. (1990). Silviculture in the Tropics: Tropical forest ecosys-
tion in Southern Togo [In French]. Bois et forêts des tropiques, 267, tems and their tree species-possibilities and methods for their long-
21–31. Retrieved from http://revues.cirad.fr/index.php/BFT/article/ term utilization. Eschborn, Germany: GTZ.
view/20109/19868. • Lumbres, R. I. C., Seo, Y. O., Son, Y. M., Doyog, N. D., & Lee, Y. J. (2018).
• Corral Rivas, J. J., Álvarez González, J. G., Ruíz González, A. D., & Von Height-age model and site index curves for Acacia mangium and
Gadow, K. (2004). Compatible height and site index models for five Eucalyptus pellita in Indonesia. Forest Science and Technology, 14(2),
pine species in El Salto, Durango (Mexico). Forest Ecology and Man- 91–96. [CrossRef]
agement, 201(2–3), 145–160. [CrossRef] • Martins, F. B., Soares, C. P. B., & Silva, G. Fd. (2014). Individual tree
• Curto, R. A., Mattos, P. P., Braz, E. M., Péllico Netto, S., & Zachow, R. growth models for Eucalyptus in northern Brazil. Scientia Agricola,
(2016). Wood density of Araucaria angustifolia from overstocked 71(3), 212–225. [CrossRef]
strand. Pesquisa Florestal Brasileira, 36(85), 51–59. [CrossRef] • Melo, L. Cd, Barreto, P. A. B., Oliveira, F. G. R. Bd, & Novaes, A. Bd.
• Delgado-Matas, C., & Pukkala, T. (2014). Growth models for six euca- (2013). Estimativas volumétricas em povoamento de Pinus carib-
lyptus species in Angola. Southern Forests, 2014, 1–12. [CrossRef] aea var. hondurensis no sudoeste da Bahia. Pesquisa Florestal Bra-
• Doi, B. T., Binkley, D., & Stape, J. L. (2010). Does reverse growth domi- sileira, 33(76), 379–386. [CrossRef]
nance develop in old plantations of Eucalyptus saligna? Forest Ecol- • Miguel, E., Péllico Netto, S., Azevedo, G., Azevedo, G., Rezende, A.,
ogy and Management, 259(9), 1815–1818. [CrossRef] & Pereira, R. (2018). Alternative methods of scaling Eucalyptus uro-
• Downes, G. M., Wimmer, R., & Evans, R. (2002). Understanding wood phylla trees in forest stands: compatibility and accuracy of volume
formation: gains to commercial forestry through tree-ring research. equations. iForest - Biogeosciences and Forestry, 11(2), 275–283.
Dendrochronologia, 20(1–2), 37–51. [CrossRef] [CrossRef]
• Elaieb, M. T., Ayed, S. B., Ouellani, S., Khouja, M. L., Touhami, I., & Can- • Miranda, D., Paro, B. A. V., & Costa, G. R. (2014). Estimativa do volume
delier, K. (2019). Collapse and physical properties of native and pre- em árvores de Hymenaea coubaril no norte de Mato Grosso.
steamed Eucalyptus camaldulensis and Eucalyptus saligna wood from Nativa, 2, 219–223.
Tunisia. Journal of Tropical Forest Science, 31(2), 162–174. [CrossRef] • Mughini, G. (2000). Eucalyptus Breeding in Italy. Proceedings of the
• Evans, J. (1992). Plantation forestry in the tropics (2nd ed). USA: international “Conference Eucalyptus in the Mediterranean basin: Per-
Oxford Science Publication. spectives and new utilization”. October 15–19, Taormina-Crotone,
• FRA (2015). Global forest resources assessment 2015, national Italy.
report [In French]. Tunisia, 57 p. • Naidoo, S., Ahmed, F., Pammenter, N. W., & Zboňák, A. (2010). A
• Fernández-Sólis, D., Berrocal, A., & Moya, R. (2018). Heartwood for- technique to identify annual growth rings in Eucalyptus grandis
mation and prediction of heartwood parameters in Tectona gran- using annual measurements of diameter at breast height and
dis L.f. trees growing in forest plantations in Costa Rica. Bois et Forêts gamma ray densitometry. Southern Forests, 72(3–4), 191–200.
des Tropiques, 335, 25–37. [CrossRef] Retrieved from https://www.tandfonline.com/doi/abs/10.2989/2
• Fétéké, F., Perin, J., Fayolle, A., Dainou, K., Bourland, N., Kouadio, Y. 0702620.2010.547271. [CrossRef]
L., Moneye, S. J. J., Bekono, C. C., Liboum, M. Y., Doucet, J. L., & • Pima N.E., Chamshama, S.A.O., Iddi, S., & Maguzu, J. (2016). Growth
Lejeune, P. (2015). Modelling growth in four species to improve performance of eucalypt clones in Tanzania. Environment and Ecol-
forest management in Cameroon [In French]. Bois et forêts des ogy Research, 4(3), 146–154. [CrossRef]
tropiques, 325(3), 5–20. Retrieved from http://bft.cirad.fr/cd/BF • Peng, C. H., Zhang, L., & Liu, J. (2001). Developing and validating
T_325_5-20.pdf nonlinear height-diameter models for major tree species of Ontar-
• FAO (2012). Food and agriculture organization of the United io’s boreal forests. Northern Journal of Applied Forestry, 18(3), 87–94.
Nations, forest genetic resources in Tunisia, project tcp/rab/3303- [CrossRef]
baby 2, Annual report, [In Turkish], State of Genetic Resources For- • Pienaar, L. V., & Turnbull, K. J. (1973). The Chapman-Richards gener-
estry in North Africa. alization of Von Bertalanffy’s growth model for basal area growth
15Mhamdi et al. Growth and Productivity Modeling of Eucalyptus
Forestist 2021: XX(XX): 1-16
and yield in even-aged stands. Forest Science, 19(1), 2–22. Des Tropiques, 309, 77–89. Retrieved from http://bft.cirad.fr/cd/BF
[CrossRef] T_309_77-89.pdf
• Pinto, L. F. G., Bernardes, M. S., Stape, J. L., & Pereira, A. R. (2005). • Santos, A. Td, Mattos, P. Pd, Braz, E. M., & Rosot, N. C. (2012). Estimat-
Growth yield and system performance simulation of a Sugarcane- ing wood volume in plantation of Ocotea porosa [In Portuguese].
Eucalyptus interface in a sub-tropical region of Brazil. Agriculture, Pesquisa Florestal Brasileira, 32(69), 13–22. [CrossRef]
Ecosystems and Environment, 105(1–2), 77–86. [CrossRef] • SAS (2004). SAS Institute Version 9.0. Cary, NC: SAS Institute, Inc.
• Pommerening, A., & Muszta, A. (2015). Methods of modelling rela- • Shater, Z., De-Miguel, S., Kraid, B., Pukkala, T., & Palahí, M. (2011). A
tive growth rate. Forest Ecosystems, 2(1), 1–9. [CrossRef] growth and yield model for even-aged Pinus brutia Ten. stands in
• Proces, P., Dubiez, E., Bisiaux, F., Péroches, A., & Fayolle, A. (2017). Syria. Annals of Forest Science, 68(1), 149–157. [CrossRef]
Acacia auriculiformis production in the Mampu agroforestry zone • Soares, P., & Tomé, M. (2002). Height: Diameter equation for first
on the Batéké Plateau, Democratic Republic of Congo [In French]. rotation eucalypt plantation in Portugal. Forest Ecology and Man-
Bois et Forêts des Tropiques, 334, 23–36. [CrossRef] agement, 166(1–3), 99–109. [CrossRef]
• Pyo, J. (2017). Developing the site index equation using a general- • Sweda, T., & Koide, T. (1981). Applicability of growth equations to
ized algebraic difference approach for Pinus densiflora in central the growth of trees in stem radius. Journal of Japanese Forestry
region, Korea. Forest Science and Technology, 13(2), 87–91. Society, 63, 113–124. [CrossRef]
[CrossRef] • Wamalwa, L., Chagala-Odera, E., Oeba, V., & Oballa, P. O. (2007).
• Saadaoui, E., Ben Yahia, K., Dhahri, S., Ben Jamaa, M. L., & Khouja, M. Adaptability of four-year old Eucalyptus species and clones in
L. (2017). An overview of adaptative responses to drought stress Kenya. Discovery and Innovation, 19(4), 326–334.
in Eucalyptus spp. Forestry Studies, 67(1), 86–96. [CrossRef] • Westfall, J. A., & McRoberts, R. E. (2017). An assessment of uncer-
• Saïdi, S., Gazull, L., Fallot, A., & Burnod, P. (2011). Mapping land suit- tainty in volume estimates for stands reconstructed from tree
ability at worldwide scale for fuelwood plantations. Bois et Forêts stump information. Forestry: An International Journal of Forest
Research, 90(3), 404–412. [CrossRef]
16You can also read