RETAIL MARKET ANALYSIS - Chapel Hill, North Carolina July 2011
←
→
Page content transcription
If your browser does not render page correctly, please read the page content below
RETAIL MARKET ANALYSIS
On-demand reports and maps from Business Analyst Online. Order at www.esri.com/bao or call 800-447-9778

        Chapel Hill, North Carolina

        Part Two:             Existing Conditions, Local and Regional Trends and Strategic Considerations

        July 2011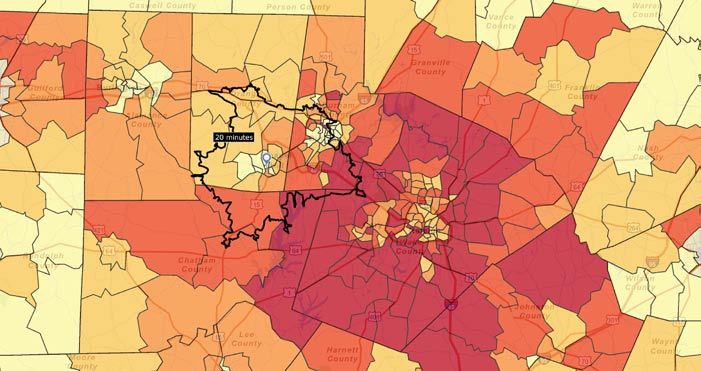
Town of Chapel Hill Retail Market Study

Prepared for The Town of Chapel Hill      TABLE OF CONTENTS

by                                        Glossary                         4

Development Concepts, Inc.                Section 1: Existing Conditions   6
1236 East 16th Street
Indianapolis, Indiana 46202               Section 2: Retail Trends         21

and                                       Section 3: Conclusions           30

Gentleman McCarty
405 Bent Tree Lane
Indianapolis, Indiana 46260

2
Town of Chapel Hill Retail Market Study

OVERVIEW
This Study examines the existing conditions and major           Key questions and issues that this Study aimed to address
trends related to commercial retail development, both           were:
within the Town of Chapel Hill and its environs, as well
as the larger Triangle region of Raleigh, Cary, Durham and      •   Verification of the findings from Nielson Claritas using
Chapel Hill. This analysis is intended to provide information       complimentary information and analysis;
to the Town of Chapel Hill for the purpose of crafting a
development strategy relative to future retail development.     •   A thorough inventory and analysis of Chapel Hill’s
                                                                    existing retail businesses and centers;
This Report, the second part of the Town’s Retail Market
Study initiative, is intended to assist Chapel Hill in          •   Examination of the regional demographic and retail
examining opportunities to expand its non-residential tax           trends surrounding Chapel Hill that have a direct
base. The first part was an analysis of the market within           influence on the Town’s capacity to add retail
the Town of Chapel Hill by Nielson Claritas in 2008.                development;

The Nielson Claritas study demonstrated a significant           •   Identification of market and trade areas for Chapel Hill
amount of retail “leakage” or dollars representing retail           and the best sub-markets within those areas for retail
demand that were being spent outside of the community.              growth and capture;
Together with the demand from employees, the Report
estimated strong opportunity to capture future retail           •   Identification of available (re)development sites within
development within the Town.                                        Chapel Hill and estimates of how much and what type
                                                                    of retail is appropriate for each site; and
The Town of Chapel Hill, U.S. Census, Bureau of Labor
Statistics, and ESRI Business Analyst were the primary          •   A discussion of the key issues for the Town to consider
sources of data for this Study. The analysis and discussion         as it crafts a strategy for retail development.
of this data reflects only the interpretation and opinion of
Development Concepts, Inc. and Gentlmen McCarty. Much
of the data provided in this report is meant to portray
retail demand as an order of magnatute, as opposed to
precise estimates of consumer expenditure and future retail
development. The consultant team cautions users of this
repor to consider this in making policy decisions. Given
the nature of this study, the consultant team attempted to
objectively offer the most probably and realistic forecasts
for retail demand.
This analysis was conducted by Development Concepts,
Inc. and Gentleman McCarty as independent parties,
are neither are agents of the City by virtue of this or any
subsequent study to be conducted on this matter.

                                                                                                                               3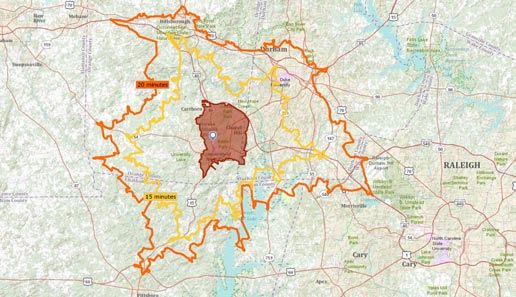
Town of Chapel Hill Retail Market Study

GLOSSARY                                                          Neighborhood Center - provides for the sale of convenience
                                                                  goods (foods, drugs, and sundries) and personal services
                                                                  (laundry and dry cleaning, barbering, shoe repair,
GEOGRAPHIC DEFINITIONS                                            etc.) for the day-to-day living needs of the immediate
                                                                  neighborhood. It is built around a supermarket as the
This Study refers to a number of different geographies for        principal tenant and typically contains a gross leaseable
analysis. They are described below:                               area of about 60,000 square feet. In practice, it may
                                                                  range in size from 30,000 to 100,000 square feet.
    Triangle Region - This is an informal name for the Raleigh-
    Durham-Cary Combined Metropolitan Statistical Area            Community Center - provides a wider range of soft lines
    (CMSA) as defined by the Office of Management and             (apparel for men, women and children) and hard lines
    Budget (OMB). The CMSA consists of Wake, Franklin,            (hardware and appliances). The community center
    Johnston, Durham, Orange, Person and Chatham                  makes merchandise available in a greater variety of sizes,
    Counties. The CMSA is a combination of the Raleigh-           styles, colors, and prices. Many centers are built around
    Cary Metropolitan Statistical Area (MSA) and the              a junior department store, variety store, super drugstore,
    Durham-Chapel Hill MSA, which did not exist during the        or discount department store as the major tenant, in
    2000 census.                                                  addition to a supermarket. Although a Community Center
                                                                  does not have a full-line department store, it may have
    Raleigh-Cary MSA - This Metropolitan Statistical Area         a strong speciality store or stores. Its typical size is
    (MSA) consists of Wake, Franklin and Johnston counties.       about 150,000 square feet of gross leasable area, but in
    Its two principal cities are Raleigh and Cary.                practice it may range from 100,000 to 500,000 or more
                                                                  square feet.
    Durham-Chapel Hill MSA - This MSA consists of Durham,
    Orange, Person, and Chatham Counties. The principal           Super Community Center - centers that fit the general
    cities are Durham and Chapel Hill.                            profile of a community center but contain more than
                                                                  250,000 square feet.
    Town of Chapel Hill - The Town of Chapel Hill is primarily
    located in Orange County, with a small section located in     Power Center - a type of super community center.
    Durham County. The 2009 American Community Survey             These anchors typically emphasize hard goods such as
    estimated the Town’s population to be 54,972.                 consumer electronics, sporting goods, office supplies,
                                                                  home furnishings, home improvement goods, bulk
TYPES OF RETAIL DEVELOPMENTS -                                    foods, drugs, health and beauty aids, toys and personal
(from the Urban Land Institute)                                   computer hardware / software. They tend to be narrowly
                                                                  focused but deeply merchandised “category killers”
    Convenience Center - provides for the sale of personal        together with the more broadly merchandised, price
    services and convenience goods similar to those of a          oriented warehouse clubs and discount department
    neighborhood center. It contains a minimum of three           stores. Anchors in power centers typically occupy 85
    stores, with a total gross leaseable area (GLA) of up         percent or more of the GLA.
    to 30,000 square feet. Instead of being anchored by a
    supermarket, a convenience center usually is anchored         Regional Center - provides general merchandise, apparel,
    by some other type of personal / convenience store such       furniture, and home furnishings in depth and variety, as
    as a minimarket.                                              well as a range of services and recreational facilities. It
                                                                  is built around one or two full-line department stores. Its
                                                                  typical size is about 500,000 square feet of gross leasable

4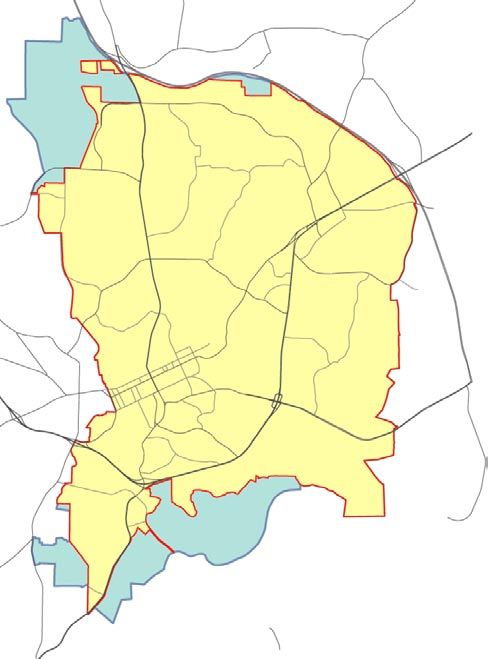
Town of Chapel Hill Retail Market Study
Triangle Metropolitan Region
Source: Office of Management and Budget, U.S. Census
PERSON Raleigh-Cary Metropolitan Statistical Area (MSA)
Durham-Chapel Hill Metropolitan Statistical Area (MSA)
Town of Chapel Hill
City of Durham
Town of Cary
ORANGE DURHAM City of Raleigh
FRANKLIN
65
WAKE
465
¯
70
CHATHAM Chapel Hill Retail Sites
MILLHOUSE
April, 2011
1 JOHNSTON
KS RD 2
EUBAN
WEAVER DAIRY
74 MT
4 MO
20 3 RI
AH
5
KI N
465
G
STO
ROG
N
ERS
6
TAIN
HOMESTEAD 01
55
MARTIN
MOU N
7
SEAWELL SCH
1
18 US
SA
17
PINEY
GE
D
HA M R
LUTHE
UR
Chapel Hill OLD D
POPE
area. In practice, it may range from 250,000 to more Lifestyle Center - a shopping center or mixed-use
RD
15
ST
R
I 40
than 900,000 square feet. The regional center provides
ON
ESTES 14 commercial development that combines the traditional
K ING J
N
GI
I
KL
LE
services typical of a business district yet not as extensive 13 retail EPHESUS
functionsCHofRDa shopping mall but with leisure
AN
16
FR
as those of the super regional center. amenities oriented towards upscale consumers.
R B LV D
12
RST
Super Regional Center - offers extensive variety in general
U
Mixed Use - vertically stacked uses in a single building,
AD
PINEH
E
ST 19and home furnishings,
LV D
merchandise, apparel, furniture,
UM typically residential units or office space above ground
CLELAND
FO RDHAM B
as well as a variety of services and recreational facilities. floor space dedicated to either retail, services, dining or
HI
LL
EE
It is built around three or more full-line department
SB
MA I
N
A RY offices. G
TR
OR
N
EM I
RA
RN
stores. They typical size RofOSa8super regional center is
O
BU
UG
LE
N Retail Sites
I GH
H
GREENSBORO
O RALE
about 1,000,000 square feetCof ER
AMGLA. H
In practice, theIGH RD
1. Eubanks Road
SO U
T
21
size ranges from about 500,000 to more than 1,500,000 2. Chapel Hill North
22 3. Timberlyne Shopping
square feet. 23
A
FAR
L L
MI
BI
ITT
9 MA 4. Small center on
M
4
R
RR NN NC 5
LU
I NG
ME IN Weaver Dairy Road
CO
TON
FO G 24 5. Charterwood
RD MA S O
N FAR
HA M 6. Bridgepoint
M
BL BA 7. Homestead at MLK 5
VD RB
CULB EE
CH
8. Chapel Hill Downtown
RET H
AP9. Meadowmont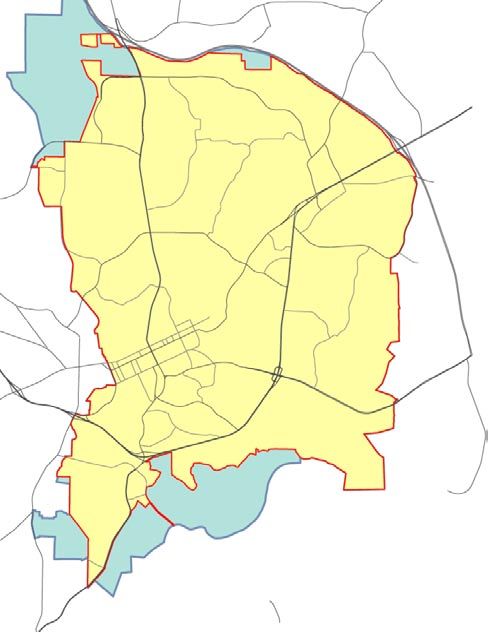
Town of Chapel Hill Retail Market Study

TYPES OF RETAIL GEOGRAPHIES
                                                                  SECTION 1:
The previous section described specific types of retail
developments, but many retail / commercial areas have
                                                                  Existing Conditions
multiple types of developments that create a whole that is        1.1 REGIONAL RETAIL LANDSCAPE
more than the sum of its parts. For example, a cluster of
community or power center developments could, in total,           Befitting a metropolitan area of its size and growth rate,
establish a geography that has a “regional” draw. Similarly,      the Triangle Region has a number of major shopping areas,
a geography with a regional center could be combined              including several super regional shopping centers. Typical
with one or more developments of similar scale to create a        of regional development trends of its era, most major and
“super regional” trade area.                                      minor shopping centers are built with automobile access
                                                                  as a primary concern, though there are several pedestrian
    Downtown / Central Business District - a concentration        oriented dining and entertainment destinations, mostly in
    of retail businesses in many, sometimes hundreds, of          historic downtown settings. Several of the existing major
    individual buildings located in a community’s historic        shopping centers were built within the past 10 years, or
    central business district. Overall size and business type     have been expanded or renovated to stay current with the
    / mix varies widely between communities, but they             marketplace.
    usually include a high concentration of dining and drinking
    establishments, as well as convenience oriented retail.       Raleigh-Cary Major Shopping Centers / Destinations
    Often does not include traditional “anchor” retail, instead
    having a concentration of smaller scale retail businesses     Crabtree Valley Mall - the largest enclosed shopping mall in
    in storefront settings. May have a local or regional          the Triangle area at 1.3 million square feet and opened in
    draw, depending on community and retail mix. Larger           1972. It has 220 stores anchored by Hudson Belk, Sears
    Downtowns may include shopping developments like              and Macy’s. They expanded in the 1990s to combat
    community centers or regional centers.                        competition from an expanded Cary Town Center.

    Neighborhood Commercial District - Similar to a Downtown      Cary Town Center - Opened in 1979 as the Cary Village
    / Central Business District, but of a smaller scale and       Mall, this regional shopping mall was expanded in 1991
    oriented almost exclusively to customers from immediate       to encompass 1.1 million square feet. Managed by CBL &
    or nearby neighborhoods. May include a convenience or         Associates, it has 130 stores including anchors Macy’s,
    neighborhood center(s).                                       Hudson Belk, Dillard’s, JC Penney, and Sears. Nearby are
                                                                  several other shopping centers, including Crossroads Plaza
    New Urban Commercial District - A concentration of small      with 640,000 square feet and 70 stores, and the 315,000
    scale retailers in new master planned developments.           square foot Centrum at Crossroads development. Between
    Designed to mimic downtown or neighborhood                    Cary Town Boulevard and Jones Franklin Road, there is
    commercial districts. Emphasis on convenience goods,          approximately 2.5 million square feet of regionally serving
    services and dining, with some grocery and other daily        retail.
    goods.
                                                                  North Hills - originally opened in 1967 as the North Hills
    Super Regional Area - A geography that has a “super”          Mall and was redeveloped into a mixed use lifestyle center
    regional trade area (covering 10-50+ miles) that has at       that includes 100 stores and 730,000 square feet of retail
    its core either a regional or super regional center. Mid      anchored by REI and Target, a 14 screen Regal Movie
    sized metropolitan areas typically have only one or two of    Theater, 120,000 square feet of office, and a 223 room
    these geographies.

6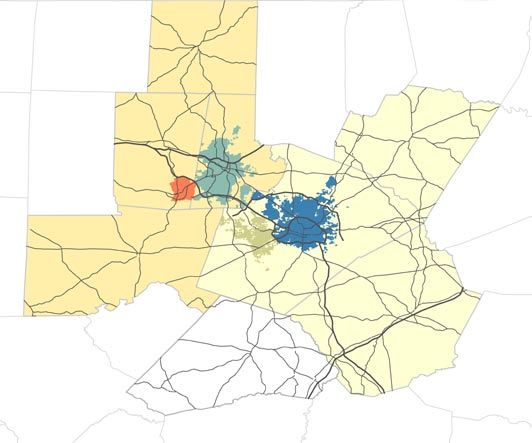
Town of Chapel Hill Retail Market Study

Figure 1.1 Regional Shopping Destinations - Triangle Region
Source: DCI Research

                                          Northgate

                                    *
                                           Downtown
                                           Durham

                               South Square
                                                                                      Triangle Town Center

      *
            Downtown
            Chapel Hill
                                    Streets at Southpointe

                                                                                     Crabtree Valley Mall
                                                                                                         North Hills

                                                                                        *
                                                                                               Downtown
                                                                                               Raleigh

                                                                          Cary Town Center

Renaissance Hotel. Across the street is a 275,000 square        Durham-Chapel Hill Major Shopping Centers
foot Captrust Office Tower and a development called The
Lassiter at North Hills that includes a Harris Teeter Grocery   South Square Mall - Opened in 1975 and closed in 2002
Store and several hundred apartments.                           due to competition from the newly opened Streets at
                                                                Southpoint. Originally it had Hudson Belk, JC Penney, and
Triangle Town Center - Opened in 2002, with anchors Hudson      Montgomery Ward as anchor tenants and 90 stores. Razed
Belk, Sears, Dillard’s, Macy’s, Barnes and Noble, and Saks      to make way for a power center that stands in its place
Fifth Avenue. 165 stores with 1.3 million square feet.          today, anchored by a SuperTarget and Sam’s Club.
Includes an primary enclosed mall component as well as
an open air “lifestyle” component. Managed and owned by         Northgate - Opened in 1974, anchored by Macy’s, Sears,
CBL & Associates.                                               and Northgate Stadium 10. Over 100 stores with 900,000
                                                                square feet. Originally one of two regional malls serving the
Downtown Raleigh - Downtown Raleigh is a major dining,          Durham-Chapel Hill Metropolitan Area (along with South
shopping, and entertainment destination with 80 retail          Square).
businesses, 120 dining establishments, 59 bars and
clubs, 130 service businesses, and 56 art and cultural
establishments.
                                                                                                                           7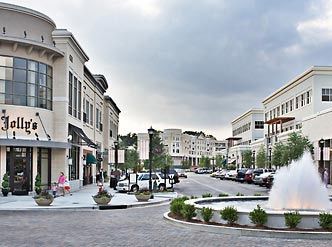
Town of Chapel Hill Retail Market Study

Triangle Town Center, located in Northern Raleigh, is one of the newest and higher end shopping centers in the Triangle. It has the
Region’s only Saks Fifth Avenue, with both inside and outdoor retail components.

North Hills, a lifestyle center that replaced an enclosed shopping   The South Square development, anchored by a Super Target, that
center.                                                              replaced an enclosed mall.

The Streets at Southpoint, a super regional center positioned to capture markets from both Durham-Chapel Hill and Raleigh-Cary.

8
Town of Chapel Hill Retail Market Study

Streets at Southpoint - Opened in 2002, it is managed          a closer geography on a weekly or semi-weekly basis.
and owned by General Growth Properties. It includes a          The third includes “daily goods” centers that offer dining,
central two story enclosed mall, and an open air lifestyle     services, and convenience retail to customers within an
component with a total of 140+ stores and 1.3 million          immediate range, either neighborhood residents, office
square feet. Anchors include Nordstrom, Macy’s, Hudson         workers, college students, or all three.
Belk, JC Penney and Sears. It also includes some upscale
retailers that have only one store in the Triangle area,       Chapel Hill households have two primary areas for
including Apple, Restoration Hardware, and Bose. The only      regional retail. The first is the Streets at Southpoint. This
super-regional mall in the Durham-Chapel Hill Metropolitan     mall offers a high concentration of boutique, niche, and
Area.                                                          “category-killer” retail offerings, some of which are unique
                                                               within the entire region, such as Urban Outfitters, Crate and
Downtown Durham - Downtown Durham has over 40 dining           Barrel, and the Apple Store. The second area is the 15-501
establishments and several dozen retailers. With Brightleaf    Corridor, anchored at one end by Eastgate and University
Square and American Tobacco complexes, as well as              Mall shopping centers in Chapel Hill, and South Square on
a recently built Performing Arts Center, it is a regional      the other side in Durham. This Corridor, which also includes
destination for dining and entertainment.                      retail centers like New Hope Commons and Patterson Place,
                                                               contains a large proportion of major retailer dedicated to
Downtown Chapel Hill - Downtown Chapel Hill is estimated       regular goods, such as Target, Dick’s, Lowes and Home
to have several hundred retail and dining establishments,      Depot, Kohl’s, Dillard’s, etc.
not including Downtown Carrboro, which has dozens
more. Located adjacent to the University of North Carolina,    Despite this concentration of “regionally” serving retail,
several restaurants and establishments draw a regional         Chapel Hill has no regional shopping center developments.
customer base.                                                 The largest single retail development is University Mall,
                                                               with approximately 360,000 square feet of gross leasable
1.2 CHAPEL HILL RETAIL                                         area (GLA). University Mall is a relatively dated mall with
                                                               several anchors, including Dillard’s, Harris Teeter, and
Existing Retail and Competition                                Southern Seasons - a speciality food store. It anchors the
                                                               largest concentration of retail within the intersection of
The Town of Chapel Hill has a unique and diverse blend of      Fordham Boulevard, Elliot Road and Ephesus Church Road,
retail offerings. This includes a traditional “main street’    but only with the combinations of four other retail centers
retail environment adjacent to the University of North         does the area act as a regionally serving retail geography
Carolina, traditional automobile oriented shopping centers,    for Chapel Hill and its environs. The area described above
and contemporary mixed use developments that place             and illustrated in Figure 1.3 includes three of the largest
offices and residences above retail shops.                     retail centers in Chapel Hill (University Mall, Eastgate
                                                               Shopping Center, and Ram’s Plaza) as well as additional
Retail developments and geographies can be generally           smaller scale neighborhood strip centers. It totals roughly
broken down into three categories based on how                 800,000 square feet of retail or 55-58% of all retail square
consumers tend to shop. The first are regional shopping        footage in Chapel Hill, not including Downtown Chapel Hill.
centers, which draw customers on a semi-regular basis for
leisure goods, such as electronics, clothing, sporting goods   The next largest concentrations of retail in Chapel Hill is
etc. As noted in previous discussions, these areas draw        Chapel Hill North / Timberlyne, a regular / daily goods area
large amounts of customers over a wide trade area. The         serving the northern portion of Chapel Hill and southern
second are “regular goods” centers, built around grocery       Orange County, Glenwood Square / Glen Lennox / East 54,
stores, pharmacies, or both that serve customers from          which is a combines regular and daily goods geography

                                                                                                                              9
Town of Chapel Hill Retail Market Study

Figure 1.2 Major Retail Centers Near Chapel Hill
Source: DCI Research, ESRI Business Analyst

Site / Center                 GSF          Category         Year   Key Tenants
15 / 505 Corridor / South Square
New Hope Commons                408,292    Community        1995   Walmart, Dicks, Best Buy
Patterson Place                 517,321    Community        2004   Home Depot, Kohl’s Kroger
South Square                    432,000    Community        2005   SuperTarget, Sam’s Club
Westgate Plaza                  202,502    Community        1987   Toys R Us
Other Misc.                    150,000+    n/a              n/a    Kmart, CVS, TJ Maxx
Southpoint
The Streets at Southpoint     1,326,000    Super Regional   2002   Macy’s, Hudson Belk, Nordstrom
Renaissance Village             337,052    Power Center     n/a    SuperTarget, hhgregg, Michaels
Renaissance Center              340,703    Power Center     2003   Best Buy, Babies R Us
Other Misc.                   200,000+     n/a              n/a    Kroger, Harris Teeter
Northgate
Northgate Mall                  900,000 Regional            1974   Sears, Macy’s
Other
Woodcroft Shopping Center        89,833    Neighborhood     1974   Sears, Macy’s
Hope Valley Commons             103,435    Neighborhood     n/a    Harris Teeter
Carrboro Plaza                       n/a   Neighborhood     n/a    Food Lion
Chatham Crossing                 96,000    Neighborhood     n/a    Lowes Foods

10
Town of Chapel Hill Retail Market Study

                                                                                                   Northgate      8

                                                                                                       Downtown
                                                                                                        Durham

                                                                         3, 4
                                                                                          15 / 501
                                                        1
                                                                                          South Square
                                                              2

                                Chapel HIll

       *
                                Retail Sites
                                in Figure
                                1.3                                      9,10
  11

                                                                                5, 6, 7      Southpoint

                                                                                            Retail Sites
                                                                                            1. New Hope Commons
                                                                                            2. Patterson Place
                                                                                            3. South Square
                                                                                            4. Westgate
       12                                                                                   5. Streets at Southpoint
                                                                                            6. Renaissance Village
                                                                                            7. Renaissance Center
                                                                                            8. Northgate Mall
                                                                                            9. Woodcroft
                                                                                            10. Hope Valley Commons
           Super Regional                      Community                                    11. Carrboro Plaza
                                                                                            12. Chatham Crossing
                                               Downtown / Urban Retail
          Regional                             Neighborhood
                                                            Chapel Hill Retail Sites                                   ¯
       MILLHOUSE

                                               Chapel Hill Town Boundaries
                                                                         April, 2011
                   1                                                                                                   11
     KS RD                  2
EUBAN
                                                                                            MT
Town of Chapel Hill Retail Market Study
Figure 1.3 Existing Town of Chapel Hill Retail Centers*
Source: Town of Chapel Hill, ESRI Business Analyst and DCI Analysis
Site / Center GSF** Category Year Key Tenants
Chapel Hill North 95,820 Neighborhood Harris Teeter
Timberlyne Shopping Center 112,925 Neighborhood Chelsea Theater
Weaver Dairy Road 14,500 Convenience
Homestead at MLK 7,000 Convenience
Downtown Chapel Hill 270,000 Downtown
Meadowmont 96,740 New Urban
Southern Village 62,500 New Urban
Formerly regional - now
University Mall 400,000 1973**** Dillard’s, Southern Season, Harris Teeter
Super Community
Cluster of Convenience /
Elliot Road 194,000 Whole Foods, Staples
Neighborhood Centers
Eastgate 175,600 Community 1958**** Trader Joe’s, Starbucks, Steinmart
Ram’s Plaza 127,400 Neighborhood Food Lion
Lowes / Borders 147,000 Power Center Lowes, Borders
Midtown Plaza 24,000 Convenience
Glen Lennox 37,000 Convenience
Glenwood Square 52,000 Neighborhood Fresh Market
East 54 54,000 Neighborhood
Hillmont 23,500 Convenience
Other Retail 234,000 Other Misc. or unaccounted for in above estimates
Estimated Square Footage (not including Downtown) 1,624,000
Estimated Square Footage (including Downtown Estimates) 2,128,000
Estimated Gross Leasage Square Footage 1,915,0002 - 2,021,000
* Includes Non Automotive and Internet Related Retailers Included in NAICS categories located in Figure 1.4. Does not include certain
service type businesses, like Banks.
** Estimated using GIS, does not include Gross Leasable Square Footage
*** Estimated using supply data from ESRI Business Analyst
**** Center has been renovated since opening
12Town of Chapel Hill Retail Market Study
Chapel Hill Retail Sites
April 2011
1
WEAVER DAIRY
2 3
HOMESTEAD
501
4 15
US
SA
12
MART
GE
Chapel Hill OLD DURHAM RD
IN LUT
RD
11 N
HER K
IO
ESTES ST 10
LE
G
IN
KL
9 EPHESUS CHURCH
ING JR
AN
FR
8
BLVD
13
VD
FORDHAM BL
RAL
EIG
Y
AR
EM
H
S
RO 5 RAL
EIGH
R ON RD
ME 14
CA
15 16
IA
MB
HA 6 54 Retail Sites
NC
LU
NN
CO
IN
FO G 17 1. Chapel Hill North
RDH 2. Timberlyne Shopping
AM
BL 3. Weaver Dairy Road
VD
4. Homestead at MLK
5. Downtown Chapel Hill
6. Meadowmont
7. Southern Village
7 8. University Mall
9. Elliot Road
01
10. Eastgate
5
15
11. Ram’s Plaza
US
12. Lowes / Borders
# Retail Sites 13. Midtown Plaza
Chapel Hill Town Limits 14. Glen Lennox
Chapel Hill Planning Area 15. Glenwood Square
16. East 54
Urban Service Boundary 17. Hillmont
13Town of Chapel Hill Retail Market Study
View of Southern Season, in University Mall The Food Lion anchoring Ram’s Plaza
East 54, a mixed use commercial / residential development with Meadowmont commercial / retail center
ground floor retail facing Route 54.
Downtown Chapel Hill Whole Foods, located in a small neighborhood center on Elliott
Road near Eastgate Shopping Center
14Town of Chapel Hill Retail Market Study
with three different neighborhood centers, and Downtown
Chapel Hill. 1.3 RETAIL GAP ANALYSIS
Downtown Chapel Hill is primarily consists of dining and One of the best methods to understand both local and
drinking establishments, though it does have a number regional retail demand is through a retail gap analysis.
of daily goods retailers like Walgreens to serve students This method compares a geography’s retail “supply” (i.e
from the University of North Carolina. Using retail gap data estimated aggregate retail sales) with the total “demand”
from ESRI (illustrated in the next section) approximately from households living in that area, calculated through
40-45% of all food and drink sales are from within the core a combination of income and consumer patterns. The
Downtown area. The largest single retail development resulting number is the “gap” which is used to determine
in Downtown Chapel Hill is University Square, which has the opportunity for retail development. There are several
16 retail and service businesses and 3 restaurants. As different sources for this data - this Study uses data from
a cluster of businesses, Downtown is the second largest ESRI Business Analyst, which is turn uses data from
retail center within Chapel Hill, though it undoubtedly draws InfoUSA. There are many nuances to the retail gap data,
many more customers than University Mall. and therefore it is best to understand them in terms of an
order of magnitude as opposed to precise estimates.
Recent Retail Development
Figure 1.4 illustrates the retail gap analysis for the Town
It is important to note that with the exception of the of Chapel Hill. The data is broken down by employment
University Mall / Eastgate Area, Chapel Hill residents sub-sectors using NAICS (the North American Industrial
must travel to Durham for all other regional / leisure based Classification System). As an example, of how a retail gap
retail offerings. This includes several large and common analysis works, refer to NAICS 4422 - Home Furnishing
retail destinations such as Wal-Mart, Home Depot, and Stores. The demand, or retail potential, for this sub-sector
Target. There have been virtually no major retail centers is approximately $7.2 million, meaning that the households
built within the boundaries of Chapel Hill for several of Chapel Hill would generally be expected to spend that
decades. Instead, most of the retail activity has been is amount in home furnishings within a given year. Existing
smaller scale developments like Southern Village and East home furnishing sales within the Town are estimated to be
54. The most recent retail activity concerning medium to only $1.4 million, resulting in retail “leakage” of $5.8 million.
large scale centers involves only the construction of the This is termed “leakage” because Chapel Hill households
Lowes / Borders Plaza off of 15/501, and the renovation would be expected to spend this money somewhere, and
of the Eastgate Shopping Center. University Mall, the if options are not found in existing retail within Town limits,
Town’s largest retail center, has been through some minor then those dollars are determined to “leak” to retail centers
improvements since its most recent purchase. outside of Chapel Hill - most likelySouth Square or Streets
at Southpoint. Leakage is one of the primary indications of
Meanwhile, much of the regional retail that serves the opportunity for retail growth, since it illustrates the potential
Chapel Hill market has been constructed outside of the to “capture” anticipated spending into new retail centers.
community, sometimes immediately adjacent to the Town’s
boundary. Since 2000, the super regional geography of Alternatively, a category like Full-Service Restaurants
Southpoint has added three major shopping centers with (NAICS 7221) has a higher supply than demand, resulting
over 2 million square feet. Just across I-40 from Chapel in a negative retail gap. This shows that local restaurants
Hill, Patterson Place and New Hope Commons represent attract more sales than will be spent by Chapel Hill
another 900,000+ square feet of retail. residents, indicating that they draw in customers from
outside of the Town for customers. A negative retail gap,
or “surplus” indicates a relatively competitive local retail
152010 Households 19,081
2010 Median Disposable Income $43,313
2010 Per Capita Income $32,326
Town of Industry
Chapel Summary
Hill Retail Market Study Demand Supply Leakage/Surplus
(Retail Potential) (Retail Sales) Retail Gap Factor
Total Retail Trade and Food & Drink (NAICS 44-45, 722) $580,791,491 $520,593,055 $60,198,436 5.5
Figure 1.4
Total Retail Gap(NAICS
Retail Trade Analysis
44-45)- Town of Chapel Hill $489,626,512 $392,206,754 $97,419,758 11.0
Source: ESRI Business
Total Food Analyst
& Drink (NAICS 722) $91,164,979 $128,386,301 $-37,221,322 -17.0
Demand Supply Leakage/Surplus
Industry Group (Retail Potential) (Retail Sales) Retail Gap Factor
Motor Vehicle & Parts Dealers (NAICS 441) $113,274,253 $128,931,943 $-15,657,690 -6.5
Automobile Dealers (NAICS 4411) $99,859,723 $127,032,239 $-27,172,516 -12.0
Other Motor Vehicle Dealers (NAICS 4412) $6,794,972 $0 $6,794,972 100.0
Auto Parts, Accessories, and Tire Stores (NAICS 4413) $6,619,558 $1,899,704 $4,719,854 55.4
Furniture & Home Furnishings Stores (NAICS 442) $14,105,380 $4,388,557 $9,716,823 52.5
Furniture Stores (NAICS 4421) $6,885,383 $2,993,801 $3,891,582 39.4
Home Furnishings Stores (NAICS 4422) $7,219,997 $1,394,756 $5,825,241 67.6
Electronics & Appliance Stores (NAICS 443/NAICS 4431) $15,209,053 $6,809,031 $8,400,022 38.2
Bldg Materials, Garden Equip. & Supply Stores (NAICS 444) $21,142,225 $11,036,074 $10,106,151 31.4
Building Material and Supplies Dealers (NAICS 4441) $18,090,359 $8,914,596 $9,175,763 34.0
Lawn and Garden Equipment and Supplies Stores (NAICS 4442) $3,051,866 $2,121,478 $930,388 18.0
Food & Beverage Stores (NAICS 445) $112,484,523 $124,417,985 $-11,933,462 -5.0
Grocery Stores (NAICS 4451) $106,663,713 $115,707,056 $-9,043,343 -4.1
Specialty Food Stores (NAICS 4452) $903,809 $795,497 $108,312 6.4
Beer, Wine, and Liquor Stores (NAICS 4453) $4,917,001 $7,915,432 $-2,998,431 -23.4
Retail MarketPlace
Retail MarketPlac
Health & Personal Care Stores (NAICS 446/NAICS 4461) $17,798,591 $13,614,058 $4,184,533 13.3
GasolineHill
Chapel Stations
Town, (NAICS
NC_19 447/4471) $98,521,767 $42,641,513 $55,880,254 39.6
Chapel Hill Town, NC_19
Chapel Hill town, NC (3711800)
Chapel Hill town, NC (3711800)
Geography: Place
Geography:
Clothing and Clothing Place
Accessories Stores (NAICS 448) $25,497,490 Retail
RetailMarketPlace
$15,006,751 $10,490,739 MarketPlace 25.9
Clothing Stores (NAICS 4481) Demand
$19,799,504 Supply
$11,341,580 $8,457,924 Leakage/Surplus 27.2
Demand Supply Leakage/Surplus
Industry
Shoe Group
Stores (NAICS (Retail Potential) (Retail Sales) Retail Gap Factor
Industry Group 4482) (Retail$1,908,489
Potential) $954,070
(Retail Sales) $954,419
Retail Gap 33.3
Factor
General
Jewelry,Merchandise
Luggage, Stores
and (NAICS
Leather Goods452)
Stores (NAICS 4483) $27,873,307
$3,789,497 $6,488,055
$2,711,101 $21,385,252
$1,078,396 62.2
16.6
General Merchandise Stores (NAICS 452) $27,873,307 $6,488,055 $21,385,252 62.2
Department
Chapel Hill Stores
Town, Excluding Leased Depts.(NAICS 4521)
NC_19 $18,170,115 $5,195,859 $12,974,256 55.5
Department StoresNC_19
Chapel Hill Town, Excluding Leased Depts.(NAICS 4521) $18,170,115 $5,195,859 $12,974,256 55.5
Other Hill
Chapel General
town, Merchandise Stores (NAICS 4529) $9,703,192 $1,292,196 $8,410,996 76.5
Other
Chapel HillNC
General (3711800)
Merchandise
town, Stores (NAICS 4529)
NC (3711800) $9,703,192 $1,292,196 $8,410,996 76.5
Sporting Goods,
Geography: Place Hobby, Book, and Music Stores (NAICS 451) $15,712,159 $11,092,444 $4,619,715 17.2
Geography: Place
Sporting Goods/Hobby/Musical Instrument Stores (NAICS 4511) $10,093,347 $3,118,968 $6,974,379 52.8
Miscellaneous
Book, Store
Periodical, Retailers
and Music (NAICS
Stores 453)
(NAICS
Miscellaneous Store Retailers (NAICS 453) 4512) Demand
$10,215,808
Demand
$5,618,812
$10,215,808 Supply
$17,462,236
Supply
$7,973,476
$17,462,236 $-7,246,428
$-2,354,664
$-7,246,428 Leakage/Surplus -26.2
Leakage/Surplus-17.3
-26.2
Industry
Florists Group
(NAICS
Industry
Florists 4531)4531)
Group
(NAICS (Retail Potential)
(Retail $924,889(Retail
$924,889
Potential) Sales)
(Retail Sales) Retail
$797,717
$797,717 Gap
$127,172
Retail Gap
$127,172 Factor
7.47.4
Factor
General Merchandise
OfficeOffice
Supplies,
General Stores
Stationery,
Merchandise
Supplies, (NAICS
and Gift
Stores
Stationery, 452)
Stores
(NAICS
and (NAICS
452)
Gift Stores 4532)
(NAICS 4532) $27,873,307
$6,315,013
$27,873,307 $6,488,055
$6,488,055 $21,385,252
$6,315,013 $13,920,112
$13,920,112 $-7,605,099
$21,385,252
$-7,605,099 62.2
-37.6
62.2
-37.6
Used UsedDepartment
Department Stores
Merchandise
MerchandiseStores
Excluding
Stores Excluding
Leased
(NAICS
Stores Leased
4533)
(NAICS 4533) Depts.(NAICS
Depts.(NAICS 4521) 4521) $18,170,115
$18,170,115
$1,318,562
$1,318,562 $5,195,859
$5,195,859
$636,770
$636,770 $12,974,256
$12,974,256
$681,792
$681,792 55.5
55.5
34.9
34.9
Data Note: Supply (retail sales) estimates sales to consumers by establishments. Sales to businesses are excluded. Demand (retail potential) estimates the expecte
byOther Other
General General
Miscellaneous Merchandise
Merchandise
Store Stores
RetailersStores
(NAICS
(NAICS(NAICS
4539)4529)
4529) $9,703,192
estimates are in current $9,703,192
$1,657,344 $1,292,196
$1,292,196
$2,107,637 $8,410,996
$8,410,996
$-450,293 76.5Th
76.5
-12.0
Other
consumers atMiscellaneous
retail Store
establishments. Retailers
Supply and(NAICS
demand 4539) $1,657,344
dollars. $2,107,637
The Leakage/Surplus Factor presents$-450,293 -12.0
a snapshot of retail opportunity.
of the relationship between supply and demand that ranges from +100 (total leakage) to -100 (total surplus). A positive value represents 'leakage' of retail opportu
trade area. A negative value represents a surplus of retail sales, a market where customers are drawn in from outside the trade area. The Retail Gap represent
between Retail Potential and
Miscellaneous Retail
Store Sales.(NAICS
Retailers Esri uses453)
the North American Industry Classification System (NAICS)
$10,215,808 to classify $-7,246,428
$17,462,236 businesses by their primary type of ec
-26.2
Miscellaneous
Nonstore
Retail Nonstore Store
Retailers Retailers
(NAICS
Retailers
establishments are (NAICS
classified(NAICS
454) 454)
into 453) groups in the Retail Trade sector,
27 industry $10,215,808
$17,791,956
as$17,791,956 $17,462,236
groups within $-7,246,428
$10,318,107
$10,318,107
well as four industry $7,473,849
the $7,473,849
Food -26.2
26.6
26.6
Services & Drinking Establishme
Florists Florists
(NAICS
Electronic (NAICS
4531)and4531)
Shopping Mail-Order Houses (NAICS 4541) $924,889
$924,889
$16,264,584 $797,717
$797,717 $127,172
$127,172 7.4
7.4
Sources:Electronic
Esri Shopping and Mail-Order Houses (NAICS 4541)
and Supplies,
Infogroup $16,264,584 $7,353,453
$7,353,453 $8,911,131
$8,911,131 37.737.7
Office Stationery, and Gift Stores (NAICS 4532) $6,315,013 $13,920,112 $-7,605,099 -37.6
Office
VendingSupplies,
Machine
Vending Stationery,
Operators
Machine and Gift
(NAICS
Operators Stores (NAICS 4532)
4542)4542)
(NAICS $6,315,013
$1,038,879 $13,920,112
$1,038,879 $0 $0 $-7,605,099
$1,038,879
$1,038,879 -37.6
100.0
100.0
Used Merchandise Stores (NAICS 4533) $1,318,562 $636,770 $681,792 34.9
Used
DirectMerchandise
Selling
Direct Selling Stores (NAICS
Establishments 4533)
(NAICS
Establishments 4543)4543)
(NAICS $1,318,562
$488,493 $636,770
$488,493 $2,964,654 $681,792
$2,964,654 $-2,476,161
$-2,476,161 34.9
-71.7
-71.7
Other Miscellaneous Store Retailers (NAICS 4539) $1,657,344 $2,107,637 $-450,293 -12.0
Other Miscellaneous Store Retailers (NAICS 4539) $1,657,344 $2,107,637 $-450,293 -12.0
Food Services
Food & Drinking
Services Places
& Drinking (NAICS
Places 722) $91,164,979 $128,386,301 $-37,221,322 -17.0
Nonstore Retailers (NAICS 454)(NAICS 722) $91,164,979
$17,791,956 $128,386,301
$10,318,107 $-37,221,322
$7,473,849 -17.0
26.6
Nonstore Retailers
Full-Service
Full-Service (NAICS
Restaurants 454)
(NAICS
Restaurants 7221)
(NAICS 7221)
Electronic Shopping and Mail-Order Houses (NAICS 4541) $17,791,956
$49,168,142
$49,168,142
$16,264,584 $10,318,107
$75,224,740
$75,224,740
$7,353,453 $7,473,849
$-26,056,598
$-26,056,598
$8,911,131 26.6
-20.9
-20.9
37.7
Electronic
©2011 Esri Shopping
Limited-Service
Vending and
Eating
Limited-Service
Machine Mail-Order
Places
Eating (NAICS
Places
On-demand
Operators Houses
7222)
(NAICS
reports
(NAICS and (NAICS
7222) 4541)
maps from
4542) Business Analyst $16,264,584
$24,053,344
$24,053,344
Online. $7,353,453
$28,134,626
$28,134,626
Order at www.esri.com/bao
$1,038,879 $8,911,131
$-4,081,282
or call
$0 $-4,081,282
800-447-9778
$1,038,879 6/21/201137.7
-7.8
-7.8
100.0
Vending
Special Machine
Food
Special Food Operators
Services
Services (NAICS
(NAICS 7223)4542)
7223)
Direct Selling Establishments (NAICS 4543) $1,038,879
$11,160,932
$11,160,932
$488,493 $20,719,123$0
$20,719,123
$2,964,654 $1,038,879
$-9,558,191
$-9,558,191
$-2,476,161 100.0
-30.0
-30.0
-71.7
Direct Drinking
Selling
Drinking PlacesPlaces - Alcoholic
Establishments
- Alcoholic Beverages
(NAICS
Beverages 4543)
(NAICS(NAICS
7224)7224) $6,782,561 $2,964,654
$488,493
$6,782,561 $4,307,812 $-2,476,161
$4,307,812 $2,474,749
$2,474,749 -71.7
22.322.3
Food Services & Drinking Places (NAICS 722) $91,164,979 $128,386,301 $-37,221,322 -17.0
Food Services & Drinking
Full-Service Places (NAICS
Restaurants (NAICS 722)
7221) $91,164,979
$49,168,142$128,386,301
$75,224,740 $-37,221,322
$-26,056,598 -17.0
-20.9
16 Full-Service RestaurantsEating
Limited-Service (NAICS 7221)
Places (NAICS 7222) $49,168,142
Leakage/Surplus
Leakage/Surplus
$24,053,344 $75,224,740
Factor
Factor
$28,134,626 $-26,056,598
by Industry
by Industry Subsector
Subsector
$-4,081,282 -20.9
-7.8
Special Food
Limited-Service Services
Eating Places (NAICS
(NAICS7223)
7222) $11,160,932
$24,053,344 $20,719,123
$28,134,626 $-9,558,191
$-4,081,282 -30.0
-7.8
Drinking
Special Food Places(NAICS
Services - Alcoholic Beverages (NAICS 7224)
7223) -20.0 $6,782,561
$11,160,932
-10.0 0.0 $4,307,812
$20,719,123
10.0 20.0 $2,474,749
$-9,558,191 22.3
-30.0
-20.0 -10.0 0.0 10.0 20.0 30.030.0 40.040.0 50.050.0 60.0
60.0Town of Chapel Hill Retail Market Study
environment, potentially making it more difficult to start-up However, this analysis does not take into account all the
additional businesses in that retail category. It can also components of a retail gap analysis. It cannot be assumed
indicate a strength, or the fact that a particularly geography that 100 percent of the leakage within a certain retail
is a retail center or destination. category can be captured back into a geography. There are
almost always some type of retail goods purchased that are
Chapel Hill Gap Analysis not from local establishments, such as luxury / speciality
goods found in only a few locations (like the Apple Store),
As shown in Figure 1.4, virtually all retail categories in or goods purchased from online vendors. Also, the data
Chapel Hill show some leakage of retail dollars, with the does not reflect two other important sources of retail
exception of Food & Beverage Stores, Miscellaneous demand: employees and students who do not live within
Store Retailers, and Food Services & Drinking Places. This the Town borders. These groups spend money on retail
indicates that a significant portion of retail spending is purchases in Chapel Hill, even if it is not as much as those
done by Chapel Hill residents outside of the Town. The who live in the community.
extent of this spending is shown in Figure 1.5. After
adjusting aggregate retail spending to represent non- According to a survey conducted in 1989 by the
automotive related categories, it is estimated that there is International Council of Shopping Centers (ICSC), the typical
approximately $50 million in GAFO retail leakage, which office worker spends $1,900 a year on daytime and after
would represent 20% of all anticipated spending by Chapel work dining, drinks and shopping. Adjusting for inflation,
Hill residents. this amount rises to $3,350. ESRI estimates that there
are approximately 34,000 employees living in Chapel Hill,
If this leakage were “captured” back into the Town, this meaning there is an additional retail potential of over $110
would represent an opportunity for 150,000 - 200,000 million in retail and dining, though this number has to be
square feet of new retail (assuming existing conditions adjusted for capture rates and the difference between
and a retail range of $250-$350/sf, which differs based office workers (professionals) and other types of employees
on the type of retailer). This, however, takes into (non-professionals). The Town of Chapel Hill Residential
consideration several categories that have negative gap Market Study estimated that over 12,000 University of
results. According to ESRI Business Analyst, the retail North Carolina students live outside of Town. Figure 1.6
categories that show the largest potential include Clothing endeavours to paint a more complete picture of the retail
Stores, Building Materials and Supplies, Electronics and environment within Chapel Hill. It should be noted that this
Appliances, Furniture and Home Furnishings, and General assessment is based on a series of assumptions and should
Merchandise Stores. If one where to calculate the retail be considered to be a general indicator of retail demand
potential only for those categories that show leakage, the rather than a specific projection.
retail potential jumps from 200,000 - 275,000 square feet.
Figure 1.5 Adjusted Summary Retail Gap Data - Town of Chapel Hill
Source: ESRI Business Analyst
Demand Supply Gap
Total Retail & Dining $589,760,650 $522,975,921 $66,784,729
GAFO Retail* $260,038,536 $210,315,191 $49,723,345
Food Services & Drinking Places $100,134,138 $130,769,167 $-30,635,029
Leakage Categories Only $137,338,205 $68,434,970 $68,903,235
* GAFO = General, Apparel, Furnishings and Other - excludes motor vehicle and related purchases, gasoline stations and nonstore retailers.
17Town of Chapel Hill Retail Market Study
Figure 1.6 Revised Gap Analysis - Residents, Employees and Students
Source: ESRI Business Analyst and DCI Analysis
Demand Est. Capture
# Spending Adj. Demand
(GAFO+Dining) Rate
Chapel Hill Households 19,000 $18,875 / household $360,172,674 85% $306,000,000
Employees 34,000
Professional 23,000 $3,350 $77,050,000 50% $38,525,000
Non Professional 11,000 $1,500 $22,000,000 50% $11,000,000
Non Resident Students 12,000 $2,150 $25,800,000 15% $3,875,000
TOTAL RETAIL AND DINING $359,540,000
Total Adj. Demand GAFO Demand Food & Drink Demand
Chapel Hill Households $306,000,000 $221,000,000 $85,114,000
Employees
Professional $38,525,000 $13,480,000 $25,000,000
Non Professional $11,000,000 $7,150,000 $3,850,000
Non Resident Students $3,875,000 $2,515,000 $1,350,000
TOTAL DEMAND $359,540,000 $255,706,750 $103,802,250
TOTAL SUPPLY $341,084,358 $210,315,191 $130,769,167
GAP $45,391,559 $(26,996,917)
Figure 1.7 Estimated Potential Square Footage from Captured Retail Leakage
Source: ESRI Business Analyst and DCI Analysis
Demand Supply Gap Adj. Gap Potential
Category
(millions) (millions) (millions) (millions) Square Footage Capture
Furniture $14.1 $4.4 $9.7 $8.3 24,000 - 33,000
Electronics $15.2 $6.8 $8.4 $7.1 20,000 - 28,500
Building Materials $21.1 $11.0 $10.1 $8.6 25,000 - 34,000
Health & Personal Care $17.8 $13.6 $4.2 $3.5 10,000 - 14,000
Clothing $25.5 $15.0 $10.5 $9.0 25,500 - 36,000
Sporting Goods $15.7 $11.0 $4.7 $4.0 11,000 - 15,700
General Merchandise $27.8 $6.5 $21.4 $18.1 52,000 - 72,700
167,000 - 234,000
After adjusting for additional markets and applying employees and students spend their money. Fortunately,
appropriate capture rates and anticipated constant leakage, because the gap analysis for resident households was
the aggregate results for Chapel Hill ends up very close similar to the adjusted gap for residents, employees and out
to the estimated gap previously determined solely by the of town students, projections can be applied with a relative
resident market - approximately $45 million in leakage for confidence of accuracy.
GAFO retail and a surplus of $26 million in food and drink.
Available data allows a more detailed category by category Using only the categories in Figure 1.4 that showed
look through the original data provided by ESRI, since there leakage, Figure 1.7 represents the potential for additional
are no good estimates for the exact categories in which retail within the Town of Chapel Hill by retail category.
18Town of Chapel Hill Retail Market Study
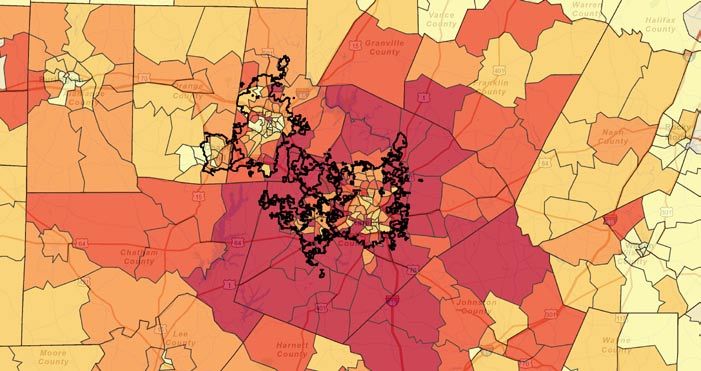
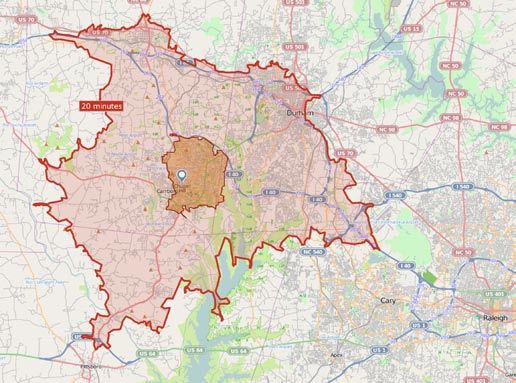
Market Area Gap Analysis Third, the potential for future retail development within
Chapel Hill is likely to come from regional opportunities as
Examining the retail surplus / leakage for a single geography well as demand within the Town itself. This may drastically
such as a neighborhood or municipality is not sufficient increase the potential square footage that could be
to fully analyze the potential for future retail development. developed within Town boundaries.
Retail development relies upon trade areas that are not
defined by political boundaries. Any identified retail 1.4 KEY FINDINGS - EXISTING CONDITIONS
“leakage” within a community may be met by retail centers
immediately outside of that geography. Similarly, a surplus • Chapel Hill has approximately 1.3 million to 1.5 million
in retail for a city may underestimate the potential to add square feet of retail space, most of which is split up
regionally serving retail that attracts customers from a larger between several small to medium neighborhood and
area. community center scaled developments.
To confirm and revise the potential retail opportunities • The Town has a wide variety of retail offerings, from
identified in Section 1.3, retail supply and demand data was traditional strip centers to “urban” storefront space
drawn for two larger market areas centered on Chapel Hill. both in the Downtown area, and New Urban style
The first is a 15 minute drive time from Downtown Chapel communities.
Hill, which encompasses all of Chapel Hill and its immediate
environs, including Carrboro and parts of Orange County. • While Chapel Hill has experienced some small and
The second is a 20 minute drive time that includes parts of medium scale retail development in the past decade,
northern Chatham County, a significant portion of southern the vast majority of regionally serving retail has been
Orange County, and much of southern Durham County. A built just outside the Town’s borders in Durham,
map of these areas and relevant data is illustrated in Figure including 900,000+ sf in New Hope Commons and
1.8. Patterson Place, and 2 million+ sf at the Streets at
Southpoint and other nearby centers.
This data shows three clear trends within the geography
that can be considered Chapel Hill’s “market area”. First, • An assessment of the gap between supply and demand
leakage in retail dollars only increases the further one for retail finds over $45 million in “leakage”, indicating
moves away from Chapel Hill, despite the inclusion of that large portions of consumer dollars are being spent
several regional shopping areas like Southpoint, South outside of Chapel Hill. If captured back into Chapel Hill,
Square and Northgate. This indicates “latent” demand for this leakage would represent between 167,000 and
retail goods - potential consumer spending that is not being 234,000 square feet of retail space.
spent in the immediate Region. Latent demand represents
the best opportunity for immediate capture for new retail • A broader view of the local retail marketplace shows
development. that this “leakage continues outside of Chapel Hill,
despite the location of over 4+ million square feet of
The second trend is related to Food & Dining, which regionally serving retail just outside of Chapel Hill. This
has a surplus of supply both within Chapel Hill and its indicates “latent” demand for additional retail in or near
overall market area. This generally means that the area is Chapel Hill.
oversupplied with dining. On one hand, this is a strength,
since Chapel Hill and environs clearly draw enough
additional customer base from outside the area for dining.
On the other hand, unless positioned well this indicates a
more difficult opportunity for retail growth.
19Town of Chapel Hill Retail Market Study
Figure 1.8 Chapel Hill Market Area
Source: ESRI Business Analyst and DCI Analysis
TOWN OF CHAPEL HILL 15 MINUTE MARKET AREA 20 MINUTE MARKET AREA
RETAIL RETAIL RETAIL
Demand $260 million Demand $925 million Demand $1,440 million
Supply $210 million Supply $810 million Supply $1,300 million
Gap $49.7 million Gap $115 million Gap $144 million
= 140 - 200k GLA = 330 - 460k GLA = 410 = 575k GLA
DINING DINING DINING
Demand $100 million Demand $303 million Demand $466 million
Supply $130 million Supply $377 million Supply $605 million
Gap $(30 million) Gap $(74 million) Gap $(138 million)
20Town of Chapel Hill Retail Market Study
• There is an oversupply of food and drink
establishments, both in Chapel Hill and the Region. SECTION 2:
Market Trends
These businesses draw in customers from outside the
local market, but leave limited opportunity for continued
expansion in the market.
2.1 DEMOGRAPHIC / ECONOMIC TRENDS
• There is also a surplus of food and beverage store
sales, indicating an oversaturation in groceries. As the old adage “retail follows rooftops” attests, an
examination of future possibilities for retail development is
• Spending potential from Chapel Hill households based heavily on population growth trends, and how current
represent the largest local customer base, but retail centers serve both existing and future population
employees and students represent notable sub- centers. Given the fast pace of growth that the Triangle
markets. Retail developments like Meadowmont and area has experienced in the past 20+ years, and the
East 54 likely draw large percentages of sales from population projections for the Region that suggest similar
nearby employees. rates over the next 20 years, it is important to analyze
future growth areas and the anticipated relationship of retail
• Leakage in core GAFO retail categories are generally to those areas.
equal across the board, ranging between 20,000 and
40,000 square feet in retail growth potential. The Past Population Growth
largest category of leakage is in General Merchandise.
This suggests demand for a department store or The Triangle Region has seen a significant amount of
supercenter, which makes sense considering that population growth over the past two decades. In 2010,
national retailers like Walmat and Target are both the Raleigh-Durham CMSA had approximately 1.75 million
located outside of Chapel Hill, but within easy driving people. With a 1990 population of only 864,000, the
distance. Triangle Region has doubled in only 20 years.
The Raleigh-Cary Metropolitan Statistical Area (MSA) is
the 48th largest metropolitan area in the country with 1.13
million people, and the second largest metropolitan area in
the State of North Carolina, after Charlotte. According to
the U.S. Census, Raleigh-Cary was the 4th fastest growing
metropolitan area in the country between 2000 and 2010.
When examining other MSAs with increased population
growth, Raleigh-Cary has added significantly more people
than its growth peers. The Durham-Chapel Hill MSA has
grown slower than its neighbor, but still recorded robust
growth over the past two decades. It grew by 77,864
people between 2000 and 2010 and was the 102nd fastest
growing MSA in the country. The City of Durham accounts
for 45% of the population in the MSA and grew by 50%
between 1990 and 2010. The Town of Chapel Hill accounts
for 11% of the MSA’s population and grew by 47% over the
same time period.
21Town of Chapel Hill Retail Market Study 2010-2015 Households: Annual Growth
Custom Map
ouseholds: Annual Growth Rate (Esri) by Census Tracts
Figure 2.1 Population Projections 2010 - 2015 by Census Tract
Source: ESRI Business Analyst
BURLINGTON
DURHAM
CHAPEL
HILL
RALEIGH
CARY
Cu
2010-2015
2010-2015 Households: Annual Growth Rate (Esri) by C
b
2010-2015 HHs: Annual Grwth Rt
by Census Tracts
3.46% or greater
2.23% - 3.45%
1.41% - 2.22%
0.59% - 1.40%
0.58% or less
©2011 Esri On-demand reports and maps from Business Analyst Online. Order at www.esri.com/bao or call 800-447-9778
800-447-9778 6/24/2011
20 MINUTE
CHAPEL HILL
MARKET AREA
22Town of Chapel Hill Retail Market Study
Figure 2.2 County Population Projections 2010 - 2030
Source: US Census and State of North Carolina
2010 2020 2030
Chatham County 63,505 78,237 92,604
Durham County 267,587 323,474 378,024
Franklin County 60,619 74,697 88,330
Johnston County 168,878 220,591 271,031
Orange County 133,801 155,442 176,560
Person County 39,464 49,931 48,308
Wake County 900,993 1,160,823 1,414,333
Future Population Growth that included the communities of Raleigh, Cary, Garner,
Apex, Holly Springs, and various other small towns and
The State of North Carolina projects that the Triangle unincorporated areas.
Region will add more than 800,000 people over the next
20 years. This is the equivalent to the number of people Further to the west, within the Durham-Chapel Hill MSA,
who lived in the Region in 1990, a growth rate of 185% growth is projected to be the most robust in southern
in 40 years. Clearly, this will have an impact on the retail Durham County, in the area of Research Triangle Park,
landscape in the near future. Households in the Triangle centered on I-40. West of Durham County, the western
area, on average spend about $14,000 on non automotive and northern areas of Orange County show very limited
retail goods annually. Using existing demand, household growth, while Chatham County, to the south of Chapel Hill,
data, and projections, the Triangle Region is projected to shows relatively high growth levels. Central and Western
add 325,000 new households. This will generate over Orange County, which is very much the western fringe of
$6 billion in new retail demand, the potential equivalent the populated areas of the Triangle Region, show sparse
of 11 to 15 million square feet of new retail, not including growth until one moves further west in Alamance County,
restaurants. Not all of this demand will be captured directly which is part of the “Triad” Region made up of Greensboro,
into “bricks and mortar” retail, but it is nevertheless clear Winston-Salem, and High Point. One can see strong
how projected population growth will play a role in shaping growth projections just west of the City of Burlington, seen
an ever changing demographic and development landscape on the upper left hand of each map.
within the Triangle.
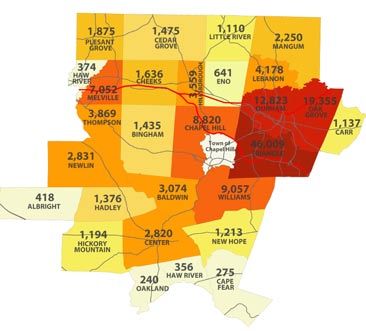
The growth trends in and around the Town of Chapel Hill
Figure 2.1 illustrates household growth projections by are illustrated in more detail in Figure 2.3. This graphic
census tract for the five year span between 2010 and 2015. illustrates both past and projected growth by selected
These can be used as a general guide to where future townships within Durham, Orange, Chatham, and Alamance
household growth is expected in the Triangle area. In terms Counties. Rather than show percentage growth, as in
of 20 year projections, they should be taken with a grain of Figure 2.1, they show numeric growth. As mentioned
salt, considering that these projections primarily follow the previously, the primary areas of growth within the Town
growth patterns of the past 10+ years. These maps show of Chapel Hill and its environs are directly to the east, in
that Wake County is expected to continue to experience the Triangle, Durham and Oak Grove Townships - all in Durham
bulk of population and household growth within the Triangle County. Chapel Hill Township itself shows strong past and
area. In particular, growth is expected to be very strong future growth.
in the southern and northern parts of the county, areas
23You can also read