City of Cape Town 2017 - Western Cape Government
←
→
Page content transcription
If your browser does not render page correctly, please read the page content below
City of Cape Town
2017
CITY OF CAPE TOWN: AT A GLANCE

1.   DEMOGRAPHICS                  1

2.   EDUCATION                     3

3.   HEALTH                        7

4.   POVERTY                      12

5.   BASIC SERVICE DELIVERY       15

6.   SAFETY AND SECURITY          19

7.   THE ECONOMY                  24

8.   INFRASTRUCTURE DEVELOPMENT   29

SOURCES                           36

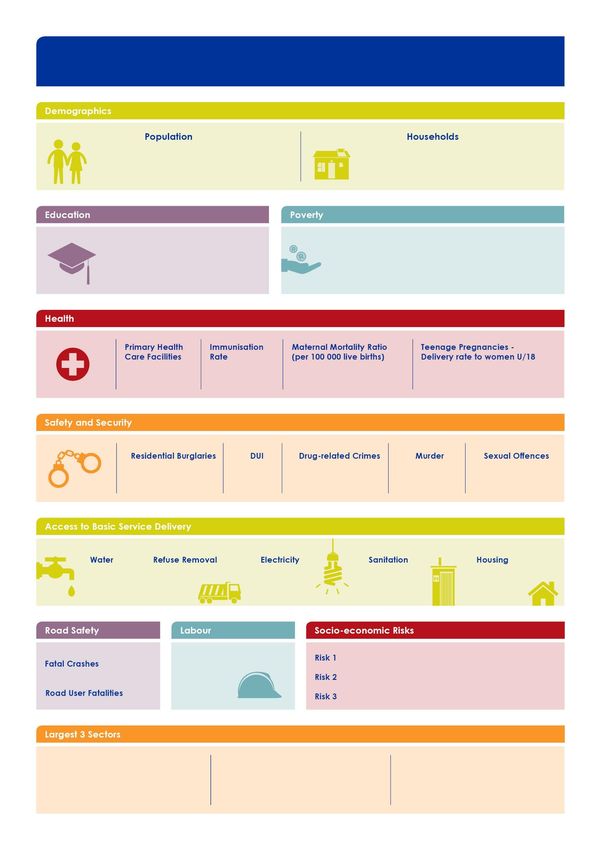
City of Cape Town: At a Glance

                                                                     Population Estimates, 2018; Actual households, 2016

           4 232 276                                                              33 097
                                         2016                                                                        2016

          Matric Pass Rate          92.4%                      Gini Coefficient                                  0.58
          Learner-Teacher Ratio      44.7
                                                               Human Development Index                         0.67
          Gr 12 Drop-out Rate       31.7%

                                                                                                                    2016

                    16              65.1%                        0.1                            8.4%

                                     Percentage change between 2016 and 2017 in number of reported cases per 100 000

                       -2.0%           19.1%               -5.7%                   35.3%                 30.3

                                                           Percentage of households with access to basic services, 2016

    98.4%              78.7%                     90.1%                   92.8%                      77.5%

                2016                             2016

                                                                   Drought
               37            Unemployment Rate
                                                                   Financial Sustainability (Grant dependency)

              49             11.9%                                 Stagnating Economic Growth

                                                                                              Contribution to GDP, 2015

 Wholesale and retail trade,                Finance, insurance, real                  Agriculture, forestry and fishing
catering and accommodation                estate and business services

    17.8%                                        16.6%                                     14.1%
1
                            DEMOGRAPHICS

    This first chapter of the SEP focusses on the people living in the City of Cape Town. A
    demographic perspective on a municipality allows to observe not only simple changes in
    population growth, but also to look at other various developments that influence the social life
    of every citizen. Demographics allow to emphasise aspects of society like, e.g. gender, race,
    migration or life expectancy. Decisions made by politicians as well as by the administration
    affect in almost every case at least one aspect of Demographics. Therefore, a good
    understanding of this area is crucial for the government’s work.

    The overview of key demographic factors given in this chapter comprises of the estimates of
    population size, the distribution of population within age cohorts and furthermore the
    dependency ratio, which is of high importance for understanding economic activity in the
    area as well as for planning welfare systems. With this short, but informative overview, the SEP
    tries to help the municipalities in their budgeting process by delivering precise data as a solid
    foundation for future decisions.

    Data source: Department of Social Development, 2017

1   2017 Socio-economic Profile: City of Cape Town
POPULATION
     4 500 000
     4 000 000
     3 500 000
     3 000 000
     2 500 000
     2 000 000
     1 500 000
     1 000 000
       500 000
              0
                      Cape
                                  Central Karoo    City of Cape                      Overberg     West Coast
                    Winelands                                     Eden District
                                     District          Town                           District     District
                     District
             2018    864 028         75 688          4 055 580      619 224           284 272      433 445
             2019    874 413         76 354          4 094 582      625 186           287 752      439 036
             2020    884 565         77 020          4 131 722      631 005           291 150      444 497
             2021    894 441         77 685          4 167 003      636 682           294 466      449 847
             2022    904 058         78 350          4 200 484      642 220           297 701      455 051
             2023    913 391         79 014          4 232 276      647 627           300 860      460 132

    The City of Cape Town’s population is expected to expand rapidly across the next 5 years,
    growing from 4 055 580 people in 2018 to 4 232 276 in 2023. This equates to a 0.9 per cent
    year-on-year growth rate.

    AGE COHORTS
                     Children:                    Working Age:                    Aged:          Dependency
      Year
                    0 – 14 Years                  15 – 65 Years                    65 +             Ratio

      2011             928 334                      2 604 209                 207 494               43.6

      2018            1 061 002                     2 733 119                 261 460               48.4

      2023            1 073 016                     2 849 207                 310 051               48.5

    The above table depicts the population composition regarding age cohorts. The total
    population is broken down into three different groups: Age 0 - 14: children; Age 15 - 65: working
    age population; Age 65+: seniors. A comparison between the 2018 and 2023 estimates show
    that the aged population will increase at 3.4 per cent year-on-year whereas the child cohort
    will only increase by 1.2 per cent. The working age population is in turn expected to only grow
    at 0.8 per cent year-on-year. These dynamics will increase the City’s dependency rate which
    implies a greater strain on social systems and the delivery of basic services.

2   2017 Socio-economic Profile: City of Cape Town
2
                                   EDUCATION

    Education and training improves access to employment opportunities and helps to sustain and
    accelerate overall development. It expands the range of options available from which a
    person can choose to create opportunities for a fulfilling life. Through indirect positive effects
    on health and life expectancy, the level of education of a population also influences its
    welfare.

    Data source: Western Cape Education Department, 2017

3   2017 Socio-economic Profile: City of Cape Town
LEARNER ENROLMENT
      700 000

      600 000

      500 000

      400 000

      300 000

      200 000

      100 000

             0
                                                        Cape
                  City of Cape      West Coast                          Overberg                         Central Karoo
                                                      Winelands                         Eden District
                      Town           District                            District                           District
                                                       District
          2014       613 393           57 501           139 088           39 542           101 165           14 151
          2015       628 048           58 909           141 263           40 501           102 412           14 182
          2016       639 251           60 348           142 130           40 841           103 011           14 333

    Learner enrolment within the Cape Metro area increased at an average annual rate of
    2.1 per cent between 2014 and 2016. This is the second highest learner enrolment rate
    amongst the various Districts of the Western Cape, with the West Coast District growing at
    2.4 per cent across the same period. The Western Cape’s average annual learner enrolment
    growth is 1.8 per cent.

    LEARNER-TEACHER RATIO
                                 The learner-teacher ratio within the City of Cape Town is rising at a
                                 dramatic rate from 30.3 in 2014 to 39.8 in 2015 and 40.1 in 2016. It is
                                 therefore evident that the increase in the number of learners in the City
                                 of Cape Town is not being met by a reciprocal increase in the number
                                 of teachers.

                                 Increased learner-teacher ratios are a major concern as it is commonly
                                 assumed that children receive less personalised attention in larger class
                                 environments and that high learner-teacher ratios are detrimental to
                                 improved educational outcomes.

    GRADE 12TheDROP-OUT                RATES
                learner-teacher ratio within the City of Cape Town is rising at a
    The high school drop-out   rate for rate
                            dramatic        the Cityfromof30.3
                                                           Cape    Town to
                                                                in 2014   increased     fromand
                                                                              39.8 in 2015    31.9 40.1
                                                                                                   per cent      in 2014
                                                                                                          in 2016.    It is
    to 33.7 per cent in 2015, but    improved         to 32.7  per cent   in  2016.  Although   this
                            therefore evident that the increase in the number of learners in the Cityrate    improved
    between 2015 and 2016,      it is still
                            of Cape     Town concerning       to note
                                                   is not being   met bythat   32.7 per cent
                                                                           a reciprocal         of allinlearners
                                                                                           increase       the number that
    enrolled in Grade 10 within   the  Metro
                            of teachers.          in  2014 dropped     out  of  school   by the time   they    reached
    Grade 12 in 2016.
                            Increased learner-teacher ratios are a major concern as it is commonly
    These high levels of drop-outs
                            assumed   arethat influenced     by a wide
                                                  children receive    lessarray   of economic
                                                                           personalised           factors
                                                                                            attention         including
                                                                                                        in larger   class
    unemployment, poverty,  environments and that high learner-teacher ratios are detrimentalrely
                              indigent       households,     high  levels  of households     with no  income      or    to
    on less than R515 a month    and teenage
                            improved        educationalpregnancies.
                                                             outcomes.

4   2017 Socio-economic Profile: City of Cape Town
                         The learner-teacher ratio within the City of Cape Town is rising at a
                         dramatic rate from 30.3 in 2014 to 39.8 in 2015 and 40.1 in 2016. It is
EDUCATIONAL FACILITIES
    The availability of adequate education facilities such as schools, FET colleges and schools
    equipped with libraries and media centres could affect academic outcomes positively.

         800

         700

         600

         500

         400

         300

         200

         100

           0
                       Number of Schools with Libraries                   Total Number of Schools
         2014                        576                                           753
         2015                        587                                           756
         2016                        587                                           760

    The number of schools within the greater City of Cape Town increased gradually since 2014
    amidst rising population figures which increased the demand for educational facilities. There
    were 760 schools within the greater City of Cape Town in 2016 which accommodated
    639 251 learners.

    The number of schools equipped with libraries increased from 576 in 2014 to 587 in 2015, but
    remained unchanged towards 2016.

       90,0%
       80,0%
       70,0%
       60,0%
       50,0%
       40,0%
       30,0%
       20,0%
       10,0%
        0,0%
                                                    Cape
                City of Cape     West Coast                   Overberg                         Central Karoo
                                                  Winelands                    Eden District
                    Town          District                     District                           District
                                                   District
         2014      46,2%            72,1%            77,2%     78,6%              77,4%             79,3%
         2015      46,2%            72,1%            77,2%     78,6%              76,9%             79,3%
         2016      46,3%            70,4%            76,3%     79,8%              75,3%             79,3%

    Above graph depicts the percentage of no-fee schools within the various districts of the
    Western Cape. There were a total of 760 schools in the City of Cape Town in 2016 of which 352
    were considered to be no-fee schools (46.3 per cent). Constraining economic conditions will
    particularly be hard felt within the Metro which will give rise to the number of parents that are
    unable to pay school fees.

5   2017 Socio-economic Profile: City of Cape Town
EDUCATION OUTCOMES
                                     Education remains one of the key avenues through which the state
                                     is involved in the economy. In preparing individuals for future
                                     engagements in the broader market, policy decisions and choices in
                                     the sphere of education play a critical role in determining the extent
                                     to which future economy and poverty reduction plans can be
                                     realised.

    The Western Cape is divided into eight (8) education districts, which each manage the quality
    of education and education institutions within its jurisdiction. The districts include four rural
    districts (West Coast, Cape Winelands, Eden and Karoo, and Overberg), and four urban
    districts (Metro North, Metro South, Metro East and Metro Central).

    Rural district boundaries are based on municipal boundaries, while urban district boundaries
    are based on those of city wards. The boundaries also allow for an equitable distribution of
    schools and resources across education districts and circuits.

    Below graph depicts the 2016 matric pass rates of these eight education districts.

        94,0
        92,0
        90,0
        88,0
        86,0
        84,0
        82,0
        80,0
        78,0
        76,0
        74,0
        72,0
                            Eden And
                  Cape                   Metro                  Metro   Metro              West    Western
                             Central               Metro East                   Overberg
                Winelands                Central                North   South              Coast    Cape
                              Karoo
         2014     84,7        84,8        88,4        82,8      88,4    85,1      92,7     87,5     86,0
         2015     83,7        85,2        87,2        80,5      86,8    83,4      89,7     88,9     84,7
         2016     83,3        80,2        82,2        80,5      83,5    80,5      88,1     88,4     82,2

    The Western Cape average matric pass rate for 2016 was 82.2 per cent, a gradual decline
    from 86.0 per cent in 2014 to 84.7 in 2015. The highest pass rate in 2016 is attributed to the West
    Coast District with 88.4 per cent, followed closely by the Overberg District with 88.1 per cent.
    The lowest pass rate in 2016 was that of the combined Eden and Central Karoo District
    (80.2) per cent.

    Despite having the second highest pass rate in 2016, the Overberg District’s rate has been
    deteriorating in the last few years. This is concerning, given that the Overberg in 2014 achieved
    the highest pass rate (92.7 per cent) of any district across the last three years.

    Within the City of Cape Town, the Metro North region had the highest pass rate at 83.5 per cent
    in 2016 with the Metro East and South each achieving an 80.5 per cent pass rate.

6   2017 Socio-economic Profile: City of Cape Town
3
                                           HEALTH

    Health is another major factor contributing to the general quality of life within the City of Cape
    Town. It is therefore important to monitor the public health facilities as well as a variety of
    factors such as diseases like HIV or TB and general topics that affect the community, like
    maternal health. This Socio-economic Profile provides the basic statistics concerning those
    issues. Since this profile focusses on the public health facilities, private facilities do not appear
    in it.

    Data source: Department of Health, 2017

7   2017 Socio-economic Profile: City of Cape Town
HEALTHCARE FACILITIES
All citizens’ right to access to healthcare services are directly affected by the number and
spread of facilities within their geographical reach. South Africa’s healthcare system is geared
in such a way that people have to move from primary, with a referral system, to secondary
and tertiary levels.
250
200
150
100
50
0
Total number
Number of
Number of Number of of PHC
Community Number of PHC Clinics - Number of Number of
Community ART clinics/ TB clinics/ facilities
Health district non-fixed PHC Clinics - regional
Day Centres treatment treatment (Fixed
Centre hospitals (mobiles/ Fixed hospitals
sites sites Clinics, CHCs
satelite)
and CDCs)
2014 40 9 77 9 21 88 2 208 137
2015 40 9 81 9 27 82 2 117 131
2016 42 9 85 9 28 81 2 128 132
In 2016, the City of Cape Town had a total number of 132 primary healthcare facilities – 81 fixed
PHC clinics, 42 community day centres as well as 9 community health centres. In addition,
there are 85 ART and 128 TB treatment sites as well as 2 regional hospitals within the City’s
boundaries. The number of ART treatment sites and non-fixed PHC clinics has gradually been
increasing since 2014. The number of TB clinics however decreased notably between
2014 (208) and 2015 (117). The number of district and regional hospitals has remained
unchanged since 2014.
EMERGENCY MEDICAL SERVICES
Access to emergency medical services is critical for rural citizens
due to rural distances between towns and health facilities being
much greater than in the urban areas. Combined with the
relatively lower population per square kilometre in rural areas,
ambulance coverage is greater in rural areas in order to
maintain adequate coverage for rural communities.
The number of ambulances per 10 000 people in the Cape Metro
area is 0.25 in 2016, down from 0.28 in 2014 and 0.25 in 2015. This
decrease can in part be attributed to rapidly rising population
numbers.
8 2017 Socio-economic Profile: City of Cape TownHIV/AIDS
HIV/AIDS management is crucial given its implications for
the labour force and the demand for healthcare services.
Registered patients Number of new ART
HIV Transmission Rate
receiving ART patients
Area
2014 2015 2016 2014 2015 2016 2014 2015 2016
City of Cape Town 131 177 145 232 162 704 27 663 30 275 32 268 1.3 1.3 0.7
West Coast 6 521 7 651 8 910 1 484 1 790 1 835 1.4 1.5 0.8
Cape Winelands 19 615 23 172 27 162 4 595 5 195 5 097 1.7 1.7 1.5
Overberg 7 233 8 703 10 397 1 451 1 983 1 767 1.3 0.6 0.0
Eden 14 805 17 391 20 127 3 278 3 820 3 603 1.6 1.4 1.8
Central Karoo 1 418 1 416 1 631 327 300 299 3.4 4.3 1.4
The number of registered patients receiving antiretroviral treatment (ART) increased by
11.4 per cent year-on-year between 2014 and 2016 in the City of Cape Town. The total number
of registered patients were in 2016 recorded at 162 704 whilst there were a total of 32 268 new
patients. These patients were treated at 85 treatment sites across the City. The increase in the
number of registered patients correspond with the increase in treatment facilities in the Metro.
In addition to improving the quality of life of the patient, antiretroviral treatment to mothers
both before and at birth, also decreases the chances that infants will contract HIV from their
mothers. Progress made to increase access to ART medication contributed to the HIV
transmission rate between mother and child decreasing considerably since 2015.
TUBERCULOSIS
25 200
25 042
25 000
24 800
24 600
2014
24 400
24 200 2015
24 093
23 987 2016
24 000
23 800
23 600
23 400
Number of TB patients
The number of tuberculosis (TB) patients in the City has gradually been declining from
25 042 patients in 2014 to 24 093 in 2015 which equates to a 3.8 per cent decline. This number
again decreased to 23 987 in 2016.
9 2017 Socio-economic Profile: City of Cape TownCHILD HEALTH
Health Indicator City of Cape Town Western Cape
Immunisation 82.2% 79.9%
Malnutrition 1.8 2.3
Neonatal mortality rate 4.0 4.6
Low birth weight 14.0% 14.0%
The Department of Health strongly advises mothers to protect their children from infectious
diseases by getting them vaccinated from birth to when they are 12 years old. Vaccination is
free of charge at all health facilities. Cityimmunisation
of
HealthThe Department also runs
Indicator campaigns
Western Capeand
Cape Town
health workers are sent to nursery schools and crèches to immunise the children. The full
Immunisation
immunisation coverage rate for children under the age of one82.2
in the City of Cape79.9
Town in 2016
was 82.2 per cent which is higher than the Western Cape rate of 79.9 per cent.
Malnutrition 1.8 2.3
There were 1.8 malnourished childrenmortality
Neonatal under five years per 1004.0
rate 000 people in the City
4.6 of Cape
Town in 2016 which is lower than that of the Western Cape rate of 2.3.
Low birth weight 14.0% 14.0%
At 4.0 deaths, the City of Cape Town has already achieved the Province’s target of reducing
neonatal deaths to 6 per 1 000 live births by 2019.
A total of 14.0 per cent of all babies born in the City of Cape Town and the Western Cape as
a whole in 2016 were considered to be underweight. City of
Health Indicator Western Cape
Cape Town
DEFINITIONS Immunisation 82.2 79.9
Immunisation: The immunisationMalnutrition
rate is calculated as the number
1.8 of children immunised
2.3 as
a percentage of the total number of children less than one year of age. Immunisation
Neonatal mortality rate 4.0 4.6
protects both adults and children against preventable infectious diseases. Low immunisation
rates speak to the need for parents to understand
Low birth weight the critical importance of immunisation,
14.0% 14.0%
as well as the need to encourage parents to have their young children immunised.
Malnutrition: Expressed as the number of malnourished children under five years per
100 000 people. Malnutrition (either under- or over-nutrition) refers to the condition whereby
an individual does not receive adequate amounts or receives excessive amounts of
City of
nutrients. Health Indicator Western Cape
Cape Town
Neonatal mortality rate: Measured as the number of neonates
Immunisation 82.2 dying before79.9reaching
28 days of age, per 1 000 live births in a given year. The first 28 days of life (neonatal period)
represent the most vulnerable timeMalnutrition 1.8Province’s target2.3
for a child’s survival. The for 2019 is
6.0 per 1 000 live births. Neonatal mortality rate 4.0 4.6
Low birth weight: Percentage ofLow
allbirth
babiesweight 14.0%
born in facility that weighed less than14.0%
2 500 g. Low
birth weight is associated with a range of both short- and long-term consequences.
DEFINITIONS City of
Health Indicator Western Cape
10 2017 Socio-economic Profile: City of Cape Town Cape Town
Immunisation: The immunisation rate is calculated as the number of children immunised
Immunisation
as a percentage of the total number 82.2 year of age. Immunisation
of children less than one 79.9
protects both adults and children against preventable infectious diseases. Low
Malnutrition 1.8 2.3MATERNAL HEALTH
Health Indicator City of Cape Town Western Cape
Maternal Mortality Ratio 0.1 0.1
Delivery Rate to Women
5.0% 5.7%
under 18 years
Termination of
1.5% 1.1%
Pregnancy Rate
The maternal mortality ratio for both the City of Cape Town and the Western Cape 0.1 which
attests of improve maternal healthcare interventions such as the upskilling of health
professionals, especially nurses, and the implementation of best practices.
The delivery rate to women under the age of 18 years in the City of Cape Town increased
slightly from 4.8 per cent in 2015 to 5.0 per cent in 2016. The Western Cape rate for 2016 was
slightly higher at 5.7 per cent.
The termination of pregnancy rate in the City was at 1.5 per cent higher than that of the
Province at 1.1 per cent.
DEFINITIONS
Maternal health refers to the health of women during pregnancy, childbirth and the
postpartum period.
Maternal mortality rate: Maternal deaths per 100 000 live births in health facilities. Maternal
death is death occurring during pregnancy, childbirth and the puerperium of a woman
while pregnant or within 42 days of termination of pregnancy, irrespective of the duration
and site of pregnancy and irrespective of the cause of death (obstetric and non-obstetric).
Births to teenage mothers: Percentage of babies born to mothers under the age of 18 years.
Teenage pregnancy is almost always unplanned; as a result, when young parents are
placed in a position to care for their children, life can become particularly tough, especially
if they do not have family or social support.
Termination of pregnancy: The percentage of terminations as a proportion of the female
population aged 15 to 44 years. Government hospitals, designated private doctors and
gynaecologists, and non-profit providers offer safe and legal termination of pregnancy. To
have a free abortion, the request must be made at a primary healthcare clinic, where the
pregnancy will be confirmed, counselling provided, an appointment made, and a referral
letter be given to a facility where the procedure can be performed.
11 2017 Socio-economic Profile: City of Cape Town4
POVERTY
This section shows living conditions and economic circumstances of households within the City
of Cape Town based on most recent data including Statistics South Africa’s Non-Financial
Census of Municipalities 2016 and Quantec. Economic theory suggests that when an
economy prospers its households are expected to enjoy a good standard of living. On the
contrary, a declining economy tends to lower the standards of living of people. This section
uses indicators in terms of GDP per capita, income inequality, human development, as well as
indigent households and free basic services to show the current reality of households residing
in the Cape Metro.
The deteriorating financial health of households and individuals under the weight of economic
pressures, specifically between 2011 and 2015, has resulted in an increase in the poverty levels,
according to the Poverty Trends in South Africa report released by Statistics South Africa in
2017. The report cites rising unemployment levels, low commodity prices, higher consumer
prices, lower investment levels, household dependency on credit, and policy uncertainty as
the key contributors to the economic decline in recent times. These recent findings indicate
that the country will have to reduce poverty at a faster rate than previously planned.
According to the report the categories of people vulnerable to poverty remained to be
African females, children 17 years and younger, people from rural areas, and those with no
education. Inflation-adjusted poverty lines show that food poverty increased from R219 in 2006
to R531 per person per month in 2017. The lower-bound poverty line has increased from R370
in 2006 to R758 per person per month in 2017 while the upper-bound poverty line has increased
from R575 in 2006 to R1 138 per person per month in 2017.
12 2017 Socio-economic Profile: City of Cape TownGDPR PER CAPITA
An increase in real GDPR per capita, i.e. GDPR per person, is experienced only if the real
economic growth rate exceeds the population growth rate.
80 000
70 000
60 000
GDPR per capita
50 000
40 000
30 000
20 000
10 000
0
2005 2006 2007 2008 2009 2010 2011 2012 2013 2014 2015 2016
Western Cape City of Cape Town West Coast Cape Winelands
Overberg Eden Central Karoo
Source: Stats SA 2017, own calculations
GDPR per capita is highest in the City of Cape Town, more so than in any of the other districts
of the Western Cape. The City’s per capita contribution to GDPR is also notably higher than
the Western Cape average. These high levels of GDPR per capita is reflective of the City’s
strong position in terms of economic output in relation to that of the other districts.
INCOME INEQUALITY
The National Development Plan has set a target of reducing income inequality in South Africa
from a Gini coefficient of 0.7 in 2010 to 0.6 by 2030. The City’s Gini coefficient is currently 0.61
(2016).
0,62
0,60
Gini coefficient
0,58
0,56
0,54
0,52
0,50
City of Cape West Coast Cape Overberg Eden Central Karoo Western Cape
Town Winelands
2010 2011 2012 2013 2014 2015 2016
Source: Global Insight, 2017
It is concerning to note that income inequality has in general been on the increase throughout
the various districts and the broader Western Cape Province as well. Income equality has
however been increasing less abruptly in the City than in the other districts. Households and
individuals within the City therefore benefit more equally from regional growth.
13 2017 Socio-economic Profile: City of Cape TownHUMAN DEVELOPMENT
The United Nations uses the Human Development Index (HDI) 1 to assess the relative level of
socio-economic development in countries.
0,8
0,6
HDI
0,4
0,2
0
City of Cape West Coast Cape Overberg Eden Central Karoo Western Cape
Town Winelands
2010 2011 2012 2013 2014 2015 2016
Source: Global Insight, 2017
Despite increasing levels of income inequality across the Western Cape, overall human
development appears to gradually be on the increase in all districts. Although the HD Index in
the City has slightly decreased between 2015 (0.7448) and 2016 (0.7394), it is significantly higher
than any other district.
INDIGENT HOUSEHOLDS
The constraining macro-economic climate is expected to impact heavily on the various
municipal areas of the Western Cape, especially in rural communities where an economic
downturn will result in significant job losses across. Rising unemployment figures will
subsequently result in a decrease in expendable household income which, coupled with rising
inflation rates, will force many families into poverty. Municipal services will ultimately become
unaffordable, resulting in these households becoming reliant on free basic service which will in
turn strain the already limited resources of a municipality.
Area 2014 2015 2016
City of Cape Town 289 294 379 232 377 813
Western Cape 404 413 505 585 516 321
Source: Department of Local Government, 2017
The number of indigent households within the City of Cape Town increased exponentially
between 2014 and 2015, but dropped notably in 2016. Macro-economic challenges are
expected to impact heavily on the City which will increase the number of poor households
going forward.
1 The HDI is a composite indicator reflecting education levels, health, and income. It is a measure of peoples' ability
to live a long and healthy life, to communicate, participate in the community and to have sufficient means to be
able to afford a decent living. The HDI is represented by a number between 0 and 1, where 1 indicates a high
level of human development and 0 represents no human development.
14 2017 Socio-economic Profile: City of Cape Town5
BASIC SERVICE DELIVERY
The Constitution of the Republic of South Africa states that every citizen has the right to access
to adequate housing and that the state must take reasonable legislative and other measures
within its available resources to achieve the progressive realisation of this right. Access to
housing also includes access to services such as potable water, basic sanitation, safe energy
sources and refuse removal services, to ensure that households enjoy a decent standard of
living.
This section reflects on housing and basic services access levels (Census 2011) and
the incremental progress municipalities have made hereto within the last 5 years
(Community Survey 2016).
15 2017 Socio-economic Profile: City of Cape TownHOUSEHOLDS
In order to ensure basic service delivery to all, municipal
budget allocations should be informed by credible and
accurate assumptions regarding the number of households
within a municipal area.
Access to formal housing and services in the City of Cape
Town is measured against a total of 1 068 573 households in
2011 and 1 264 849 in 2016 which equates to average annual
growth of 3.4 per cent (39 255 households).
Average Average
Area 2011 2016 annual annual growth
increase 2011 - 2016
City of Cape Town 1 068 573 1 264 849 3.4% 39 255
Western Cape 1 634 000 1 933 876 3.4% 59 975
ACCESS TO HOUSING
SERVICE STANDARD DEFINITION: Households with access to a formal dwelling.
Average Average
Total
annual annual
Area 2011 2016 increase
increase growth
2011 - 2016
2011 - 2016 2011 - 2016
City of Cape Town 78.4% 81.6% 194 965 38 993 4.3%
Western Cape 80.4% 82.4% 280 254 56 051 3.9%
The percentage of households with access to a formal
dwelling within the City of Cape Town increased from
78.4 per cent in 2011 to 81.6 per cent in 2016 which indicates
that housing delivery across the Metro takes place at a faster
rate than the growth in the total number of households. The
number of formal dwellings in the City increased by 194 965
between 2011 and 2016, at an average annual rate of
4.3 per cent, which translates into approximately
38 993 additional formal dwellings per year over this period.
16 2017 Socio-economic Profile: City of Cape TownACCESS TO WATER
Given the Western Cape’s current drought situation, great focus is currently placed on water
availability, supply and quality. Access to safe potable water is essential to prevent the
contraction and spread of diseases and maintaining a healthy life.
SERVICE STANDARD DEFINITION: Households with access to piped water inside the dwelling
or yard or within 200 metres from the yard.
Average Average
Total
annual annual
Area 2011 2016 increase
increase growth
2011 - 2016
2011 - 2016 2011 - 2016
City of Cape Town 99.3% 99.8% 200 521 40 104 3.5%
Western Cape 99.1% 99.0% 294 292 58 858 3.4%
The number of households in the City increased by 196 276 between 2011 and 2016 whilst an
additional 200 521 households were provided with access to piped water. This increase
indicates that the City’s service delivery efforts are keeping up with the demand for water
services. Access to water services subsequently increased from 99.3 per cent in 2011 to
99.8 per cent in 2016. The City’s water-services function will in 2017 become strained as a result
of the ongoing drought.
ACCESS TO SANITATION
Access to sanitation promotes health and dignity through the provision of safe disposal and
treatment of human waste. Where sanitation systems are inadequate, negative health effects
can be extremely serious. The current drought highlights challenges in the use of potable water
within the sanitation services process.
SERVICE STANDARD DEFINITION: Households with access to a flush or chemical toilet
connected to the sewerage system.
Average Average
Total
annual annual
Area 2011 2016 increase
increase growth
2011 - 2016
2011 - 2016 2011 - 2016
City of Cape Town 91.4% 94.3% 216 933 43 387 4.1%
Western Cape 90.5% 94.6% 351 662 70 332 4.4%
The City has made notable progress in terms of extending sanitation services above the
minimum standard to all households - a total of 94.3 per cent of all households enjoy access
to a flush or chemical toilet connected to a sewerage system, up from 91.4 per cent in 2011.
The City’s delivery rate in 2016 does however remain slightly below that of the Western Cape.
17 2017 Socio-economic Profile: City of Cape TownACCESS TO ELECTRICITY
Energy is essential for human life and households generally apply electricity for cooking,
heating and lighting purposes. Energy sources also have usage risks; for example, health and
safety risks especially in the use of paraffin and open flame usage.
SERVICE STANDARD DEFINITION: Households with access to electricity as the primary source
of lighting.
Average Average
Total
annual annual
Area 2011 2016 increase
increase growth
2011 - 2016
2011 - 2016 2011 - 2016
City of Cape Town 94.0% 97.7% 231 672 46 334 4.2%
Western Cape 93.4% 96.5% 340 551 68 110 4.1%
The provision of electricity to households within the City accelerated from 94.0 per cent in 2011
to 97.7 per cent in 2016. An additional 231 672 households were therefore provided with access
to electricity as primary lighting source between 2011 and 2016 which equates to a
4.2 per cent averages annual growth. These increases can largely be attributed to the
enhanced roll-out of the integrated national electrification programme (INEP). Not all of these
households are however necessarily connected to a legal electricity connection. Several
households participating in the 2016 Community Survey indicated that they are connected to
an “other” source.
ACCESS TO REFUSE REMOVAL
Refuse removal is an essential service that ensures that health related problems are kept at
bay. A lack of or inadequate service is likely to result in illegal dumping. There are growing
concerns around the land and environmental limitations in the creation and lifespan of landfill
sites. This would benefit greatly from the ‘reduce – reuse – recycle’ approach, that encourages
non-wasteful consumption practices (reduce), the reuse of products where possible (reuse)
and the recycling of the product where its use in current form has been exhausted (recycle).
SERVICE STANDARD DEFINITION: Households who have solid waste removed by local
authorities at least weekly.
Average Average
Total
annual annual
Area 2011 2016 increase
increase growth
2011 - 2016
2011 - 2016 2011 - 2016
City of Cape Town 94.3% 87.8% 102 942 20 588 2.0%
Western Cape 89.9% 86.8% 211 083 42 217 2.7%
The percentage of total households that enjoy access to refuse removal services at least once
a week in the City of Cape Town decreased notably between 2011 and 2016. Although there
was a net increase in access to refuse removal services across this period, household growth
outpaced the provision of such services.
18 2017 Socio-economic Profile: City of Cape Town6
SAFETY AND SECURITY
The Constitution upholds the notion that everybody has the right to freedom and security of
the person. The safety of persons and property is therefore vitally important to the physical and
emotional well-being of people and business. Without the respect of person and property, it
would be impossible for people to live peacefully, without fear of attack and for businesses to
flourish.
The extent of crime in South Africa does however not only have a significant impact on the
livelihood of citizens, but also affects the general economy. Crime hampers growth and
discourages investment and capital accumulation. If not addressed with seriousness, it has the
potential to derail both social and economic prosperity.
People’s general impressions, as well as official statistics on safety and crime issues, mould
perceptions of areas as living spaces or place in which to establish businesses. The discussion
in this section that follows is limited to the reported contact and property-related crime such
as murder and sexual crimes, as well as crime heavily dependent on police action for
detecting drug-related crimes and driving under the influence of alcohol/drugs.
Note: Percentage change calculation will differ from the actuals reflected due to rounding
down to per 100 000 population.
Data source: The data depicted in the following section was sourced from the 2017 Crime
Statistics released by the South African Police Service (SAPS) in October 2017. Incidences of
crime per 100 000 were calculated using actual crime and estimated population figures
provided by SAPS. Also note that although the crime data contained in the following section
is for ease of reference depicted as a single calendar year, it is in actual fact referring to
criminal activity within a financial year i.e. incidences of murder for 2016 is referring to
occurrences within the period April 2016 to March 2017.
The information relating to fatal crashes and crash fatalities were sourced from the
Department of Transport and Public Works.
19 2017 Socio-economic Profile: City of Cape TownMURDER
Area 2016 2017 % Change
City of Cape Town
59 59 -0.4
(per 100 000)
Western Cape
50 50 0.5
(per 100 000)
Definition: Murder is a social contact crime resulting in the loss of life of the victim, but excludes
cases where the loss of life occurred as a result of a response to a crime, for example
self-defence.
Area 2016 2017 % Change
Although incidences of murder per 100 000 people in the City of Cape Town remain relatively
unchanged between 2016 and City of Cape
2017, Town number of murders across this period did
the actual 59 59 -0.4%
(per 100 000)
indeed decrease slightly. Greater City of Cape Town area decreased ever so slightly between
2016 and 2017. The murder rate per 100 000
Western people in the City is higher than in any other district
Cape
50 50 0.5%
of the Western Cape. The murder (per rate
100 000)
in the Western Cape remained unchanged at
50 incidences per 100 000 population between 2016 and 2017.
SEXUAL OFFENCES
Area 2016 2017 % Change
City of Area
Cape Town 2016 201759 % Change
59 -0.4%
(per 100 000)
City of Cape
Western Town
Cape 100
50 96 50 -4.00.5%
(per
(per 100
100 000)
000)
Western Cape
111 108 -2.3
(per 100 000)
Definition: Sexual offences includes rape (updated to the new definition of rape to provide for
the inclusion of male rape), sex work, Area 2016
pornography, public indecency 2017
and % Change
human trafficking.
The rate of sexual violence in South
City ofAfrica
CapeisTown
amongst the highest in the world. In addition, a
Area 2016
59 2017
59 % Change
-0.4%
(per often
number of sexual offence incidences 100 000)
go unreported (as in the case of rape).
City of Cape Town
The number of reported cases ofWesternsexual Cape
offences per 100 000
50 people in 50
100 the City decreased
96 -4.0%
0.5%
(per
(per 100
100 000)
000)
from 100 incidences in 2016 to 96 in 2017 (4.0 per cent decrease). In turn, sexual offences in the
Western Cape as a whole decreased Western Cape
slightly from 111 incidences per 100 000 people-2.3%
in 2016
111 108
(per 100 000)
to 108 in 2017 (2.3 per cent decrease). The City also had the lowest sexual offences rate
amongst all the districts in the Province.
Area 2016 2017 % Change
City of Area
Cape Town 2016 2017 % Change
59 59 -0.4%
20 (per 100 000)
2017 Socio-economic Profile: City of Cape Town
City of Cape
Western Town
Cape 100
50 96
50 -4.0%
0.5%
(per 100 000)
(per 100 000)DRUG-RELATED CRIMES
Area 2016 2017 % Change
City of Cape Town
1 468 1 613 9.9
(per 100 000)
Western Cape
1 461 1 633 11.8
(per 100 000)
Definition: Drug-related crimes refers to the situation where the perpetrator is found to be in
possession of, under the influence of, or selling illegal drugs. This is a crime detected through
police activity rather than reports by members of the public. An increase in crimes of this nature
may therefore reflect an increase in police.
Drug-related crimes have a negative impact on human development by degrading the
quality of life as it infiltrates all aspects of society including families, health, the work
environment and the economy. It is very concerning to note that drug-related offences
increased considerably between 2016 and 2017 in both the City of Cape Town (9.9 per cent)
and the Western Cape as a whole (11.8). At 1 613 reported cases per 100 000 people in 2017,
drug-related crimes within the City is lower than in any other district in the Western Cape.
DRIVING UNDER THE INFLUENCE
Area 2016 2017 % Change
City of Cape Town
196 219 11.5
(per 100 000)
Western Cape
182 196 7.6
(per 100 000)
Definition: DUI refers to a situation where the driver of a vehicle is found to be over the legal
blood alcohol limit. This is a crime detected through police activity rather than reports by
members of the public.
Despite concerted efforts by government, our roads are still considered amongst the most
dangerous in the world. Reckless driving and alcohol consumption remain the top reason for
road accidents. The number of cases of driving under the influence of alcohol or drugs per
100 000 people in the City increased by 11.5 per cent from 196 incidences in 2016 to 219 in
2017. This increase is concerning, especially heading into the festive period. The number of DUI
cases across the Western Cape as a whole increased notably from 182 reported cases in 2016
to 196 in 2017 (7.6 per cent).
21 2017 Socio-economic Profile: City of Cape TownRESIDENTIAL BURGLARIES
Area 2016 2017 % Change
City of Cape Town
671 620 -7.5
(per 100 000)
Western Cape
739 700 -5.3
(per 100 000)
Definition: Residential burglary is defined as the unlawful entry of a residential structure with the
intent to commit a crime, usually a theft.
Given its regular occurrence and the psychological impact on victims, residential burglaries
are an obstinate concern in South Africa. It is relieving to note that residential burglaries are on
the decrease within the City of Cape Town – the number of burglaries per 100 000 people
decreased from 671 reported cases in 2016 to 620 in 2017 which amounts to a 7.5 per cent
decrease. Similarly, burglaries across the Western Cape as a whole decreased from 739 cases
in 2016 to 700 in 2017, a 5.3 per cent decrease.
FATAL CRASHES
Area 2015 2016 % Change
City of Cape Town
708 720 1.7
(per 100 000)
Western Cape
1 202 1 228 2.2
(per 100 000)
Definition: A crash occurrence that caused immediate death to a road user, i.e. death upon
impact, flung from the wreckage, burnt to death, etc.
Above graphic indicates that in 2015 there were a total of 708 fatal crashes involving motor
vehicles, motorcycles, cyclists and pedestrians within the Cape Metro. This number increased
by 1.7 per cent to 720 in 2016. The number of fatal crashes in the broader Western Cape
increased by 2.2 per cent from 1 202 crashes in 2015 to 1 228 in 2016.
22 2017 Socio-economic Profile: City of Cape TownROAD USER FATALITIES
Area 2015 2016 % Change
City of Cape Town 725 748 3.2
Western Cape 1 357 1 397 3.0
Definition: The type of road user that died in or during a crash i.e. driver, cyclist, passengers,
pedestrians.
According to a recent study, the majority of road fatalities in Africa fall within the working age
cohort - between the ages of 15 – 44 years – whilst three out of four fatalities were found to be
male (Peden et al., 2013). The untimely death of these primary breadwinners therefore impacts
directly upon not only the livelihood of family structures, but deprive society of active
economic participants that contribute towards growth and development. The
socio-economic impact of such road fatalities has proven to be particularly devastating in
South Africa where the majority of road users hail from poor and vulnerable communities.
The previous section specified that a total of 720 fatal crashes occurred within the Cape Metro
area in 2016. A total of 748 road users succumbed in those crashes. This is 23 more deaths than
the 725 recorded in 2015 which equates to a 3.2 per cent increase in road user fatalities.
Additional, lower-level information regarding the time, location, gender, ages of above
specified crashes are available from the Department of Transport and Public Works upon
request.
23 2017 Socio-economic Profile: City of Cape Town7
THE ECONOMY
Economic growth at the municipal level is essential for the attainment of economic
development, the reduction of poverty and improved accessibility. Fostering this growth
requires an in-depth understanding of the economic landscape within which each respective
municipality operates.
Most municipalities within the Western Cape are currently experiencing hydrological drought
conditions where the severe weather is affecting groundwater levels in natural springs, streams,
reservoirs and dams to the extent that potable water has reached alarmingly low levels. An
overview of the current economic reality facing the municipalities of the Western Cape would
therefore not be complete without elaborating on the manner in which the drought impacts
upon the short and medium term financial and economic sustainability of local authorities.
24 2017 Socio-economic Profile: City of Cape TownECONOMIC SECTOR PERFORMANCE
The City of Cape Town’s economy contributed 71.8 per cent to the Western Cape’s GDP in
2016. The economy maintained an average annual growth rate of 2.9 per cent since 2005
whereas the Western Cape’s growth across this period was 3.0 per cent. The City was in the
post-recessionary period (2.5 per cent across 2010 – 2015) not able to recover to its long-term
growth trend average. GDP growth across this period was also slightly below the provincial
average of 2.6 per cent.
The largest contributor to GDPR within the Metro in 2015 was the Tygerberg planning district
(17.8 per cent), an area dominated by finance, insurances, real estate and business services.
Despite its large contribution to GDPR, the district maintained moderate average annual
growth of 2.4 per cent between 2005 and 2015 which was notably lower than the Metro’s
average (2.9 per cent) across the same period. The nature of activities within the Tygerberg
planning district area makes the local economic extremely susceptible to external fluctuations
– the current constraining macroeconomic environment impacts heavily on subsector
activities, evident from the fact that the Tygerberg planning district is expected to only grow
at 0.3 per cent in 2016, the lowest GDPR growth rate amongst all the other planning districts
contributing to the Metro’s economy. The fastest growing area within the City of Cape
between 2005 and 2015 was the Blaauwberg planning district, growing at a rate of
4.2 per cent which was considerably higher than the Metro’s average across the same period.
This area also maintained the highest growth rate for the period 2010 - 2015 (3.8 per cent).
Below table reflects the extent to which the various sectors contributed towards the GDPR of
Cape Town.
Contribution
Trend Real GDPR growth (%)
to GDPR (%)
Sector 2015 2005 - 2015 2010 - 2015 2011 2012 2013 2014 2015 2016e
Primary Sector 1.5 3.1 3.9 4.0 3.2 4.8 7.5 0.1 -4.8
Agriculture, forestry and fishing 1.3 3.7 4.1 4.2 3.5 5.0 7.6 0.0 -4.6
Mining and quarrying 0.2 -0.1 3.1 2.7 1.5 3.2 69 1.1 -6.0
Secondary Sector 23.6 1.9 1.3 2.8 2.1 1.4 0.2 0.1 0.2
Manufacturing 15.0 1.6 1.2 3.4 2.2 0.9 -0.4 -0.3 0.8
Electricity, gas and water 3.0 -0.7 -0.5 1.9 -0.2 -0.9 -1.2 -1.9 -5.0
Construction 5.6 5.2 2.8 1.1 2.7 4.6 3.1 2.3 0.3
Tertiary Sector 74.9 3.2 2.8 4.3 3.0 2.8 2.1 1.9 1.2
Wholesale and retail trade, 16.9 2.6 2.7 4.2 3.8 2.3 1.6 1.5 1.2
catering and accommodation
Transport, storage and 11.6 2.6 2.2 3.3 1.9 2.2 2.9 0.5 0.4
communication
Finance, insurance, real estate 27.8 3.8 3.0 4.5 2.9 2.6 1.8 3.1 1.6
and business services
General government 11.8 3.9 3.8 6.2 3.6 4.7 3.2 1.1 1.5
Community, social and 6.7 2.0 1.8 1.9 2.1 2.3 1.7 0.7 0.1
personal services
Total Cape Town 100 2.9 2.5 3.9 2.8 2.5 1.8 1.5 0.9
Western Cape 100 3.0 2.6 3.8 2.9 2.6 2.2 1.5 0.7
25 2017 Socio-economic Profile: City of Cape TownThe economy in Cape Town is dominated by tertiary sector activities, which contributed
approximately 74.9 per cent to GDPR in 2015. This sector maintained a 3.2 per cent average
annual growth rate across the period 2005 to 2015 which was not only above that of the
greater Metro area, but the Province as a whole. Consideration of the post-recessionary period
indicates that the sector has been recovering well, maintaining average annual growth of
2.8 per cent since 2010. Despite this average, the sector’s growth has been tapering off in
recent years and is expected to only be 1.2 per cent by 2016.
Although the secondary sector contributed 23.6 per cent of the GDPR of the Cape Metro in
2015, the sector has historically grown at 1.9 per cent (2005 – 2015), a sluggish pace far below
the average of the Cape Metro (2.9 per cent) and the Western Cape (3.0 per cent) across this
period. The secondary sector is however expected to grow by 1.2 per cent in 2016 which is
above that of the Metro (0.9 per cent) and the Western Cape (0.7 per cent).
Primary sector activities contribute the least to the Cape Metro area’s economy compared to
the secondary and tertiary sectors. The Cape Metro’s geographical area is to a large extent
urban, which significantly limits the potential for agricultural activities. The primary sector has
however been the fastest growing sector in the Cape Metro since 2010, maintaining average
annual growth of 3.9 per cent. This sector recorded aggressive growth in 2013 and 2014 before
contracting dramatically in 2015 largely as a result of a decrease in global commodity prices
as well as the drought, the full extent of which will be felt towards the end of 2017.
From a subsector performance perspective, the economy of the Cape Metro is largely driven
by the activities within the finance, insurance, real estate and business services (27.8 per cent
contribution to GDPR), wholesale and retail trade, catering and accommodation
(16.9 per cent) and the manufacturing (15.0 per cent) subsectors. These subsectors collectively
contributed 59.7 per cent to the GDPR of the Cape Metro area. It was however the agriculture,
forestry and fishing subsector that maintained the highest annual average growth rate
(4.1 per cent) in recent times (2010 – 2015). As however mentioned previously, the primary
sector, which is essential driven by agricultural activities, is expected to have contracted
significantly in 2016.
26 2017 Socio-economic Profile: City of Cape TownLABOUR
The number of people employed in Cape Town was in 2015 estimated to be approximately
1 563 297 which equates 63.1 per cent of all employment in the Western Cape. Considering
the large concentration of economic activity within the City, it was to be expected that the
Metro would as a whole continue to create jobs in the post-recessionary period. Employment
creation in the Metro continued to grow during 2016, albeit at a significantly lower rate than
in 2015, which is in line with the decline in economic growth for this period.
As an alternative data source, please consult the results of Statistics South Africa’s Quarterly
Labour Force Survey (QLFS) for the 3rd Quarter of 2017. According to the QLFS, the City’s
labour force amounted to 2 012 000 people during the period June to September 2017 of
which 1 545 000 were formally employed. The City’s unemployment rate was therefore
estimated to be 23.2 per cent. This is slightly higher than the 22.7 per cent recorded for the
previous quarter (April – June 2017).
Below table reflects the employment growth trends within each economic sector contributing
to the Cape Metro economy.
Contribution to
employment Number Trend Employment (net change)
(%) of jobs
Sector 2015 2015 2005 - 2015 2010 - 2015 2011 2012 2013 2014 2015 2016e
Primary Sector 2.5 39 677 -980 10 769 -144 3 329 2 737 -963 5 810 170
Agriculture, 2.5 38 858 -726 10 972 -145 3 297 3 032 -984 5 772 162
forestry and
fishing
Mining and 0.1 819 -254 -203 1 32 -295 21 38 8
quarrying
Secondary Sector 19.4 303 019 -6 754 14 117 1 320 247 4 997 3 329 4 224 2 041
Manufacturing 10.7 167 231 -36 529 -9 026 -2 688 -5 052 2 189 -3 904 429 -1 288
Electricity, gas 0.4 5 770 1 800 806 243 223 76 63 201 148
and water
Construction 8.3 130 018 27 975 22 337 3 765 5 076 2 732 7 170 3 594 3 181
Tertiary Sector 78.1 1 220 601 275 647 147 571 24 413 26 276 36 831 29 750 30 301 6 999
Wholesale and 24.5 382 476 89 585 46 657 9 234 10 665 7 991 8 060 10 707 3 001
retail trade,
catering and
accommodation
Transport, storage 6.2 96 415 29 102 14 636 902 4 299 4 719 -671 5 387 -5 734
and
communication
Finance, 19.8 309 114 39 336 21 576 3 929 2 016 5 244 1 408 8 979 3 102
insurance, real
estate and
business services
General 13.0 202 759 55 727 22 941 8 923 3 956 3 288 11 569 - 4 795 4 318
government
Community, 14.7 229 837 61 897 41 761 1 425 5 340 15 589 9 384 10 023 2 312
social and
personal services
Total Cape Metro
100.0 1 563 297 267 913 172 457 25 589 29 852 44 565 32 116 40 335 9 210
area
Source: Quantec Research, 2017 (e denotes estimate)
27 2017 Socio-economic Profile: City of Cape TownIt is evident that the majority of people employed within the City are concentrated within the
tertiary sector in 2015. The subsectors within the tertiary sector contributing the most to
employment in the Cape Metro area include the wholesale and retail trade, catering and
accommodation (24.5 per cent), finance, insurance, real estate and business services
(19.8 per cent) and the community, social and personal services (14.7 per cent) subsectors.
These subsectors collectively contributed 59.0 per cent towards all employment within the City
and created 63.8 per cent of all new jobs in the Metro between 2010 and 2015.
The secondary sector has over the last decade (2005 – 2015) shed a large number of jobs
(6 754), but recovered well in recent times to create an additional 14 117 employment
opportunities (2010 – 2015). Secondary sector employment is largely influenced by the
manufacturing subsector which, despite its significant contribution to GDPR, only employed
10.7 per cent of working individuals within the City. This subsector shed 36 529 jobs between
2005 and 2015. This can be attributed to the below average growth of the sector in terms of
GDPR, but also due to increased mechanisation in the manufacturing sector due to rising
labour costs. This subsector is expected to shed 1 288 jobs in 2016.
The agriculture, forestry and fishing sector in 2015 only employed 2.5 per cent of the total labour
force. This sector created 10 769 new job opportunities between 2010 – 2015) created a
significant number of jobs.
Area 2006 2007 2008 2009 2010 2011 2012 2013 2014 2015 2016e
City of Cape Town 18.8 18.4 17.6 18.1 18.5 18.8 19.2 18.8 19.3 20.0 21.0
West Coast 7.2 7.6 7.9 8.5 8.7 9.2 10.1 10.4 11.0 11.3 11.7
Cape Winelands 9.0 9.2 9.2 9.8 9.8 10.1 10.7 10.6 10.9 11.2 11.6
Overberg 10.0 10.3 10.2 10.9 11.0 11.4 12.1 12.0 12.4 12.8 13.5
Eden 16.0 16.1 15.5 15.9 16.1 16.5 17.0 16.6 17.1 17.8 18.7
Central Karoo 20.6 20.9 20.7 21.0 20.8 21.2 22.0 21.6 22.1 22.6 23.2
Western Cape 15.8 15.7 15.3 15.8 16.1 16.4 17.0 16.7 17.2 17.8 18.7
Source: Quantec Research, 2017 (e denotes estimate)
Unemployment has gradually been on the increase within the City of Cape Town since 2013 2.
At 21.0 per cent, the unemployment rate in the Metro is only surpassed by that of the Central
Karoo at 23.2 per cent. The City’s unemployment rate is notably higher than that of the Western
Cape as a whole (18.7 per cent).
At 31.8 per cent, the Khayelitsha/Mitchells Plain Planning District recorded the highest
unemployment rate in the Cape Metro area during the reference period. This district however
in recent times experienced exponential employment growth (49 924 additional job
opportunities created since 2010) which attests of a larger labour force which cannot be
absorbed by the market. The increasing labour force can in turn be attributed to labour
migration.
2 Stats SA, as an alternative data source, estimates that the City’s unemployment rate actually improved in 2015 and
2016.
28 2017 Socio-economic Profile: City of Cape Town8
INFRASTRUCTURE DEVELOPMENT
As economic theory and empirical work suggest that public investment in infrastructure will
boost economic growth by stimulating related private sector investments – the so-called
“crowding-in effect” – as well as providing a solid foundation for social development
(Swilling, 2006). In South Africa the importance of infrastructure has not only been emphasised
at national level but also at regional level. The Western Cape Government’s main infrastructure
budgets and investment, both in social and economic infrastructure over the 2017 MTEF,
includes spending by provincial government departments and public entities; as well as
spending on public private partnerships.
In the Western Cape, the region needs efficient transport systems, water and sanitation,
telecommunications and power supplies in order to influence the standard of living of their
populations and regional economic growth. There is, thus, a pressing need to determine
whether government’s strategy on infrastructure investment will yield the desired economic
growth benefits at micro (i.e. project or sector level) or at national or macro level.
.
29 2017 Socio-economic Profile: City of Cape TownPROVINCIAL INFRASTRUCTURE SPEND
In fulfilment of Provincial Strategic Goal 1 (PSG 1: Grow the economy and create jobs), the
Western Cape Government has dedicated R28.0 billion towards infrastructure development
across the 2017 Medium Term Expenditure Framework (MTEF). This amount will be spent on new
assets, replacements assets maintenance and repairs, upgrades and additions, rehabilitation,
renovation as well as the refurbishment of existing assets (Western Cape Estimates of Provincial
Revenue and Expenditure, 2017). Of this total, an amount of R26.1 billion has been set aside
for physical infrastructure developments whilst R231.0 million and R1.7 billion will respectively
be channelled towards broadband connectivity and public private partnerships.
The total Provincial Infrastructure budget for 2017/18 amounts to R8.6 billion which will be split
amongst the various municipal districts by taking into consideration a wide array of
socio-economic variables, most notably anticipated population growth trends as well as
estimated economic growth potential, the latter being influenced largely by the 2014 Growth
Potential Study of Towns (Donaldson et al., 2014). Below graph depicts the spatial distribution
of provincial infrastructure spend for the 2017/18 financial year.
West Coast
R731.5 million
Overberg 9% Across districts
R416.0 million R2.6 billion
5% 30%
Eden
R1 billion
12%
Cape Winelands
City of Cape Town R1.3 billion
R2.4 billion Central Karoo 15%
28% R127.7 million
1%
Source: Provincial Treasury, 2017
The City of Cape Town assumes the majority of the Western Cape’s infrastructure allocations
with an estimated infrastructure spend of R2.4 billion (28.0 per cent of Provincial allocation).
The Cape Winelands region is another notable receiver of Infrastructure funding with
approximately R1.3 billion (15.0 per cent of Provincial allocation) allocated from the Provincial
Government.
30 2017 Socio-economic Profile: City of Cape TownYou can also read