CITY OF TSHWANE STATE OF DEVELOPMENT AND CHALLENGES
←
→
Page content transcription
If your browser does not render page correctly, please read the page content below
“We, the people of South Africa,
                                            Recognise the injustices of our past;
                                            Honour those who suffered for justice and freedom in our land;
                                            Respect those who have worked to build and develop our country; and
                                            Believe that South Africa belongs to all who live in it, united in our diversity.

                                            We therefore, through our freely elected representatives, adopt this Constitution as the supreme law of
                                            the Republic so as to -
                             CHAPTER 2      Heal the divisions of the past and establish a society based on democratic values, social justice and
                                            fundamental human rights;
                                            Lay the foundations for a democratic and open society in which government is based on the will of
CITY OF TSHWANE STATE OF DEVELOPMENT        the people and every citizen is equally protected by law;
                                            Improve the quality of life of all citizens and free the potential of each person; and
                           AND CHALLENGES   Build a united and democratic South Africa able to take its rightful place as a sovereign state in the
                                            family of nations.

                                            May God protect our people.
                                            Nkosi Sikelel’ iAfrika. Morena boloka setjhaba sa heso.
                                            God seën Suid-Afrika. God bless South Africa
                                            Mudzimu fhatutshedza Afurika. Hosi katekisa Afrika.”
                                            										South Africa Constitution 1996

TSHWANE VISION 2055   38                                                                                                        39   TSHWANE VISION 2055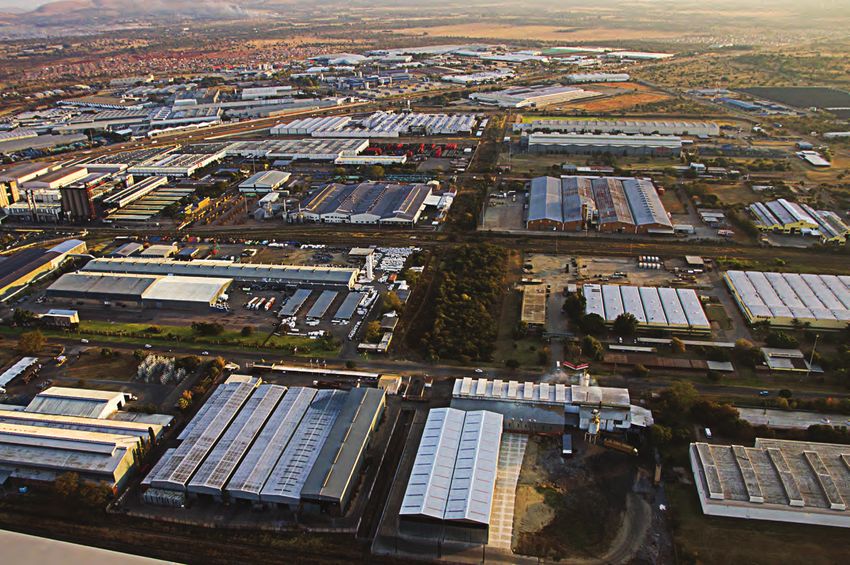
•   While the province of Gauteng is the smallest of South Africa’s nine provinces, it
                                                                                                 is the most densely populated province. It is home to at least 24% of South Africa’s
                                                                                                 population which is approximately 12.3 million people27.

                                                                                             •   The City of Tshwane’s population increased from 2.1 million people in
                                                                                                 2001 to 2.9 million in 201128 and is projected to continue increasing over
                                                                                                 time due to migration of people from the surrounding provinces to Gauteng in
                                                                                                 search of economic opportunities albeit at a slower rate. Also, the
                                                                                                 City of Tshwane’s population can in part be explained by the incorporation of the
                                                                                                 Metsweding region and its local municipalities.

                                                                                             •   The world’s population is younger than ever before. However, many cities are not
                                                                                                 able to adequately provide economic opportunities for their young people29. In the
                                                                                                 City of Tshwane, the population distribution indicates a ‘youth bulge’ as the majority
                                                                                                 of the City’s population is mainly made up of young people (35 years and younger).

                                                                                             •   Considering the high numbers of young people in the City of Tshwane, addressing
                                                                                                 urban youth-related issues – unemployment, education, security and participation –
                                                                                                 undoubtedly presents one of the most critical development challenges for the City

Chapter 2 provides an in depth analysis of the City of Tshwane’s state
of development, opportunities and challenges.

Key messages:
  • Urbanisation has been a defining phenomenon in this century with predictions
     that there will be significant increases in population in cities on the Asian and
     African continents by the year 205025. Cities are precisely where the pressures
     of migration,globalisation, economicdevelopment, social inequality, environmental
     pollution, and climate change all come together.

  •    The growth in urban population in South Africa implies an increasing urgency for
       the development of infrastructure in South African cities that can support this
       increase in population. This is particularly relevant for the influx of
       people in Gauteng City Region which is regarded as an economic
       engine of South Africa26. Therefore, moving into the future there is a need for
       economic infrastructure investment that will enable economic growth
       and development.
TSHWANE VISION 2055   40                                                                                                                                            41   TSHWANE VISION 2055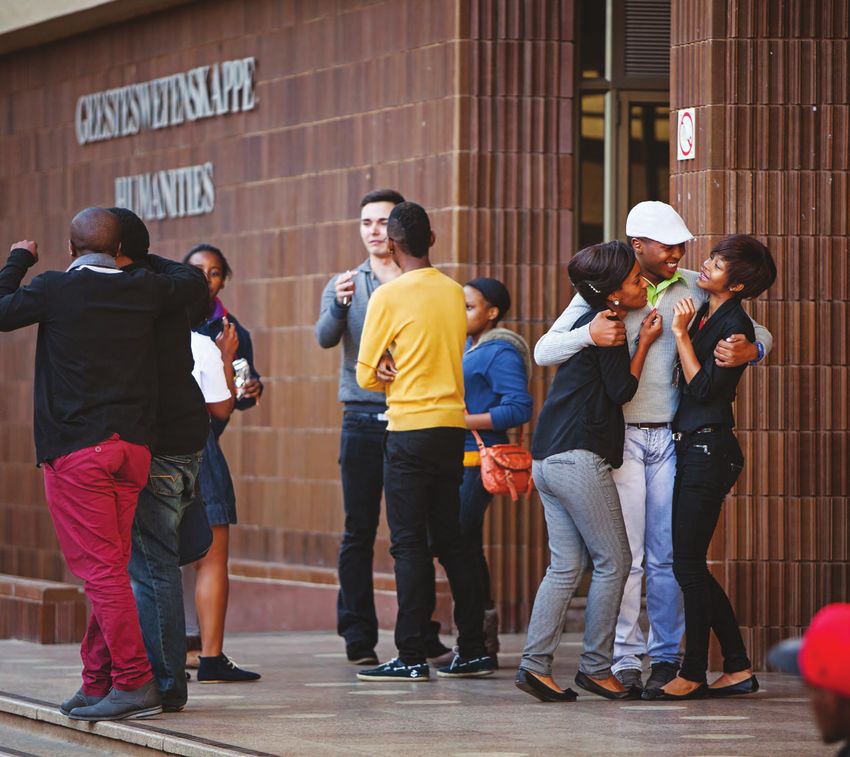
An estimated 90% of all research and development in South Africa is conducted in the City of Tshwane by
                           institutions such as Armscor, Medical Research Council, the Council for Scientific and Industrial Research, the
                           Human Sciences Research Council and higher educational institutions

TSHWANE VISION 2055   42                                                                                             43   TSHWANE VISION 2055
INTRODUCTION
                                                                                                                          As part of the continued commitment of the South African government to continue improving service delivery
                                                                                                                          and ensuring economic growth to all its citizens, the Municipal Demarcations Board resolved to re-determine the
                                                                                                                          boundaries of Metsweding District, Nokeng Tsa Taemane Local, Kungwini Local and City of Tshwane Metropolitan
The City of Tshwane is named after Chief Tshwane. It is the indigenous name of the area that was used by the early        Municipalities so that they would form a new single metropolitan municipality effective from 18 May 2011 (see Figure
inhabitants who lived in the proximity of the Tshwane River, under the chieftainship of Chief Tshwane. According          2.2). Today, the City of Tshwane covers approximately 35% of the total land area of Gauteng’s 18 178 km²,33 has 7
to historical accounts, Chief Tshwane was the son of Chief Mushi. The latter had moved from the present day               Administrative Regions, 105 wards and 210 Councillors.
KwaZulu-Natal and settled in Pretoria before the arrival of the Voortrekkers, the Afrikaans-speaking migrants who
moved from the Cape.                                                                                                      Figure 2.2 The City of Tshwane municipal boundary, 2011

Pretoria (which is now the central business district and surrounding area of the greater Tshwane Metropolitan
Municipality) was declared the capital city and seat of government of the Republic of South Africa during the
liberation struggle. On 9 August 1956, a year after the historic signing of the Freedom Charter, Pretoria was to be
the stage for the Women’s Anti-Pass March to the Union Buildings. This was only one of many demonstrations to
come, which would eventually see the dawn of a new and free South Africa. It was at this same Union Buildings
that Nelson Mandela, the first democratically elected President of South Africa, made his inaugural speech on 10
May 1994.

The ‘new’ South Africa inherited by the first democratically elected government presented a complex myriad of both
challenges and opportunities at the political, governance, economic development and access to services levels30.
Significantly, the legacy of the apartheid would actually be that it had created one of the most unequal societies with
income and poverty disparities affecting South Africa’s Black majority the most31. In fact, the rainbow nation of 1994
was not one country united, but could aptly be seen as two nations – “one White and privileged with a standard
of living comparable to that of the industrialised countries, and the other, Black and poor with a standard of living
comparable to that of developing countries32.”

Like any other government institution, the City of Tshwane prior to 2000 mirrored the reality of the new South
Africa: spatial fragmentation; skewed service delivery towards specific localities (to the exclusion of the majority);
poor education and health standards for the broader population, and socio-economic inequalities that reflected an
economy in crisis, among others.

There was certainly a need to change the laws, institutions and leadership of the government. Since then, the
government has set out to rigorously
dismantle the apartheid system
and to create an equal, democratic
society. Municipalities in South Africa
which are regarded as the coalface
of development were faced with                                                                                            As part of repositioning and re-branding the new City of Tshwane, a new slogan has been adopted - “Igniting
this daunting reality of tackling the                                                                                     excellence” aimed at developing a culture of excellence in everything that the City does. In this changing world, it
legacy of apartheid while at the same                                                                                     is important that the City of Tshwane maintains its commitment to continuously improve the quality of life for all its
time, gear up to buffer against the                                                                                       residents while simultaneously advancing the City’s competitiveness and marketability to the global market.
challenges of globalisation.

A key milestone in our history was
the amalgamation of the municipality
with 13 other smaller municipalities
on December 5, 2000 to form the
new City of Tshwane Metropolitan
Municipality (see Figure 2.1). This
amalgamation was not simply an
exercise in spatial integration; more
importantly, it was a deliberate step
towards reconciling the residents of
this City and developing an integrated
economic base to deepen socio-
economic transformation. The City
adopted the slogan “Re a Tshwana”
which means, “We are the same,” to
signify unity.

TSHWANE VISION 2055   44                                                                                                                                                                                               45    TSHWANE VISION 2055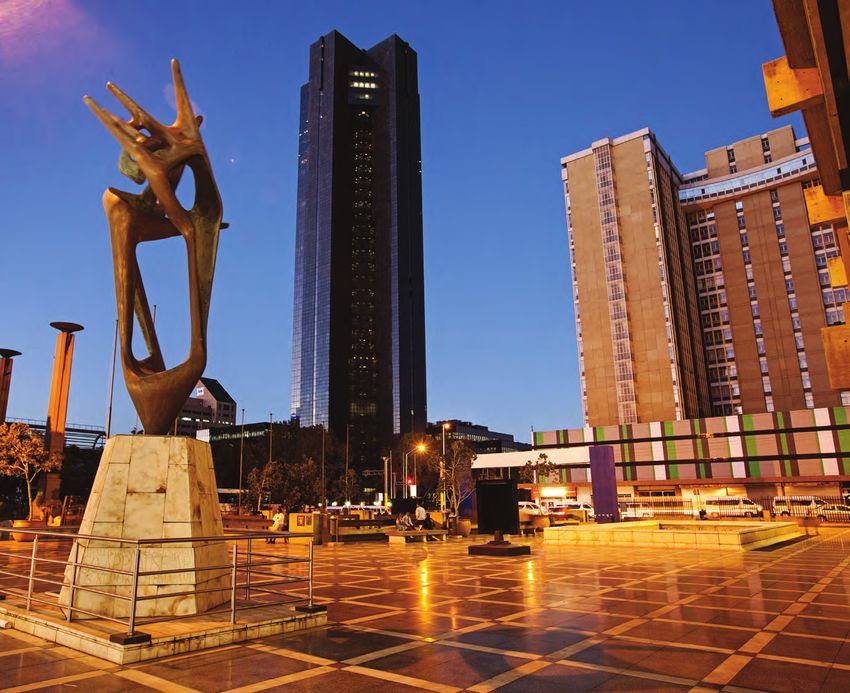
CITY OF TSHWANE REGIONALISATION                                                                                          Thus, the Regions’ role has been conceived as being both administrative and functional in monitoring day-to-day
                                                                                                                         operations related to service delivery37. The approach is developmental in the sense that the Regions coordinate and
                                                                                                                         monitor the matching of interventions implemented through City departments with local (Regional) needs.

MODEL                                                                                                                    Going forward, the seven Regions will be the main implementation anchor for Tshwane Vision 2055’s programme
                                                                                                                         of action. The Regional Spatial Development Frameworks (RSDFs) for the City’s 7 Regions will need to translate
Given the enormity of the developmental gap that must be addressed and the multiplicity of programmes and                the Tshwane Vision 2055 at Region level and link it to Regional development strategies. This would entail Regions
projects that must be implemented and to improve service delivery, the City of Tshwane has created 7 administrative      identifying game changing interventions that would support the attainment of Tshwane Vision 2055 and leading
Regions (see Figure 2.3). This alternative service delivery model – ‘Regionalisation’ is a multi-dimensional approach    the investment drive to ensure that Tshwane Vision 2055 is achieved. The same will be expected of other City of
to service delivery.                                                                                                     Tshwane Municipal-owned entities.
Figure 2.3 City of Tshwane 7 Administrative Regions, 2011                                                                An overview of each Region is presented in this document based on the detailed analysis provided in the annually
                                                                                                                         updated Regional Spatial Development Frameworks that are available on the City’s website38. In addition, a summary
                                                                                                                         of key data is presented for each Region39.

                                                                                                                         Region 1

                                                                                                                         Region 1 is situated in the north-western
                                                                                                                         part of the City and comprises of three
                                                                                                                         main zones. These include a southern
                                                                                                                         zone (Akasia, Rosslyn and Pretoria
                                                                                                                         North), a northern zone (Klipkruisfontein,
                                                                                                                         Ga-Rankuwa, Mabopane, Winterveld
                                                                                                                         and Soshanguve areas) and the rural
                                                                                                                         zone in the west. There are 28 wards
                                                                                                                         in this Region. The Region is home to
                                                                                                                         the Tswaing Crater, which is a national
                                                                                                                         heritage site and nature reserve.

                                                                                                                         The northern part of the Region
                                                                                                                         accommodates a third of the City’s
                                                                                                                         population in low-income settlements
                                                                                                                         that includes subsidised housing and
                                                                                                                         informal settlements. There is limited
                                                                                                                         economic and employment opportunities with a low standard of public transport infrastructure. The southern part
                                                                                                                         represents medium- to high-income areas with the economy largely driven by the private sector. Single, low-density
                                                                                                                         residential housing is dominant in the area with high levels of service provision. The automotive cluster in the Rosslyn
                                                                                                                         area is situated within the central section of the Region and is an important employment node for the City.
Regionalisation has led to the strengthening of the cluster approach system of the City through which better
coordination and alignment of functions can be achieved and allow the City to organise itself better, bring government   The dominant land use types in Region 1 are industrial, mixed use with about 80% of the City’s total land allocation
closer to the people, and to improve service delivery throughout the regions of the City34.The adoption of the           for manufacturing found in Region 1.
regionalisation model has resulted in health services, waste management, library, sports, culture and recreating,
horticulture, customer care and cemeteries being devolved to the Regional Service Centres35.                             Region 1 Profile

The regionalisation concept was adopted to36:
                                                                                                                         Population							811 575
•      Ensure decentralised delivery of municipal services;                                                              Number of households					227 828
•      Provide accountable government to communities;                                                                    Number of formal dwellings					                                  187 447
•      Facilitate a customer-centric service delivery orientation;
                                                                                                                         Average household Size					                                           3.6
•      Promote accelerated prioritised targeted development (within the Region);
•      Promote service integration across functional lines;                                                              Households with access to piped water (tap) 			                  220 749
•      Facilitate Councillor interaction with City of Tshwane administration;
                                                                                                                         Households with access to electricity for lighting		             205 780
•      Provide effective governance;
•      Bring local government closer to the people;                                                                      Average annual household income				                              R10225
•      Provide customers with greater accessibility (e.g. customer centres closer to the community);                     Households with no income					                                    37 611
•      Address past shortcomings - uneven development prioritisation – with a focus on developed areas (i.e.
       South); racially segregated governance; centralisation – with resultant inaccessibility; inefficiencies; and      Persons employed in formal sector				                            175 284
•      Allow for the benefits of cross-subsidisation.                                                                    Persons with no schooling					                                    37 909

TSHWANE VISION 2055   46                                                                                                                                                                                                47    TSHWANE VISION 2055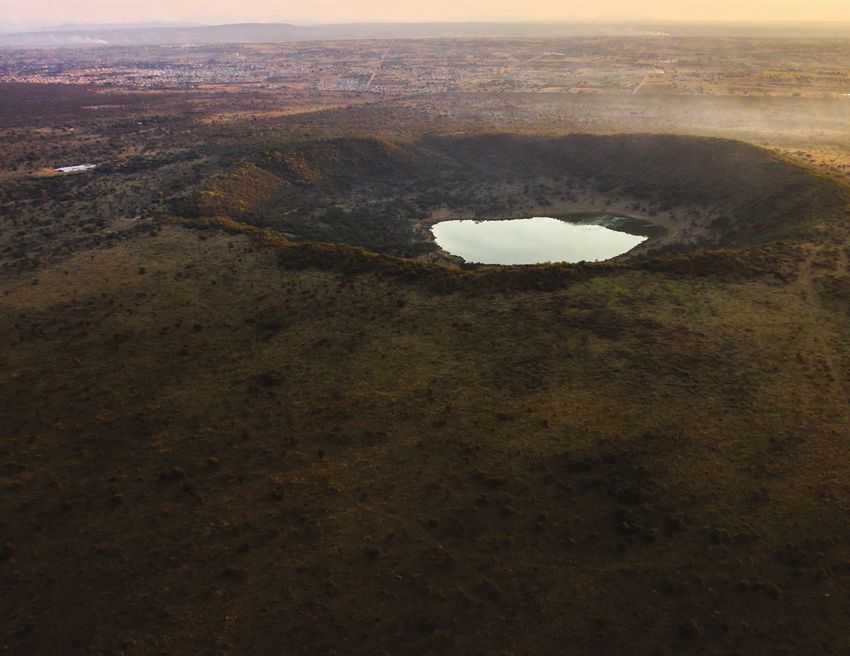
Region 2 Region 3 also includes other prominent land uses of strategic significance to the City that include: the Inner City,
Marabastad, Embassies, Nelson Mandela Development Corridor, Church Square, Brooklyn Metropolitan Node,
Region 2 has three main zones – the urban Hatfield Metropolitan Node, Pretoria Industrial Township (including the Charlotte Maxeke Street and Soutter Street
north zone, central and eastern agriculture and industrial areas), Fresh Produce Market, Capital Park Container Depot, and the Steve Biko Academic Hospital.
conservation zones, and the southern zone. There
are a total of 12 wards in Region 2. The Region,
while urban in character, is not integrated with The south eastern area of the Region accommodates middle and higher income groups while most of the low
the larger urban environment of the City. The income groups are located in the west while high density residential developments are to the east of the Inner City
central and eastern parts of the region fall outside in Sunnyside and Arcadia. The Region contains some of the oldest townships in the greater Tshwane.
the urban edge and are rural in character with a
low population density while the southern part Phase 1 of the TRT (Tshwane Rapid Transit) bus system is currently being constructed and will link Hatfield with the
of Region 2 is a low density formally developed CBD. The Region is generally well provided with service infrastructure. With development rapidly moving closer to
suburban area, with well-developed nodes of the provincially demarcated urban edge and towards the open space area to the west of the region, development
economic activity. The Wonderboom airport is also pressure in this area is the rate at which bulk infrastructure can be provided to accommodate expansion.
situated in Region 2.
The Region is characterised by low density settlements, with concentrations of subsidised housing and informal Region 3 Profile
settlements, limited economic activities, poor network of social infrastructure, limited retail facilities, limited investment
by the private sector, and major backlogs in infrastructure provision. The Region includes a few prominent land Population 585 159
uses of strategic significance to the City of Tshwane and even on an international level that include Onderstepoort
Number of households 195 126
Veterinary Research Institute, Zone of Choice, and the Dinokeng / Big Five Reserve.
Number of formal dwellings 169 761
Region 2 Profile Average household Size 3.0
Households with access to piped water (tap) 190 568
Population 339 182
Number of households 93 788 Households with access to electricity for lighting 182 999
Number of formal dwellings 74 864 Average annual household income R188 354
Average household Size 3.6 Households with no income 32 516
Households with access to piped water (tap) 85 558 Persons employed in formal sector 183 940
Persons with no schooling 13 323
Households with access to electricity for lighting 87 983
Average annual household income R124 763 Region 4
Households with no income 14 699
Region 4 with 11 wards is situated in the south-
Persons employed in formal sector 72 689
western portion of the City. The Region borders on
Persons with no schooling 16 461 the area of jurisdiction of the City of Johannesburg
Metropolitan Municipality, Ekurhuleni Metropolitan
Municipality as well as Mogale City to the west.
Region 3 The Region, served by both north-south and east-
west first order roads (highways), links it to the rest
Region 3 has a total of 23 wards that includes of Gauteng and the broader region. The Region
the central business district (CBD) of the consists of an urban area to the east and a rural
City, the Brooklyn, and Hatfield metropolitan area to the west both of which are currently under
nodes. The eastern two-thirds of the region is pressure for development.
mostly urbanised whereas the western third
is mostly rural.
The region hosts National Government The current dominant sectors in Region 4
offices and forms the administrative heart of are finance and business services, general
government with two of the three Tshwane Government services, manufacturing, and trade.
stations of the Gautrain located in the region. The Region also forms part of an area of economic
Three landmark sites - the Union Buildings, expansion to the north of Johannesburg where
the Voortrekker Monument and the Freedom this sub-node is dominated by smart industries
Park National Legacy site are located in this and business tourism. The Region falls within the
Region. economic core identified for Gauteng Province
with the legs of the triangular core the N1 Highway
TSHWANE VISION 2055 48 49 TSHWANE VISION 2055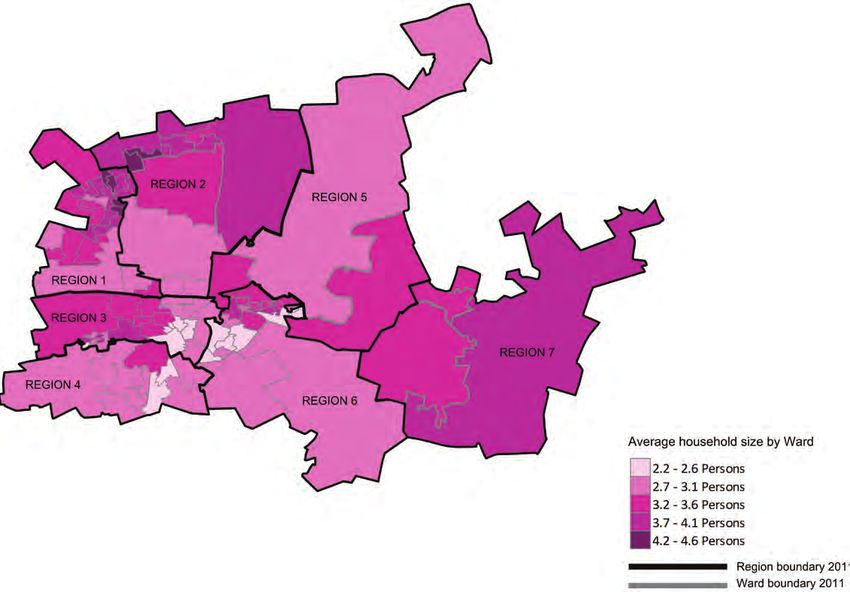
on the western side and the R21 Highway with its linkage to the Oliver Tambo International airport on the eastern         areas use groundwater and on-site sanitation of which septic tanks with soakways and self-constructed pit toilets
side.                                                                                                                     are the most common.

The Region includes a few prominent land uses of strategic significance to the City of Tshwane. These include:            Region 5 Profile
Zwartkop and Waterkloof Military Airports, Thaba Tshwane/ Voortrekker Hoogte Military Base, Centurion Metropolitan
Core, Centurion Gautrain Station, Super Sport Park, Highveld Technopark, Highway Business Park, Route 21                  Population						                                                90 900
Corporate Park, Sunderland Ridge Industrial Area, N1 Corridor, Samrand Commercial Area Gateway development,               Number of households					27 603
Olievenhoutbos Absa Housing development, and Centurion Aviation Village.
                                                                                                                          Number of formal dwellings					                                 19 027
A higher percentage of higher income earners reside in Region 4 with the result that many offices and retail              Average household Size					                                        3.3
functions have relocated to the region during the past few years. The Region is generally well provided with service
                                                                                                                          Households with access to piped water (tap) 			                 26 155
infrastructure. With development rapidly moving closer to the development edge and demarcated urban edge to
the west of the region, development pressure in this area challenges the rate at which bulk infrastructure can be         Households with access to electricity for lighting		            20 880
provided to accommodate expansion.
                                                                                                                          Average annual household income			                           R120 507
Region 4 Profile                                                                                                          Households with no income					                                   3 759
                                                                                                                          Persons employed in formal sector				                           23 566
Population						                                                379 347                                                   Persons with no schooling					                                   3 895
Number of households					131 736
Number of formal dwellings					                                 105 935                                                   Region 6
Average household Size					                                          2.9
                                                                                                                          Region 6, bordered by the N1 freeway to the
Households with access to piped water (tap) 			                 125 604                                                   west and Ekhuruleni Local Municipality to the
Households with access to electricity for lighting		            113 853                                                   South has 24 wards. It is the Region with the
                                                                                                                          greatest development pressure. Almost all the
Average annual household income			                            R296 014                                                    developable land within the southern section
Households with no income					                                   14 026                                                   of the Region has been developed and the
                                                                                                                          uncontrolled development in the old Kungwini
Persons employed in formal sector				                           127 086                                                   area places a burden on the existing saturated
Persons with no schooling					                                    9 389                                                   road infrastructure.

Region 5                                                                                                                  The south-eastern section of this Region has
                                                                                                                          the highest income per capita, but here is also a
Region 5, bordered by the N1 to the west and the                                                                          huge concentration of people in the north-east
N4 freeway to the south, has rather weak spatial                                                                          quadrant with no to low income. The north-
structure characterised by heavy through traffic,                                                                         eastern section of the Region accommodates
vast open spaces, small economic centres and                                                                              mostly low- income communities and industrial
enormous development pressure from residential                                                                            land uses. The middle and south-western section of the Region accommodates medium to high-income areas with
areas from Tshwane pushing further and further                                                                            large institutional uses. Although population densities in the south-eastern section of the region are relatively low,
eastward.                                                                                                                 this part of the Region has the highest percentage of group housing developments compared to any other Region.

Region 5 is a rural area characterised by                                                                                 Much development has taken place further to the east in the last decade and the road network development has
nature conservation (including the Dinokeng                                                                               not kept up with land development resulting in severe congestion during the peak hours. There is a lack of north-
Blue IQ project of Gauteng), tourism and                                                                                  south link roads in the Region. Sufficient east-west roads exist due to the historic role and function of the CBD. The
mixed agricultural land uses. Mining, especially                                                                          northern section of the Region is well served by commuter rail with an east-west commuter line and stations from
in Cullinan provides work opportunities for                                                                               Mamelodi in the east, through Hatfield to Pretoria Station.
communities in the area.
                                                                                                                          Bulk water supply is adequate throughout the region except for the undeveloped parts of Nellmapius and Willow Park/
The Region includes a few prominent land                                                                                  Willow Brae. The southern portion of the Region is generally well provided with engineering service infrastructure.
uses of strategic significance to the City. These                                                                         The challenge in terms of service provision is to phase development in the adjacent old Kungwini area through bulk
include: Cullinan Mine, Dinokeng Nature Reserve, Cullinan Town centre                                                     services.

Region 5 has large water and sanitation services backlogs. This ranges from a need to upgrade the current
infrastructure and creating new infrastructure in the different municipal wards. The need is mainly reflected in the
informal settlements that are spread out within the various wards. Informal settlements, though small and relatively
contained, are spread throughout the area, forming low-income residential enclaves. The Townships of Rayton,
Cullinan and Refilwe are currently the only areas that are serviced with sewer borne sanitation. The entire Kameeldrift
area (Kameeldrift, Derdepoort, Roodeplaat, and surrounding areas) do not have sewer borne sanitation. The rural

TSHWANE VISION 2055   50                                                                                                                                                                                               51    TSHWANE VISION 2055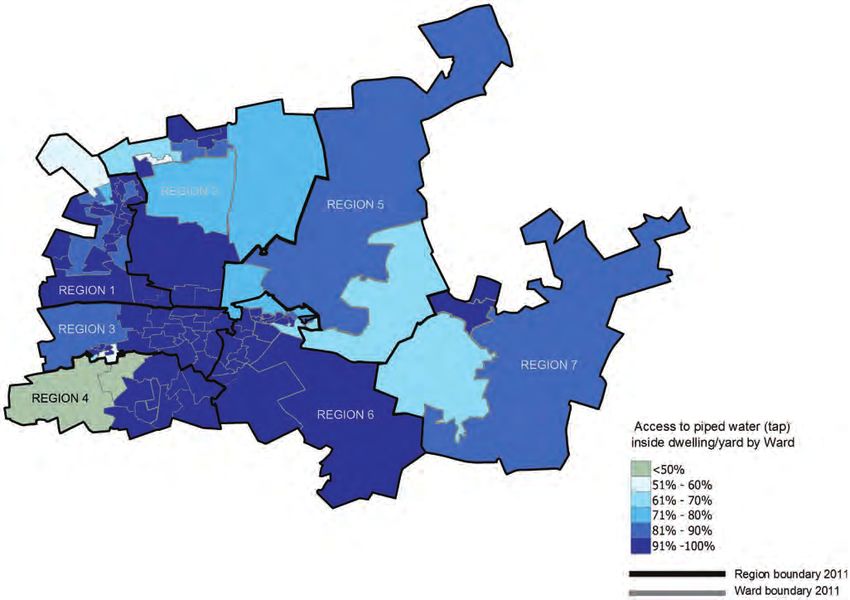
The Region contains a number of strategic land uses including the CSIR, South African National Intelligence Service,
Silverton, Waltloo, Koedoespoort industrial areas and the Menlyn Park Retail Node which has a metropolitan function
in terms of facilities. The economic base for Region 6 is balanced between the retail, office sector in the southern   Region 7 Profile
and western sections, with commercial, warehousing, wholesale or industrial activities in the north of the Region.
                                                                                                                       Population						                                     109 767
Region 6 Profile                                                                                                       Number of households				                              31 547
Population						                                               605 556                                                 Number of formal dwellings				                        23 896
Number of households					203 907                                                                                       Average household Size					                              3.5
Number of formal dwellings					                               158 216                                                  Households with access to piped water (tap) 		        30 455
Average household Size					                                        3.0                                                 Households with access to electricity for lighting    27 846
Households with access to piped water (tap) 		                201 350                                                  Average annual household income			                   R83 172
Households with access to electricity for lighting            167 839                                                  Households with no income					                         4 298

Average annual household income			                           R194 063                                                  Persons employed in formal sector			                  24 528
Households with no income					                                 28 736                                                  Persons with no schooling					                         7 755

Persons employed in formal sector			                          194 428
Persons with no schooling					                                 18 859

Region 7

Region 7 has the second largest geographical land area and has 4 wards. The area contains some of the best farming
land in Gauteng with more than 80% of land arable, but agriculture currently makes an insignificant contribution
(less than 5%) to the City’s economy. The most significant contributors to the Region’s economy are manufacturing,
services, financial, and trade. The tourism sector is
regarded as small, but a developing sector.

The Region includes a few prominent land uses of
strategic significance to the City of Tshwane. These
include: Bronkhorstspruit town area, Ekandustria
industrial area, Bronkhorstspruit dam, and high
potential agricultural land in the Region.

Public transport in rural areas, in particular, non-
motorised transport (bicycles and walking), play
a special role when short distances are travelled
and are also the most popular forms of mobility
used by communities. Services are concentrated
in the established townships in the urban areas.
A significant number of people in the area do not
receive piped water, sanitation, and electricity
services.

TSHWANE VISION 2055   52                                                                                                                                                              53   TSHWANE VISION 2055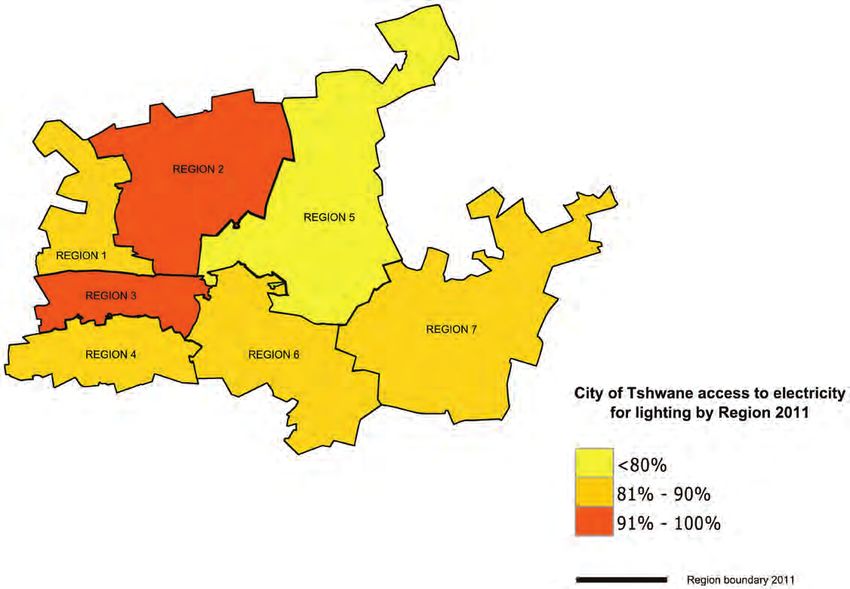
Figure 2.4 City of Tshwane population distribution by age group and sex, 2011

                                                                                                                       Interestingly, Gauteng Province saw a population growth rate decrease from 3.6% between 1996 and 2001 to 2.7%
                                                                                                                       between 2001 and 2011. Similar trends are observed for the City of Tshwane41 where between the periods 1996 -
                                                                                                                       2001 and 2001 - 2011, the population growth rate marginally decreased from 3.6% to 3.1%.

                                                                                                                       Almost half of the world’s 7 billion people are aged 24 or below, with 1.2 billion aged between 10 and 19 years42. It
                                                                                                                       is also estimated that in Africa today, slum dwellers make up more than 70% of the region’s urban population, and
                                                                                                                       the vast majority of them are under the age of 2443.
DEMOGRAPHIC TRENDS                                                                                                     Similarly, the City of Tshwane’s population distribution by age reveals that the City has a relatively young population
To take full advantage of the City of Tshwane’s demographic profile, and to manage risk, it is essential to have an    with about 677 110 people below the age of 14 and a further 1 185 605 between 15 and 34 years of age,
appreciation of key demographic indicators. In this section we look at some key facts and insights about the people    which combined represents about 64% of the City’s population. The extent to which the City of Tshwane can take
living in the City of Tshwane. Unless stated otherwise, the statistics presented in this section are based on Census   advantage of its large youthful population will depend on whether it is able to prioritise programmes to allow them
2011.                                                                                                                  to participate meaningfully in the economy.
Population profile                                                                                                     While the City’s population pyramid shows proportionately more females than males overall, there are proportionately
                                                                                                                       more males in the age groups between 0 to 14 years and between 20 and 44 years. In the age groups from 45 to
The City of Tshwane’s population is 2 921 488. Of the City’s total population, there are proportionately more          49 years right up to the 85+ years, there are proportionately more females.
females (1 468 005) than males (1 453 483) in the City (see Figure 2.4)40.

TSHWANE VISION 2055   54                                                                                                                                                                                             55    TSHWANE VISION 2055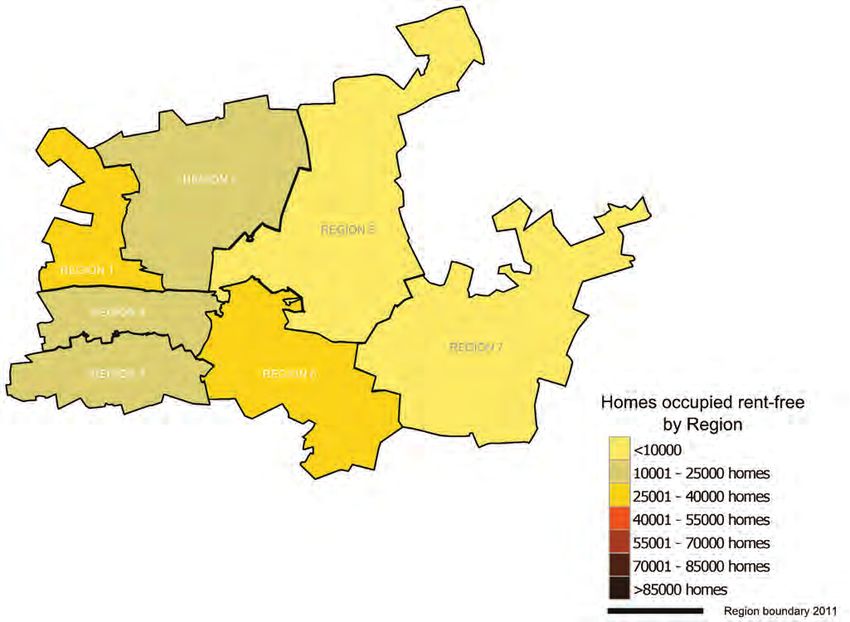
The City’s Regional population distribution by age (see Figure 2.5)44 Figure 2.5 shows that Region 1 is the most   population group and gender, the majority of the City’s population is Black (2 202 849) followed by the White
populated in all age groups (811 575) followed by Region 6 (605 556) and Region 3 (585 159) respectively. Region   population group (586 498).
5 is the least populated (90 900) with Region 7 having a marginally higher population of 109 767. The population
distribution by age group follows a similar trend.                                                                 Figure 2.645 City of Tshwane population by Region, gender and population group, 2011

Figure 2.5 City of Tshwane population distribution by Region and age group, 2011                                   Region           Black African             Coloured                  Indian African
                                                                                                                                            Male Female       Male         Female       Male           Female
                                                                                                                   1                      377908      391560         1569          1613           973           501
                                                                                                                   2                      136973      143077           866          911           983           555
                                                                                                                   3                      187425      188223         5191          5782         5996           5670
                                                                                                                   4                       97100        90615        3492          3833        16362          16348
                                                                                                                   5                       34277        29032        3616          3811           245           196
                                                                                                                   6                      219745      208303        13012         14242         2661           2654
                                                                                                                   7                       48995        40616          436          413           393           199

                                                                                                                   The majority of Black males and females live in Regions 1 (769 468), 6 (428 048) and 3 (375 648) with the least
                                                                                                                   living in Region 5 (63 309). There are more Coloured males and females in Region 6 (27 254) than elsewhere in the
                                                                                                                   City. The Indian or Asian population group by gender mainly resides in Region 4 (32 710) and Region 3 (11 666).
                                                                                                                   More White males and females live in Region 3 (181 114) but there are almost as many in Regions 4 (148 265) and
                                                                                                                   6 (139 825).

                                                                                                                   Age dependency ratio profile

                                                                                                                   The City’s dependency ratio provides key insights about the burden carried by the economically active segment
                                                                                                                   (15 – 64 years) of the population. Two dependency ratios are of interest – the child dependency ratio and the adult
                                                                                                                   dependency ratio.

                                                                                                                   The child dependency ratio for the City of Tshwane is 32.2 while the adult dependency ratio is 6.8 resulting in the
                                                                                                                   total dependency ratio of 39 people per 100 economically active people. This means that every 100 people in the
                                                                                                                   economically active age group have to care for 39 people, 32 of those under the age of 15 and 7 older than 65
                                                                                                                   years. The City’s dependency ratio is comparable to that of the Province, which marginally increased from 38.7 in
                                                                                                                   2001 to 39.0 in 201146.

Figure 2.6 shows the Regional population by race and gender. In terms of the City’s population distribution by

TSHWANE VISION 2055   56                                                                                                                                                                                      57    TSHWANE VISION 2055
Language profile Figure 2.8 City of Tshwane individual monthly income by Region, 2011
In terms of languages, Sepedi is the most widely spoken language at home within the City followed by Afrikaans,
Setswana and English (see Figure 2.7)”47.
Figure 2.7 City of Tshwane language profile, 2011
3%
9%
2% 19%
Afrikaans
2%
0% English
IsiNdebele
IsiXhosa
IsiZulu
9% Sepedi
15%
Sesotho
Setswana
Sign language
6%
SiSwati
5% Tshivenda
2% Xitsonga
8% Other
The highest numbers of people with no income are found in Regions 1 (369 286), 6 (227 984) and 3 (200 653). The
20% City has very few individuals with a monthly income greater than R204 801. The highest number of these individuals
resides in Region 3 (1584) followed by Regions 4 (1455) and 5 (1439). Interestingly though, Region 1 despite having
the highest number of people with income has the fourth highest number of individuals – 615 – earning more than
R204 801 a month.
A Regional comparative analysis reveals that Sepedi is the main language spoken at home in Regions 1 and 6
compared to Afrikaans. Afrikaans is the main language spoken at home in Regions 3 and 4 compared to Sepedi.
About 89 074 people living in the City speak other languages possibly reflecting the significant foreign presence in
the City.
Poverty and inequality
While there are several approaches to measuring poverty, the Gini coefficient is a common indicator used. The
coefficient measures the “extent to which the distribution of income or consumption expenditure among individuals
or households within an economy deviates from a perfectly equal distribution48”. Thus, 0 represents perfect equality
(where there is equal income for everyone) while 1 represents perfect inequality (where one person has all the
income).
According to the Gauteng Provincial Government Socio-Economic Review and Outlook Report of 2012 Gauteng’s
Gini Coefficient was 0.60 in 2000 and 0.64 in 201049. Furthermore, the report indicated that compared to other
municipalities in the province, City of Tshwane had the lowest levels of poverty in 2010 with a rate of 22%50 and also
had the highest human development index (together with the City of Johannesburg) at 0.6951.
Income is a commonly used indicator of level of poverty. Figure 2.8 2052 shows individual monthly income in the City
of Tshwane by Region.
TSHWANE VISION 2055 58 59 TSHWANE VISION 2055There are a significant number of City of Tshwane households with no income or low income levels. Poverty in The Regional analysis (see Figure 2.9a) reveals that Region 1 has the lowest regional average annual income of less
the City of Tshwane is concentrated in certain areas (see Figure 2.9a and 2.9b53) that generally have had unequal than R10225 followed by Region 7 with an average annual income of R83172. Regions 5 and 2 have average annual
development or access to services in the past. household incomes of R120507 and R124763 respectively. On the other end of the spectrum, Region 4 has the
highest regional average annual household income of R296014 followed by Region 6 (R194063) and 3 (R188354).
Figure 2.9a City of Tshwane average annual household income by Region, 2011
At Ward-level (see Figure 2.9b), it is evident that the concentration of Wards with low average annual household
incomes are located in Regions 1 and 2. Ward 24 which is part of Region 1 has the lowest average annual household
income of R27989.
It is important to note that the use of income level as a poverty indicator while useful, does not offer a deep
understanding of the issue. Rather, a multidimensional view of poverty will provide this understanding. Under the
multidimensional54 view, poverty is made up of several factors that constitute a person’s experience of deprivation.
The factors that contribute towards the deprivation might include a combination of the following: the extent to
which one can adequately access health, water and sanitation, education, housing, decent work opportunities,
income, is empowered or feels safe and secure, for example. Thus, given the competencies that local government
is responsible for, it is expected that the City of Tshwane has a direct impact on whether one experiences deprivation
in varying levels.
Education profile
The human capacity development in the City of Tshwane depends on in part, access to and completion of education
(see Figure 2.10)55 as well as how the education system is able to develop knowledge and skills for its needs.
Figure 2.10 City of Tshwane education profile, 201
Figure 2.9b City of Tshwane average annual household income by Ward, 2011
TSHWANE VISION 2055 60 61 TSHWANE VISION 2055Overall, in the City of Tshwane there has been a marginal increase in the number of people between the ages of
5 and 24 years attending school from 71.4% in 2001 to 72.4% in 201156. Figure 10 shows the overall education
attainment levels for the City.
Migration
The Gauteng Province is the most populous province in South Africa as it is perceived by many South Africans and
individuals from neighbouring countries to be a province of opportunity. For this reason, large numbers of people
migrating from other South African provinces57 and neighbouring African countries are recorded58.
While the Gauteng Province inter-provincial net migration was a gain, although at lower figure of 566 760 people in
2011 compared to 901 622 people in 2001, it still had higher net migration gains compared to all the other provinces
in the country59. In the City of Tshwane, Census 2011 data reveals that of the City’s 2,9 million population, 110 000
people were born in the SADC, 58 120 in the rest of Africa, 7 200 in the United Kingdom and European Union, 6
500 in Asia, 170 in North America and a further 690 in Latin America and the Caribbean. About 160 500 residents
did not specify their place of birth. About 25 000 moved from the City of Tshwane according to Census 2011 data.
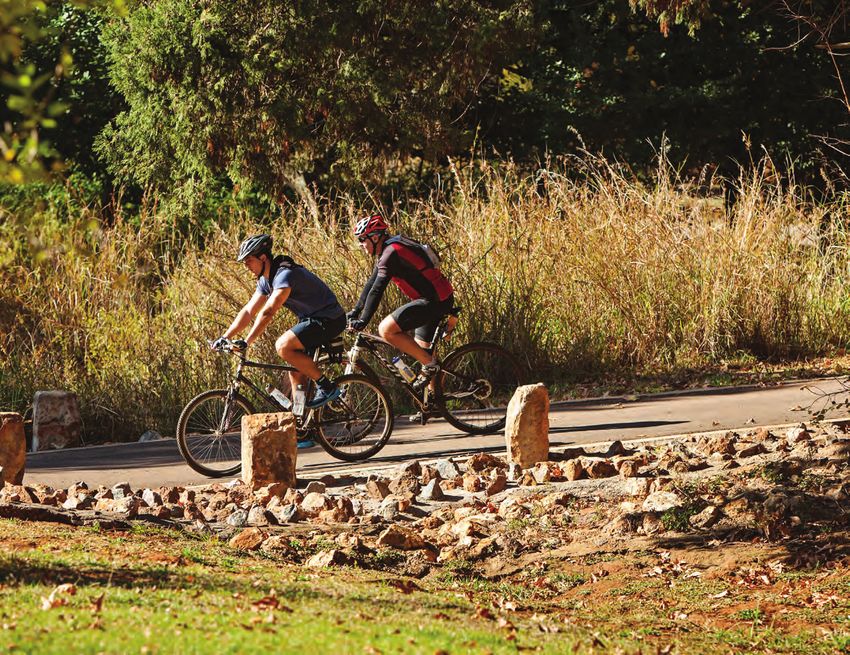
© Dajo Associates/Lucinda du Toit
HOUSEHOLD AND HOUSING PROFILE
Number of households and household size
The City has about 911 536 households with the majority of the households found in Region 1 followed by Region
6 (see Figure 2.11)60.
TSHWANE VISION 2055 62 63 TSHWANE VISION 2055Figure 2.11 – City of Tshwane total number of households by Region, 2011 Figure 2.12a City of Tshwane average household size by Region, 2011
Figure 2.12b City of Tshwane average household size by Ward, 2011
The average household size (see Figure 2.12a and b)61 is 3.2 people for the City. However, while the average
household size for the City is 3.2, about 41 800 households have a household size of 6 people mainly in Region 1
with about 3600 households in Region 1 with 10 or more people in a household.
TSHWANE VISION 2055 64 65 TSHWANE VISION 2055Female and child headed households A total of 326 113 of the 911 536 households are headed by women, representing 35.8% of households in the City of Tshwane. This figure is marginally above the Gauteng Province average of 34.3%62. Region 1 has the highest number of women headed households with 87 361 followed by Regions 3 and 4 respectively. Regions 5 has the lowest number of women headed households with 8 328. There are about 29 100 households headed by children between the ages of 10 and 14 in South Africa of which about 3 700 are in Gauteng63. A distressing statistic is that of the 29 100 child headed households, about 11 600 of those households are headed by children aged 10. The City of Tshwane has about 1000 child headed households. A similar trend is observed within the City of Tshwane, where 424 households are headed by children aged 10 followed by 180 households headed by children aged 14. Tenure status Figure 2.1364 presents the tenure status of dwellings in the City of Tshwane. In terms of tenure status, about 307 000 houses are owned and fully paid for by the owner(s). The main tenure status for Region 1 is that about 116 000 houses owned are fully paid off while in Regions 3, 4 and 6 the main tenure status is that rental. A further 166 840 are owned, but not yet paid off. A significant number of houses – 291 590 are rented with an interesting finding that about 121 700 houses are occupied rent-free. Figure 2.13 City of Tshwane tenure status by Region, 2011 TSHWANE VISION 2055 66 67 TSHWANE VISION 2055
The majority of dwellings by type in the City of Tshwane are formal structures built with brick or concrete material
(see Figure 2.14)65

Figure 2.14 City of Tshwane main dwelling type by Region, 2011

While it is encouraging to see that the City has mainly formal structures, the City of Tshwane, however has an
unacceptable number of informal dwellings in backyards or informal/squatter settlements. About 51 850 informal
dwellings are found in backyards of which the highest numbers are found in Regions 1 (11 571), 4 (13 001) and 7 (14
                                                                                                                             OUR ECONOMY
005). In informal/squatter settlements or on farms, about 112 170 informal dwellings are found across all Regions            Gauteng is South Africa’s engine for growth. In 2012, Gauteng contributed 35.7% to South Africa’s GDP.67 In terms
with the highest in Regions 1 (26 716), 2 (14 627), 3 (18 519), 4 (10 431), and 6 (30 374).                                  of contribution to Gauteng’s economy, the City of Tshwane accounted for 27.72% of GDP in 2012, a slight decrease
                                                                                                                             from 28.13% in 201068 – largely attributed to the residual effects of the 2008-2009 global economic downturn. The
Statistics show a strong correlation between the number of informal households units and also the households units           City of Tshwane accounted for 9% of South Africa’s total gross value add (GVA). In terms of the City’s trade position,
that do not have income in the City. It is most likely that the majority of the people who live in informal dwelling units   the City had a trade surplus of R101.3 billion in 201269. In addition, the City of Tshwane contributes approximately
do not have access to regular income and thus possibly constitute the majority of people who moved into the City             16% to South Africa’s total national trade.
from other areas in search of employment opportunities.
                                                                                                                             Sector analysis
Household goods66
                                                                                                                             Further economic performance analysis (see Figure 2.15) reveals that the government, social and personal services
The percentage of households in the City of Tshwane with a radio reduced from 79.5% in 2001 to 70.6% in 2011,                sub-sector accounted for the largest single share of the GVA followed by the finance and business service sub-
which could be explained by the significant increase in the percentage households with televisions from 69.5% in             sector70. The City of Tshwane’s proximity to a number of airports and important rail and road links makes it ideal for
2001 to 81.8% in 2011. Furthermore, the percentage of households with Internet access in 2011 was 51.4% - the                business and for import and export.
highest in Gauteng with access to a computer in a household increasing from 18.4% in 2001 to 37.6% in 2011.
The percentage of households with a landline decreased sharply to 18.9% in 2011 from 35.4% in 2001 with a                    The City’s main economic sector is the community services sector which has seen a steady increase between 2006
corresponding significant increase in cellphone access to 95% in 2011 from 50.4% in 2001 – the highest in Gauteng.           and 2011. The finance, transport, trade and manufacturing sectors are other major contributors. A worrying trend
                                                                                                                             is the steady slow-down of the City’s manufacturing sector over the period and which is reflective of global trends,
                                                                                                                             but remains an important sector for the City. The other sectors in the City electricity, mining and agriculture – have
                                                                                                                             remained relatively constant with respect to their contribution.

                                                                                                                             Unemployment

                                                                                                                             Unemployment figures in Tshwane in the past 10 years reveal that unemployment peaked in 2002, reaching 321
                                                                                                                             478 unemployed people, and eventually dropped down to the lowest figures in 2008. For a number of reasons
                                                                                                                             including the 2008/2009 recession, the number of unemployed people increased from 212 671 in 2008 to 272 450
                                                                                                                             in 2010, representing a 28.1% increase over that period. However, the City recorded the lowest unemployment rate
                                                                                                                             of 14% in 2010 when compared to other municipalities in the Province71.

TSHWANE VISION 2055   68                                                                                                                                                                                                 69    TSHWANE VISION 2055
Census 2011 data72 put the unemployment rate in the City of Tshwane at 24%. Youth unemployment in the City was
at 32.6% – a decrease from 40.5% in 2001. In terms of sector distribution, Census 2011 revealed that about 830 Figure 2.16 City of Tshwane households with access to electricity for lighting, cooking and energy for select
815 people are employed in the formal sector with about 107 490 employed in the informal sector and just under energy sources by Region, 2011
139 000 employed in private households.
ACCESS TO SERVICES
In 2012, the City of Tshwane announced plans to raise R10 billion on the capital market over the next five years to
fund bulk infrastructure development to unlock major economic activity in the City. The City has made progress in
providing access to services. This is explained in the following sections.
Access to energy
In 2004, South Africa set itself a target of providing access to electricity to 14.5 million households by 2012. Data
from the 2011 Census shows that a significant number of 12.3 million households now have access to electricity for
lighting, cooking and heating (see Figure 2.15 and 2.16).
Figure 2.15 City of Tshwane households with access to electricity for lighting, cooking and energy by Region,
2011:
Within the City of Tshwane, about 807 180 of the 911 536 households have access to electricity for lighting while
about 84 370 households use candles for lighting. It is significant to note that in terms of alternative energy sources,
about 2020 households make use of solar energy for lighting and a further 1 770 make use of gas.
For cooking purposes, the majority of households use electricity for cooking (767 810) followed by paraffin (98 620),
gas (27 610), wood (9 630) respectively, and with about 1 370 households making use of solar.
About 670 240 households use electricity for heating purposes followed by paraffin (42 390), wood (39 000), and
gas (33 510). Importantly, about 3 640 use solar energy for heating purposes with about 114 640 households not
using any energy source for heating needs.
Water and Sanitation
At least 71% of the City of Tshwane’s potable water supply is from the Vaal River System and 29% is supplied from
its own sources. In terms of access to water, Figure 2.1773 shows the City’s households with access to tapped water
inside their dwellings/yards, 7.4% having tapped water on community stands and only 3.4% having no access to
piped water.
TSHWANE VISION 2055 70 71 TSHWANE VISION 2055Figure 2.17 City of Tshwane access to piped water inside dwellings by Ward, 2011 Figure 2.18 City of Tshwane household access to toilet facilities, 2011
The Department of Water Affairs has issued a directive to reduce water losses and improve urban water demand by
at least 15% by 2014. In responding to the directive, the City of Tshwane has approved a programme of augmenting
it us of water supply from its own sources. This involves both direct and in-direct reuse of return flow from waste
water treatment works (WWTW). It is estimated that by using the return flow as a source of water, the City can
reduce its current demand on the Vaal River system from 71% to 54% in the near future. At present the City of Access to quality water and sanitation are important contributing factors for the City’s health and human development
Tshwane has three water treatment plants: Temba water treatment plant at the Leeukraal Dam, Roodeplaat water progress. As such it is imperative that the City continues to ensure that all households have access to these basic
treatment plant at the Roodeplaat Dam, and Rietvlei water treatment plant at the Rietvlei Dam. services.
The City of Tshwane has 10 waste-water treatment plants - Babelegi, Temba, Rietgat, Klipgat, Sandspruit, Rooiwal, Waste management
Zeekoegat, Baviaanspoort, Daspoort and Sunderland Ridge where all the waste water is treated before it is
discharged into the river system in accordance to specified standards and license requirements. Waste management is important for managing the City’s broader environmental aspirations. The waste management
statistics generally indicate that in all the Regions, refuse is mainly collected by the local authority or a private
Census 2011 reveals that in terms of sanitation (see Figure 2.18)74, 698 106 households have access to a flush company, but of concern is the existence of own refuse dumps in the Regions (see Figure 2.19)75.
toilet that is connected to a sewer. The City has a relatively low number of households that are still using the bucket
system, but the City is committed to eradicating this situation completely.
TSHWANE VISION 2055 72 73 TSHWANE VISION 2055Figure 2.19 City of Tshwane refuse collection by Region, 2011
• Lack of NMT facilities and networks, in a safe and secure environment;
• Poor funding of infrastructure maintenance and operational costs;
• Tshwane developed Road Safety Plan for disadvantaged areas; and
• Limited interaction and integration between Metro Police and Traffic Engineering on road safety issues.
The slowness in developing the Tshwane Western Bypass (TWB/PWV 9), a provincial freeway, to improve access
to the west of the City needs to be addressed since the industrial node of Rosslyn cannot reach its full potential.
Currently it forms part of the Gauteng Freeway Improvement Project (GFIP), which has been dogged by poor public
participation on the concept the user-pay principle. PWV9 urgently needs to be removed from GFIP and be given
priority in support of the Tshwane Vision 2022 by all three spheres of government.
As part of the City of Tshwane’s efforts to overcome the present challenges and lay the foundation for a more
effective integrated public transport system, the City has developed a strategic public transport network plan76 to
provide reliable and frequent public transport with acceptable walking distances for commuters. The plan will also
provide Tshwane with a permanent and recognisable public transport framework consisting of radial and circular
routes. To respond to improving mobility, the City of Tshwane has begun the first phase of its bus rapid transit
system ‘A Re Yeng’ which means ‘Let’s go’. Tshwane’s bus rapid transit system was identified as the appropriate
mode of transport to lead the transformation of public transport in the City. It is a high-quality, bus-based transit
system that delivers fast, comfortable and cost-effective urban mobility through the provision of segregated right-of-
way infrastructure, rapid and frequent operations.
Health facilities
The Tshwane health district is one of three metropolitan areas within Gauteng and is situated within the northern-
most part of the province (Tshwane District Health Plan, 2012/13). There are currently 26 community health centres
and clinics managed by the City of Tshwane, 35 Provincial clinics, 12 Community Health Centers, 8 satellite clinics
and 8 mobiles in the Tshwane district. About 96% of all citizens in Tshwane are within a 5km radius of a clinic. In
addition, 24-hour health services are also provided by the district hospitals (Mamelodi West Hospital, Pretoria West
Hospital and the Tshwane District Hospital).
The main challenges we face in the City are the impact of migration; high burden of disease within the most at risk
population; fragmented health system between the public, private and civil society compounded by poor quality
health infrastructure and information systems and health work force shortages; and climate change, for example.
The City has seen a downward trend in the number of people living with HIV and it is further expected that by 2016,
about 7.5% of its population will be living with HIV.
Transport and mobility
The City of Tshwane residents and visitors depend upon an effective transport system to fulfill their daily mobility
needs. An integrated urban transport infrastructure and services are the backbone of an efficient City. Furthermore,
economies that possess greater mobility are often those with better opportunities to develop. The City is faced with
a range of transport challenges. More than half of the transport challenges are fundamentally the results of the poor
land development pattern that occurred in the past. Other challenges include the:
• Reliability, convenience and safety issues with respect to the public transport services;
• Traffic congestion causing delays, increased user costs, fuel consumption, accidents and subsequent
deterrence of investment, especially in the CBD because of over-reliance on private transport;
• Overcrowded public transport facilities;
• Lack of coordinated and integrated public transport modes; and
• Inadequate pedestrian and bicycle facilities to support other mobility modes.
Some of the current practices in the City promote and support private car use that contributes to the City’s
congestion, but may be justified by a lack of a quality public transport system and lack of non-motorised transport
facilities. Currently the following are synonymous with high private motor vehicle usage:
• Developers allowed to provide excessive parking, with no maximum limit;
• Lack of promoting travel demand management measures;
• Until recently non-motorised transport (NMT) focused on captured users, with no active promotion of NMT
as a viable and sustainable alternative mode;
TSHWANE VISION 2055 74 75 TSHWANE VISION 2055OUR ENVIRONMENTAL AND HERITAGE The Tswaing meteorite crater is Gauteng’s best-kept astronomical secret. The Tswaing Meteorite Crater Museum
in Soshanguve, 40 km to the north of the city centre, is the only tourism destination of its kind in Africa. The City of
Tshwane is steeped in a rich cultural heritage intertwined with the South African history. The City is awash with many
RESOURCES
77
fine heritage sites, museums and art galleries. These include the Union Buildings and its spectacular gardens, as
well as the Diamond Hill Battlefield, Voortrekker Monument and Freedom Park among others. The City of Tshwane
is home of the Nan Hua Buddhist Temple, the largest Buddhist temple in the Southern hemisphere and the only one
The City of Tshwane’s geographical location and landscape make for a favourable natural environment to support a
in Africa.
diversity of trees, plants and small wildlife. The City is particularly proud of its natural heritage. The City of Tshwane
is home to the Pretoria National Zoological Gardens; the largest zoo in the country; while our National Botanical
In conclusion, the current spatial structure of Tshwane is such that less affluent areas tend to be found on the
Gardens are spread over 76 hectares. Other parks include Burgers Park, Jan Cilliers Park, Springbok Park, and
peripheral areas of the City. Thus, while City of Tshwane has made strides in improving the quality of lives for
Venning Park/Rose Park.
the residents, certain communities currently do not enjoy access to a full range of services, social amenities and
facilities. The analysis presented in this chapter lays the foundation for the rest of the vision document.
The City became the only city in the world with a big-five game reserve within city boundaries - the 90 000 hectares
Dinokeng Big 5 Game Reserve. It is also home to the first proclaimed game sanctuary in Africa, the 500 ha Groenkloof
Nature Reserve that was proclaimed in 1895. The City also boasts one of the world’s largest urban nature reserves,
the Rietvlei Nature Reserve. This is a unique retreat where many bird and animal species can be viewed on the 3
800 hectares of open grassland.
Other nature reserves include Austin Roberts Bird Sanctuary, Bishop Bird Nature Area, Boardwalk Bird Sanctuary,
Bronkhorstspruit Nature Reserve, Chamberlain Bird Sanctuary, Colbyn Nature Area, Faerie Glen Nature Reserve,
Kallerkop Nature Reserve, Kwaggaspruit Nature Area, Luton Valley Bird Sanctuary, Moreleta Kloof Nature Area,
Struben Dam Bird Sanctuary, Wonderboom Nature Reserve and the Pierre van Rynevekd Nature Area.
TSHWANE VISION 2055 76 77 TSHWANE VISION 2055You can also read