Economic contribution of Deakin University's Geelong Waurn Ponds and Waterfront campuses - Deakin University October 2014 - Deloitte
←
→
Page content transcription
If your browser does not render page correctly, please read the page content below
Economic
contribution of
Deakin University’s
Geelong Waurn Ponds
and Waterfront
campuses
Deakin University

October 2014

Contents
Glossary ................................................................................................................................... iv
Executive Summary ................................................................................................................... 1
1        Background ..................................................................................................................... 6
         1.1       Scope and approach ......................................................................................................... 6
         1.2       Structure of the report ...................................................................................................... 7
2        The value of higher education ......................................................................................... 8
3        Deakin’s local community .............................................................................................. 10
         3.1       Geography ...................................................................................................................... 10
         3.2       Population ...................................................................................................................... 11
         3.3       Economy......................................................................................................................... 12
         3.4       Social indicators .............................................................................................................. 17
4        Deakin student characteristics ....................................................................................... 19
         4.1       The students of Deakin University’s Geelong Waurn Ponds and Waterfront
                   Campuses ....................................................................................................................... 19
         4.2       Where do students live? ................................................................................................. 21
         4.3       Graduate destination survey 2013 .................................................................................. 24
5        Economic contribution of the Geelong campuses .......................................................... 26
         5.1       Approach ........................................................................................................................ 26
         5.2       Direct contribution of the Geelong campuses .................................................................. 28
         5.3       Indirect contribution of the Geelong Campuses............................................................... 29
         5.4       Economic contribution of Deakin’s students .................................................................... 31
         5.5       Total economic contribution ........................................................................................... 33
         5.6       Employment ................................................................................................................... 37
         5.7       Gross Output .................................................................................................................. 38
References .............................................................................................................................. 39
Appendix A – Economic contribution studies ........................................................................... 40
Appendix B – CGE modelling ................................................................................................... 45
Appendix C : Comparison to previous estimates ...................................................................... 47
         Limitation of our work ................................................................................................................. 1

Deloitte Access Economics
Tables Table 1.1 Summary of total economic contribution of the Geelong campuses by region ........... 3 Table 3.1 Population ............................................................................................................... 11 Table 3.2 The Geelong LGA’s GRP by industry (current prices, $m) 2012-13 ............................ 13 Table 3.3 Structural change in the Geelong economy, 2003-2013 ............................................ 13 Table 3.4 Full-time-equivalent employment by industry 2012-13 ............................................ 15 Table 3.5 Weekly income in the Geelong Region, 2011 ............................................................ 17 Table 3.6 SEIFA index of relative socio-economic disadvantage, 2011...................................... 17 Table 3.7 Demographic indicators (population percentages) ................................................... 18 Table 4.1 Key statistics 2013.................................................................................................... 20 Table 4.2 Domestic students by country of birth and language spoken at home ...................... 21 Table 4.3 Term location address .............................................................................................. 22 Table 4.4 Relocating to university ............................................................................................ 22 Table 4.5 Enrolments by socio-economic status (SES) and disability 2013 ................................ 23 Table 4.6 Location of home address ........................................................................................ 23 Table 4.7 Deakin students by general course area ................................................................... 24 Table 5.1 Consolidated revenue and expenses, 2013 ($’000) ................................................... 29 Table 5.2 Direct economic contribution, Geelong campuses, 2013 .......................................... 29 Table 5.3 Intermediate inputs for the Geelong campuses, 2013 .............................................. 30 Table 5.4 Total economic contribution of university operations, 2013 $m ............................... 30 Table 5.5 Direct and indirect economic contribution of the Geelong campuses’ ongoing operations to the GRP of Greater Geelong LGA, 2013 $m ........................................................ 30 Table 5.6 Deakin university students Geelong, 2011-2013 ....................................................... 31 Table 5.7 Students by modelling region, 2013 ......................................................................... 32 Table 5.8 Average annual student expenditure ($) .................................................................. 32 Table 5.9 Student expenditure in modelling region, 2013, $m ................................................. 33 Table 5.10 Student-related contribution, by modelling region, 2013, $m ................................. 33 Table 5.11 Total economic contribution of the Geelong campuses and students to the local community, 2013, $m ............................................................................................................. 34 Table 5.12 Total economic contribution of the Geelong campuses and students by region, 2013, $m ................................................................................................................................. 34 Table 5.13 : Deakin’s capital expenditure, $m.......................................................................... 35 Table 5.14 Total employment contributed by the economic activity of the Geelong campuses and students in the local community, 2013, FTE jobs .............................................. 37
Table 5.15 Total employment contributed by the economic activity of the Geelong
campuses and students by region, 2013, FTE jobs ................................................................... 37
Table 5.16 Total gross output contributed by the Geelong campuses and students in the
local community, 2013, $m ..................................................................................................... 38
Table 5.17 Total gross output contributed by the Geelong campuses and students by region,
2013, $m ................................................................................................................................. 38
Table A.1 Home and study region consumption assumptions .................................................. 44
Table C.1 : Comparison of estimates of the economic contribution of the Burwood campus
to Melbourne .......................................................................................................................... 47

Figures
Figure 1.1 The economic contributions of Deakin University’s Geelong campuses ..................... 1
Figure 1.2 Estimates of the Geelong campuses’ economic contribution in 2013 ........................ 2
Figure 1.3 The economic contribution of the Geelong campuses by region................................ 4
Figure 1.4 Economic impact of Deakin University’s total capital expenditure in Geelong ........... 5
Figure 3.1 Deakin University’s Geelong Waterfront campus .................................................... 10
Figure 3.2 Deakin University’s Geelong Waurn Ponds campus ................................................. 11
Figure 3.3 Unemployment and labour force for the Geelong region ........................................ 16
Figure 3.4 Age profile of Greater Geelong LGA population with a bachelor degree or higher .. 18
Figure 5.1 Overview of the analytical approach ....................................................................... 27
Figure 5.2 Distribution of impact of Deakin’s capital expenditure ............................................ 36
Figure A.1 Economic activity accounting framework ................................................................ 41
Figure B.1 : Key components of DAE-RGEM ............................................................................. 45
Glossary

AGS         Australian Graduate Survey

CGE         Computable General Equilibrium

DAE-IRIOM   Deloitte Access Economics’ In-House Integrated Regional
            Input-Output Model

DAE-RGEM    Deloitte Access Economics’ Regional General Equilibrium
            Model

FTE         Full-Time Equivalent

GDP         Gross Domestic Product

GOS         Gross Operating Surplus

GRP         Gross Regional Product

GSP         Gross State Product

IRSD        Index Of Relative Socio-Economic Disadvantage

LGA         Local Government Area

SEIFA       Socio-Economic Indexes For Areas

SES         Socio-Economic Status

VIC         Victoria
Economic contribution of Deakin University’s Geelong Waurn Ponds and Waterfront campuses
Executive Summary
Deakin University’s Geelong Waurn Ponds and Waterfront campuses contribute to their
local community and society more broadly in several important ways, depicted in figure 1.1
below. Through its teaching function Deakin improves the labour force and life prospects
for individuals and contributes to a more productive workforce. Through its research
Deakin generates ideas, new technologies and new knowledge; driving innovation and
productivity in the economy. In addition, the ongoing operations of the Geelong campuses,
the expenditure of Deakin students and Deakin’s capital investments, contribute
significantly to local economic activity.
Figure 1.1 The economic contributions of Deakin University’s Geelong campuses
Deakin is the sole university operating in the Geelong region, comprising the City of Greater
Geelong local government area (LGA), and plays an essential role in this community. The
University adds to the population base, produces output, and provides jobs and income for
many members of the community. It provides access to the benefits of higher education for
local residents and others from regional, rural and more disadvantaged areas. The
University also supplies skilled graduates into an economy undergoing significant structural
change.
The economic contribution of ongoing operations and
students at the Geelong campuses to the local community
This study quantifies the economic contribution of the Geelong campuses’ ongoing
operations and student expenditure to the local community in the Greater Geelong LGA. It
does this by estimating the Geelong campuses’ economic contributions to the Gross
Regional Product (GRP) of the Greater Geelong LGA. The study also quantifies the economic
impact of Deakin’s capital expenditure on GRP.
1
Deloitte Access EconomicsEconomic contribution of Deakin University’s Geelong Waurn Ponds and Waterfront campuses
In 2013, the Geelong campuses had approximately $338 million of operating revenue,
$281 million of operating expenditure and a gross operating surplus (GOS) of $57 million
(section 5.2.1). Approximately 9,530 students studied on-campus in Geelong in 2013,
spending about $159 million in the Greater Geelong LGA (section 5.4).
The total economic contribution of the Geelong campuses’ ongoing operations and the
expenditure of Deakin students to the local community in 2013 was:
$426 million of value added (section 5.5), which is 5.3 per cent of the local economy
(GRP). Value added is the preferred measure for this study.
$654 million of gross output (section 5.7). This is the total value of all transactions
associated with the Geelong campuses, and is not a preferred measure of economic
contribution.
equivalent to 3,124 full-time equivalent jobs (section 5.6). This is Deakin’s value added
expressed as FTE employment. The Geelong campuses directly employed 1,539 people
(FTE).
Figure 1.2 below provides a further breakdown of the Geelong campuses’ economic
contributions to the local community.
Figure 1.2 Estimates of the Geelong campuses’ economic contribution in 20131
Deakin University’s Geelong
Waterfront and Waurn Ponds
campuses economic
contribution 2013
Contribution from Contribution from
University operations student expenditure
$313 Economic contribution $112
million (Value added) million
$426
million
Equivalent to 5.3% of
Gross Regional Product
Equivalent jobs (FTE) created in the
local community
3,124
1
Values may not add due to rounding.
2
Deloitte Access EconomicsEconomic contribution of Deakin University’s Geelong Waurn Ponds and Waterfront campuses
The Geelong campuses’ economic contributions to the local community in 2013 were made
up of:
Deakin’s operations contributing approximately $313 million to GRP (sections 5.2 and
5.3)
Deakin student expenditure contributing approximately $112 million to GRP (section
5.4)
The economic contribution of ongoing operations and
students at the Geelong campuses to other regions
The Geelong campuses’ economic contributions are concentrated in the local community.
However, their benefits also flow to other regions of Australia from the goods and services
Deakin purchases from its suppliers in other sectors and regions (depicted in table 1.1 and
figure 1.3 below).
In total, the economic contribution of the Geelong campuses in Australia was $470 million
of value added in 2013, equivalent to 3,347 FTE jobs (sections 5.5 and 5.6). In addition to its
contributions in the Greater Geelong LGA, the economic contributions of the Geelong
campuses were:
$9 million of value added in the rest of Victoria, equivalent to 58 FTE jobs
$35 million of value added in the rest of Australia, equivalent to 165 FTE jobs (partly
reflecting a number of Deakin’s suppliers being located in New South Wales)
Table 1.1 Summary of total economic contribution
of the Geelong campuses by region
Modelling region Value added Gross output Employment
($ millions) ($ millions) contributed (FTE)
Greater Geelong LGA 426 654 3,124
Rest of Victoria 9 18 58
Rest of Australia 35 78 165
Total Australia 470 750 3,347
3
Deloitte Access EconomicsEconomic contribution of Deakin University’s Geelong Waurn Ponds and Waterfront campuses
Figure 1.3 The economic contribution of the Geelong campuses by region
The economic impact of Deakin’s capital expenditure
Deakin’s capital expenditure at the Geelong campuses equated to about $82 million in
2013. While measured on a different basis and not additive to the results above, Deakin’s
capital expenditure in Geelong (and to a lesser extent other regions) added approximately
$43 million to the GRP of Geelong in 2013. Deakin’s capital expenditure in Melbourne and
Warrnambool also impacted on the GRP of Geelong, Melbourne and the rest of Victoria.
These impacts are depicted in figure 1.4 below and discussed in section 5.5.
4
Deloitte Access EconomicsEconomic contribution of Deakin University’s Geelong Waurn Ponds and Waterfront campuses
Figure 1.4 Economic impact of Deakin University’s total capital expenditure to Geelong
Economic impact from Deakin
University’s capital expenditure
to Geelong 2013
Economic impact on
GRP in Geelong
$42.5m
Deakin’s other contributions to the local community
In addition to Deakin’s substantial measurable economic contributions to the GRP of
Greater Geelong LGA from its operations, capital expenditure and students, Deakin has
created significant benefits from other activities.
One example of this is the Australian Future Fibre Research and Innovation Centre (AFFRIC),
which is better placing the region to transition towards more advanced and competitive
forms of manufacturing. AFFRIC research is already underpinning the development and
production of innovative materials that have a wide range of valuable end-uses across the
medical, automotive and other industries.
Deakin University’s sizeable operations in the Geelong region have contributed to the
Education and Training industry being the fourth-largest producer and employer in the
region. In addition, graduates from Deakin’s Health programs, the Geelong campuses’
largest field of enrolments, provide a pool of skilled graduates for Geelong’s second-largest
industry – healthcare and social assistance.
The Geelong campuses also provide important opportunities and access to the benefits of
higher education for persons from regional, remote and disadvantaged backgrounds. About
2,900 students at the Geelong campuses (30 per cent of domestic students) come from
regional or remote areas. By contrast, 14 per cent of university students across Australia
come from regional or remote areas. In addition, about 19 per cent of students at the
Geelong campuses are considered low-SES, slightly higher than the average for all
Australian universities.
Deloitte Access Economics
5
Deloitte Access EconomicsEconomic contribution of Deakin University’s Geelong Waurn Ponds and Waterfront campuses
1 Background
1.1 Scope and approach
This report provides estimates of the economic contribution of Deakin University’s Geelong
Waurn Ponds and Waterfront campuses to the GRP of the Greater Geelong LGA.2 These
contributions are generated by Deakin’s ongoing operations and the expenditure of its
students, and its capital expenditure.
While measured on a different basis and not additive to the economic contribution
estimates, the economic impact of Deakin’s total capital expenditure at all campuses to
Geelong as a whole has also been modelled. Throughout the report, economic
‘contribution’ refers to the economic activity generated by Deakin’s ongoing operations and
the expenditure of its students, while economic ‘impact’ refers to economic activity
generated by Deakin University’s total capital expenditure.
Alongside this quantitative analysis is information on the region in which Deakin operates,
the characteristics of Deakin’s students, including graduate outcomes, and case study
material highlighting the Geelong campuses’ broader contributions to the local community.
Economic contribution studies quantify measures such as value added, gross output and
employment associated with a given industry or firm, in a historical reference year. The
economic contribution is a measure of the value of production by a firm or industry. Deakin
University’s economic contributions are quantified using Deloitte Access Economics’ in-
house integrated regional input-output model (known as DAE-IRIOM). The model enables
us to estimate the economic contributions of each of Deakin’s three campuses in a
rigorous, tested economic framework.
The data used to estimate the economic contribution of Deakin University falls into the
following broad categories:
Deakin enrolment statistics by student characteristics
Deakin’s financial information (including information on intermediate inputs and
suppliers)
Deakin student expenditure by domestic and international students
The majority of this data comes from Deakin University itself. Data on student expenditure
comes from the Universities Australia publication University Student Finances in 2012.
The model outputs the total economic contribution of Deakin University’s campuses to
their local communities, including all direct expenditure by the University and its students,
as well as the flow on to other sectors and regions of the economy. The primary measure is
‘value added’. Value added measures the value added to intermediate inputs by the
application of capital and labour, by summing wages paid for labour by the University and
2
Gross Regional Product is the total level of final goods output produced by factor inputs within a geographical
region over the course of a financial year. GRP is measured using imputed methods as it is difficult to accurately
allocate factor inputs to specific regions and the ABS does not publish a series on it.
6
Deloitte Access EconomicsEconomic contribution of Deakin University’s Geelong Waurn Ponds and Waterfront campuses
its gross operating surplus. The sum of value added across all entities in the economy
equals gross domestic product (GDP). Deakin’s economic contribution is also reported in
equivalent employment numbers (FTE), and gross output is also reported.
Deloitte Access Economics has used the Deloitte Access Economics – Regional General
Equilibrium Model (DAE-RGEM) to estimate the impacts of Deakin University’s total capital
expenditure to various regions in 2013. The DAE-RGEM is a large scale, dynamic, multi-
region, multi-commodity computable general equilibrium (CGE) model. The model has
been customised to include the Melbourne statistical division, the City of Geelong LGA, and
the rest of Victoria.
The key difference between the DAE-IRIOM and the DAE-RGEM is that the later captures
more relationships and responses from changes in one part of the economy on other parts
of the economy. For example, in the DAE-RGEM as Deakin’s capital expenditure causes
demand for construction workers to increase, the wage rate for construction workers also
increases, muting growth in construction employment. For this reason, CGE models like
DAE-RGEM typically produce lower, but more reliable results than other models (discussed
in more detail in appendices A and B). The DAE-RGEM projects changes in macroeconomic
aggregates such as GDP, employment, export volumes, investment and private
consumption. It produces results on the impact to the economy from a shock like a large
capital investment by a university. Because of the methodological differences between the
DAE-IRIOM and the DAE-RGEM and the potential for double-counting the effects of
Deakin’s capital expenditure, the results of the models cannot be added.
1.2 Structure of the report
The report is structured as follows:
Section 2 provides a brief overview of the broader private and social benefits of higher
education, and what component of this is captured in economic contribution modelling.
Section 3 provides the contextual backdrop for the Geelong campuses’ economic
contributions,, by describing the major characteristics of the local community, including
geography, population, economic activity, employment and social indicators.
Section 4 provides an overview of the characteristics of students at the Geelong campuses,
including where students live, their cultural and linguistic background, socio-economic
status and graduate outcomes.
Section 5 is the core of this report, providing the results of the economic contribution
modelling, including the direct and indirect contributions of Deakin’s operations and
student expenditure to the local community and beyond. The results of the separate
economic impact modelling of Deakin’s total capital expenditure to Geelong are also
reported in this section.
7
Deloitte Access EconomicsEconomic contribution of Deakin University’s Geelong Waurn Ponds and Waterfront campuses
2 The value of higher education
Higher education generates a range of benefits for students and the wider community,
some of which is amenable to quantifying in economic contribution modelling like that
undertaken for this report, and some of which is not captured.
Universities contribute to the economy through a variety of channels:
as an economic entity they employ staff, produce economic output and contribute to
regional socio-economic atmosphere;
their students spend money over the course of their education, fuelling activity in the
local economy (and, in the case of international students, export income as well);
as a teaching institution, they improve the labour force and life prospects for
individuals and contribute to a more productive workforce; and
as a research body they generate ideas, new technologies and new knowledge; driving
innovation and productivity.
Higher education increases the knowledge and skills of workers, which in turn improves
productivity in the workforce, labour force participation and employment. As such, it plays
a key role in the national productivity agenda which aims to provide a solid foundation for
ongoing economic growth in Australia.
The returns to the individual from higher education include an increase in individual income
and employment opportunities, as well as wider social benefits from increasing a person’s
skill set. An individual completing a bachelor degree in Australia could expect an average
private rate of return of 15.3 per cent for males and 17.3 per cent for females, compared to
someone who had finished Year 12 (Leigh, 2008). However, it should be noted that these
figures may not account for ability bias as people with particular academic abilities are
more likely to attend university.
Social returns of higher education include greater equality, better informed citizens, and
flow-on benefits of improved health outcomes associated with better education and having
children more likely to participate in higher education.
The opportunities for employment for people with university qualifications are also
expected to grow at a faster rate than for workers without such qualifications. Faster
growth in knowledge industries will drive employment opportunities in the growing health
and education sectors, as well as for professional, managerial and administrative
occupations.
Recognising the importance of higher education, successive Governments have sought to
increase the proportion of the population with higher education qualifications to improve
workforce productivity. Higher education policy in Australia has also included goals to
increase participation by students from low socioeconomic backgrounds, in order to realise
the substantial potential from education beyond high school.
8
Deloitte Access EconomicsEconomic contribution of Deakin University’s Geelong Waurn Ponds and Waterfront campuses
The value added and employment figures generated by this economic contribution study
need to be understood in the context of the broader value of higher education. The model
quantifies the economic contribution of Deakin University’s Geelong campuses and
students to the local community in 2013. This is based on the direct and flow-on effects of
the University’s expenses (including wages and payments to suppliers), revenue and gross
operating surplus, as well as student expenditure in the region. Other benefits like
improved productivity, contributions to research and knowledge and greater equality are
very real consequences of Deakin University’ activities, but not captured in the modelling.
9
Deloitte Access EconomicsEconomic contribution of Deakin University’s Geelong Waurn Ponds and Waterfront campuses
3 Deakin’s local community
In addition to Deakin graduates themselves, the local communities surrounding the
Geelong campuses are major beneficiaries of Deakin’s activity in the region. This section
provides an overview of the key characteristics of the local community in which the
Geelong campuses operate, identifying areas where Deakin influences and is influenced by
the local community.
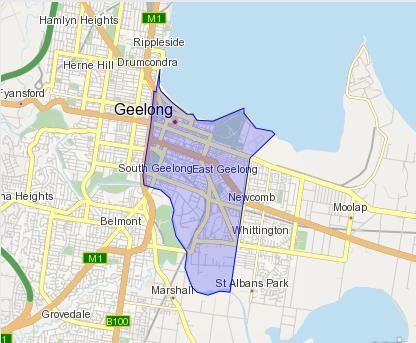
3.1 Geography
Deakin University in Geelong has two campuses, one located in the inner city of Geelong
(figure 3.1), the other located in the south-western suburb of Waurn Ponds (figure 3.2).
Both are located within Greater Geelong LGA, containing the city of Geelong and the
surrounding areas of Anakie, Balliang, Barwon Heads, Batesford, Ceres, Clifton Springs,
Drysdale, Lara, Ocean Grove, Portarlington and St Leonards. For the purpose of this
economic contribution study we examine the economic contribution of both campuses
within the Geelong region, comprising the Greater Geelong LGA.
Figure 3.1 Deakin University’s Geelong Waterfront campus
Deakin Campus
Source: ABS, 2013
10
Deloitte Access EconomicsEconomic contribution of Deakin University’s Geelong Waurn Ponds and Waterfront campuses
Figure 3.2 Deakin University’s Geelong Waurn Ponds campus
Deakin Campus
Source: ABS, 2013
3.2 Population
Deakin’s economic contributions in the local community affect a total population of
approximately 221,515 residents. Geelong is the second largest city in Victoria after
Melbourne.
Table 3.1 Population
LGA 2013 Levels 2013 growth 10 year average
% annual growth %
Geelong Region 221,515 1.6 1.2
Victoria 5,739,341 1.9 1.6
Source: ABS Cat No. 3218, 2013
The Geelong region experienced population growth of 1.6 per cent in 2013, slightly lower
than the population growth of 1.9 per cent for Victoria as a whole but higher than the
average annual growth over the preceding decade. This is despite ongoing job losses in the
manufacturing sector and continued movement of population towards the greater
Melbourne area, which has experienced the strongest population growth in Victoria in
recent years.
11
Deloitte Access EconomicsEconomic contribution of Deakin University’s Geelong Waurn Ponds and Waterfront campuses
3.3 Economy
The economy of the Geelong region is facing challenges from ongoing economic
restructuring away from traditional manufacturing, higher than average unemployment and
lower than average incomes. Deakin University’s operations and investments have
undoubtedly helped bolster local economic performance, and present an ongoing source of
economic growth for the local economy.
3.3.1 Industry Output
Deakin University’s large-scale operations in the Geelong region have undoubtedly
influenced the region’s total output and industry make-up, with the fourth largest producer
being the Education and Training Industry.
The Gross Regional Product (GRP) of the Geelong region in 2013 was $7.98 billion,
accounting for 2.9 per cent of Victoria’s total Gross State Product (GSP). The share of GRP
attributable to each industry is shown in Table 3.2.
Compared to the Victrorian economy as a whole, Geelong has an above average share of
Manufacturing (14 per cent of output, compared to 9 per cent for Victoria as a whole).
Health care and social assistance, retail, and education and training also represent a higher
share of output in the Geelong region than they do in Victoria as a whole.
12
Deloitte Access EconomicsEconomic contribution of Deakin University’s Geelong Waurn Ponds and Waterfront campuses
Table 3.2 The Geelong LGA’s GRP by industry (current prices, $m) 2012-13
Industry Geelong3 % VIC %
Manufacturing 1,124 14 24,951 9
Health Care and Social Assistance 941 12 22,519 8
Retail Trade 831 10 18,235 7
Education and Training 799 10 18,018 7
Construction 705 9 19,729 7
Financial and Insurance Services 613 8 32,288 12
Professional, Scientific and Technical Services 477 6 28,270 10
Transport, Postal and Warehousing 393 5 14,759 5
Public Administration and Safety 370 5 13,295 5
Electricity, Gas, Water and Waste Services 254 3 7,615 3
Wholesale Trade 253 3 14,821 5
Accommodation and Food Services 240 3 7,313 3
Rental, Hiring and Real Estate Services 224 3 7,983 3
Administrative and Support Services 202 3 9,210 3
Other Services 184 2 5,681 2
Information Media and Telecommunications 117 1 11,169 4
Agriculture, Forestry and Fishing 100 1 8,101 3
Mining 80 1 6,229 2
Arts and Recreation Services 70 1 3,086 1
Total All Industries GRP 7,977 100 273,272 100
Source: Deloitte Access Economics, ABS Census Data, 2011, Other ABS Data
The economy of the Geelong region is undergoing significant structural change, primarily in
a shift away from traditional manufacturing into other industries, such as health care and
social assistance. Table 3.3 shows how manufacturing’s share of regional production has
declined compared to 10 years ago, and how the share of other industries has increased.
Table 3.3 Structural change in the Geelong economy, 2003-2013
Percentage Point Change
Industry in GRP Share
Manufacturing -9
Health Care and Social Assistance 3
Retail Trade 1
Education and Training 1
Construction 1
Financial and Insurance Services 2
Professional, Scientific and Technical Services 2
Transport, Postal and Warehousing 1
Source: Deloitte Access Economics Estimates, 2013
This highlights the importance of Deakin’s provision of health related courses (see
table 4.7), and innovative efforts at facilitating more advanced and competitive forms of
manufacturing in the region, such as through AFFRIC.
3
Using factor income attributed to full time equivalent wages by industry in each LGA we are able to estimate
the total factor income (and thus gross regional product) of each LGA, broken down by industry.
13
Deloitte Access EconomicsEconomic contribution of Deakin University’s Geelong Waurn Ponds and Waterfront campuses
Case study 1: Australian Future Fibre Research and Innovation Centre (AFFRIC)
Deakin University’s Geelong Technology Precinct is home to AFFRIC, a collaboration
between Deakin University, CSIRO and the Victorian Centre for Advanced Materials
Manufacturing (VCAMM). AFFRIC’s research focuses on all aspects of fibre manufacturing,
including carbon fibres, functional fibrous materials, green natural fibres and nanofibres. Its
establishment has been supported through two major Government grants.
AFFRIC provides an opportunity for Deakin University to partner with CSIRO and industry in
research. This allows for a greater range of expertise to come together to shared
knowledge and leverage the traditional strength of the manufacturing industry in Geelong,
which can help revitalise the Australian textiles industry and influence broader
manufacturing development through the creation of innovative materials. AFFRIC directly
and indirectly contributes to the economy by stimulating employment and activity, acting
as a catalyst for investment, and providing flow-on benefits to the university community.
The establishment of Carbon Nexus is also acting as a catalyst for other companies to
consider manufacturing investment in Geelong in carbon fibre and composite production.
The $34 million Carbon Nexus carbon fibre open-access research facility was opened in May
2014, and contains the first carbon fibre manufacturing lines in the Southern hemisphere.
Carbon Nexus aims to conduct research for both commercial carbon fibre plants and
downstream composite manufacturers to provide improved processes, materials and
techniques through targeted R&D. Carbon fibre has a range of potential applications to the
aerospace, transport, automotive, infrastructure and building, industrial, and sporting
goods sectors. Carbon Nexus takes advantage of the growth potential of the carbon fibre
industry, which is forecast to be worth $36 billion by the mid-2020s4, by conducting
research into lower-cost manufacturing and production techniques as well as higher-
performance carbon fibre. Local and international companies are engaging with the facility
to conduct strategic research projects, which will continue to bring investment into the
region and support the changing structure of the manufacturing industry in Geelong.
Indeed, Carbon Revolution, a high-tech manufacturer of carbon fibre wheels, is located
adjacent to Carbon Nexus. Much of the initial research and design of the product was
undertaken in partnership with Deakin University over seven years. This created
opportunities for academics and students to partake in the early stages of development.
Carbon Nexus has been an influencing factor in Carbon Revolution’s $24 million expansion
of manufacturing facilities at Deakin University5. This expansion is forecast to increase from
4,000 to 50,000 wheels per year, and create 150 jobs by 2016.6 Carbon Revolution’s
customers include Porsche, BMW, Audi, Lamborghini and McLaren, and many of their staff
are skilled manufacturing workers and engineers who developed their expertise whilst
working for Ford and Alcoa in Geelong.
4
Carbon Nexus phoenix rises, Deakin University, 21 May 2014.
http://www.deakin.edu.au/affric/news/2014/05/21/carbon-nexus-phoenix-rises
5
Carbon Nexus is open for business, Carbon Nexus, 21 May 2014.
http://www.carbonnexus.com.au/index.php/about-us/news/93-carbon-nexus-is-open-for-business
6
Wheels in motion as Geelong’s carbon revolution gets rolling, Geelong Advertiser, 5 March 2014.
http://www.geelongadvertiser.com.au/news/geelong/wheels-in-motion-as-geelongs-carbon-revolution-gets-
rolling/story-fnjuhovy-1226844925262
14
Deloitte Access EconomicsEconomic contribution of Deakin University’s Geelong Waurn Ponds and Waterfront campuses
3.3.2 Employment
Manufacturing is the largest employing industry in the local economy. This has historically
been the most important industry for the region, with the city of Geelong originally
established as an industrial centre. However, significant job losses in the manufacturing
sector in recent years have shifted the emphasis of employment in the region.
The role of education and training, and professional, scientific and technical services in
providing jobs for the region continues to grow. Currently these industries combine to
employ a total of 11,075 FTE workers. Deakin plays an important role in this, with its
significant investment in the Waurn Ponds campus Geelong Technology. Deakin University’s
medical school, located at the Waurn Ponds campus, also plays an important role in
supporting the health care and social assistance industry in the Geelong region, which
currently accounts for 12 per cent of the region’s total employment.
Table 3.4 Full-time-equivalent employment by industry 2012-13
Industry Geelong % VIC %
Manufacturing 10,749 15 278,825 12
Health Care and Social Assistance 9,873 14 234,799 10
Retail Trade 8,820 13 211,384 9
Education and Training 7,415 11 174,603 8
Construction 5,686 8 220,518 10
Professional, Scientific and Technical Services 3,661 5 193,073 9
Accommodation and Food Services 3,626 5 108,116 5
Public Administration and Safety 3,616 5 125,044 6
Transport, Postal and Warehousing 2,897 4 120,606 5
Other Services 2,726 4 83,443 4
Wholesale Trade 2,266 3 116,227 5
Financial and Insurance Services 2,255 3 105,308 5
Administrative and Support Services 1,469 2 70,042 3
Rental, Hiring and Real Estate Services 1,053 2 34,535 2
Arts and Recreation Services 961 1 36,649 2
Electricity, Gas, Water and Waste Services 940 1 28,764 1
Information Media and Telecommunications 684 1 48,255 2
Agriculture, Forestry and Fishing 619 1 58,597 3
Mining 123 0 8,991 0
Total All Industries 69,438 100 2,257,778 100
Source: Deloitte Access Economics, ABS Census Data, 2011, Other ABS Data
As demonstrated in Figure 3.3 the combined labour force of the Geelong Region is 118,854
persons as of September 2013.7 Unemployment in the region was 6.6 per cent as of
September 2013, above the national average of 5.7 per cent at the same time (6.0 per cent
as of February 2014). Given these economic conditions, Deakin plays a very important role
as a major employer in the region.
7
The labour force consists of all persons aged 15-64 years who are employed or unemployed and actively
seeking work.
15
Deloitte Access EconomicsEconomic contribution of Deakin University’s Geelong Waurn Ponds and Waterfront campuses
Deakin directly employs over 1,500 FTE workers across the Geelong campuses, making up
around 20 per cent of all employment in the education and training industry.
Figure 3.3 Unemployment and labour force for the Geelong region
Source: Department of Employment, 2013
These headline figures do mask some diversity in labour market outcomes within the local
community. Unemployment within the local community varies from almost 10 per cent in
the statistical local area (SLA) of Corio – Inner to 4.4 per cent in the SLA of South Barwon –
Inner, where the Waurn Ponds campus is located.
The Geelong region, whilst encompassing significant residential areas, is also a considerable
business and industrial district, with a number of people commuting to the region for work
and study purposes.
3.3.3 Income
The local community of Greater Geelong LGA has historically had low median incomes due
to the high concentration of large-scale manufacturing employment in the region and
higher levels of unemployment and disengagement from the labour force.
Compared to the Victorian and national averages, the Greater Geelong LGA is a less affluent
region, with low levels of individual and household income in 2013. Median individual
weekly income in the region of Greater Geelong is $44 lower than the Victorian average
and $60 less than the national average, as shown in table 3.5.
16
Deloitte Access EconomicsEconomic contribution of Deakin University’s Geelong Waurn Ponds and Waterfront campuses
Table 3.5 Weekly income in the Geelong Region, 2011
LGA Median Individual Median Household
Income Income
Greater Geelong 517 1049
Victoria 561 1216
Australia 577 1234
Source: ABS Census data, 2011
3.4 Social indicators
3.4.1 Socioeconomic indicators
The LGA of Greater Geelong is experiencing relative socio-economic disadvantage
compared to the rest of the country, with an index less than 1000 as measured by the
Socio-Economic Indexes for Areas (SEIFA) Index of Relative Socio-Economic Disadvantage
(IRSD).8
Table 3.6 SEIFA index of relative socio-economic disadvantage, 2011 9
LGA SEIFA index National Ranking State Ranking
(Out of 564 LGAs) (Out of 80 LGAs)
Greater Geelong 992.9 354 40
Source: ABS Cat No. 2033.0.55.001, 2011
As with labour force outcomes social disadvantage varies considerably within the Greater
Geelong LGA. The SLA of Corio-Inner ranks as one of the most disadvantaged in Australia,
93 per cent of SLAs in the country are considered more advantaged. Whereas the SLA of
South Barwon-Inner (where the Waurn Ponds campus is located) has only 29 per cent of
SLAs considered more advantaged. The SLA of Geelong, where the Waterfront campus is
located, is considered to be around the average in terms of social disadvantage, with 51 per
cent of SLAs, nationally, considered to have higher levels of advantage.
Of the 17 post codes in the Greater Geelong Region, 3 are considered low SES (in the
bottom 25 per cent of the population), 10 medium SES (in the middle 50 per cent of the
population) and 4 high SES (in the top 25 per cent of the population). Approximately 19 per
cent of students at the Geelong campuses are considered to be low-SES by the
Commonwealth Department of Education (discussed in section 4).
8
The SEIFA IRSD allocates scores to statistical regions based on census data collected by the ABS. The IRSD is a
general socio-economic index that summarises a range of information about the economic and social resources
of people and households within an area.
9
Note: A ranking of 40 means that residents in 39 of the 80 LGAs in Victoria have relatively higher levels of
disadvantage.
17
Deloitte Access EconomicsEconomic contribution of Deakin University’s Geelong Waurn Ponds and Waterfront campuses
3.4.2 Cultural Diversity
The Greater Geelong LGA has a higher proportion of Indigenous residents than the Victoria
as a whole, and considerably higher than recorded within greater Melbourne. The Geelong
region, compared to Australia as a whole, is not a highly multicultural region. In 2011, while
one fifth of the population reported being born overseas, this is lower than the national
average of 30 per cent. 21 per cent of respondents in the Geelong region reported that
both of their parents were born overseas and only 10 per cent report speaking a language
other than English (LOTE); this is in comparison to 32 and 23 per cent, respectively, for
Australia as a whole.
Table 3.7 Demographic indicators (population percentages)
LGA Born Overseas Parents born overseas Speaks a LOTE Indigenous
Greater Geelong 20 21 10 0.8
Victoria 31 36 23 0.7
Australia 30 32 23 2.5
Source: ABS Census Data, 2011
3.4.3 Education
Geelong has a slightly lower proportion of people with a ‘bachelor degree or higher’ than
the national average. In the Geelong region 17 per cent of people aged 20 years or above
have a bachelor degree or higher, compared to a national average of 20 per cent. Deakin
has undoubtedly contributed to educational attainment in the Geelong region, with
approximately one in three Deakin students coming from the Geelong region originally.
Figure 3.4 Age profile of Greater Geelong LGA population
with a bachelor degree or higher
Source: ABS Census Data, 2011
18
Deloitte Access EconomicsEconomic contribution of Deakin University’s Geelong Waurn Ponds and Waterfront campuses
4 Deakin student characteristics
Deakin University students are an integral part of the Geelong region, both influencing and
influenced by the social, economic and demographic characteristics of the broader
population. Approximately 9,530 students study on-campus at Deakin’s two campuses in
Geelong. Of these students, 4,901 live in the Geelong region during their studies, with
around a third of these moving in from other regions. Approximately 4.3 per cent of the
total population living in the Geelong region are Deakin students.
Deakin’s Geelong campuses provide important opportunities and access to the benefits of
higher education for persons from regional, remote and disadvantaged backgrounds. About
2,900 students at Deakin University’s Geelong campuses (30 per cent of domestic students)
come from regional or remote areas. By contrast, 14 per cent of university students across
Australia come from regional or remote areas. In addition, about 19 per cent of students at
Deakin University’s Geelong campuses are considered low-SES, slightly higher than the
average for all Australian universities. This section describes key characteristics of Deakin’s
student population.
4.1 The students of Deakin University’s Geelong
Waurn Ponds and Waterfront Campuses
Table 4.1 provides a breakdown of information on on-campus10 students at Deakin
University’s Geelong campuses in 2013, compared to students at all Australian
universities.11 Some key characteristics of Deakin’s student population include:
The vast majority of students at Deakin University’s Geelong campuses are undertaking
undergraduate courses. Given undergraduate courses qualify for Commonwealth
funding, relatively more Deakin students are accessing higher education through
Commonwealth Supported Places than the average for all Australian universities.
The Geelong campuses have a larger proportion of students in higher degree research
than the national average. Deakin University’s undergraduate courses are providing a
platform for students to go onto further education. The proportion of Deakin graduates
in further full-time study has been increasing steadily since 2009 and is currently above
the sector average at 21.7 per cent (more information in section 4.3).
Deakin University’s Geelong campuses’ students enrol in the university via several
routes apart from the traditional secondary education or equivalent entry. This is
consistent with the relatively older age profile of Deakin enrolments.
10
Deakin defines ‘on-campus’ students as students who take most of their subjects on-campus. As such many
‘mixed-mode’ students are included (while some are excluded). While only on-campus student numbers are
reported here, reflecting the focus of the modelling on economic contributions in the campus regions, the
modelling results capture the economic contribution of all of Deakin’s students via total student revenue.
11
The student numbers are “reportable students”. Deakin advised that these are essentially the number of
students, although the very small number of students undertaking more than one courses would be double-
counted.
19
Deloitte Access EconomicsEconomic contribution of Deakin University’s Geelong Waurn Ponds and Waterfront campuses
Table 4.1 Key statistics 201312
Geelong Campuses 2013 All Universities 2012
Measure Enrolments % Enrolments %
Course
Undergraduate 7876 83 891832 71
Post grad Coursework 897 9 267071 21
Higher Degree Research 680 7 60697 5
Non Award 77 1 38122 3
Admission Basis
Secondary Ed or equivalent 4413 46 n/a n/a
Higher Ed Course 3417 36 n/a n/a
Other Basis 643 7 n/a n/a
TAFE Award 1012 11 n/a n/a
Mature Age - Govt 37 0 n/a n/a
Funding Category
Commonwealth Supported 7748 81 729556 58
International Fee Paying 1247 13 324669 26
Domestic Fee Paying 246 3 181609 14
Domestic HDR 289 3 n/a n/a
Citizenship Status
Domestic 8284 87 934110 74
International 1247 13 323612 26
Age
Up to 19 years 2118 22 296220 24
20 - 24 years 4769 50 502936 40
25 -29 years 1314 14 177173 14
30-39 years 817 9 158982 13
40-49 years 360 4 81291 6
50-59 years 118 1 33136 3
60 years and over 34 0 7984 1
Indigenous or Torres Strait Islander
ATSI Student 38 0 12632 1
ATSI student - CBD via IKE13 587 6 n/a
ATSI student - total 625 7 12632 1
Total Numbers (excl. CBD via IKE) 9530 100 1257722 100
Source: Deakin University, 2013, Department of Education, 2013
Almost 23 per cent of the Geelong campuses’ total student population (domestic and
international students) were born overseas, consistent with the Geelong region as a whole.
Of the Geelong campuses’ domestic students, though, only 12 per cent were born overseas.
12
The admission basis of students identifies the path they took to university. The funding category of students
identifies the method of payment for their degree.
13
While Institute of Koorie Education (IKE) students are treated as ‘off-campus’, the Community Based Delivery
model (CBD) that applies to them involves intensive study blocks at the Geelong campuses.
20
Deloitte Access EconomicsEconomic contribution of Deakin University’s Geelong Waurn Ponds and Waterfront campuses
Table 4.2 Domestic students by country of birth and language spoken at home
Geelong campuses 2013 All Universities 2012
Region Enrolments % Enrolments %
Australia 7,331 88 728,240 78
North-East Asia 62 1 30,532 3
South-East Asia 140 2 27,073 3
Southern and Central Asia 125 2 24,614 3
North-West Europe 171 2 34,962 4
North Africa and The Middle East 109 1 15,692 2
Sub-Saharan Africa 91 1 20,146 2
Southern and Eastern Europe 86 1 12,203 1
Oceania and Antarctica 97 1 20,389 2
Americas 49 1 11,841 1
Speaks only English at Home 7,726 93 791,488 85
Speaks another language at home 558 7 142,622 15
Total 8,284 100 934,102 100
Source: Deakin University, 2013, Department of Education, 2013
4.2 Where do students live?
Deakin University plays a significant role in attracting and retaining students in the local
community who contribute to the local economy through their expenditure. Students
would also make broader economic and social contributions if they hold casual or part-time
work, or participate in volunteering, sport and other community activities.
Deakin University’s Geelong campuses have a total of 9,530 students who attend university
on campus, 4,900 of whom live in the Geelong region (table 4.3). Deakin students make up
approximately 4 per cent of the total regions’ population. Further, of the students who live
in the Geelong region, 507 live on campus in university accommodation. These students
contribute in many ways to the local economy, as will be described and measured section 5.
21
Deloitte Access EconomicsEconomic contribution of Deakin University’s Geelong Waurn Ponds and Waterfront campuses
Table 4.3 Term location address
Geelong Campuses
Region Enrolments %
Geelong Region 4,901 51
Rest of Victoria 4,292 45
Unknown14 337 4
Total 9,530 100
Source: Deakin University, 2013
Those students who live outside the Geelong region commute to university to attend
classes and use the university facilities.
As shown by table 4.4, almost 40 per cent those students residing in the Geelong region
relocated there for the purpose of attending university. Of these, 815 were international
students.
Table 4.4 Relocating to university
Geelong Campus
Term address Domestic International Total
In Geelong Region 4,087 815 4,901
Already lived in the Region 3,158 0 3,158
Moved to the Region 928 815 1,743
Live outside of Geelong Region 4,197 432 4,629
Total 8,284 1247 9,530
Source: Deakin University, 2013
Students living within the region and those who commute to university contribute to the
local economy by consuming goods and services in the region. Deakin students residing in
the Geelong region spend a large amount of money in the local rental market, providing
income for local property owners. Income brought by students from overseas will largely be
spent within the Geelong region, helping to boost the local economy. Deakin students’
contributions to the local economy are described and measured in section 5 of this report.
Similar to the residents of the Geelong region students of Deakin University come from
relatively disadvantaged backgrounds, with 19 per cent of students reporting their home
address as residing within a postcode that is considered to be of low socio-economic status
(SES). This is relatively high compared to all Australian University enrolments.
Deakin University’s Geelong campuses provide education for over 450 students with a
disability, making up 6 per cent of the total population on campus (Table 4.5). This is a
higher level than the average level of participation by persons with a disability across all
universities in Australia.
14
Students’ term address is recorded as interstate, overseas or not recorded.
22
Deloitte Access EconomicsEconomic contribution of Deakin University’s Geelong Waurn Ponds and Waterfront campuses
Table 4.5 Enrolments by socio-economic status (SES) and disability 2013 15
Geelong campuses 2013 All Universities 2012
16 17
SES /Disability Category Enrolments % Enrolments %
Low SES18 1,380 19 138,644 17
Medium SES19 4,563 62 n/a n/a
High SES20 1,379 19 n/a n/a
unknown 80 1 n/a n/a
Disability 478 6 43,011 4.5
Source: Deakin University, 2013; Department of Education 2013.
Deakin’s Geelong campuses provide important opportunities and access for regional,
remote and disadvantaged students. While most domestic students who attend Deakin
University in Geelong come from metropolitan Geelong, the Geelong campuses serve a
large proportion of students from regional areas (table 4.6). As a proportion of only the
domestic student population, 30 per cent of students come from regional and remote
areas, compared to only 13 per cent for all universities in Australia.
Table 4.6 Location of home address
Geelong campuses 2013 All Universities 2012
Remoteness Enrolments % Enrolments %
Metro 5322 56 746672 59
Regional 2898 30 163792 13
Remote 16 0 8910 1
Overseas/unknown21 1295 14 338,348 27
Total 9530 100 1257722 100
Source: Deakin University, 2013, Department of Education, 2013
While industry classifications and ‘course areas’ do not directly match, the general course
area that students at the Geelong campuses’ are currently pursuing is largely reflective of
the growth areas of industry needs in the region. In particular, the Geelong campuses’
largest course area – health – is the second largest industry in the Geelong region.
15
Students are allocated to SES categories based on their reported home post-code. Their post-code
corresponds to a particular SES category based on the method used by the Department Of Education using the
SEIFA Index of Education and Occupation. See:
http://content.myuniversity.gov.au/sites/myuniversity/pages/methodology#LowSESStudents
16
The SES category considers the Domestic student population only.
17
The disability category considers the total student population.
18
Bottom 25 per cent of the population
19
Middle 50 per cent of the population
20
Top 25 per cent of the population
21
The vast majority of students in this category are overseas students whose home address is unknown.
23
Deloitte Access EconomicsYou can also read