Drakenstein Municipality 2017 - Western Cape Government
←
→
Page content transcription
If your browser does not render page correctly, please read the page content below
Drakenstein Municipality
2017
DRAKENSTEIN: AT A GLANCE

1.   DEMOGRAPHICS                  1

2.   EDUCATION                     3

3.   HEALTH                        7

4.   POVERTY                      12

5.   BASIC SERVICE DELIVERY       15

6.   SAFETY AND SECURITY          19

7.   THE ECONOMY                  24

8.   INFRASTRUCTURE DEVELOPMENT   28

SOURCES                           33
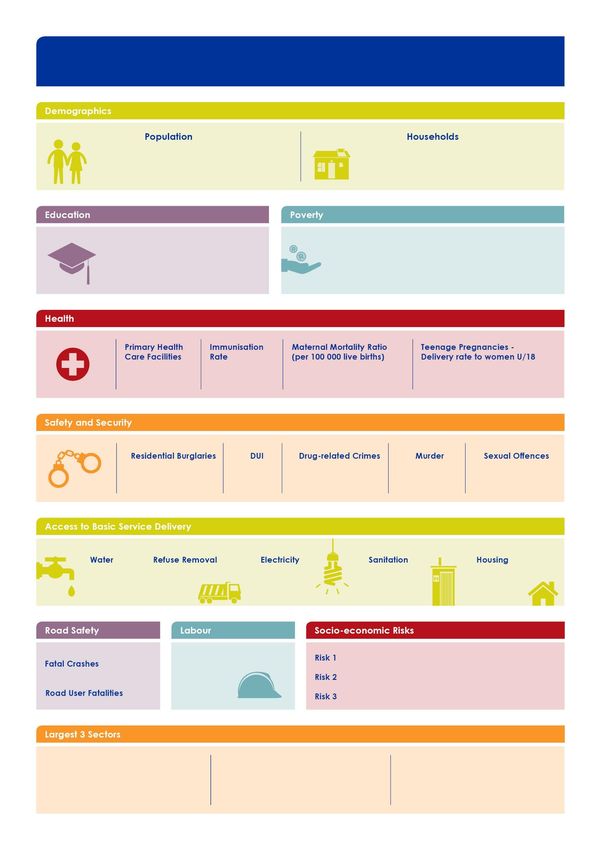
Drakenstein: At a Glance

                                                                     Population Estimates, 2018; Actual households, 2016

             273 066                                                              71 686
                                          2016                                                                     2016

           Matric Pass Rate          86.7%                     Gini Coefficient                                  0.59
           Learner-Teacher Ratio      36.5
                                                               Human Development Index                        0.71
           Gr 12 Drop-out Rate       26.0%

                                                                                                                   2016

                     16              78.3%                       0.0                            5.5%

                                      Percentage change between 2016 and 2017 in number of reported cases per 100 000

                        -1.4%           -2.8%              19.0%                   57.9%                1.6%

                                                            Percentage of households with access to basic services, 2016

    99.5%               90.6%                     94.5%                  98.4%                     90.3%

                 2016                             2016

                                                                   Drought
                53            Unemployment Rate
                                                                   Financial Sustainability (Grant dependency)

                61            14.9%                                Stagnating Economic Growth

                                                                                              Contribution to GDP, 2015

Finance, insurance, real estate           Wholesale and retail trade,
                                                                                            Manufacturing
    and business services                catering and accommodation

     21.2%                                        17.7%                                    16.1%
1
                            DEMOGRAPHICS                                            Department of Health, 2016

    This first chapter of the SEP focusses on the people living in Drakenstein itself. A demographic
    perspective on a municipality allows to observe not only simple changes in population growth,
    but also to look at other various developments that influence the social life of every citizen.
    Demographics allow to emphasise aspects of society like, e.g. gender, race, migration or life
    expectancy. Decisions made by politicians as well as by the administration affect in almost
    every case at least one aspect of Demographics. Therefore, a good understanding of this area
    is crucial for the government’s work.

    The overview of key demographic factors given in this chapter comprises of the estimates of
    population size, the distribution of population within age cohorts and furthermore the
    dependency ratio, which is of high importance for understanding economic activity in the
    area as well as for planning welfare systems. With this short, but informative overview, the SEP
    tries to help the municipalities in their budgeting process by delivering precise data as a solid
    foundation for future decisions.

    Data source: Department of Social Development, 2017

                                                                                     Contribution to GDP, 2016

1   2017 Socio-economic Profile: Drakenstein Municipality
POPULATION
      350 000

      300 000

      250 000

      200 000

      150 000

      100 000

       50 000

             0
                 Breede Valley     Drakenstein         Langeberg      Stellenbosch      Witzenberg
          2018      179 550          273 066            104 289         176 523           130 607
          2019      181 259          275 980            105 159         179 463           132 542
          2020      182 941          278 791            106 013         182 372           134 444
          2021      184 576          281 498            106 862         185 216           136 295
          2022      186 182          284 087            107 708         187 983           138 107
          2023      187 723          286 563            108 539         190 680           139 872

    According to the estimates of the Department of Social Development, the population of
    Drakenstein is expected to expand rapidly across the next 5 years. As per above, the
    population will grow from 273 066 people in 2018 to 286 563 in 2023 which equates to a
    1.0 per cent year-on-year growth rate. This rate is relatively lower than that of the District as a
    whole (1.4 per cent).

    AGE COHORTS
                    Children:                  Working Age:             Aged:           Dependency
      Year
                   0 - 14 Years                15 - 65 Years             65 +              Ratio
      2011            64 293                     173 839               13 137               44.5

      2018            70 386                     185 403               17 278               47.3

      2023            72 085                     193 185               21 294               48.3

    The above table depicts the population composition regarding age cohorts. The total
    population is broken down into three different groups: Age 0 - 14: children; Age 15 - 65: working
    age population; Age 65+: seniors. A comparison between the 2018 and 2023 estimates show
    a sharp increase in the number of people within the working age and aged cohorts whilst the
    children grouping only increases marginally across the same reference period. The relative
    small increase in the child cohort attest of potential lower birth-rates which will in future impact
    upon the working age and over time increase the dependency ratio. A higher dependency
    ratio means increased pressure on social systems and the delivery of basic services.

2   2017 Socio-economic Profile: Drakenstein Municipality
2
                                   EDUCATION

    Education and training improves access to employment opportunities and helps to sustain and
    accelerate overall development. It expands the range of options available from which a
    person can choose to create opportunities for a fulfilling life. Through indirect positive effects
    on health and life expectancy, the level of education of a population also influences its
    welfare.

    Data source: Western Cape Education Department, 2017

3   2017 Socio-economic Profile: Drakenstein Municipality
LEARNER ENROLMENT
      50 000
      45 000
      40 000
      35 000
      30 000
      25 000
      20 000
      15 000
      10 000
       5 000
          0
                 Drakenstein         Langeberg       Stellenbosch     Witzenberg     Breede Valley
         2014      46 474              17 226           25 274          18 038          32 076
         2015      46 988              17 499           26 129          18 181          32 466
         2016      47 601              17 838           26 085          18 048          32 558

    Learners within the Cape Winelands District are largely concentrated within the Drakenstein
    region where enrolment figures increased by 2.4 per cent between 2014 and 2016. This growth
    attests to improved access to education.

    LEARNER-TEACHER RATIO
                               The learner-teacher ratio in Drakenstein increased significantly from
                               28.8 in 2014 to 36.3 in 2015, but remained relatively the same between
                               2015 and 2016 (36.5). The increase between 2014 and 2015 is
                               nonetheless a case of concern as it is commonly assumed that children
                               receive less personalised attention in larger class environments and
                               that high learner-teacher ratios are detrimental to improved
                               educational outcomes.

    GRADE 12 DROP-OUT RATES
    A total of 26.0 per cent of students that enrolled in Grade 10 in 2014 dropped out of school by
    the time they reached Grade 12 in 2016. Although this number is alarmingly high, it is a slight
    improvement from the 2015 drop-out rate of 27.1 per cent. These high levels of drop-outs are
    influenced by a wide array of economic factors including unemployment, poverty, indigent
    households, high levels of households with no income or rely on less than R515 a month and
    teenage pregnancies.

4   2017 Socio-economic Profile: Drakenstein Municipality
EDUCATIONAL FACILITIES
    The availability of adequate education facilities such as schools, FET colleges and schools
    equipped with libraries and media centres could affect academic outcomes positively.

          80
          70
          60
          50
          40
          30
          20
          10
           0
                     Number of Schools with Libraries               Total Number of Schools
         2014                      48                                          68
         2015                      49                                          68
         2016                      49                                          68

    There were 68 schools within the greater Drakenstein area in 2014 of which 48 had functional
    libraries. Although the number of schools have remained unchanged ever since, one
    additional school was equipped with a library in 2015. The unchanged number of schools does
    however appear problematic in the face of rising population numbers which will in time also
    increase the demand for quality education.

      100,0%

       90,0%

       80,0%

       70,0%

       60,0%

       50,0%

       40,0%

       30,0%

       20,0%

       10,0%

        0,0%
                Breede Valley       Drakenstein         Langeberg   Stellenbosch        Witzenberg
         2014      80,4%                67,7%             87,3%        65,0%                  84,9%
         2015      80,4%                67,7%             87,3%        65,0%                  84,9%
         2016      77,6%                67,7%             87,3%        64,1%                  83,3%

    The above graph depicts the number of no-fee schools within the various local municipalities
    of the Cape Winelands District. In Drakenstein, 68.0 per cent of all schools in 2016 were
    considered to be no-fee schools, which bodes well to improve access to education for people
    from poorer communities. With the exception of Stellenbosch, Drakenstein does however have
    the lowest number of no-fee schools in the District.

5   2017 Socio-economic Profile: Drakenstein Municipality
EDUCATION OUTCOMES
                               Education remains one of the key avenues through which the state
                               is involved in the economy. In preparing individuals for future
                               engagements in the broader market, policy decisions and choices in
                               the sphere of education play a critical role in determining the extent
                               to which future economy and poverty reduction plans can be
                               realised. This section measures the matric pass rates within the
                               Cape Winelands District.

     100,00%
      90,00%
      80,00%
      70,00%
      60,00%
      50,00%
      40,00%
      30,00%
      20,00%
      10,00%
       0,00%
                 Drakenstein        Langeberg       Stellenbosch     Witzenberg      Breede Valley
         2014      83,80%            84,20%           87,20%           75,10%           82,10%
         2015      86,70%            84,50%           85,60%           72,50%           82,40%
         2016      86,70%            85,70%           86,90%           74,50%           84,20%

    Matric pass rates within Drakenstein increased between 2014 (83.8 per cent) and 2015
    (86.7 per cent), but remained unchanged in 2016. Together with Stellenbosch, the Municipality
    enjoys the highest pass rate in the District. The increase in the pass rate drastically improves
    access to higher education opportunities which will in time satisfy the increased demand for
    semi and highly-skilled labour.

6   2017 Socio-economic Profile: Drakenstein Municipality
3
                                           HEALTH

    Health is another major factor contributing to the general quality of life in Drakenstein. It is
    therefore for the municipality important to monitor the public health facilities as well as a
    variety of factors as diseases like HIV or TB and general topics that affect the community, like
    maternal health. This Socio-economic Profile provides the basic statistics concerning those
    issues. Since this profile focusses on the public health facilities, private facilities do not appear
    in it.

    Data source: Department of Health, 2017

7   2017 Socio-economic Profile: Drakenstein Municipality
HEALTHCARE FACILITIES
All citizens’ right to access to healthcare services are directly affected by the number and
spread of facilities within their geographical reach. South Africa’s healthcare system is geared
in such a way that people have to move from primary, with a referral system, to secondary
and tertiary levels.
30
25
20
15
10
5
0
Total
Number of
Number of Number of number of
PHC Clinics - Number of Number of
Community ART clinics/ TB clinics/ PHC facilities
non-fixed PHC Clinics - regional
Day Centres treatment treatment (Fixed clinics,
mobiles/ fixed hospitals
sites sites CHCs and
satelite)
CDCs)
2014 3 13 6 13 1 23 16
2015 3 13 6 13 1 28 16
2016 3 13 6 13 1 27 16
In 2016, Drakenstein had a total number of 16 primary healthcare facilities – 13 fixed PHC clinics
as well as 3 community day centres. In addition, there are 13 ART and 27 TB treatment sites as
well as one regional hospital within the municipal area. With the exception of the number of
TB treatment sites that varied, the total number of healthcare facilities remained mostly
unchanged since 2014.
EMERGENCY MEDICAL SERVICES
Access to emergency medical services is critical for rural citizens
due to rural distances between towns and health facilities being
much greater than in the urban areas. Combined with the
relatively lower population per square kilometre in rural areas,
ambulance coverage is greater in rural areas in order to
maintain adequate coverage for rural communities.
The number of ambulances per 10 000 people in Drakenstein
increased from 0.2 in 2015 to 0.3 in 2016, remaining constant at
0.3 in 2017. This increase is welcomed as a larger number of
operational ambulances can provide a greater coverage of
emergency medical services. Drakenstein’s ambulance ratio in
2017 lower than that of the Cape Winelands District (0.5).
8 2017 Socio-economic Profile: Drakenstein MunicipalityHIV/AIDS
HIV/AIDS management is crucial given its implications for
the labour force and the demand for healthcare services.
Registered patients Number of new ART
HIV Transmission Rate
receiving ART patients
Area
2014 2015 2016 2014 2015 2016 2014 2015 2016
Drakenstein 5 902 6 578 7 815 1 399 1 515 1 428 1.1 0.9 2.3
Cape Winelands
19 615 23 172 27 162 4 595 5 195 5 097 1.7 1.7 1.5
District
There has been a steady rise in the number of registered patients receiving antiretroviral
treatment (ART) in Drakenstein since 2014 which attests of improved access to ART medication
as well as the success of proactive information campaigns by government to raise awareness
as to the availability of ART treatments. The number of new ART patients also notably
decreased. It has previously also been mentioned that the number of ART clinics/treatment
sites remain unchanged at 13 across the last 3 years which, given the increase in the number
of registered patients, could in time result in serious capacity constraints.
In addition to improving the quality of life of the patient, antiretroviral treatment to mothers
both before and at birth, also decreases the chances that infants will contract HIV from their
mothers. Despite the progress made to increase access to ART medication, the HIV
transmission rate between mother and child almost more than doubled in Drakenstein from
0.9 per cent 2015 to 2.3 per cent in 2016. The 2016 rate is also considerably higher than that of
the District.
TUBERCULOSIS
2 200
2 169
2 150
2 125
2 100 2014
2 050 2 020 2015
2 000 2016
1 950
1 900
Number of TB patients
The number of tuberculosis (TB) patients within Drakenstein increased from 2 020 patients in
2014 to 2 169 in 2015 which equates to a 7.4 per cent increase. This number slightly decreased
to 2 125 in 2016.
9 2017 Socio-economic Profile: Drakenstein MunicipalityCHILD HEALTH
Cape Winelands
Health Indicator Drakenstein
District
Immunisation 78.3% 79.4%
Malnutrition 3.1 3.9
Neonatal mortality rate 0.8 5.2
Low birth weight 14.0% 14.0%
The Department of Health strongly advises mothers to protect their children from infectious
diseases by getting them vaccinated from birth to when they are 12 years old. Vaccination is
free of charge at all health facilities. The Department also runs immunisation campaigns and
health workers are sent to nursery schools and crèches to immunise the children. The full
immunisation coverage rate for children under the age of one in Drakenstein in 2016 was
78.3 per cent which is relatively on par with the District rate of 79.4 per cent.
There were 3.1 malnourished children under five years per 100 000 people in Drakenstein in
2016. This is notably lower than the District rate of 3.9.
The Province aims to reduce neonatal deaths to 6 per 1 000 live births by 2019. Both Drakenstein
(0.8) and the Cape Winelands District’s (5.2) neonatal mortality rate was in 2016 already lower
than the Provincial target. Drakenstein’s rate was however still significantly lower than that of
the District.
A total of 14.0 per cent of all babies born in Drakenstein in 2017 were considered to be
underweight which is on par with the District average.
DEFINITIONS
Immunisation: The immunisation rate is calculated as the number of children immunised as
a percentage of the total number of children less than one year of age. Immunisation
protects both adults and children against preventable infectious diseases. Low immunisation
rates speak to the need for parents to understand the critical importance of immunisation,
as well as the need to encourage parents to have their young children immunised.
Malnutrition: Expressed as the number of malnourished children under five years per
100 000 people. Malnutrition (either under- or over-nutrition) refers to the condition whereby
an individual does not receive adequate amounts or receives excessive amounts of
nutrients.
Neonatal mortality rate: Measured as the number of neonates dying before reaching
28 days of age, per 1 000 live births in a given year. The first 28 days of life (neonatal period)
represent the most vulnerable time for a child’s survival. The Province’s target for 2019 is
6.0 per 1 000 live births.
Low birth weight: Percentage of all babies born in facility that weighed less than 2 500 g. Low
birth weight is associated with a range of both short- and long-term consequences.
10 2017 Socio-economic Profile: Drakenstein MunicipalityMATERNAL HEALTH
Cape
Health Indicator Drakenstein
Winelands
Maternal Mortality Ratio 0.0 0.1
Delivery Rate to Women
5.5% 6.6%
under 18 years
Termination of Pregnancy Rate 1.2% 0.6%
The maternal mortality ratio for both Drakenstein and the Cape Winelands District is essentially
zero which attests of improve maternal healthcare interventions such as the upskilling of health
professionals, especially nurses, and the implementation of best practices.
The delivery rate to women under the age of 18 years in Drakenstein has gradually been on
the decrease in the last few years, from 6.7 per cent in 2014, 5.6 in 2015 to 5.5 per cent in 2016.
The termination of pregnancy rate in Drakenstein has remained unchanged at 1.2 per cent for
the last three years, but is nonetheless almost double that of the District at 0.6 per cent which
is quite concerning.
DEFINITIONS
Maternal health refers to the health of women during pregnancy, childbirth and the
postpartum period.
Maternal mortality rate: Maternal deaths per 100 000 live births in health facilities. Maternal
death is death occurring during pregnancy, childbirth and the puerperium of a woman
while pregnant or within 42 days of termination of pregnancy, irrespective of the duration
and site of pregnancy and irrespective of the cause of death (obstetric and non-obstetric).
Births to teenage mothers: Percentage of babies born to mothers under the age of 18 years.
Teenage pregnancy is almost always unplanned; as a result, when young parents are
placed in a position to care for their children, life can become particularly tough, especially
if they do not have family or social support.
Termination of pregnancy: The percentage of terminations as a proportion of the female
population aged 15 to 44 years. Government hospitals, designated private doctors and
gynaecologists, and non-profit providers offer safe and legal termination of pregnancy. To
have a free abortion, the request must be made at a primary healthcare clinic, where the
pregnancy will be confirmed, counselling provided, an appointment made, and a referral
letter be given to a facility where the procedure can be performed.
11 2017 Socio-economic Profile: Drakenstein Municipality4
POVERTY
This section shows living conditions and economic circumstances of households in the
Drakenstein municipal area based on most recent data including Statistics South Africa’s
Non-Financial Census of Municipalities 2016 and Quantec. Economic theory suggests that
when an economy prospers its households are expected to enjoy a good standard of living.
On the contrary, a declining economy tends to lower the standards of living of people. This
section uses indicators in terms of GDP per capita, income inequality, human development,
as well as indigent households and free basic services to show the current reality of households
residing in the Drakenstein municipal area.
The deteriorating financial health of households and individuals under the weight of economic
pressures, specifically between 2011 and 2015, has resulted in an increase in the poverty levels,
according to the Poverty Trends in South Africa report released by Statistics South Africa in
2017. The report cites rising unemployment levels, low commodity prices, higher consumer
prices, lower investment levels, household dependency on credit, and policy uncertainty as
the key contributors to the economic decline in recent times. These recent findings indicate
that the country will have to reduce poverty at a faster rate than previously planned.
According to the report the categories of people vulnerable to poverty remained to be
African females, children 17 years and younger, people from rural areas, and those with no
education. Inflation-adjusted poverty lines show that food poverty increased from R219 in 2006
to R531 per person per month in 2017. The lower-bound poverty line has increased from R370
in 2006 to R758 per person per month in 2017 while the upper-bound poverty line has increased
from R575 in 2006 to R1 138 per person per month in 2017.
12 2017 Socio-economic Profile: Drakenstein MunicipalityGDPR PER CAPITA
An increase in real GDPR per capita, i.e. GDPR per person, is experienced only if the real
economic growth rate exceeds the population growth rate.
70 000
60 000
50 000
GDPR per capita
40 000
30 000
20 000
10 000
0
2005 2006 2007 2008 2009 2010 2011 2012 2013 2014 2015 2016
Drakenstein 48 311 49 636 51 941 54 062 51 820 52 000 52 778 53 304 53 770 54 337 53 866 53 135
Cape Winelands District 43 830 44 634 47 014 49 988 48 374 48 784 49 682 50 241 50 709 51 591 50 838 50 239
Western Cape 54 363 56 550 59 251 60 656 58 845 59 197 60 423 61 095 61 648 61 935 61 794 61 199
Source: Stats SA 2017, own calculations
At 53 135 in 2016, the GDP per capita for Drakenstein is above that of the Cape Winelands
region as a whole, but considerably lower than the average Provincial rate. A comparison of
the Drakenstein and Cape Winelands trend lines does however reveal that the District average
has gradually been catching up to the municipal rate which indicates that production is
increasing progressively in other municipal areas within the region.
INCOME INEQUALITY
The National Development Plan has set a target of reducing income inequality in South Africa
from a Gini coefficient of 0.7 in 2010 to 0.6 by 2030.
0,62
0,61
0,60
0,59
0,58
0,57
0,56
Drakenstein Cape Winelands Western Cape
2010 2011 2012 2013 2014 2015 2016
Source: Global Insight, 2017
It is concerning to note that income inequality has on average been increasing not only in
Drakenstein, but also in the Cape Winelands and the broader Western Cape Province. This
indicates that the relative satisfactory growth experienced across these regions has not
equally been distributed amongst households or individuals. A contributing factor to this trend
in specifically the Cape Winelands District can be the large income disparities observed
between farmers and farm workers. A slight improvement in the Gini coefficient for Drakenstein
has however been observed between 2015 and 2016. Drakenstein’s Gini coefficient was in
2016 calculated to be 0.59.
13 2017 Socio-economic Profile: Drakenstein MunicipalityHUMAN DEVELOPMENT
The United Nations uses the Human Development Index (HDI) 1 to assess the relative level of
socio-economic development in countries.
0,75
0,70
0,65
0,60
0,55
Drakenstein Cape Winelands Western Cape
2010 2011 2012 2013 2014 2015 2016
Source: Global Insight, 2017
Despite increasing levels of income inequality across the Cape Winelands District, overall
human development has gradually been on the increase in Drakenstein, Cape Winelands and
the Western Cape as a whole since 2010. Do bear in mind that HDI only considers a select
number of indicators (life expectancy, education and standard of living) and does therefore
not offer a conclusive reflection of the overall levels of human development. Drakenstein’s HDI
was estimated to be 0.71 in 2016.
INDIGENT HOUSEHOLDS
The constraining macro-economic climate is expected to impact heavily on the various
municipal areas of the Western Cape, especially in rural communities where an economic
downturn will result in significant job losses across. Rising unemployment figures will
subsequently result in a decrease in expendable household income which, coupled with rising
inflation rates, will force many families into poverty. Municipal services will ultimately become
unaffordable, resulting in these households becoming reliant on free basic services which will
in turn strain the already limited resources of a municipality.
Area 2014 2015 2016
Drakenstein 10 977 11 211 16 534
Cape Winelands District 33 406 34 704 42 756
Western Cape 404 413 505 585 516 321
Source: Department of Local Government, 2017
The rise in indigent households within Drakenstein has been quite dramatic in recent times. This
sudden increase can potentially be linked to job losses within the agricultural sector and the
influx of citizens that move from outlying smaller towns to Drakenstein in search of employment
opportunities.
1 The HDI is a composite indicator reflecting education levels, health, and income. It is a measure of peoples' ability
to live a long and healthy life, to communicate, participate in the community and to have sufficient means to be
able to afford a decent living. The HDI is represented by a number between 0 and 1, where 1 indicates a high
level of human development and 0 represents no human development.
14 2017 Socio-economic Profile: Drakenstein Municipality5
BASIC SERVICE DELIVERY
The Constitution of the Republic of South Africa states that every citizen has the right to access
to adequate housing and that the state must take reasonable legislative and other measures
within its available resources to achieve the progressive realisation of this right. Access to
housing also includes access to services such as potable water, basic sanitation, safe energy
sources and refuse removal services, to ensure that households enjoy a decent standard of
living.
This section reflects on housing and basic services access levels (Census 2011) and the
incremental progress municipalities have made hereto within the last 5 years (Community
Survey 2016).
15 2017 Socio-economic Profile: Drakenstein MunicipalityHOUSEHOLDS
In order to ensure basic service delivery to all, municipal
budget allocations should be informed by credible and
accurate assumptions regarding the number of households
within a municipal area.
Access to formal housing and services in Drakenstein is
measured against a total number of households of 59 774 in
2011 and 71 686 in 2016 which equates to average annual
growth of 3.7 per cent (2 382 households). Drakenstein
experienced a higher growth rate in the number of
households from 2011 to 2016 relative to the Cape Winelands
District.
Average Average
Area 2011 2016 annual annual growth
increase 2011 - 2016
Drakenstein 59 774 71 686 2 382 3.7%
Cape Winelands District 198 265 236 006 7 548 3.5%
ACCESS TO HOUSING
SERVICE STANDARD DEFINITION: Households with access to a formal dwelling.
Average Average
Total
annual annual
Area 2011 2016 increase
increase growth
2011 - 2016
2011 - 2016 2011 - 2016
Drakenstein 85.1% 90.3% 13 835 2 767 4.9%
Cape Winelands District 82.3% 81.0% 27 999 5 600 3.2%
The percentage of households with access to a formal
dwelling in Drakenstein increased from 85.1 per cent in 2011
to 90.3 per cent in 2016 which indicates that housing delivery
within the Municipality takes place at a faster rate than the
growth in the total number of households. The number of
formal dwellings in Drakenstein increased by 13 835 between
2011 and 2016, at an average annual rate of 4.9 per cent,
which translates into approximately 2 767 additional formal
dwellings per year over this period.
16 2017 Socio-economic Profile: Drakenstein MunicipalityACCESS TO WATER
Given the Western Cape’s current drought situation, great focus is currently placed on water
availability and supply. This goes hand in hand with due consideration for water quality. Access
to safe potable water is essential to prevent the contraction and spread of diseases and
maintaining a healthy life.
SERVICE STANDARD DEFINITION: Households with access to piped water inside the dwelling
or yard or within 200 metres from the yard.
Average Average
Total
annual annual
Area 2011 2016 increase
increase growth
2011 - 2016
2011 - 2016 2011 - 2016
Drakenstein 99.4% 99.5% 11 889 2 378 3.7%
Cape Winelands District 99.2% 98.6% 36 002 7 200 3.4%
In 2011, 99.4 per cent of all households within Drakenstein enjoyed access to piped water.
Despite a significant increase in the total number of households since then, the Municipality
was in 2016 still able to provide 99.5 per cent of all households with water services. The
Municipality was therefore able to provide an additional 11 889 households (average annual
increase of 2 378 households, or 3.7 per cent) access to piped water between 2011 and 2016.
ACCESS TO SANITATION
Access to sanitation promotes health and dignity through the provision of safe disposal and
treatment of human waste. Where sanitation systems are inadequate, negative health effects
can be extremely serious. The current drought highlights challenges in the use of potable water
within the sanitation services process.
SERVICE STANDARD DEFINITION: Households with access to a flush or chemical toilet
connected to the sewerage system.
Average Average
Total
annual annual
Area 2011 2016 increase
increase growth
2011 - 2016
2011 - 2016 2011 - 2016
Drakenstein 93.7% 98.4% 14 545 2 909 4.7%
Cape Winelands District 91.5% 96.9% 47 232 9 446 4.7%
Drakenstein Municipality has since 2011 made significant progress in terms of providing all
citizens with access to acceptable standards of sanitation services, to the extent that
98.4 per cent of all households enjoy access to a flush toilet connected to a sewerage system.
Closer consideration of the annual service delivery data reveals that the Municipality was
between 2011 and 2016 able to provide an additional 2 909 households access to sanitation
on an annual basis. Access therefore grew at an average annual rate of 4.7 per cent.
17 2017 Socio-economic Profile: Drakenstein MunicipalityACCESS TO ELECTRICITY
Energy is essential for human life and households generally apply electricity for cooking,
heating and lighting purposes. Energy sources also have usage risks; for example, health and
safety risks especially in the use of paraffin and open flame usage.
SERVICE STANDARD DEFINITION: Households with access to electricity as the primary source
of lighting.
Average Average
Total
annual annual
Area 2011 2016 increase
increase growth
2011 - 2016
2011 - 2016 2011 - 2016
Drakenstein 95.0% 94.5% 10 936 2 187 3.6%
Cape Winelands District 92.8% 92.6% 34 507 6 901 3.5%
The total number of households in Drakenstein grew by 11 912 between 2011 and 2016 whilst
the total number of households receiving access to electricity only increasing by
10 936 households. Household growth is therefore outstripping the provision of electricity
services, evident from the fact that 94.5 per cent of all households had access in 2016,
compared to 95.0 per cent in 2011.
ACCESS TO REFUSE REMOVAL
Refuse removal is an essential service that ensures that health related problems are kept at
bay. A lack of or inadequate service is likely to result in illegal dumping. There are growing
concerns around the land and environmental limitations in the creation and lifespan of landfill
sites. This would benefit greatly from the ‘reduce – reuse – recycle’ approach, that encourages
non-wasteful consumption practices (reduce), the reuse of products where possible (reuse)
and the recycling of the product where its use in current form has been exhausted (recycle).
SERVICE STANDARD DEFINITION: Households who have solid waste removed by local
authorities at least weekly.
Average Average
Total
annual annual
Area 2011 2016 increase
increase growth
2011 – 2016
2011 - 2016 2011 - 2016
Drakenstein 86.1% 90.6% 13 436 2 687 4.7%
Cape Winelands District 79.9% 81.8% 34 548 6 910 4.0%
The Municipality has made great strides to extend refuse removal services to all households i.e.
access to waste removal services at least once a week improved from 86.1 per cent in 2011
to 90.6 per cent in 2016. The current refuse removal services backlog can arguably be
attributed to outlining farms areas that does not fall within the ambit of responsibility of the
Municipality or areas that are geographically difficult to reach.
18 2017 Socio-economic Profile: Drakenstein Municipality6
SAFETY AND SECURITY
The Constitution upholds the notion that everybody has the right to freedom and security of
the person. The safety of persons and property is therefore vitally important to the physical and
emotional well-being of people and business. Without the respect of person and property, it
would be impossible for people to live peacefully, without fear of attack and for businesses to
flourish.
The extent of crime in South Africa does however not only have a significant impact on the
livelihood of citizens, but also affects the general economy. Crime hampers growth and
discourages investment and capital accumulation. If not addressed with seriousness, it has the
potential to derail both social and economic prosperity.
People’s general impressions, as well as official statistics on safety and crime issues, mould
perceptions of areas as living spaces or place in which to establish businesses. The discussion
in this section that follows is limited to the reported contact and property-related crime such
as murder and sexual crimes, as well as crime heavily dependent on police action for
detecting drug-related crimes and driving under the influence of alcohol/drugs.
Note: Percentage change calculation will differ from the actuals reflected due to rounding
down to per 100 000 population.
Data source: The data depicted in the following section was sourced from the 2017 Crime
Statistics released by the South African Police Service (SAPS) in October 2017. Incidences of
crime per 100 000 were calculated using actual crime and estimated population figures
provided by SAPS. Also note that although the crime data contained in the following section
is for ease of reference depicted as a single calendar year, it is in actual fact referring to
criminal activity within a financial year i.e. incidences of murder for 2016 is referring to
occurrences within the period April 2016 to March 2017.
The information relating to fatal crashes and crash fatalities were sourced from the
Department of Transport and Public Works.
19 2017 Socio-economic Profile: Drakenstein MunicipalityMURDER
Area 2015 2016 % Change
Drakenstein
30 47 57.9
(per 100 000)
Cape Winelands District
33 41 23.0
(per 100 000)
Definition: Murder is a social contact crime resulting in the loss of life of the victim, but excludes
cases where the loss of life occurred as a result of a response to a crime, for example
self-defence.
It is extremely concerning to note that the number of murders per 100 000 population in
Drakenstein increased by 57.9 per cent between 2016 (30) and 2017 (47) meaning that
statistically speaking 47 out of every 100 000 people in Drakenstein will succumb to murder in
2017. This is the highest number of recorded murder incidences amongst all other local
municipalities in the Cape Winelands.
Although significantly lower than Drakenstein’s rate, the number of murders across the District
also increased at an alarming 23.0 per cent from 33 incidences per 100 000 people in 2016 to
41 in 2017.
SEXUAL OFFENCES
Area 2016 2017 % Change
Drakenstein
124 126 1.6
(per 100 000)
Cape Winelands District
117 111 -5.6
(per 100 000)
Definition: Sexual offences includes rape (updated to the new definition of rape to provide for
the inclusion of male rape), sex work, pornography, public indecency and human trafficking.
The rate of sexual violence in South Africa is amongst the highest in the world. In addition, a
number of sexual offence incidences often go unreported (as in the case of rape).
Incidences of sexual offences increased slightly from 124 reported cases per 100 000 people in
2016 to 126 in 2017 (1.6 per cent increase). In contrast, reported incidences across the District
as a whole decreased notably by 5.6 per cent from 117 cases in 2016 to 111 in 2017.
20 2017 Socio-economic Profile: Drakenstein MunicipalityDRUG-RELATED CRIMES
Area 2016 2017 % Change
Drakenstein
1 195 1 422 19.0
(per 100 000)
Cape Winelands District
1 395 1 624 16.5
(per 100 000)
Definition: Drug-related crimes refers to the situation where the perpetrator is found to be in
possession of, under the influence of, or selling illegal drugs. This is a crime detected through
police activity rather than reports by members of the public. An increase in crimes of this nature
may therefore reflect an increase in police.
Drug-related crimes have a negative impact on human development by degrading the
quality of life as it infiltrates all aspects of society including families, health, the work
environment and the economy. Drug-related crimes within the Drakenstein areas increased
from 1 195 incidences per 100 000 people in 2016 to 1 422 in 2017, an increase of 19.0 per cent.
The Cape Winelands District trend is also on an upwards trajectory, with drug-related crimes
increasing by 16.5 per cent from 1 395 incidences in 2016 to 1 624 in 2017.
DRIVING UNDER THE INFLUENCE
Area 2016 2017 % Change
Drakenstein
71 69 -2.8
(per 100 000)
Cape Winelands District
105 106 0.5
(per 100 000)
Definition: DUI refers to a situation where the driver of a vehicle is found to be over the legal
blood alcohol limit. This is a crime detected through police activity rather than reports by
members of the public.
Despite concerted efforts by government our roads are still considered amongst the most
dangerous in the world. Reckless driving and alcohol consumption remain the top reason for
road accidents.
The number of cases of driving under the influence of alcohol or drugs per 100 000 people in
Drakenstein decreased by 2.8 per cent from 71 occurrences in 2016 to 69 in 2017. This decrease
can potentially be attributed to more visible policing efforts as well as the roll-out of awareness
campaigns. The number of DUI cases across the District remained relatively unchanged
between 2016 and 2017.
21 2017 Socio-economic Profile: Drakenstein MunicipalityRESIDENTIAL BURGLARIES
Area 2016 2017 % Change
Drakenstein
700 691 -1.4
(per 100 000)
Cape Winelands District
763 750 -1.8
(per 100 000)
Definition: Residential burglary is defined as the unlawful entry of a residential structure with the
intent to commit a crime, usually a theft.
Given its regular occurrence and the psychological impact on victims, residential burglaries
are an obstinate concern in South Africa. It is therefore relieving to note that incidences of
residential burglaries per 100 000 decreased in both Drakenstein (-1.4 per cent) and the District
(-1.8 per cent) as a whole between 2016 and 2017.
FATAL CRASHES
Area 2015 2016 % Change
Drakenstein 39 53 35.9
Cape Winelands District 189 218 15.3
Definition: A crash occurrence that caused immediate death to a road user i.e. death upon
impact, flung from the wreckage, burnt to death, etc.
Above graphic indicates that in 2015 there were a total of 39 fatal crashes involving motor
vehicles, motorcycles, cyclists and pedestrians within the jurisdiction of the Drakenstein
Municipality. This number increased exponentially by 35.9 per cent to 53 in 2016. The number
of fatal crashes in the broader Cape Winelands District increased by 15.3 per cent from
189 crashes in 2015 to 218 in 2016.
22 2017 Socio-economic Profile: Drakenstein MunicipalityROAD USER FATALITIES
Area 2016 2017 % Change
Drakenstein 44 61 38.6
Cape Winelands District 226 290 28.3
Definition: The type of road user that died in or during a crash i.e. driver, cyclist, passengers,
pedestrians.
According to a recent study, the majority of road fatalities in Africa fall within the working age
cohort - between the ages of 15 - 44 years - whilst three out of four fatalities were found to be
male (Peden et al., 2013). The untimely death of these primary breadwinners therefore impacts
directly upon not only the livelihood of family structures, but deprive society of active
economic participants that contribute towards growth and development. The
socio-economic impact of such road fatalities has proven to be particularly devastating in
South Africa where the majority of road users hail from poor and vulnerable communities.
The previous section specified that a total of 53 fatal crashes occurred within the Drakenstein
region in 2016. This gave rise to a total of 61 road users succumbing in those crashes. This is
17 more deaths than the 44 recorded in 2015 which equates to a 38.6 per cent increase in
road user fatalities.
Additional, lower-level information regarding the time, location, gender, ages of above
specified crashes are available from the Department of Transport and Public Works upon
request.
23 2017 Socio-economic Profile: Drakenstein Municipality7
THE ECONOMY
Economic growth at the municipal level is essential for the attainment of economic
development, the reduction of poverty and improved accessibility. Fostering this growth
requires an in-depth understanding of the economic landscape within which each respective
municipality operates.
Most municipalities within the Western Cape are currently experiencing hydrological drought
conditions where the severe weather is affecting groundwater levels in natural springs, streams,
reservoirs and dams to the extent that potable water has reached alarmingly low levels. An
overview of the current economic reality facing the municipalities of the Western Cape would
therefore not be complete without elaborating on the manner in which the drought impacts
upon the short and medium term financial and economic sustainability of local authorities.
24 2017 Socio-economic Profile: Drakenstein MunicipalityECONOMIC SECTOR PERFORMANCE
It is evident that Drakenstein’s economy is mostly characterised by tertiary sector activities
which collectively contributed 66.8 per cent to the total GDPR. Contrary to the perception that
the Cape Winelands area is driven by agricultural activities, the local economy is therefore
mostly urban in nature. This sector has historically performed particularly well, experiencing
average annual growth of 4.0 per cent between the period 2005 and 2015. Growth did
however subdue in the last 5 years (3.6 per cent between 2010 and 2015) to such an extent
that the sector is expected to only grow by 2.0 per cent in 2016.
Drakenstein GDPR performance per sector, 2005 – 2016
Contribution R million Trend Real GDPR growth (%)
to GDPR (%) value
Sector 2015 2015 2005 - 2015 2010 - 2015 2011 2012 2013 2014 2015 2016e
Primary Sector 6.6 1 225.6 2.5 2.1 0.8 1.7 2.8 8.2 -2.8 -8.7
Agriculture, forestry 6.4 1 181.9 2.6 2.1 0.8 1.7 2.8 8.2 -2.8 -8.7
and fishing
Mining and quarrying 0.2 43.7 -0.4 2.1 2.7 1.0 2.9 6.9 -3.0 -6.4
Secondary Sector 26.6 4 940.1 0.1 -0.2 -0.4 0.3 0.1 -0.1 -0.7 -1.1
Manufacturing 16.0 2 971.4 -1.7 -1.9 -1.3 -1.4 -2.3 -2.2 -2.1 -2.6
Electricity, gas and 2.6 484.5 2.0 1.9 4.4 2.9 2.1 1.0 -0.9 -1.7
water
Construction 8.0 1 484.2 7.4 4.5 1.3 5.0 7.0 6.0 3.2 3.1
Tertiary Sector 66.8 12 390.7 4.0 3.6 4.9 3.9 3.6 2.9 2.5 2.0
Wholesale and retail 17.7 3 277.1 4.1 4.0 5.6 5.2 3.6 2.9 2.7 2.4
trade, catering and
accommodation
Transport, storage 8.9 1 657.7 2.2 2.3 3.6 2.3 2.5 3.1 0.0 0.0
and communication
Finance, insurance, 21.2 3 940.2 5.1 4.0 5.0 4.1 3.7 3.2 4.3 2.8
real estate and
business services
General government 10.6 1 966.3 3.1 2.9 5.2 2.7 3.9 2.5 0.3 0.9
Community, social 8.4 1 549.5 3.9 3.6 4.5 4.2 4.0 2.7 2.3 1.6
and personal
services
Total Drakenstein 100 18 556.3 2.8 2.5 3.2 2.8 2.6 2.6 1.3 0.4
Source: Quantec Research, 2017 (e denotes estimate)
The finance, insurance, real estate and business services (21.2 per cent), wholesale and retail
trade, catering and accommodation (17.7 per cent) and the manufacturing (16.0 per cent)
subsectors are the largest contributors to the local economy, collectively contributing
R10.2 billion to Drakenstein’s GDPR in 2015.
The finance, insurance, real estate and business services subsector has been growing at an
aggressive pace, maintaining average annual growth of 5.1 per cent between 2005 – 2015.
Although growth slowed to 4.0 per cent in the last 5 years (2010 – 2015), the subsector has still
been able to outperform the local economy as a whole across the same period (2.5 per cent).
The strength of this subsector is further illustrated by the estimate that it will grow at 2.8 per cent
in 2016, whereas the overall local economy is only expected to grow at 0.4 per cent.
Wholesale and retail trade, catering and accommodation is arguably the most consistent
performing subsector in Drakenstein, maintaining 4.1 per cent growth between 2005 and 2010
and 4.0 per cent for the period 2010 – 2015.
25 2017 Socio-economic Profile: Drakenstein MunicipalityIt is concerning to note that the manufacturing sector, which contributes so significantly to the
local economy (16.0 per cent in 2015), has on average been experiencing growth of -1.7 per
cent between 2005 and 2015 and that this contracted growth intensified in recent times
to -1.9 per cent for the period 2010 – 2015.
The construction sector has also achieved above average growth over the last five years
compared to other sectors in the Drakenstein municipal area, growing at an average annual
rate of 4.5 per cent per annum, indicating continued investment in this economy, even though
growth is also decreasing as in other sectors. The high growth rates in 2012, 2013 and 2014
coincides with roadworks and construction activities at social facilities undertaken by the
Municipality.
Despite relatively modest contribution to GDPR in 2015 (6.4 per cent) the agriculture, forestry
and fishing subsector is still of particular significance to the local economy. This subsector’s
anticipated decline in 2016 (-8.7 per cent growth) will therefore, together with the
manufacturing sector (-2.6 per cent in 2016) contribute to the Municipality’s overall weakened
GDPR growth of 0.4 per cent in 2016.
LABOUR
Whilst the Drakenstein municipal area employed 28.4 per cent of the Cape Winelands’ total
labour force in 2015, it also had the highest levels of unemployment (14.4 per cent). The level
of unemployment is to a certain extent to be expected, considering the Municipality’s large
population size.
Below table reflects the Municipality’s employment growth trends within each economic
sector contributing to the local economy.
Drakenstein employment growth per sector
Contribution to
employment Number Trend Employment (net change)
(%) of jobs
Sector 2015 2015 2005 - 2015 2010 - 2015 2011 2012 2013 2014 2015 2016e
Primary Sector 15.1 16 206 -4 402 3 529 -539 781 667 -857 3 477 -181
Agriculture, forestry 15.1 16 133 -4 366 3 554 -538 780 695 -857 3 474 -181
and fishing
Mining and quarrying 0.1 73 -36 -25 -1 1 -28 - 3 -
Secondary Sector 17.2 18 474 -693 682 133 -64 362 103 148 143
Manufacturing 8.6 9 263 -3 204 -1 100 -255 -486 119 -397 -81 -240
Electricity, gas and 0.3 329 123 71 16 12 7 13 23 11
water
Construction 8.3 8 882 2 388 1 711 372 410 236 487 206 372
Tertiary Sector 67.6 72 434 22 332 11 843 1 978 2 136 2 756 2 414 2 559 1 062
Wholesale and retail 22.6 24 158 7 849 4 107 806 894 733 749 925 407
trade, catering and
accommodation
Transport, storage 4.3 4 649 1 893 945 76 246 274 -10 359 -298
and communication
Finance, insurance, 14.5 15 535 3 914 2 032 374 271 439 269 679 351
real estate and
business services
General government 11.1 11 916 3 091 1 258 502 210 174 668 -296 233
Community, social 15.1 16 176 5 585 3 501 220 515 1 136 738 892 369
and personal
services
Total Drakenstein 100 107 114 17 237 16 054 1 572 2 853 3 785 1 660 6 184 1 024
Source: Quantec Research, 2017 (e denotes estimate)
26 2017 Socio-economic Profile: Drakenstein MunicipalityEmployment in this municipal area is dependent on a diverse range of sectors which is
reflective of the more urban nature of some of the towns in the area which all contribute goods
and services to other industries within the region.
In 2015, the Drakenstein municipal area employed a total of 107 114 people, the majority of
which (67.6 per cent; 72 434) were concentrated within the tertiary sector. The wholesale and
retail trade, catering and accommodation (22.6 per cent); community, social and personal
services (15.1 per cent) and the finance, insurance, real estate and business services
(14.5 per cent) subsectors contributed the most to employment within the Municipality.
The agriculture, forestry and fishing (15.1 per cent; 16 133) subsector, which forms part of the
primary sector, is also a large employer within the municipal area. Although employment
opportunities within this subsector decreased by 4 366 for the period 2005 – 2015, job-creation
accelerated in recent years, evident from the 3 554 additional jobs created for the period
2010 - 2015. The wine grape harvesting season in 2015 started earlier than normal due to
warmer weather in August and September, which put cellars under pressure to manage the
larger intakes over a shorter period, which could have contributed to additional seasonal
employment in the area (VinPro, 2016). However, with the decline in GDPR growth, it can be
expected that job creation will grow at slower rates and eventually sectors will shed jobs as in
the recession. Employment changes within this subsector testifies to its volatile nature and its
dependency on factors spanning beyond poor weather conditions, such as consumer
demand, exchange rates and commodity prices.
Unemployment Rates for the Western Cape (%)
Area 2005 2006 2007 2008 2009 2010 2011 2012 2013 2014 2015 2016e
Drakenstein 12.9 12.2 12.3 12.2 12.8 12.9 13.1 13.7 13.6 14.0 14.4 14.9
Cape Winelands 9.6 9.0 9.2 9.2 9.8 9.8 10.1 10.7 10.6 10.9 11.2 11.6
District
Western Cape 16.5 15.8 15.7 15.3 15.8 16.1 16.4 17.0 16.7 17.2 17.8 18.7
Source: Quantec Research, 2017 (e denotes estimate)
As mentioned previously, Drakenstein has the highest unemployment rate amongst all local
municipalities within the Cape Winelands District. Above table indicates that this rate has
gradually been increasing since 2015 and although the rate is still below that of the Western
Cape, it is higher than the District average.
27 2017 Socio-economic Profile: Drakenstein Municipality8
INFRASTRUCTURE DEVELOPMENT
Economic theory and empirical work suggest that public investment in infrastructure will boost
economic growth by stimulating related private sector investments – the so-called “crowding-
in effect” – as well as providing a solid foundation for social development (Swilling, 2006). In
South Africa the importance of infrastructure has not only been emphasised at national level
but also at regional level. The Western Cape Government’s main infrastructure budgets and
investment, both in social and economic infrastructure over the 2017 MTEF, includes spending
by provincial government departments and public entities; as well as spending on public
private partnerships.
In the Western Cape, the region needs efficient transport systems, water and sanitation,
telecommunications and power supplies in order to influence the standard of living of their
populations and regional economic growth. There is, thus, a pressing need to determine
whether government’s strategy on infrastructure investment will yield the desired economic
growth benefits at micro (i.e. project or sector level) or at national or macro level.
28 2017 Socio-economic Profile: Drakenstein MunicipalityPROVINCIAL INFRASTRUCTURE SPEND
Empirical evidence at a National level has shown that investment in economic infrastructure
has a positive impact on economic growth. This growth however depends crucially on
provincial and municipal performance. All municipalities are tasked with basic service delivery
objectives in order to stimulate local economic development. Population growth and
deteriorating infrastructure has continued to place strain on infrastructure budgets. The
objective of this section is to determine if there is a relationship between infrastructure
investment and growth in the Cape Winelands and to show the success the region has had in
providing infrastructure.
West Coast
R731.5 million
Overberg 9% Across districts
R416.0 million R2.6 billion
5% 30%
Eden
R1 billion
12%
Cape Winelands
City of Cape Town R1.3 billion
R2.4 billion Central Karoo 15%
28% R127.7 million
1%
Source: Provincial Treasury, 2017
In fulfilment of Provincial Strategic Goal 1 (PSG 1: Grow the economy and create jobs), the
Western Cape Government has dedicated R28.0 billion towards infrastructure development
across the 2017 Medium Term Expenditure Framework (MTEF). This amount will be spent on new
assets, replacements assets maintenance and repairs, upgrades and additions, rehabilitation,
renovation as well as the refurbishment of existing assets (Western Cape Estimates of Provincial
Revenue and Expenditure, 2017). Of this total, an amount of R26.1 billion has been set aside
for physical infrastructure developments whilst R231.0 million and R1.7 billion will respectively
be channelled towards broadband connectivity and public private partnerships.
The total Provincial Infrastructure budget for 2017/18 amounts to R8.6 billion which will be split
amongst the various municipal districts by taking into consideration a wide array of
socio-economic variables, most notably anticipated population growth trends as well as
estimated economic growth potential, the latter being influenced largely by the 2014 Growth
Potential Study of Towns (Donaldson et al, 2014).
The City of Cape Town assumes the majority of the Western Cape’s infrastructure allocations
with an estimated infrastructure spend of R2.4 billion (28 per cent of the total Provincial
allocation). The Cape Winelands region is another notable receiver of Infrastructure funding
with approximately R1.3 billion (15.0 per cent of the Provincial allocation).
29 2017 Socio-economic Profile: Drakenstein MunicipalityProvincial Infrastructure Allocations: Cape Winelands
There have been varying levels of infrastructure investments and development across the
131 towns outside the Cape Town Metropolitan areas. Some towns have solid development
potential while others are declining. A number of growth factors have contributed to this decline
(Donaldson et al 2010). Amongst these factors is a deteriorating infrastructure. Municipal
infrastructure consists mainly of bulk treatment plants, pump networks, pump stations treatment
works, reservoirs and distribution pipelines, electricity transmission and distribution infrastructure.
In some municipalities infrastructure remains under threat and requires increasingly more astute
management whilst other municipalities have invested significantly in infrastructure provision
and experience high growth rates.
Vote Cape Winelands
Witzenberg Drakenstein Stellenbosch Breede Valley Langeberg
R’000 District
CapeNature - - - - - -
Education - 23 617 5 000 15 000 21 413 25 000
Health - 38 132 5 269 21 181 6 637
Human Settlements - 38 960 79 764 7 767 100 200 32 150
Public Works 11 258 - - - - -
Social Development 92 - - - - -
Roads 181 863 72 000 86 000 91 492 81 300 331 400
Total 193 213 172 709 176 033 135 440 209 550 388 550
Source: Provincial Treasury, 2017
It is clear that the WCG’s infrastructure spend within the Cape Winelands District will in 2017/18
be concentrated within the Langeberg area largely as a result of the major road upgrade
projects currently underway between Ashton and Montagu. A total of R388.6 million will in
2017/18 be spent by the Provincial Government on infrastructure projects within the Langeberg
area.
Provincial Government infrastructure spend in Drakenstein will in 2017/18 amount to R176.0
million, the majority of which (R86.0 million) will also be directed towards road projects
(economic infrastructure). Projects to be funded through this allocation include the reseal and
rehabilitation of the Hermon-Gouda road (R25.0 million in 2019/20) as well as the reseal of the
Paarl-Malmesbury road (R45.0 million in 2017/18).
The following table lists the Top 10 2017/18 capital projects (in terms of value) that contribute to
Drakenstein’s total infrastructure allocation.
30 2017 Socio-economic Profile: Drakenstein MunicipalityR’000
Sector Project description
2017/18 2018/19 2019/20
Transport C1084 PRMG Paarl-Malmesbury reseal 45 000 28 000 2 000
Transport C850 Sandringham Road 38 000 1 000 -
Human Settlements 3207-xx03 - Paarl Vlakkeland Phase 1 TRA 32 978 39 300 -
(512 units) IRDP
Human Settlements 3207-01 - Paarl Vlakkeland Phase 1 25 000 23 600 4 990
(1 047 services) IRDP
Human Settlements 3207-xx - Paarl Vlakkeland (Bulk Infrastructure) IRDP 7 700 10 000 -
Human Settlements 3228-01 - Paarl Kingston (122 units) IRDP4 6 000 - -
Education Dal Josafat PS 5 000 15 000 25 000
Human Settlements 3068-xx - Paarl Dal Josafat Erf 16161 (1 200 units) 4 000 5 000 5 000
FLISP
Health CI810098: Wellington - Wellington CDC - Pharmacy 3 808 500 -
Additions and Alterations
Transport C1048 Paarl-Wellington reseal 2 000 - -
Source: Provincial Treasury, 2017
Although the two single largest provincial infrastructure allocations were made towards road
transport, the majority of the Top 10 projects relate to human settlements. The allocations
compliment the Municipality’s proactive efforts to invest in economic infrastructure and housing
to create integrated communities that geographically all enjoy equal access to economic
opportunities within central business nodes.
MUNICIPAL INFRASTRUCTURE SPEND
National and Provincial Transfers
The sources of infrastructure funding at municipal level mostly emanate from either National or
Provincial Government in the form of grants. Municipalities can however also fund
infrastructure projects through internal (own) revenue sources or from municipal own revenue.
The National Government recognises that infrastructure investment is the cornerstone to
economic and social upliftment. To this end in 2004 the Government introduced a Municipal
Infrastructure Grant to complement their capital budgets. Of the capital expenditure budget
allocated to municipalities within the Cape Winelands a large percentage of it goes to
Economic and Environmental Services and Trading Services (economic infrastructure) whilst
the remainder goes to Governance and Administration and Community and Public Safety.
The combination of dedicated provincial and municipal infrastructure spend will truly set the
Municipality and ultimately the Province on a higher growth path and improved
socio-economic environment.
The following table contains the total capital transfers and grants received by the Drakenstein
Municipality from National and Provincial Government in 2017/18. The information depicted
below was obtained from the budget schedules within the Municipality’s 2017/18 approved
budget. The names of specific grants may therefore differ from their official wording.
31 2017 Socio-economic Profile: Drakenstein MunicipalityYou can also read