Economic Outlook and Investment Strategy - February 2020 - City National ...
←
→
Page content transcription
If your browser does not render page correctly, please read the page content below

February 2020
Economic Outlook and Investment Strategy

           Investment management services provided by City National Bank through its wholly-owned subsidiary City National Rochdale, LLC, a registered investment advisor.

                                                                                                                                                                             1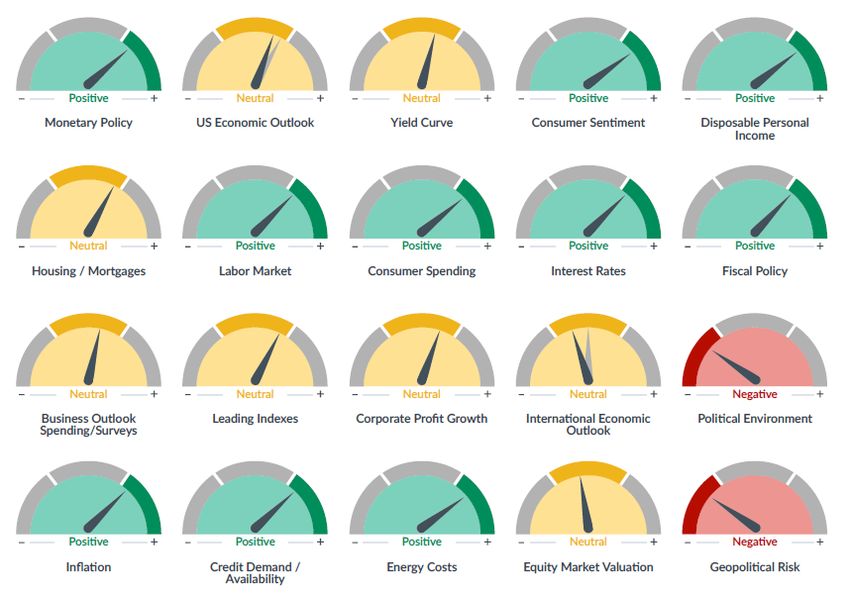
ECONOMIC & MARKET OUTLOOK
Navigating the Global Crosscurrents
Positives Cautionary Signs/Areas to Watch
Fed dovish pivot/favorable financial Aging business cycle
conditions
Coronavirus impact
Positive corporate profit growth
The investment Trade policy missteps
landscape, while still Healthy consumer and business fundamentals
positive, is growing Higher debt levels
more challenging as High confidence
Fading fiscal stimulus
investors adjust to
Modest inflation
more typical late-stage Potential acceleration in wages and other
expansion conditions. Bottoming of global slowdown/reduced trade business costs
tensions
Geopolitical shocks
Few signs of imbalances
Higher volatility and valuations
2ECONOMIC & MARKET OUTLOOK
Economic Outlook: Slowing, but Still Growing
Strong U.S. economic fundamentals include jobs, confidence and stable inflation.
The U.S. economy Trade remains a concern, but tensions appear to have eased for now.
appears to be in the
later stages of this Fiscal policy is giving a boost to GDP, but impact is fading.
economic expansion,
with slowing but Fed policy is supportive, but capacity to stimulate is likely limited.
sustainable growth.
Global outlook remains subdued: Modest cyclical upturn, delayed by coronavirus impact
City National Rochdale Forecasts 2018 2019e 2020e
GDP Growth 2.9% 1.75%-2.25% 1.65%-2.15%
Corporate Profit Growth 22% 1%-3% 3%-5%
Fed Funds Rate 2.375% 1.625% 1.50%
Interest Rates
Treasury Note, 10-Yr. 2.69% 1.50%-2.00% 1.50%-2.00%
Sources: Bureau of Economic Analysis, Standard & Poor’s, Bloomberg. As of February 2020.
3ECONOMIC & MARKET OUTLOOK
Economic and Financial Indicators
Indicators Are Forward-Looking Three to Six Months
City National Rochdale
indicators are signaling
slowing but sustainable
growth ahead.
Source: City National Rochdale. As of February 2020.
4ECONOMIC & MARKET OUTLOOK
Late-Cycle Periods Can Last For a While
Probability of Recession in the Next 12 Months
Economy Operating Above Potential
Easing of trade 50% or more
tensions and signs of
stabilization in the 30% to 50%
global outlook have
reduced near-term
recession risk. 30% or less
2007 2008 2009 2010 2011 2012 2013 2014 2015 2016 2017 2018 2019 2020
Output Gap Has Only Recently Closed
7%
5%
3%
1%
-1%
-3%
-5% Economy Operating Below Potential
-7%
1950 1955 1960 1965 1970 1975 1980 1985 1990 1995 2000 2005 2010 2015 2020
Source: City National Rochdale. As of December 2019. Gray column represents recessionary period.
5ECONOMIC & MARKET OUTLOOK
U.S. Growth to Moderate as Fiscal Tailwinds Fade
GDP Growth is Expected to Moderate Near Potential Rate
Quarterly Change in GDP (%)
6 Actual: Q3 @
5 2.1
4
3
With fiscal stimulus 2
fading and drags from 1
global trade tensions, 0
we expect U.S. growth -1
to gradually slow back -2
to trend over the next 2009 2010 2011 2012 2013 2014 2015 2016 2017 2018 2019 2020 2021
several quarters. Sources: Bureau of Economic Analysis, Bloomberg (forecast). As of February 2020.
Lower Consumption Has Caused Slower Growth
3.5 3.1 Contribution to GDP of Major Sectors (%)
3.0 Current Expansion Average
2.5 2.3
2.1 1980 to Great Recession Average
2.0 1.7
1.5
0.9
1.0 0.7
0.5
0.5
0.0
0.0
-0.5 -0.3 -0.2
GDP Consumption Investment Government Net Exports
Source: Bureau of Economic Analysis. As of February 2020.
6ECONOMIC & MARKET OUTLOOK
A Tale of Two Economies
Manufacturing Cycles Within the Broader Economic Cycle
Weighted Composite (3m Avg.)
Expanding (>50)
ISM Manufacturing (3m Avg.)
61
ISM Nonmanufacturing (3m Avg.)
Though manufacturing
has struggled against 59
trade and global
headwinds, the much 57
larger service sector
(about 80% of the US 55
economy) has been
53
relatively resilient.
51
49
47 Contracting (ECONOMIC & MARKET OUTLOOK
Economic Fundamentals Remain Solid
Unemployment Rate at Rarely Seen Low Inflation Remains Low
Levels Core-PCE Price Deflator (% chg., y-o-y)
12 Unemployment Rate U-3, (%) 3.0
Recession
Jan @ 3.6 2.5
10
4.0% Threshold
8 2.0
The U.S. economic 6 1.5
fundamentals remain 1.0 Recession
4
solid, with low Dec @ 1.6
0.5
unemployment, high 2
Period Average @ 1.7
confidence, modest 0 0.0
2000 2005 2010 2015
inflation and falling 1949 1959 1969 1979 1989 1999 2009 2019
Source: Bureau of Labor Statistics. As of February 2020. Source: Bureau of Labor Statistics. As of February 2020.
interest rates.
Mortgage Rates Are Falling
Confidence on an Upward Trend 30-Fixed Rate Mortgage (%)
University of Michigan Consumer Sentiment Index
125 9 Recession
Recession
7 Change from 1-year
Jan @ 99.8 ago: Jan @ -0.85
Period Average @ 5 Jan @ 3.72
100
87.0
3
1
75
-1
-3
50 2000 2005 2010 2015 2020
1980 1990 2000 2010
Source: City National Rochdale. As of February 2020. Gray columns
Source: Federal Reserve Bank. As of February 2020. represent recessionary periods.
8ECONOMIC & MARKET OUTLOOK
Healthy Consumer Fundamentals
Consumption Remaining Strong, Enjoying Tax Cuts
GDP - Consumption (% chg., y-o-y)
Historically High Savings Sign of Strong
8
Consumer
Recession 14 Personal Savings as a Percent of Disposable Personal Income
Sep @ 2.6 (%)
6 12
Period Average
4 10
2 8
6
0
Household financial 4
Recession
conditions are strong -2 Dec @ 7.6
2
and supportive of Period
-4 Average
further spending. 1980 1990 2000 2010 2020
0
1980 1990 2000 2010 2020
Source: Bureau of Economic Analysis. As of February 2020. Source: Bureau of Economic Analysis. As of February 2020.
Households Have Near Record Wealth
Household Net Worth ($, trillions) Debt Burden at Very Low Levels
120 Debt Service Ratio (%)
14
Recession
100
50% Larger 13 Sep @ 9.7
80
Period Average @
12 11.2
60
Recession 11
40
Sep @ 113.8
20 Current @ 113.8 10
Previous High @ 71.3
0 9
1980 1990 2000 2010 2020 1980 1990 2000 2010 2020
Source: Federal Reserve Bank. As of February 2020.
Sources: Federal Reserve Bank, Bureau of Economic Analysis. As of February 2020.
9ECONOMIC & MARKET OUTLOOK
Higher Oil Prices Will Not Derail Expansion
Oil Prices Still Below Expansion Average The U.S. Has Ramped Up Production
Oil (West Texas Intermediate) $/barbell U.S. Crude Oil Production 1,000 barrels per day
150 Recession 14,000
Recession
Jan 6 @ 63.26
125 12,000 Dec @ 12,900
Period average
10,000
100
8,000
75
With the U.S. no longer 6,000
50
a net importer of oil 4,000
products, the economy 25 2,000
is likely to be resilient 0 0
even if oil prices spike. 1985 1995 2005 2015 1985 1995 2005 2015
Source: Bloomberg. As of January 2020. Source: U.S. Department of Energy. As of January 2020.
A Big Reason for Increased Production is Fracking U.S. Trade Balance of Petroleum Products,
U.S. Shale Production as a % of U.S. Total Production SA
75 10
70 0
Oct @ 70.4
-10
65
-20
60
-30 Recession
55 -40 Oct @ 0.8
50 -50
2016 2017 2018 2019 2020 1995 2005 2015
Source: Rystad Energy, U.S. Department of Energy. As of January 2020. Source: U.S. Census Bureau. As of January 2020.
10ECONOMIC & MARKET OUTLOOK
Federal Debt Growing
Federal Debt Growing Faster Than Economy
Federal Debt is Growing Total Federal Debt as a Percentage of GDP (%)
Federal Revenues and Outlays 12 mo. r.a. ($, billion)
5,000
120
4,000 Recession
Net: Dec @ -1,022 100
3,000 Revenue: Dec @ 3,498 Recession
Outlays: Dec @ 4,520 80 2018 @ 108
Recent tax cuts and 2,000
60
increases in 1,000
government spending 40
0
have led to renewed -1,000 20
swelling of the federal -2,000 0
deficit. 1970 1980 1990 2000 2010 2020 1970 1980 1990 2000 2010 2020
Source: U.S. Treasury. As of February 2020. Source: Congressional Budget Office. As of December 2019.
Size of Gov't Debt Varies Greatly Low Interest Rates Keeping Cost of Deficit
Total Government Debt as a Percentage of GDP of G10 (%) Low
3.5 Interest on Federal Debt as a Percent of GDP (%)
Japan 236
Italy 131 3.0 2019 @ 1.8
United States 108 2.5
France 97 Period Average @ 1.7
Canada 87 2.0
United Kingdom 87
1.5
Brazil 84
European Union 83 1.0
India 70
China 66 0.5
Germany 60 0.0
0 50 100 150 200 250 1940 1960 1980 2000 2020
Source: International Monetary Fund. As of December 2019. Source: U.S. Treasury. As of February 2020.
11ECONOMIC & MARKET OUTLOOK
Trade Tensions Ease, but Uncertainty Remains
Despite Phase 1 Trade Deal, Tariffs Remain Significantly Higher
25 21.8 21.1 20.9
China's tariff on US exports 20.7 20.7 20.9
20 US tariff on Chinese exports 18.3 18.2 21.0 21.0 21.0
16.5 16.5 19.3
14.4 17.6 17.6
The recently signed US- 15
China trade deal is a 10.1
… 12.0 12.0 12.0
10 8.0 8.0 8.0 8.4 8.3
step in the right 7.2
…
direction, but as long as 5 …
core issues remain … …
3.8 3.8 3.8 3.8
unaddressed, 0
uncertainty will likely
continue to weigh on
the outlook.
Trade Policy Uncertainty Likely to Persist
600
400
200
0
1995 1997 1999 2001 2003 2005 2007 2009 2011 2013 2015 2017 2019
Sources: Peterson Institute for International Economics, PolicyUncertainty.com, City National Rochdale. As of January 2020.
12ECONOMIC & MARKET OUTLOOK
Global Outlook Remains Subdued
Estimated Impact of Coronavirus on 2020 Global Growth
(Base Case Scenario)
1.0%
0.5%
China is expected to
0.0%
face the brunt of the -0.5%
fallout from the -1.0%
Coronavirus, but most -1.5% Direct China Growth World ex China
of the loss in global -2.0%
economic output is Q1 Q2 Q3 Q4 2020 Annualized
Growth
expected to be
recovered over time.
Modest Global Cyclical Upturn likely Delayed, not Derailed
57
5.0%
55 4.0%
53 3.0%
2.0%
51
1.0%
49
0.0%
Global PMI World Industrial Production
47 -1.0%
2011 2012 2013 2014 2015 2016 2017 2018 2019 2020
Source: City National Rochdale and FactSet as of January.
13ECONOMIC & MARKET OUTLOOK
Euro Growth Prospects Remain Poor
Eurozone Growth is at Low Levels U.K. Underperforming Since Brexit Vote
GDP (%) Aggregate Change of Various Indicators
60
q-o-q: Sep @ 0.9
3.5
Brexit Vote
Political uncertainty, y-o-y: Sep @ 1.1
S&P 500: Dec @ 54.0
50
along with relatively 3.0 TW Pound: Dec @ -8.4
muted earnings growth 40
FTSE: Dec @ 16.0
and weak economic
momentum, supports 2.5 30
our continuing
underweight to 2.0
20
European equities.
10
1.5
0
1.0
-10
0.5 -20
Pre Brexit Vote Post Brexit Vote
-30
0.0
0
"48
-12
-9
-6
-3
+3
+6
+9
+12
+15
+18
+21
+24
+27
+30
+33
+36
+39
+42
+45
2015 2016 2017 2018 2019 2020
Source: Eurostat. As of January 2020. Sources: IMF, Bank of England, Financial Times, S&P 500. As of January 2020.
14ECONOMIC & MARKET OUTLOOK
Policy Should Still Be Supportive in 2020, But Less So
Easy Does It G-7 Interest Rates
(Global Central Bank Monetary Policy Actions) 1.85
4 wk. avg. Y/Y Ch. Jan. 17: - 41 bps
150 129 1.45
Rate Hikes Rate Cuts 1.05
0.65
100 92 0.25
Easier financial conditions
-0.15
should continue to support
-0.55
stock prices this year, but 43
50 -0.95
the central-bank stimulus 20 -1.35
and interest rate cuts that -1.75
were a key driver of returns 0 -2.15
last year are unlikely to be 2018 2019
repeated.
Global Central Bank Balance Sheets
3,000 U.K. Japan Eurozone
2,500
2,000
1,500
1,000
500
0 ?
-500
-1,000
-1,500
2011 2012 2013 2014 2015 2016 2017 2018 2019
Source: Bank of International Settlements, crbrates.com, Bloomberg, Central Banks.
15ECONOMIC & MARKET OUTLOOK
On Our Radar
Watching Credit Markets Closely for Signs of Distress
Corporate Credit Growth Could Be a Source of Bloomberg Barclays US Corporate Spreads by
Trouble Ahead Quality
Global Debt Market Segments ($USD, billions) 10.00
9.00
11,000 Total US IG Corporate Market Has More Than Tripled
in Size Over Past 10 Years! Caa
Total US HY Corporate 8.00
US Loans
9,000 7.00 Baa Ba
EM HY External Sovereign
EM HY Corporate 6.00
B Caa
7,000 5.00
B
4.00
5,000
3.00
Ba
2.00
3,000
1.00 Baa
12/31/18
1/31/19
2/28/19
3/31/19
4/30/19
5/31/19
6/30/19
7/31/19
8/31/19
9/30/19
10/31/19
11/30/19
12/31/19
1,000
2003
2004
2005
2006
2007
2008
2009
2010
2011
2012
2013
2014
2015
2016
2017
2018
2019
Source: Bloomberg, Bank of America Merrill/ICE as of December 2019.
16ECONOMIC & MARKET OUTLOOK
Asset Class Performance
Asset Class Returns
1YR
S&P 500 (TR) 3YR
S&P Small Cap 600
China Shanghai
Dow Jones Select Dividend Index
We don’t expect real Nasdaq-100
returns to be moderate, MSCI Europe
with higher volatility Equities
MSCI EAFE
over the next few
quarters. MSCI EM Asia
S&P U.S. Treasury Bond 10-Year Index
S&P/LSTA U.S. Leveraged Loan 100
Bloomberg Barclays Municipal HY
Bloomberg Barclays U.S. High Yield Corporate
Fixed Income
Bloomberg Barclays U.S. Aggregate
Corp. EM Bonds (J.P. Morgan CEMBI)
Brent Oil
Bloomberg Commodity Index Real Assets
-5% 0% 5% 10% 15% 20% 25% 30%
Source: FactSet. As of January 31, 2020. Total returns include dividends reinvested.
17ECONOMIC & MARKET OUTLOOK
Late-Cycle Playbook
Focus on Quality and Yield
Late-cycle conditions of slowing growth, lower returns, higher volatility and greater vulnerability to policy missteps
require a more proactive and risk-focused investment strategy.
Though U.S. fundamentals remain relatively healthy, the economic expansion is aging and slowing. With an active
approach, it is possible to remain invested while limiting your portfolio’s exposure in a potential decline.
Our Late-Cycle Playbook involves taking deliberate and measured steps to improve the quality and yield of portfolios
by focusing on selected credit areas, alternative investments and high-quality large cap U.S. stocks.
We have positioned our portfolios this way so that they will be able to help withstand volatility yet continue to
participate in gains.
More changes are likely to come as we follow our late-cycle playbook and respond to the maturing nature of the
cycle.
18ECONOMIC & MARKET OUTLOOK
Prepare for Lower Returns, Higher Volatility
Absolute Return Average
30%
25% Early Cycle Mid Cycle
20% Late Cycle Recession
15%
10%
5%
0%
-5%
-10%
Stocks Bonds Cash
55
50
45
40
35
30
25
20
15
10
1989 1991 1993 1995 1997 1999 2001 2003 2005 2007 2009 2011 2013 2015 2017 2019
CBOE Volatility Index (6M Avg.)
• We believe there are further gains ahead, but late-cycle market environments are more challenging, and
investors should brace for lower returns, more volatility and bigger tail risks.
The CBOE Volatility Index, known by its ticker symbol VIX, is a popular measure of the stock market's expectation of volatility implied by S&P 500 index options.
19ECONOMIC & MARKET OUTLOOK
CNR Late-Cycle Playbook In Action
Asset Class Recent Changes
• Reduced to neutral weight
U.S. Large Cap Equities • Increased exposure to lower P/E, higher quality, franchise stocks
• Reduced exposure to cyclical and export-oriented sectors most affected by trade/global headwinds
U.S. Mid/Small Cap Equities • Reduced to max underweight
• Increased our aggregate dividend growth level, while maintaining a focus on valuation, aggregate yield level,
Dividend & Income Equities
and safety of the dividend.
• Reduced DM exposure to max underweight
International Equities
• Favor domestically focused EM Asia equities
• Increased credit quality in recognition of late-cycle indicators
Core Fixed Income
• Favor municipals for tax haven and lower volatility
• Favor short-duration EM debt and bank loans
Opportunistic Fixed Income • Lowering local currency exposure in favor of USD bonds
• Reduced U.S. & EM Fixed Rate HY exposure
• Recommending non-correlated diversification options in less-liquid areas of the market, which can provide
Alternative Investments high yields, strong fundamental quality and price stability, as well as boost long-term performance (CLOs,
reinsurance, capital leasing investments, etc.)
Cash • Raised allocation weight to 2%
20ECONOMIC & MARKET OUTLOOK
Near-Term Bear Market Risk Is Low
Macro Environment
Duration
Bear Markets Market Peak Return Commodity Aggressive Extreme
(Months) Recession
Spike Fed Valuations
Crash of 1929 –
September 1929 -86% 32
Excessive leverage, irrational exuberance
None of the conditions 1937 Fed Tightening –
March 1937 -60% 61
Premature policy tightening
that traditionally Post-WWII Crash –
trigger bear markets — May 1946 -30% 36
Postwar demobilization, recession fears
soaring commodity Flash Crash of 1962 –
December 1961 -28% 6
prices, aggressive Fed Flash crash, Cuban Missile Crisis
Tech Crash of 1970 –
tightening, extreme Economic overheating, civil unrest
November 1968 -36% 17
valuations or Stagflation –
January 1973 -48% 20
recession — are OPEC oil embargo
present. Volcker Tightening –
November 1980 -27% 20
Whip Inflation Now
1987 Crash –
August 1987 -34% 3
Program trading, overheating markets
Tech Bubble –
March 2000 -49% 30
Extreme valuations, dot-com boom/bust
Global Financial Crisis –
October 2007 -57% 17
Leverage/housing, Lehman collapse
Current Cycle - - -
Average -46% 24 80% 40% 40% 50%
Bear markets outside recessions are rare.
Sources: J.P. Morgan, FactSet.
21ECONOMIC & MARKET OUTLOOK
Presidential Election Years Are Typically Good Ones for
Investors S&P 500 Performance Over U.S. Election Cycles
(Since 1928)
Average
20%
Median
15%
10%
5%
Over the long run,
equities have historically 0%
performed well Election Year Year 1 Year 2/Midterm Year 3
regardless of any Elections
particular combination
of political party control Annual S&P 500 Returns by Political Party Control (1945-2018)
of government. Political party control listed by President/Senate/House (number of years)
20% 16.8%
14.6% 14.5%
15% 10.3% 9.4%
10% 5.4%
5%
0%
-5%
-10%
2001 recession
-15% following 9/11 attacks
-20% -17.0%
DDD (22) DRR (11) DDR (3) DRD (0) RRR (8) RDD (19) RRD (9) RDR (2)
.
Source: Factset, U.S. House of Representatives, U.S. Senate. As of December 2019.
22ECONOMIC & MARKET OUTLOOK
Expect Modest Earnings Growth
City National Rochdale 2020 S&P 500 EPS Forecast
Real U.S. GDP
1.90% 1.90%
We expect modest Inflation
earnings growth in
1.80% 1.80%
2020, as benefits from Interest Rates
tax cuts fade away and 0.30% 0.30%
global growth slows. International
Impact from trade 2.50% 2.50% GDP
tensions is negative but Stock Buybacks
manageable for now. 0.50% 0.50%
0.50% 0.50%
Oil Impact
-2.00%
-4.00% -0.50% Dollar Impact
Margins
-0.50%
Tariffs
= 3% = 5%
Source: City National Rochdale estimates. As of December 2019.
23ECONOMIC & MARKET OUTLOOK
Equity Fundamentals
Supportive of Modestly Higher Prices
S&P 500 12-Month Forward P/E Earnings S&P 500
3.07
24 $180 $165 $172 50%
Earnings Per Share ($)
Overvalued $160
2.97 Fairly Valued Y/Y (%) 40%
Attractive $140
Very Attractive 30%
2.87
18 $120
With valuations having
$100 20%
risen to the early stage 2.77
16
of high, we expect $80 10%
2.67
equity returns going 14
$60
0%
forward to be driven 2.57 $40
mostly by moderate $20
-10%
2.47
corporate profit 10 $0 -20%
1992
1994
1996
1998
1999
2001
2003
2005
2006
2008
2010
2012
2013
2015
2017
2019
growth. 1996 1999 2002 2005 2008 2011 2014 2017 .
S&P 500 Valuation Measures
Valuation 20-Year 20-Year Standard Deviation
Description Latest
Measure Maximum Average* Over-/Undervalued
P/E Forward P/E 18.8 23.8 15.5 1.22
CAPE Shiller’s P/E 30..9 43.8 26.1 0.89
Div. Yield Dividend Yield 1.7% 3.8% 1.9% 0.27
P/B Price-to-Book 3.6 5.1 2.8 1.20
EY Spread EY Minus Baa Yield 1.4 4.57 0.61 -0.45
As of February, 2020
Sources (Top charts) Thomson Reuters Financial Baseline, S&P 500, FactSet (Bottom table): FactSet, S&P 500, Robert Shiller.. Price to earnings is price divided by consensus analyst estimates of
earnings per share for the next 12 months. Shiller’s P/E (CAPE) uses trailing 10 years of inflation-adjusted earnings as reported by companies. Dividend yield is calculated as the next 12-month consensus
dividend divided by most recent price. Price-to-book ratio is the price divided by book value per share. Price to cash flow is price divided by NTM cash flow. EY minus Baa yield is the forward earnings yield
(consensus analyst estimates of EPS over the next 12 months divided by price) minus the Moody’s Baa seasoned corporate bond yield. Standard deviation over-/undervalued is calculated using the
average and standard deviation over 25 years for each measure. *Price to cash flow is a 20-year average due to cash flow data availability.
24ECONOMIC & MARKET OUTLOOK
Equity Valuations Still Reasonable vs. Interest Rates
S&P 500 P/E vs 10Y Treasury Yield
28
26 Tech Bubble Overvalued
24
Although high on an 22
absolute basis, in the
context of today’s low 20 Current
S&P 500 P/E
interest rate
18
environment, equities
appear more 16
reasonably valued.
14
12
10 Financial Crisis
8
6
Undervalue
4 d
0 2 4 6 8 10 12 14 16
10Y Treasury Yield
Source: FactSet monthly data. As of February 2020.
25ECONOMIC & MARKET OUTLOOK
Near Term Equity Outlook
Market Appears Fully Valued; Expect More Modest Gains
2020 S&P 500 EPS
CNR 17 17.5 18 18.5 19 19.5 20 20.5 21
Y/Y Change
With valuations Estimate
elevated and markets $170 3% -8% -6% -3% -1% 2% 5% 7% 10% 13%
now close to fairly $172 4% -8% -5% -2% 0% 3% 6% 8% 11% 14%
valued, equity gains
$173 5% -7% -4% -1% 1% 4% 7% 9% 12% 15%
ahead will likely be in
line with modest 2020 S&P 500 EPS
earnings growth. CNR 17 17.5 18 18.5 19 19.5 20 20.5 21
Y/Y Change
Estimate
$170 3% 2,889 2,974 3,059 3,144 3,229 3,314 3,399 3,484 3,569
$172 4% 2,917 3,003 3,089 3,175 3,260 3,346 3,432 3,518 3,604
$173 5% 2,945 3,032 3,119 3,205 3,292 3,378 3,465 3,552 3,638
25% Downside Risk
50% Base Case
25% Upside Potential
Source: City National Rochdale estimates. As of January 31, 2020.
Near-term indicates a 3 to 6-month view.
26ECONOMIC & MARKET OUTLOOK
Short-Term Volatility Is Normal
S&P 500 Return (%)
50 Calendar Year Returns
Intra-Year Declines*
40 38
33 32 32 33 32 32
30 29 29
30 26
22 23 23 21 21
19
S&P 500 Return (%)
20 17 16 15 16
Corrections are a 14 12
10 11
normal part of market 10 6 8 5
5 5
movements, which 1 2 1
should encourage 0
-1
clients to stay the -10 -5 -3 -4 -4 -3 -3 -5 -3 -2 -4 -6 -4 -3 -4 -3 -5 -3 -2 -4
-7 -8 -7 -6 -9 -7 -7
course when markets -10 -9 -12 -10 -11
-20 -12 -13 -13 -12
get choppy. -15 -15
-18 -16 -19.8
-22
-30 -23
-30 -28 -37
-40 -38
1980 1983 1986 1989 1992 1995 1998 2001 2004 2007 2010 2013 2016 2019
Downside % Occurrence Average Average Calendar
Intra-Year Declines (38 Years) Downside Year Return
0 to -10 66.7% -5.1% 19.1%
-11 to -19 23.0% -14.0% 7.6%
-20 to -40 10.3% -29.7% -16.4%
Source: FactSet. As of December 2019.
*Intra-year declines are the largest declines within the calendar year.
27ECONOMIC & MARKET OUTLOOK
Late Cycle Playbook
Focusing on Dividend as Driver of Return
7% Focus on Dividend and Earnings Growth
Actual year- CNR Research estimate
Analysts estimate
over-year of dividend growth
6% of earnings growth
dividend
Dividend paying
companies provide
5%
income and can help
bolster returns, while
strengthening portfolio 4%
resilience in times of
market stress. 3%
2%
1%
0%
HDI Stocks 1-Year Dividend CAGR HDI Stocks 2-Year Forward Earnings HDI Stocks 2-Year Dividends CAGR
CAGR (CNR Projection)
Source: FactSet (based on published analyst estimates), based on City National Rochdale HDI strategy universe of stocks, as of
12/31/2019
The projected growth rate in earnings is the aggregate average of all the published sellside analysts as reported through Factset.
28ECONOMIC & MARKET OUTLOOK
Dividend Stocks: Relative Value
DJ Select Dividend Index/S&P 500 Relative P/E
1.20
1.10
Compared to the
broader market, 1.00
valuations look to be at
Relative P/E (x)
their most attractive
levels in 17 years. 0.90
0.80
0.70
0.60
2003 2005 2007 2009 2011 2013 2015 2017 2019
Source: Factset as of December 31, 2019.
29ECONOMIC & MARKET OUTLOOK
Security Selection is Key
Credit Spreads Tighter as Default Rates Tick Up
Intermediate Corporate Credit Spreads near 2005 lows while default rates pick up
700 0.18
US Pessimistic Forecast 0.16
600 Default Rate
Intermediate Corporate - OAS
0.14
500
0.12
400 US HY Default Rate 0.1
US HY Baseline
300 Forecast Default 0.08
Rate
0.06
200
0.04
100
0.02
US Optimistic Forecast
0 Default Rate 0
Dec-00
Jun-01
Dec-01
Jun-02
Dec-02
Jun-03
Dec-03
Jun-04
Dec-04
Jun-05
Dec-05
Jun-06
Dec-06
Jun-07
Dec-07
Jun-08
Dec-08
Jun-09
Dec-09
Jun-10
Dec-10
Jun-11
Dec-11
Jun-12
Dec-12
Jun-13
Dec-13
Jun-14
Dec-14
Jun-15
Dec-15
Jun-16
Dec-16
Jun-17
Dec-17
Jun-18
Dec-18
Jun-19
Dec-19
Jun-20
Dec-20
Intermediate Corporate - OAS US HY Default Rate US HY Baseline Forecast Default Rate US Pessimistic Forecast Default Rate US Optimistic Forecast Default Rate
Source: Moody's, Barclays as of December 31, 2019.
30ECONOMIC & MARKET OUTLOOK
Municipal Income
High Yield Continues to Look Attractive Compared to Investment Grade
Bloomberg Barclays Municipal High Yield Index Spread to
Bloomberg Barclays Municipal Bond Index
700
Bloomberg Barclays Municipal High Yield Index Spread to Bloomberg Barclays Municipal Bond Index
600
Average Ratio
500
400
300
200
Avg: 320 bps
Min: 113 bps
100 Max: 636 bps
Std Dev: 103 bps 12/31/2019= 223 bps
0
Dec-00
Dec-01
Dec-02
Dec-03
Dec-04
Dec-05
Dec-06
Dec-07
Dec-08
Dec-09
Dec-10
Dec-11
Dec-12
Dec-13
Dec-14
Dec-15
Dec-16
Dec-17
Dec-18
Dec-19
Source: Bloomberg Barclays Research, December 31, 2019.
Past performance does not guarantee future results.
31ECONOMIC & MARKET OUTLOOK
Late-Cycle Portfolio Returns Expected to be Moderate
One-Year Forecasted Expected Returns (%)
16
14
12
At this stage of the EM Asia
7-10%
business cycle, we 10
expect real returns to
Large Cap Dividend &
be moderate, with 8 Core Income High-Yield
Balanced
higher volatility. 5-7% 6-7% Municipal
Taxable 5-6.5%* Portfolio
MidSmall Developed (60/40)
Opportunistic
6 Cap Int’l 4-5%
3-5%
3-5% 3-5% Taxable
Corporate Municipal
Taxable
4 2.25-3.25% 2-3.5%*
Gov’t
1.9-2.4%
2
0
Opportunistic Balanced
Equities Core Fixed Income
Fixed Income Portfolio
Source: City National Rochdale. As of February 2020. Forecasted expected returns represent City National Rochdale’s opinion for these asset classes, are for illustrative
purposes only, and do not represent client returns. The expected returns presented for these asset classes do not reflect any deductions for City National Rochdale fees or
expenses. Actual client portfolio and investment returns will vary.
*Forecasted expected returns for HY Municipal and Municipal FI represent the taxable equivalent return at a 43.4% tax rate.
See additional important disclosure at the end of this presentation.
32ECONOMIC & MARKET OUTLOOK
Our Asset Allocation Positioning
Min Neutral Max
EQUITIES
U.S. Equities
Prefer U.S. to international Large Cap Core
markets
Europe and Japan have Mid/Small Cap
significant structural issues Dividend Income
Emerging markets: Favor Asia
International Equities
CORE FIXED INCOME
Developed Markets
Low return potential Emerging Markets Asia
Prefer corporate credit over Emerging Markets non-Asia
government bonds
Municipals attractive for high- Core Fixed Income
bracket investors
Government/Agency
OPPORTUNISTIC INCOME Corporate
Municipal
Opportunities in
structured/distressed credit, Cash and Equivalents
emerging market high yield
Opportunistic Income
REAL ASSETS Taxable
Modest exposure for Tax-Exempt
diversification benefits
Real Assets
Underweight due to low-
inflation environment Real Estate
Diversified Commodities
TIPS
Source: City National Rochdale. As of February 2020.
An asset allocation program cannot guarantee profits. Loss of principal is possible.
33ECONOMIC & MARKET OUTLOOK
Portfolio Strategy for Moderate Economic Expansion
EQUITIES Equities
Prefer U.S. core and high Moderate U.S. economic growth continues to support modestly higher U.S. equity levels.
dividend
Dividend income strategies: valuations full, but solid fundamentals; better late cycle.
Europe: Weakening global
backdrop & secular challenges European equities: select opportunities, but long-term secular headwinds and poor growth prospects.
reduce attractiveness Long-term EM Asia outlook supported by fundamental, economic and demographic changes.
Emerging markets: Favor Asia
Core Fixed Income
CORE FIXED INCOME
Low return potential Low return potential. A slowing economy, tame inflation and easier monetary policy should all contribute
Prefer corporate credit over to keeping interest rates low.
government bonds Fed policy has shifted to easing. We anticipate one to two more short-term interest rate cuts by the Fed
Municipals attractive for high- next year.
tax investors
Opportunistic Fixed Income
OPPORTUNISTIC INCOME
Moving up within credit Taxable and Tax-Exempt Opportunistic allocations remain relatively attractive vs. Core Fixed Income.
ranking toward BB/B Favor short-duration EM debt and bank loans.
REAL ASSETS Real Assets
• Underweight due to low- Reasonable growth and yield from select REITs.
inflation environment
Alternatives*
ALTERNATIVES
We recommend alternative investments for sophisticated investors that are generally non-correlated asset
Attractive opportunity in cash classes.
flow strategies for qualified
investors Source: City National Rochdale. As of February 2020.
*Alternative investments are speculative, entail substantial risks, offer limited or no liquidity, and are not suitable for all investors. These investments
have limited transparency to the funds’ investments and may involve leverage that magnifies both losses and gains, including the risk of loss of the entire
investment. Alternative investments have varying and lengthy lockup provisions.
34ECONOMIC & MARKET OUTLOOK
Economic Fundamentals Appear To Be Solid
City National Rochdale U.S. Economic Monitor
Indicator Status Level
Leading Indicators Leading indexes have slowed but continue to signal a modest, sustainable economic expansion ahead. 5.5
Labor Market Slower, but steady job growth continues, and labor market indicators point to continued strength ahead. 7.0
Improved consumer fundamentals, including continued job growth, solid real income gains, and elevated
Consumer Spending 7.0
confidence, provide support for household spending. Tax cuts should boost disposable income.
Assuming the economic disruption comes to an end soon, the coronavirus will probably end up just delaying the
Global Economic Growth 5.0
The U.S. economy expected modest global economic recovery in 2020, rather than cancelling it altogether.
appears to have strong Monetary Policy Officials have signaled their willingness to remain accommodative but capacity to stimulate is limited. 6.0
fundamentals, with low Fiscal Policy Fiscal policy tailwind for the economy is fading. 6.0
unemployment, modest
Consumer Sentiment Confidence across a number of measures remains high, though expectations on future conditions have weakened. 7.0
inflation and little
Credit Borrowing terms and increased availability remain largely favorable. With household debt trending lower relative to
evidence of mounting Availability/Demand incomes and debt servicing costs at a record low, higher borrowing costs won’t be a major drag.
6.5
excesses or imbalances. Geopolitical Trade policy missteps, European political and financial system stability, and other unforeseen circumstances have
3.5
Risks/Contagion the potential to disrupt markets and shake confidence.
Slow global demand, trade tensions and heightened policy uncertainty are weighing on sentiment and capital
Business Investment 5.5
spending plans.
Survey measures have moderated but continue to point to the sector continuing to expand at a moderate rate,
Service Sector 6.5
stabilizing and supporting overall GDP growth.
Manufacturing Sector Outlook remains subdued against slower global backdrop, stronger dollar and continued trade tensions. 4.5
A solid labor market, rising incomes and the Fed’s dovish pivot support demand and residential construction;
Housing 5.5
however, gains are likely to be moderate and face headwinds from low supply and tight capacity restraints.
While a tightening job market may increase wage and price pressures somewhat further in the coming year, the
Inflation 6.5
structural forces that have kept inflation subdued remain in place.
Subdued global outlook should keep overall price increases in check. With the US no longer a net importer of oil
Energy 6.5
products, the economy is likely to be resilient even if oil prices spike.
Total Score 5.9
Positive Improving outlook, confluence of positive Neutral Steady but sluggish growth, Negative Weak economic growth, decelerating
6.0 to 10 indicators, recession probability low 4.0 to 5.9 mixed economic signals 0 to 3.9 trends, recession a distinct possibility
Source: City National Rochdale. As of February 2020
35ECONOMIC & MARKET OUTLOOK
Moderate Economic Expansion Still Supports Equities
Equity Market Scorecard
Indicator Status Current Score
Global Economic
Global outlook remains subdued and more divergent between economies. 5.5
Outlook
Corporate
Modest earnings growth projected in line with softer economic expectations. 5.5
Profitability
We believe U.S. equities Monetary Central banks around the world, including the U.S. Fed, have turned increasingly
6.5
remain attractive versus Conditions more accommodative.
investment-grade Valuation
Valuations are beginning to look high from a historical perspective, though still
5.0
bonds, and should be reasonable in the context of today’s low interest rate environment.
favored in most client Technical Market strength and breadth has improved, while measures of investor
6.5
portfolios. Indicators optimism remain measured despite the recent rally.
Systemic Financial Global financial conditions remain stable. Continuing geopolitical uncertainty
6.5
Sector Risk raises the possibility of volatility in months ahead.
Total Score 5.8
Positive Neutral Negative
Overweight Neutral Weight Underweight
6.0 to 10 4.0 to 5.9 0 to 3.9
Source: City National Rochdale Proprietary Multi-Factor Stock Market Model. As of February 2020.
36ECONOMIC & MARKET OUTLOOK
Capital Market Assumptions
Near-Term Long-Term Historical Long-Term Historical Max
Asset Class Return Annual Return Annual Annual Risk Annual Historic
Expectation* Expectation Return** Expectation Risk Drawdown***
Domestic
Large Cap Core 7.0 7.0 9.3 14.0 15.5 -50.0
Mid/Small Cap 5.0 7.0 10.7 16.0 17.0 -58.0
Equities Dividend Income 7.0 6.5 8.1 13.0 13.5 -40.0
International
Developed Markets 5.0 6.0 5.6 16.5 17.0 -57.0
Emerging Markets 9.0 9.0 9.5 20.0 22.5 -60.0
Government/Agency 1.7 1.8 5.7 2.5 3.5 -4.0
Investment-Grade Corporate 1.9 2.9 6.8 5.0 5.0 -9.0
Core Fixed Income/Cash
Tax-Exempt 1.3 1.5 5.1 2.5 2.8 -2.0
Cash and Equivalents 1.5 1.5 3.0 0.0 0.0 0.0
Global Bonds 1.4 1.5 5.6 5.5 5.5 -10.0
Global High Yield 3.6 6.8 8.2 9.0 10.0 -34.0
Bank Loans 4.7 5.6 7.1 7.0 7.0 -30.0
Opportunistic Income
Preferred Stock 4.5 6.0 5.7 12.5 13.0 -55.0
High-Yield – Taxable 2.2 4.3 7.2 7.5 8.0 -34.0
High-Yield – Tax-Exempt 2.1 3.6 5.9 7.5 8.0 -30.0
Reinsurance 7.0 7.0 9.0 13.0 16.0 -20.0
Collateralized Loan Obligations 8.0 9.0 8.4 14.0 15.0 -75.0
Railcar Leasing 8.5 9.0 10.0 12.0 13.0 -15.0
Alternative Investments
Health Care Royalties 8.0 9.0 11.0 10.0 12.0 -8.0
Aviation Leasing 8.0 9.0 10.0 12.0 13.0 -15.0
Private Equity Secondaries 9.5 10.0 13.0 16.0 18.0 -34.0
U.S. Real Estate 4.0 6.0 8.9 23.0 23.0 -70.0
Diversified Commodities 2.0 6.0 5.9 14.5 14.5 -66.0
Real Assets
Precious Metals 3.0 6.0 4.7 20.0 17.5 -68.0
Inflation-Protected Fixed Income 1.0 3.0 5.0 5.0 5.5 -13.0
Sources: Morningstar Direct, Bloomberg, City National Rochdale. As of February 2020. Past performance is not a guarantee of future results. The expected returns are net of any City National Rochdale
management fees; however, other fees may apply. The expected returns do not include fees for trading costs (e.g., commissions) or any fees charged by your financial advisor.
Please speak to your financial advisor for a complete understanding of all fees. Drawdown: The measure of decline from a historical peak.
*Current 5-year YTW is used to estimate near-term expectations for Core Fixed Income, Fixed Income segments of Opportunistic Income, and Inflation Protected Fixed Income. Near-term return expectation
indicates a 12- to 24-month view. **Historical returns begin in January 1989. If an asset class index was not in existence during that time, a similar proxy was used.
***Max drawdown not illustrated for 1928-1932 for U.S. High Yield (-57%), Large Cap (-83%), and Small Cap (-90%).
See additional important disclosure at the end of this presentation.
37INDEX DEFINITIONS
Index Definitions
The Standard & Poor’s 500 Index (S&P 500) is a market capitalization-weighted index of 500 common stocks chosen for market size, liquidity, and industry group
representation to represent U.S. equity performance.
MSCI Emerging Markets Asia Index is a free float-adjusted market capitalization index that is designed to measure equity market performance in the Asian emerging markets.
The MSCI EAFE Index (Europe, Australasia, Far East) is a free float-adjusted market capitalization index that is designed to measure the equity market performance of
developed markets, excluding the U.S. & Canada. As of June 2007, the MSCI EAFE Index consisted of the following 21 developed market country indices: Australia, Austria,
Belgium, Denmark, Finland, France, Germany, Greece, Hong Kong, Ireland, Italy, Japan, the Netherlands, New Zealand, Norway, Portugal, Singapore, Spain, Sweden,
Switzerland, and the United Kingdom.
The MSCI Europe Index is a free float-adjusted market capitalization index that is designed to measure developed market equity performance in Europe. As of September
2002, the MSCI Europe Index consisted of the following 16 developed market country indices: Austria, Belgium, Denmark, Finland, France, Germany, Greece, Ireland, Italy,
the Netherlands, Norway, Portugal, Spain, Sweden, Switzerland, and the United Kingdom.
The MSCI World is a market cap weighted stock market index of 1,655[1] stocks from companies throughout the world. The components can be found here.[2] It is
maintained by MSCI, formerly Morgan Stanley Capital International, and is used as a common benchmark for 'world' or 'global' stock funds intended to represent a broad
cross-section of global markets.
The Michigan Consumer Sentiment Index (MCSI) is a monthly survey of U.S. consumer confidence levels conducted by the University of Michigan. It is based on telephone
surveys that gather information on consumer expectations regarding the overall economy.
The Barclays Aggregate Bond Index is composed of U.S. government, mortgage-backed, asset-backed, and corporate fixed income securities with maturities of one year or
more.
The Barclays High Yield Municipal Index covers the high yield portion of the U.S.-dollar-denominated long-term tax-exempt bond market. The index has four main sectors:
state and local general obligation bonds, revenue bonds, insured bonds, and pre-refunded bonds.
The Bloomberg Barclays U.S. Treasury Index is an unmanaged index of prices of U.S. Treasury bonds with maturities of one to 30 years.
The Bloomberg Barclays U.S. Corporate Bond Index is an unmanaged market-value-weighted index of investment-grade corporate fixed-rate debt issues with maturities of
one year or more.
The Bloomberg Barclays U.S. Corporate High Yield Index is an unmanaged, U.S.-dollar-denominated, nonconvertible, non-investment-grade debt index. The index consists of
domestic and corporate bonds rated Ba and below with a minimum outstanding amount of $150 million.
The Bloomberg Barclays Emerging Markets USD Aggregate Index tracks total returns for external-currency-denominated debt instruments of the emerging markets. Countries
covered are Argentina, Brazil, Bulgaria, Ecuador, Mexico, Morocco, Nigeria, Panama, Peru, the Philippines, Poland, Russia, and Venezuela.
The Bloomberg Barclays U.S. Agency Bond Index is a rules-based, market-value-weighted index engineered to measure investment-grade agency securities publicly issued by
U.S. government agencies. Mortgage-backed securities are excluded.
S&P Leveraged Loan Indexes (S&P LL indexes) are capitalization-weighted syndicated loan indexes based upon market weightings, spreads, and interest payments. The
S&P/LSTA Leveraged Loan 100 Index (LL100) dates back to 2002 and is a daily tradable index for the U.S. market that seeks to mirror the market-weighted performance of
the largest institutional leveraged loans, as determined by criteria. Its ticker on Bloomberg is SPBDLLB.
38INDEX DEFINITIONS
Index Definitions (continued)
The Dow Jones Select Dividend Index seeks to represent the top 100 U.S. stocks by dividend yield. The index is derived from the Dow Jones U.S. Index and generally consists
of 100 dividend-paying stocks that have five-year non-negative Dividend Growth, five-year Dividend Payout Ratio of 60% or less, and three-month average daily trading
volume of at least 200,000 shares.
The Bloomberg Commodity Total Return Index, formerly known as Dow Jones-UBS Commodity Index Total Return (DJUBSTR), is composed of futures contracts and reflects
the returns on a fully collateralized investment in the BCOM. This combines the returns of the BCOM with the returns on cash collateral invested in 13-week (three-month)
U.S. Treasury Bills.
The Corporate Emerging Market Bond Index (CEMBI) is J.P. Morgan's index of U.S.-dollar-denominated debt issued by emerging market corporations.
The Standard & Poor’s Small Cap 600 Index (S&P 600) measures the small-cap segment of the U.S. equity market. The index is designed to track companies that meet
specific inclusion criteria to ensure that they are liquid and financially viable.
Nasdaq 100 Index is an index composed of the 100 largest, most actively traded U.S. companies listed on the Nasdaq stock exchange.
The U.S. Treasury 10-year Note is a debt obligation issued by the United States government that matures in 10 years. A 10-year Treasury Note pays interest at a fixed rate
once every six months and pays the face value to the holder at maturity.
The Shanghai Stock Exchange (SSE) composite is a market composite made up of all the A shares and B shares that trade on the Shanghai Stock Exchange.
Brent Crude is a major trading classification of sweet light crude oil that serves as a major benchmark price for purchases of oil worldwide. This grade is described as
light because of its relatively low density, and sweet because of its sulfur content.
Employment Index: U.S. jobs with the exception of farmwork, unincorporated self-employment, and employment by private households, the military, and intelligence
agencies.
A consumer price index (CPI) measures changes in the price level of a market basket of consumer goods and services purchased by households. The CPI is a statistical
estimate constructed using the prices of a sample of representative items whose prices are collected periodically.
The “core” PCE price index is defined as personal consumption expenditures (PCE), prices excluding food and energy prices. The core PCE price index measures the prices
paid by consumers for goods and services without the volatility caused by movements in food and energy prices to reveal underlying inflation.
The S&P/Case-Shiller Home Price Indexes are a group of indexes that track changes in home prices throughout the United States. The indexes are based on a constant level
of data on properties that have undergone at least two arm's length transactions.
The ISM Manufacturing Index is based on surveys of more than 300 manufacturing firms by the Institute for Supply Management (ISM). The ISM Manufacturing Index
monitors employment, production, inventories, new orders and supplier deliveries. A composite diffusion index monitors conditions in national manufacturing and is based on
the data from these surveys.
The ISM Non-Manufacturing Index is an index based on surveys of more than 400 non-manufacturing firms' purchasing and supply executives, within 60 sectors across the
nation, by the Institute of Supply Management (ISM). The ISM Non-Manufacturing Index tracks economic data, like the ISM Non-Manufacturing Business Activity Index. A
composite diffusion index is created based on the data from these surveys, that monitors economic conditions of the nation.
Indices are unmanaged, and one cannot invest directly in an index. Index returns do not reflect a deduction for fees or expenses.
39IMPORTANT DISCLOSURES
Important Disclosures
The information presented does not involve the rendering of personalized investment, financial, legal, or tax advice. This presentation is not an offer to buy or sell, or a
solicitation of any offer to buy or sell, any of the securities mentioned herein.
Certain statements contained herein may constitute projections, forecasts, and other forward-looking statements, which do not reflect actual results and are based primarily
upon a hypothetical set of assumptions applied to certain historical financial information. Certain information has been provided by third-party sources, and, although
believed to be reliable, it has not been independently verified and its accuracy or completeness cannot be guaranteed.
Any opinions, projections, forecasts, and forward-looking statements presented herein are valid as of the date of this document and are subject to change.
There are inherent risks with fixed income investing. These risks may include interest rate, call, credit, market, inflation, government policy, liquidity, or junk bond. When
interest rates rise, bond prices fall. This risk is heightened with investments in longer duration fixed income securities and during periods when prevailing interest rates are
low or negative.
There are inherent risks with equity investing. These risks include, but are not limited to, stock market, manager, or investment style. Stock markets tend to move in cycles,
with periods of rising prices and periods of falling prices.
Investing in international markets carries risks such as currency fluctuation, regulatory risks, and economic and political instability. Emerging markets involve heightened
risks related to the same factors, as well as increased volatility, lower trading volume, and less liquidity. Emerging markets can have greater custodial and operational risks,
and less developed legal and accounting systems than developed markets.
Concentrating assets in the real estate sector or REITs may disproportionately subject a portfolio to the risks of that industry, including the loss of value because of adverse
developments affecting the real estate industry and real property values. Investments in REITs may be subject to increased price volatility and liquidity risk; concentration risk
is high.
Investments in below-investment-grade debt securities, which are usually called “high yield” or “junk bonds,” are typically in weaker financial health. Such securities can be
harder to value and sell, and their prices can be more volatile than more highly rated securities. While these securities generally have higher rates of interest, they also
involve greater risk of default than do securities of a higher-quality rating.
The yields and market values of municipal securities may be more affected by changes in tax rates and policies than similar income-bearing taxable securities. Certain
investors' incomes may be subject to the Federal Alternative Minimum Tax (AMT), and taxable gains are also possible.
Investments in the municipal securities of a particular state or territory may be subject to the risk that changes in the economic conditions of that state or territory will
negatively impact performance. These events may include severe financial difficulties and continued budget deficits, economic or political policy changes, tax base erosion,
state constitutional limits on tax increases, and changes in the credit ratings.
Yield to Worst – The lower of the yield to maturity or the yield to call. It is essentially the lowest potential rate of return for a bond, excluding delinquency or default.
Investments in emerging markets bonds may be substantially more volatile, and substantially less liquid, than the bonds of governments, government agencies, and
government-owned corporations located in more developed foreign markets. Emerging markets bonds can have greater custodial and operational risks, and less developed
legal and accounting systems than developed markets.
Investments in commodities can be very volatile, and direct investment in these markets can be very risky, especially for inexperienced investors.
40IMPORTANT DISCLOSURES
Important Disclosures (continued)
Returns include the reinvestment of interest and dividends.
All investing is subject to risk, including the possible loss of the money you invest. As with any investment strategy, there is no guarantee that investment objectives will be
met, and investors may lose money. Diversification may not protect against market risk or loss. Past performance is no guarantee of future performance.
Please see the Offering Memorandum for more complete information regarding the Fund’s investment objectives, risks, fees and other expenses.
Alternative investments are speculative, entail substantial risks, offer limited or no liquidity and are not suitable for all investors. These investments have limited
transparency to the funds’ investments and may involve leverage which magnifies both losses and gains, including the risk of loss of the entire investment. Alternative
investments have varying, and lengthy lockup provisions.
This information is not intended as a recommendation to invest in a particular asset class, strategy or product.
The information presented is for illustrative purposes only and based on various assumptions which may not be realized. No representation or warranty is made as to the
reasonableness of the assumptions made or that all assumptions used have been stated or fully considered. Readers are cautioned that such forward-looking statements
are not a guarantee of future performance, involve risks and uncertainties, and actual results may differ materially from those stated as a result of various factors. The views
expressed are also subject to change based on market and other conditions.
Estimated returns are based on multiple sources of historical market index data input into proprietary quantitative models specific to each asset class (e.g., equity, fixed
income, etc.), then adjusted for fundamental inputs such as yield, earnings growth, risk premiums, valuation, historical reversion, and market implied expectations. Finally,
we further adjust the estimated returns with our economic forecasts on market conditions and long-term expectations (which include economic growth, inflation, interest
rates, among other important inputs).
The expected results have many inherent limitations and no representation is made that any investor will or is likely to achieve returns similar to those shown. Changes in the
assumptions used may have a material impact on the derived performance presented.
Performance does not represent the results of actual trading, but was achieved by means of retroactive application of a model designed with the benefit of hindsight. Results
may not reflect the impact that material economic and market factors might have on the adviser’s decision-making if adviser were actually managing client assets.
This document may contain forward-looking statements relating to the objectives, opportunities, and the future performance of the U.S. market generally. Forward-looking
statements may be identified by the use of such words as; “expect,” “estimated,” “potential” and other similar terms. Examples of forward-looking statements include, but
are not limited to, estimates with respect to financial condition, results of operations, and success or lack of success of any particular investment strategy. All are subject to
various factors, including, but not limited to general and local economic conditions, changing levels of competition within certain industries and markets, changes in interest
rates, changes in legislation or regulation, and other economic, competitive, governmental, regulatory and technological factors affecting a portfolio’s operations that could
cause actual results to differ materially from projected results. Such statements are forward-looking in nature and involve a number of known and unknown risks,
uncertainties and other factors, and accordingly, actual results may differ materially from those reflected or contemplated in such forward-looking statements. Prospective
investors are cautioned not to place undue reliance on any forward-looking statements or examples. None of City National Rochdale or any of its affiliates or principals nor
any other individual or entity assumes any obligation to update any forward-looking statements as a result of new information, subsequent events or any other
circumstances. All statements made herein speak only as of the date that they were made.
41Important Disclosures (continued)
All investment strategies have the potential for profit or loss; changes in investment strategies, contributions or withdrawals may materially alter the performance and results
of a portfolio. Different types of investments involve varying degrees of risk, and there can be no assurance that any specific investment will be suitable or profitable for a
client's investment portfolio.
References to indexes and benchmarks in hypothetical illustrations of aggregate returns do not reflect the performance of any actual investment. Investors cannot invest in
an index and such returns do not reflect the deduction of the advisor's fees or other trading expenses. There can be no assurance that current investments will be profitable.
Actual realized returns will depend on, among other factors, the value of assets and market conditions at the time of disposition, any related transaction costs, and the timing
of the purchase. Indexes and benchmarks may not directly correlate or only partially relate to portfolios as they have different underlying investments and may use different
strategies or have different objectives than our strategies or funds.
42For More Information
New York Headquarters
400 Park Avenue
New York, NY 10022
212-702-3500
Beverly Hills Headquarters
400 North Roxbury Drive
Beverly Hills, CA 90210
310-888-6000
info@cnr.com
www.cnr.com
43You can also read