HOUSING NEEDS ASSESSMENT - Prepared for the City of Castlegar November 2018 | CitySpaces Consulting
←
→
Page content transcription
If your browser does not render page correctly, please read the page content below
HOUSING NEEDS ASSESSMENT
Photo: Lotus Johnson, Flickr Creative Commons

          Prepared for the City of Castlegar
          November 2018 | CitySpaces Consulting
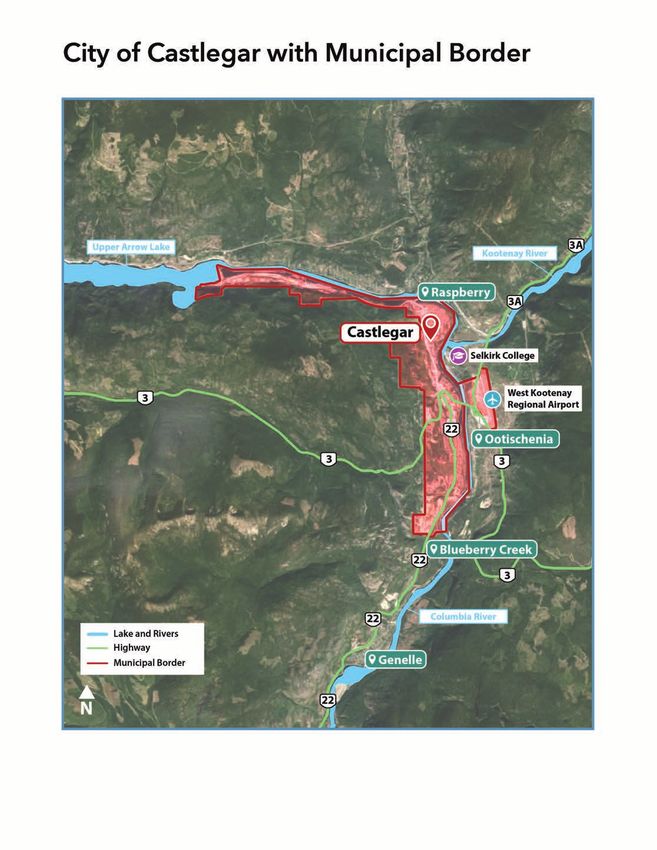
Table of Contents
Executive Summary ...........................................................................................................................................1

Introduction ........................................................................................................................................................6
       Background .................................................................................................................................................................6

       Methodology ...............................................................................................................................................................6
       The Housing Continuum ............................................................................................................................................7

Context ................................................................................................................................................................9

Housing Indicators ..........................................................................................................................................12
       Population .................................................................................................................................................................12

       Housing ......................................................................................................................................................................16

Affordability Analysis.......................................................................................................................................28
       Overview ....................................................................................................................................................................28

       Rental Affordability Analysis ....................................................................................................................................28
       Homeownership Affordability Analysis ..................................................................................................................30

Non-Market Housing .......................................................................................................................................34
       Overview ....................................................................................................................................................................34

       Non-Market Housing Supply ...................................................................................................................................34

       Community Programs ..............................................................................................................................................36

Demonstrated Need .......................................................................................................................................38
       Priority Groups ..........................................................................................................................................................38
       Housing Gaps ...........................................................................................................................................................41

       Other Related Issues ................................................................................................................................................43

In Closing ..........................................................................................................................................................44
       Next Steps .................................................................................................................................................................44

Appendix A Key Terms & Definitions ..........................................................................................................47

Appendix B List of Key Informants ..............................................................................................................51

                                                                                                          Housing Needs Report | City of Castlegar | November 2018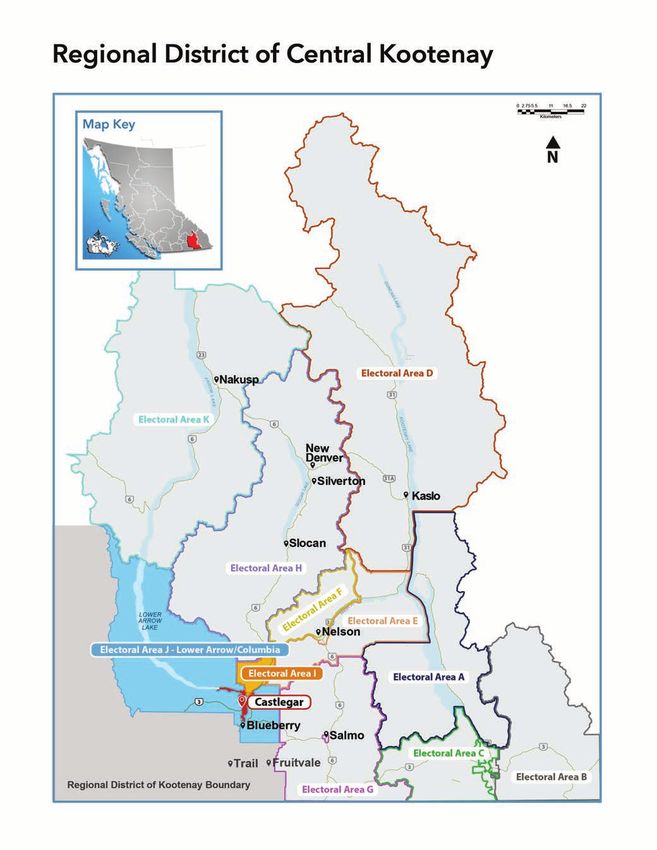
Housing Needs Report | City of Castlegar | November 2018
Executive Summary
The City of Castlegar last completed a housing needs assessment in 2012/2013. Since then,
discussions with local housing organizations, social service providers, and the development
community indicate that Castlegar has experienced changes with respect to its housing needs and
affordability. This report focuses on “need and demand” for affordable housing in Castlegar. It
contains:

•   A description of a wide range of factors that influence the housing market;
•   An identification of groups who are least able to access suitable, affordable housing; and,
•   A commentary on gaps and issues in the market and non-market sectors.

CitySpaces Consulting was engaged by the City to conduct research between September and
November 2018, involving a review of previously completed research, analysis of recent housing
indicator data, and telephone interviews. Participants were generous with their time and provided
many helpful insights.

Then, and Now
Research identified several key changes that have occurred in Castlegar since the previous housing
needs assessment was completed in 2012/2013:

•   There has been no new rental construction between 2012 and 2017;
•   Rental vacancy rates have decreased from 3.7% to 2.3% for all unit types;
•   Average rent for apartments and row houses has increased from $611 in 2011, to $742 in 2016;
•   The number of non-market housing units has increased by 393 units;
•   From 2011 to 2016, median household income levels increased by 26.8%, from $54,279 to
    $68,800;
•   The number of individuals and families receiving subsidies through BC Housing’s Rental
    Assistance Program (RAP) and Shelter Aid for Elderly Renters (SAFER) has increased from 53
    recipients to 385 recipients;
•   The average sale price for single-detached homes has risen by 25.5% between 2013 and 2018,
    from $253,592 to $318,171;
•   The average sale price for townhouses has risen by 39.2% between 2013 and 2018, from
    $201,250 to $280,278 and,

Housing Needs Report | City of Castlegar | November 2018                                             1
• The average sale price for apartments has decreased by 13.6% between 2013 and 2017, from
$213,667 to $184,650.
Groups Experiencing Greatest Challenge in Castlegar’s Housing Market
Research identified six sub-population groups that have the greatest challenges in finding suitable
and affordable housing in Castlegar:
• Low-Income Seniors: The demand for affordable housing for seniors has significantly increased
since the 2013 Housing Needs Assessment and the number of seniors in Castlegar is projected
to grow over the coming decade. Median incomes for seniors appear to be financially healthy in
Castlegar compared to other household groups, and seniors are more likely to accumulate
wealth over time. That said, seniors earning a fixed income (i.e. pension) are challenged to afford
the average market rental prices in Castlegar.
• Low-Income Families: Affordability calculations demonstrate single parents earning the median
income have a lesser ability to buy a home compared to couple households, and single parents
under the age of 44 are completely priced-out of the homeownership market, and would be
more likely to rent than own their homes. There are limited family-friendly rental options in
Castlegar, and there is demand for affordable multi-unit rental housing.
• Students: Stakeholders consistently emphasized the impact of international students from Selkirk
College on the local rental market. While evidence-based information (i.e. CMHC data) indicates
there is ample rental availability in Castlegar, the College’s student residences do not have the
capacity to accommodate the increase of international students. These students frequently
encounter challenges securing suitable housing, and community stakeholders indicated many
rental units occupied by students are over-crowded.
• People who are Experiencing Homelessness or At-Risk of Homelessness: Social service
providers have seen an increase in demand for services over the past decade, and several
stakeholders indicated their organizations now maintain waitlists for housing, when they had not
done so in the last ten years. These indicators, along with the increasing number of visible
homeless, indicates that there is likely a need for more supplements and housing supports for
individuals experiencing or at-risk of experiencing homelessness. This need could be much
greater than is immediately apparent as hidden homeless are hard to reach and account for.
• Persons with Disabilities: Conversations with community stakeholders indicate a need to develop
new supportive living facilities to accommodate persons with disabilities in the community. The
Kootenay Society for Community Living has recently received funding from BC Housing and the
2 Housing Needs Report | City of Castlegar | November 2018Columbia Basin Trust to build 11 units of affordable and supported housing in Castlegar, which
will help to alleviate some of the demand. This project represents BC Housing’s first multi-unit
new build in Castlegar, and is indicative of the need for a greater diversity in housing stock. As
there are currently 6 persons with disabilities on the BC Housing waitlist for non-market housing,
it will be important to monitor demand for accessible units and supportive living facilities once
the new Kootenay Society for Community Living development is operational.
• Vulnerable Women: The Castlegar and District Community Services Society continues to see an
increase in the number of women, with and without children, who are dealing with violence at
home, and require safe accommodation. A second-stage housing option, where women and their
children can live for 12-24 months while looking for longer-term housing, is needed in Castlegar.
Key stakeholders emphasized the importance of establishing a women’s transition house, which
was also identified as a priority in the 2013 Housing Needs Assessment.
Main Housing Gaps
Six main housing gaps cross over the private and non-market housing sectors:
1. Non-Market and Market Rental Independent Seniors Housing
2. Non-Market Rental Housing;
3. Market Rental Housing;
4. Transitional and Low Barrier Rental Housing;
5. Affordable Homeownership Opportunities; and,
6. Accessible Housing.
As a next step, the City of Castlegar may consider developing a strategy that identifies and prioritizes
municipal actions to address local housing gaps.
How Many Units Do We Need?
Income levels by age group and household type, as well as housing wait list data, have been
reviewed to inform an estimated need of affordable housing units or programs in Castlegar. These
are conservative estimates, and are inherently limited. A detailed financial feasibility study and
business plan should be conducted for site-specific affordable housing projects, or mixed-income
housing projects, to be confident in the many facets of project viability — financial, location,
Housing Needs Report | City of Castlegar | November 2018 3partnerships, number of units, rent ranges, etc. These estimates are intended to provide a “snapshot”
of demand, but are notably a moving target, as changes in the community, particularly related to the
economy, alter housing demand and need.
Table 1: Estimated Affordable Housing Units Needed in Castlegar
Units Reasoning
10-20 units of senior- Conservative range of 5%-10% of low-income seniors who rent.
friendly rental housing These units can be delivered through the private market, with
Low-Income in the private market eligible occupants applying the SAFER rent subsidy towards off-
Seniors setting the rental cost.
5-10 units of affordable BC Housing Registry wait list and private affordable housing wait
seniors housing lists
20-35 units of family- Conservative range of 5% to 10% of low-income families who
Low-Income friendly rental housing rent. These units can be private market rents, with eligible
Families in the private market occupants applying the RAP rent subsidy towards off-setting
rental costs.
Unknown From 2012 to 2017, Selkirk College enrolment grew by 13.7%,
and the number of international students increased from 118 to
700. Stakeholders indicated students are struggling to secure
rental accommodation; however, there is limited evidence-
Students
based information available to inform existing, and future
demand. While rental vacancy rates remain healthy, qualitative
data indicates there is a need for additional market rental
housing to accommodate students.
People who are 5 - 10 rent supplements Social service providers have seen an increase in demand for
Experiencing through BC Housing’s services over the past decade, and several stakeholders
Homelessness Homeless Prevention indicated there is an increasing number of visible homeless.
or At-Risk of Program There is a need for rent supplements to be applied in the private
Homelessness market rental stock.
None at this time The Kootenay Society for Community Living has recently
received funding from BC Housing and the Columbia Basin Trust
to build a five-bedroom residential space for people who need
Persons with supported living, and six units of affordable housing in the same
Disabilities property. As these units are built, the City should monitor
absorption, and observe how long the units are available until
finally occupied. The rate of absorption will determine if
additional units are required for persons with disabilities.
4 Housing Needs Report | City of Castlegar | November 2018Units Reasoning
4-8 bed Women’s The Castlegar and District Community Services Society
Transition House continues to see an increase in the number of women, with and
without children, who are dealing with violence at home, and
Vulnerable
require safe accommodation. Key stakeholders emphasized the
Women
importance of establishing a women’s transition house, which
was also identified as a priority in the 2013 Housing Needs
Assessment.
This assessment is an estimate of the affordable housing units needed in Castlegar, and, moving
forward, it will be imperative to monitor demand. As units are built, the City should monitor
absorption to understand how long the units are available until finally occupied. If a quick absorption
rate is observed, and a wait list follows, then the number of units required per group in need can be
revisited. If demand persists, the City should encourage the development of additional units. If
absorption rates are slow, a cautious approach toward future development will be necessary, and it
may be appropriate to revisit the proposed housing forms, and intended target audience.
Housing Needs Report | City of Castlegar | November 2018 5Introduction
In 2018, the City of Castlegar engaged CitySpaces Consulting to update their Housing Needs
Assessment. The purpose of this study is to provide staff and Council with a clear understanding of
Castlegar’s housing needs in order to:
• Provide data and background information for housing related policy.
• Provide clear and concise data for staff to reference when speaking with potential partners,
non-profit housing providers, and developers regarding what form of housing is needed.
• Be used as background documentation when the City, or other housing related organizations,
are applying for grant funding.
Background
The City of Castlegar is updating their Housing Needs Assessment to provide staff and Council with
a better understanding of local housing issues. Since the last Housing Needs Assessment was
developed between 2012 and 2013, the City has experienced changes with respect to housing
needs, affordability, and suitability. Evidence of such change includes increasing home prices and
rental rates, and a mismatch between the existing housing stock and the supply of certain housing
types that are needed in the community. Likely factors that are influencing these housing trends
include demographic changes, increased enrolment of international students at Selkirk College, and
growth in the area surrounding Castlegar as the area is increasingly seen as a desirable, and
relatively affordable community, compared to other B.C. municipalities, such as Nelson.
City Council has instructed staff to research and explore policies to address Castlegar’s changing
housing needs, including affordable housing, and this housing needs assessment is intended to
provide baseline data of Castlegar’s current housing availability, suitability, and affordability across
the entire housing continuum from basic shelter to market housing. The Housing Needs Assessment
will be used as a tool by the City as it determines what forms of housing are needed in the
community, to inform future housing related policy, and to support housing providers and other
organizations applying for affordable housing project funding. Findings from this Housing Needs
Assessment will inform the City with a clear understanding of Castlegar’s housing needs and gaps.
Methodology
This assessment has involved assembling and analyzing relevant and reliable data, as well as
interviewing community stakeholders about housing needs. Determining the need and demand for
housing is framed by BC Housing’s Housing Need and Demand Study Template, which focuses on
6 Housing Needs Report | City of Castlegar | November 2018obtaining both quantitative and qualitative sources of information to offer comprehensive insight
into local housing needs. To provide this baseline of understanding of the service and planning
context, this report includes a policy review and community profile, including an inventory of local
housing and services in the Castlegar area.
• The quantitative data highlighted in this report has been obtained from a variety of sources,
where available. Research sources include the 2006, 2011, and 2016 Census of Canada; the
Canada Mortgage and Housing Corporation (CMHC); BC Stats; BC Housing; and the Kootenay
Real Estate Board.
• The qualitative information was obtained by collecting insights, observations, and perspectives of
community stakeholders. A series of one-on-one interviews were conducted over the telephone,
documenting key concerns related to housing in Castlegar and area communities. A list of
community stakeholders who participated in key informant interviews is available in Appendix B.
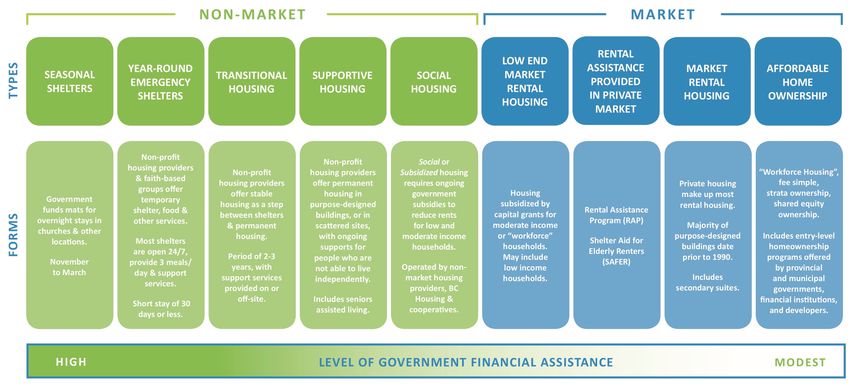
The Housing Continuum
The Housing Continuum is a concept that demonstrates the full range of types and tenures of
housing, from seasonal shelters to home ownership. As an illustration it has two purposes—to provide
readers with an “at a glance” look at what housing planners use as a basis for analysis, and as a tool
to identify gaps in the Castlegar area housing market. The non-market side of the continuum, the left
side, includes emergency shelters, safe houses, and transitional and supportive housing. These
represent temporary and less stable housing situations. On this end of the continuum, the housing
forms typically include the greatest level of support services and often require the most public
funding.
Moving along the continuum, there is independent social housing for low income households. While
this type of housing is still government subsidized, there is no additional support required for
households to be able to live independently and often less subsidy is needed to maintain these
units.
On the right side of the continuum, rent supplements form a bridge across the non-market and
market sides, with government assistance provided to individuals who are renting in the private
market. The remaining tenures include rental and ownership housing forms that are available
through the private market without any subsidy required. The Housing Continuum can be seen in
Figure 1 on the following page.
Housing Needs Report | City of Castlegar | November 2018 7Figure 1: The Housing Continuum 8 Housing Needs Report | City of Castlegar | November 2018
Context
The City of Castlegar is located in the Regional District of Central Kootenay (RDCK). The City is
located approximately 44 kilometres southwest of the City of Nelson, which is the largest population
centre of the regional district, with 10,572 people, as compared to Castlegar’s population of 8,039.
The West Kootenay Regional Airport is located in Castlegar, reflecting the City’s role as a regional
trade and transportation centre. Castlegar’s location within the Regional District of Central Kootenay
is illustrated in Figure 2.

The City of Castlegar is 19.7 square kilometres in size, and is located within the Selkirk Mountains at
the confluence of the Kootenay and Columbia Rivers. The City is surrounded by Electoral Area I and
J of the RDCK. Many people who consider themselves members of the Castlegar community and
participate in City life live in the surrounding rural electoral areas, which have a total population of
5,566 and comprise 1,803.5 square kilometres1.

The City of Castlegar adopted its most recent Official Community Plan (OCP) in 2011. The OCP
identifies a number of policies to shape future growth. For residential development policies, the
OCP encourages infill development prior to the designation of new lands for residential
development or the re-designation of land identified as urban reserve for residential development.
The OCP promotes mixed-use development in the City’s downtown, and recognizes secondary
suites and manufactured homes as an important source of affordable housing. All new development
is encouraged to contribute positively to the supply of affordable, rental and special needs housing,
and the City intends to determine the appropriateness of using Housing Agreements to regulate the
resale price of any new affordable housing units in Castlegar.

In medium density designated areas, the OCP acknowledges the importance of transitioning single
detached dwellings to multiple unit buildings, and has committed to evaluate the appropriateness of
secondary suites in duplex buildings. Simultaneously, new low density residential developments are
to be created in appropriate locations, to ensure the traditional housing needs of Castlegar families
will continue to be met.

1   Electoral Area J is 1,694 square kilometres, and Electoral Area I is 109.5 square kilometres.

Housing Needs Report | City of Castlegar | November 2018                                                   9
Figure 2: Map of the Regional District of Central Kootenay

10                                                     Housing Needs Report | City of Castlegar | November 2018
Figure 3: Aerial Photograph of the City of Castlegar with Municipal Border

Housing Needs Report | City of Castlegar | November 2018                     11
Housing Indicators
 The housing indicators in this section were compiled from a variety of data sources. Where possible,
 the information is presented for specific geographic areas that encompass the City of Castlegar,
 Electoral Area I and Electoral Area J. Data at this level of geography is close to consistently
 available; however, there are certain instances where data has been suppressed to prevent direct or
 residual disclosure of identifiable data. Where it is relevant, the RDCK and the Province of B.C. as a
 whole are used as a benchmark or comparison.

 Population
 According to the 2016 Census, there were 8,039 people living in Castlegar. An additional 2,534
 people lived in the surrounding Electoral Area I and 3,137 people lived in the surrounding Electoral
 Area J. This represents an increase of 2.9% from 2011, which results in an annual growth rate of
 0.6%. Between 2011 and 2016, Castlegar grew modestly in size, which is distinct from the patterns
 demonstrated between 2006 and 2011, when the City grew by 7.7%.

 As a whole, the population for the region has experienced low levels of population growth, with the
RDCK experiencing a population growth rate of 1.9% over the 5 year period from 2011 to 2016,
adding 1,106 people. This is below the growth rate for B.C. as a whole, which experienced a
population growth rate of 5.6% over the past 5 years. Electoral Area J has experienced a population
growth rate of 4.7% over the past 5 years, while Electoral Area I has experienced a loss of population
over the past 5 years, with an annual growth rate of -0.3%.

Table 2: Population Change, Castlegar, Area Communities, Region, and B.C. (2011 to 2016)

                                                                                 Percent
                                                                                                     Annual
Community/Area                                2011             2016              Change
                                                                                                   Growth Rate
                                                                                2011-2016

City of Castlegar                                  7,816             8,039                2.9%                0.6%

Electoral Area I                                   2,570             2,534               -1.4%                -0.3%

Electoral Area J                                   2,996             3,137                4.7%                0.9%

Regional District of Central Kootenay            58,411            59,517                 1.9%                0.4%
(RDCK)

Total B.C.                                    4,400,057        4,648,055                  5.6%                1.1%

Source: Statistics Canada (2011, 2016)

12                                                            Housing Needs Report | City of Castlegar | November 2018
AGE COMPOSITION
Castlegar has a slightly younger population compared to the RDCK, and a slightly older population
than B.C. as a whole, with an average age of 45 compared to an average age of 46 for the RDCK and
42 for B.C. This population profile reflects that of Electoral Area I, which also has an average age of
45.
Castlegar has a similar proportion of children compared to B.C. as a whole, but a larger proportion
of seniors, as 25% of Castlegar’s population is above the age of 65, compared to 18% across B.C.
Castlegar’s population is aging, as the seniors population has increased by 6.3% since the 2013
Housing Needs Assessment. The proportion of young people (0-24) and adults (25-64) is very similar
between Castlegar, the RDCK, and B.C. Both Electoral Area I and J have a larger proportion of the
population between the ages of 45-64, when compared to Castlegar.
Figure 4: Population of Area Communities by Age Group, 2016
40%
35% 36%
32%
29% 29%
30% 26%
23% 22% 22%
20% 21% 21%
20% 18% 17%
15% 15% 15% 16%
14% 14%
12%
10% 9% 10% 9%
10%
4% 3%
1% 1% 2%
0%
City of Castlegar Electoral Area I Electoral Area J RDCK BC
0-14 15-24 25-44 45-64 65-84 85+
Source: Statistics Canada, Census (2016)
POPULATION PROJECTIONS
BC Stats prepares population estimates and projections at a regional district level. According to
BC Stats’ most recent projections, the population in the RDCK is expected to grow by 2,259 people
between 2019 and 2029, an increase of 4% over the projected 10 year period. At an annual
projected growth rate of 0.4%, this increase is consistent with the historical growth rates over the
previous 10 years.
Housing Needs Report | City of Castlegar | November 2018 13Figure 5: Projections of Population Growth Rate by Age Group for the RDCK, 2019-2029
50%
85+
40%
30%
65 - 84
20%
10%
15 - 24
0% 0 - 14
25 - 44
-10%
45 - 64
-20%
2019 2020 2021 2022 2023 2024 2025 2026 2027 2028 2029
Source: BC Stats, P.E.O.P.L.E. (2017)
When considering the population projections by age group, the most significant trend will be an
aging of the region’s population as baby boomers age into higher age brackets. While the region
will see a 2% loss of population for those between the ages of 0-14 and 25-44, and an 8% loss of
population for those between the ages of 45-64, the number of those aged 65-84 is expected to rise
by 24% and the number of those aged 85+ is expected to rise by 50%, as seen in Figure 5 above.
This is concurrent with trends experienced across Canada; the 2016 Census results indicate Canada
registered the largest increase in the proportion of seniors since Confederation. In 2016, people
aged 85 and older represented 2.2% of the Canadian population. This population will likely continue
to increase rapidly in coming decades, as demonstrated in Figure 5 above. Community stakeholders
indicated demand for seniors housing is likely to grow as the population continues to age, and for
those seniors who remain in single-detached housing, modifications to existing units may be needed
to accommodate seniors with accessibility challenges.
LABOUR FORCE PARTICIPATION
Based on 2016 Census data, the City of Castlegar has a higher percentage of the population that are
employed full time when compared to the RDCK, and a lower percentage when compared to B.C. In
the City of Castlegar, 29% of the population was employed full time for the full year in 2016,
compared with 27% for Electoral Area I, 30% for Electoral Area J, 24% for the RDCK, and 31% for B.C,
as seen in Figure 6. Castlegar has a lower percentage of its population working either part-time or
part of the year, when compared to both Electoral Areas, the RDCK, and B.C. Conversely, Castlegar
14 Housing Needs Report | City of Castlegar | November 2018has a higher percentage of its population that did not work, when compared to both Electoral Areas,
and B.C. The percentage of the population that did not work in Castlegar is equivalent to the
percentage of the population that did not work in the RDCK. This may reflect Castlegar’s aging
population, as a substantive portion of local residents are retired, and no longer working.
Figure 6: Total Population Aged 15 Years and Over by Work Activity, 2016
City of Castlegar Electoral Area I Electoral Area J
33% 37% 39% 34% 31%
39%
29% 27% 30%
RDCK B.C.
Did Not Work
37% 36% 33% Worked Full Year; Full Time
40%
Worked Part Year and/or Part Time
24% 31%
Source: Statistics Canada, Census (2016)
Observations from community stakeholders indicate the forestry sector is performing well, with three
operational mills in Castlegar, and an associated 690 employees. The Mercer Celgar mill is one of
the newest and largest single-line sustainable softwood kraft pulp mills in North America, and has
completed $150 million in upgrades since 2007.2 Teck Trail Operations is located approximately 28
kilometres south of Castlegar, and as one of the world’s largest fully integrated lead and zinc
smelting and refining companies, the metallurgical cluster enterprises provide modest and high-
wage jobs for numerous Castlegar residents.3 Community stakeholders indicated the employment
and housing markets in Trail, Castlegar, and Nelson are inter-related, and regional trends are
important to monitor when considering the housing needs of Castlegar residents.
2 Castlegar & District Investor & Relocation Fact Guide, Castlegar & District Economic Development.
3 Castlegar & District Investor & Relocation Fact Guide, Castlegar & District Economic Development.
Housing Needs Report | City of Castlegar | November 2018 15Because the West Kootenay Regional Airport is located in Castlegar, many organization and agencies representing the West Kootenay and Central Kootenay regions are headquartered in Castlegar. The government sector forms another industry anchor, and numerous Interior Health Authority employees are based in Castlegar and the surrounding Electoral Areas. While Castlegar is seen to be a centre within the Regional District, community stakeholders indicated social services are concentrated in Nelson, and many low-income populations may reside in Nelson due to the proximity of support services. Price is another important factor to consider, and data analysis indicates average market rental prices are lower in Trail, and higher in Nelson, when compared to Castlegar. These regional employment and housing trends impact the jobs and accommodation of many Castlegar residents, and working in Castlegar or Nelson and residing in Trail may be a more viable option for many households. In addition to forestry, mining and government, Selkirk College is a major employer in the Castlegar area. With eight campus locations in six different West Kootenay and Boundary communities, Selkirk College is a prominent local institution, and a significant source of seasonal student population, and associated student spending. From 2012 to 2017, Selkirk College enrolment grew by 13.7%, and the number of international students increased from 118 to 700.4 Stakeholders expressed concern regarding the availability and suitability of student housing, which will be explored in greater detail in the Housing Gaps section. Housing MARKET HOUSING According to the 2016 Census, there were 3,500 occupied dwellings5 in Castlegar, 1,105 in Electoral Area I, and 1,345 in Electoral Area J. This represents an increase of 4.5% since 2011, when there were 3,350 occupied dwellings in Castlegar. Based on the 2013 Housing Needs Assessment, the rate of new construction has lessened, as the number of occupied dwellings had increased by 9.1% between 2006 and 2011. Single-detached homes are the predominant form of housing in Castlegar, comprising about 2,360, or 68%, of the total number of occupied dwellings in the community, as seen in Figure 7. Census data indicates that there were 120 dwellings that were semi-detached, 210 row houses, 340 apartments or flats in duplexes, 290 apartments in a building with fewer than five storeys, 15 in other single-attached houses, and 160 in movable dwellings in 2016. 4Castlegar & District Investor & Relocation Fact Guide, Castlegar & District Economic Development; Selkirk College Stakeholder Interview, Danny Beatty. 5Statistics Canada defines “private dwelling occupied by usual residents” as a dwelling in which a person or a group of persons is permanently residing. It excludes collective dwellings, which include, for example, seniors homes and complex care facilities. 16 Housing Needs Report | City of Castlegar | November 2018
There is less diversity in the housing composition of Electoral Areas I and J, as these areas are
predominately comprised of single-detached housing, and movable dwellings. Housing
composition in the RDCK is similar to the City of Castlegar, although diversity is exhibited to a lesser
extent, as this region comprises many rural Electoral Areas, with limited variation in housing
composition.

Notably, both Electoral Area I and J indicate a number of “movable dwellings” in the 2016 Census.
While movable dwellings include traditional mobile homes, prefabricated structures built in a factory
on a permanently attached chassis before being transported to site, this category can also include
other places of residence capable of being moved on short notice, such as tents, recreational
vehicles, or travel trailers. Community stakeholders indicated such housing is used by low-income
single people who cannot find more suitable or permanent rental housing or homeownership
opportunities. Individuals sleeping in tents and vehicles are hard to reach and account for, and their
current accommodation indicates a need for more supplements and housing supports.

Figure 7: Housing Mix by Community, 2016

       City of Castlegar                                   Electoral Area I          Electoral Area J

                                                1%                              1%
                                                            12%                1%    12%
                                                                                  2%
        8%5%
      10%
      6%
      3%
                      68%
                                                                   87%
                                                                                              84%

              RDCK                                               B.C.
                                                                                   Single-Detached
                                                                                   Semi-Detached
                                                                                   Row House
       1%7%                                                   9%                   Apartment or Flat in a Duplex
      7%                                               3%
    5%                                                                             Apartment with fewer than 5 storeys
  3%                                                                               Apartment with more than 5 storeys
     2%                                            20%                   44%
                                                                                   Other Single-Attached House
                                                                                   Movable Dwelling
                    76%
                                                       12%
                                                                                 Source: Statistics Canada,
                                                                8%
                                                                                 Census (2016)
                                                                        3%

Housing Needs Report | City of Castlegar | November 2018                                                      17
AGE OF HOUSING
Census data indicates that the City of Castlegar has an older housing stock than the Electoral Area I,
Electoral Area J, and the RDCK. Based on the 2016 Census, 24% of privately occupied dwellings in
Castlegar were built before 1960, and 69% were built prior to 1981. In Electoral Area I, 55% of
privately occupied dwellings were built before 1981, and in Electoral Area J, 59% of privately
occupied dwellings were built before 1981. Overall, in the RDCK, 60% of privately occupied
dwellings were built before 1981. Throughout B.C., 44% of privately occupied dwellings were built
before 1981, as seen in Figure 8. There has been limited new housing construction in the City of
Castlegar; 10% of privately occupied dwellings were built between 2001-2016, which is the lowest
percentage when compared to Electoral Area I, Electoral Area J, the RDCK, and B.C.
Figure 8: Age of Housing Stock by Community, 2016
City of Castlegar Electoral Area I Electoral Area J
3% 1%
7%
9%
24% 13% 15% 19%
12% 9%
19%
9% 16%
40%
11% 6% 40%
45%
RDCK B.C.
4%
7% 14%
10% 1960 or before 1961-1980
27% 16% 1981-1990 1991-2000
15% 2001-2011 2011-2016
30%
18%
11%
33% 15%
Source: Statistics Canada, Census (2016)
18 Housing Needs Report | City of Castlegar | November 2018An older housing stock may be associated with poor conditions; however, community stakeholders indicated the majority of housing stock is generally in good condition. Stakeholders did note that with limited new housing construction in recent years, Castlegar’s older housing stock may be less suitable for families and older residents, as older construction standards did not always require elevators, or other building elements that are needed for families and those with accessibility challenges. CONDITION OF HOUSING The 2016 Census indicates Castlegar has a slightly higher percentage of occupied dwellings in poor condition compared to the province of B.C. as a whole. Examples of “major repairs” include problems that compromise the dwelling structure (such as structural problems with the walls, floors, or ceilings) or the major systems of the dwelling (such as heating, plumbing, and electrical). According to the 2016 Census, 8% of occupied dwellings were in need of major repairs, compared to 8% in Electoral Area J, 10% in Electoral Area I, 9% in the RDCK, and 6% in B.C. as a whole, as seen in the figures on the following page. Community stakeholders indicated Castlegar’s housing stock is generally in good condition; however, with the aging population, units will need to be modified to accommodate seniors with accessibility challenges. The figures6 on the following pages provide an indication of housing condition by the age of the primary household maintainer. 7 When comparing Castlegar to the RDCK, Castlegar has a higher percentage of housing units requiring only regular maintenance or minor repairs for households where the primary maintainer is between the ages of 15-24. As this analysis is based on the age of the primary maintainer, there are only 125 households that fall within this age category; yet, it is noteworthy none of these households reside in dwellings that require major repairs. Younger households often have lower incomes, and thus may have limited choice in the housing market, meaning they often reside in less desirable units that may require major repairs. This pattern is evident in Electoral Area J, where 33% of younger households (where the primary maintainer is between the ages of 15-24), reside in units that require major repairs. Castlegar has the highest percentage of housing units requiring major repairs for households where the primary maintainer is 85 or older. While the Affordability Analysis will provide additional income information for older residents, it is difficult to discern why these households are struggling with housing adequacy. Many seniors may have limited incomes and rely on income from federal 6 In the figures below, percentage distributions are calculated on rounded data, and thus may not necessarily add up to 100%. 7 The first person in the household identified as someone who pays the rent, or the mortgage, or the taxes, or the electricity or other services or utilities for the dwelling. When more than one member of the household contributes to the payments, the first person listed is chosen as the primary household maintainer. If no person in the household is identified as making any such payments, the first person listed is selected by default. Housing Needs Report | City of Castlegar | November 2018 19
government programs, such as Old Age Security (OAS) and Canadian Pension Plan (CPP), and may
 lack savings and other sources of financial support. At the same time, some seniors may have assets,
 may have paid off their mortgages, or have other wealth accumulation that is not accounted for. Or,
 conversely, some seniors may have inherited debt.

 The 2016 Census data indicates that of the households where the primary maintainer is 85 or older,
 93% of households own their homes, and 96% of these households have paid off their mortgages.
 Thus, these households have accumulated wealth through home ownership, and should be well-
 positioned to vacate units requiring major repairs, or construct the necessary home improvements.
 For older residents, renovations and modifications may be difficult to navigate, and while these
 households may be financially stable, community stakeholders emphasized the limited diversity in
 Castlegar’s housing stock. For seniors looking to downsize, availability is predominantly limited to
 single-detached homes, and there is a desire to see more of the “missing middle” housing in new
 construction, such as townhouses, duplexes, and multi-unit housing.

 Figure 9: Housing Condition by Age Group in Castlegar, 2016

                                             2%
100%                   12%       10%                               8%
          100%                              98%        14%                      Source: Statistics Canada,
                       88%       90%                              92%
75%                                                    86%                      Census (2016)

50%

25%

 0%
         15-24        25-44      45-64     65-84       85+        Total

                   Major repairs needed
                   Only regular maintenance or minor repairs needed

 Figure 10: Housing Condition by Age Group in Electoral Area I, 2016

 100%                                         5%
                        10%        11%                                10%
            100%                              95%       100%                    Source: Statistics Canada,
                        90%        89%                                90%
  75%                                                                           Census (2016)

  50%

  25%

   0%
           15-24       25-44      45-64      65-84      85+        Total

                   Major repairs needed
                   Only regular maintenance or minor repairs needed

 20                                                            Housing Needs Report | City of Castlegar | November 2018
Figure 11: Housing Condition by Age Group in Electoral Area J, 2016
100% 6% 9% 8%
11%
33% 100%
94% 91% 92%
89%
75% Source: Statistics Canada,
67% Census (2016)
50%
25%
0%
15-24 25-44 45-64 65-84 85+ Total
Major repairs needed
Only regular maintenance or minor repairs needed
Figure 12: Housing Condition by Age Group in RDCK, 2016
100% 6% 6% 8% 9%
11% 11%
94% 94% 92% 91%
89% 89%
75%
Source: Statistics Canada,
Census (2016)
50%
25%
0%
15-24 25-44 45-64 65-84 85+ Total
Major repairs needed
Only regular maintenance or minor repairs needed
Figure 13: Housing Condition by Age Group in BC, 2016
100% 5% 6% 7% 5% 4% 6%
95% 94% 93% 95% 96% 94%
Source: Statistics Canada,
75%
Census (2016)
50%
25%
0%
15-24 25-44 45-64 65-84 85+ Total
Major repairs needed
Only regular maintenance or minor repairs needed
Housing Needs Report | City of Castlegar | November 2018 21HOUSING TENURE According to 2016 Census data, the percent of households in the City of Castlegar that rent their homes (22%) is higher than the percentage of households that rent their homes in Electoral Area I (14%) and Electoral Area J (16%), and slightly less than the percentage of households that rent their homes in the RDCK, as shown in the figures below. The percentage of households in Castlegar that rent their homes is lower than the percentage of households who rent their homes province wide, which is 32%. The 2006 Census and 2011 National Housing Survey indicate that approximately 22% of households rented their homes in Castlegar, which shows a consistent data trend. A conversation with a local realtor indicated that there is a shortage of rental management services in Castlegar, which may be a contributing factor to the limited supply of purpose-built rental housing in the municipality. With escalating construction costs, raw land development is not always economically viable, and developers are more likely to consider infill development opportunities. The realtor identified the municipality’s role in supporting higher density development as a way to ensure development is economically viable, and a greater diversity of housing stock is created. The following figures8 provide an indication of housing tenure by the age of the primary household maintainer.9 Generally, older households are more likely to own, while younger households are more likely to rent, which is evident in Castlegar and the surrounding Electoral Areas. When comparing Castlegar to the RDCK, the RDCK has a higher percentage of renter households in every age category, except for ages 45-64, where Castlegar has a slightly higher percentage of renter households. This trend is replicated at a greater degree at the provincial level, as there is a substantially higher percentage of renter households in B.C., when compared to Castlegar, in every age category. When comparing Castlegar to the Electoral Areas, this pattern is reversed. There are fewer renter households in Electoral Area I and J than Castlegar in most age categories, except for ages 15-24 in Electoral Area I, and ages 65-84 in Electoral Area J, where Castlegar has a smaller percentage of renter households. These percentages represent small populations, thus while 100% of younger households (where the age of the primary maintainer is 15-24) in Electoral Area I are renters, this represents 10 households. 8 In the figures below, percentage distributions are calculated on rounded data, and thus may not necessarily add up to 100%. 9 The first person in the household identified as someone who pays the rent, or the mortgage, or the taxes, or the electricity or other services or utilities for the dwelling. When more than one member of the household contributes to the payments, the first person listed is chosen as the primary household maintainer. If no person in the household is identified as making any such payments, the first person listed is selected by default. 22 Housing Needs Report | City of Castlegar | November 2018
Figure 14: Housing Tenure by Age Group in Castlegar, 2016

100%                                                                   6%
               76%            34%             19%            10%               22%
                                                             90%      93%                 Source: Statistics
75%                                           81%                                         Canada, Census
                                                                               78%
                                                                                          (2016)
                              66%
50%

                                                                                             Renter
25%                                                                                          Owner
               24%

  0%
             15-24           25-44           45-64          65-84     85+      Total

 Figure 15: Housing Tenure by Age Group in Electoral Area I, 2016

 100%                                            9%            4%
                100%             31%                                   100%      14%
                                                 92%           95%                        Source: Statistics
                                                                                 86%
  75%                                                                                     Canada, Census (2016)
                                 71%

  50%

  25%                                                                                           Renter
                                                                                                Owner
    0%
                15-24           25-44          45-64          65-84     85+      Total

 Figure 16: Housing Tenure by Age Group in Electoral Area J, 2016

100%                                          10%           10%
              66%             31%                                             16%
                                              89%           91%
75%                                                                   80%     84%        Source: Statistics
                              71%                                                        Canada, Census (2016)
50%
              50%
                                                                                             Renter
25%                                                                                          Owner

  0%
             15-24           25-44           45-64          65-84     85+     Total

 Housing Needs Report | City of Castlegar | November 2018                                                      23
Figure 17: Housing Tenure by Age Group in RDCK, 2016
100%
80% 40% 18% 13% 16% 23%
87% Source: Statistics
75% 82% 84%
77% Canada, Census (2016)
60%
50%
25%
20%
0%
15-24 25-44 45-64 65-84 85+ Total
Owner Renter
Figure 18: Housing Tenure by Age Group in BC, 2016
100%
79% 46% 26% 19% 21% 32%
75% 81% 79%
74% Source: Statistics Canada,
68% Census (2016)
50% 53%
25%
21% Renter
Owner
0%
15-24 25-44 45-64 65-84 85+ Total
RENTAL VACANCY RATE
Typically, the rental market experiences pressure when vacancy rates are less than 1%, and over-
supply when vacancy rates are greater than 3%. In 2012, vacancy rates for apartments and
rowhouses was 3.7%, which is indicative of an over-supplied rental market. Since then, the vacancy
rate for apartments and rowhouses has decreased to 2.3%, which is indicative of a healthy rental
market. This was further confirmed by a scan of two popular online sources for rental housing, Kijiji
and Craigslist. During a two-week period in September/October 2018, there were an average of six
rental units in Castlegar available for rent. For comparison, the rental vacancy rate is Nelson is
currently 0%, and the vacancy rate in Trail is 3%.
24 Housing Needs Report | City of Castlegar | November 2018Evidence-based information (i.e. CMHC data) indicates the rental vacancy rate in Castlegar is
healthy; however, community stakeholders emphasized rental vacancies in Castlegar are limited, and
additional rental housing is needed to accommodate international students from Selkirk College.
This represents a disconnect between quantitative and qualitative data, which can sometimes occur.
While rental units may be available, they may not necessarily be affordable to all households, thus
creating the sense of limited vacancies for those households that require more affordable units.
Figure 19: Vacancy Trends in Castlegar, 2012-2017
3.7%
2.6%
2.3%
1.9%
1.1%
0.7%
2012 2013 2014 2015 2016 2017
Source: CMHC, Market Rental Reports. 2012-2017
COST OF RENT
In Castlegar, the average rent for all units is $742. For comparison, average apartment rents in
Nelson are $814, and average apartment rents in Trail are $663. Community stakeholders indicated
the differences in the cost of rental housing between these communities has influenced decision-
making, as residents in Nelson may be tempted to re-locate to more affordable communities,
subsequently impacting rental availability in Castlegar. Community stakeholders indicated these
regional employment and housing trends impact the accommodation and jobs of many Castlegar
residents, and working in Castlegar and residing in Trail may be a more viable option for many
households.
Stakeholders emphasized affordable homeownership is increasingly out-of-reach for many low to
moderate income households. Consequently, these households remain in rental housing, and
individuals on fixed incomes or social assistance face greater challenges in securing rental units.
Housing Needs Report | City of Castlegar | November 2018 25With rising rental and homeownership prices in many Kootenay and Okanagan communities,
Castlegar will likely continue to encounter affordability challenges.
Data provided from CMHC illustrates the total number of rental housing units in Castlegar. There has
been no new rental housing constructed between 2012 and 2017, and the number of three-
bedroom rental units is extremely limited. It is important to note that CMHC rental housing data does
not take into account the secondary rental market, which includes secondary suites, and
condominium rentals.
Figure 20: Castlegar Rental Data, Number of All Units in the Universe, 2017
150
135 133
125
100 91 89
75
50 37 34
25
4 7 3 3
0
Bachelor 1 Bedroom 2 Bedroom 3 Bedroom Total
2012 2017
Source: Canadian Mortgage and Housing Corporation (2017)
While CMHC data indicates the rental vacancy rate is indicative of a healthy rental market, interviews
with community stakeholders indicated that rental housing is extremely limited, and homeownership
is increasingly out of reach for many low- to moderate-income households. With regard to
homeownership prices, the Kootenay Real Estate Board (KREB) provided re-sale data from 2011 to
2018 for single-detached homes, townhouses, and apartments in Castlegar. This demonstrates the
cost of homeownership has increased for single-detached homes and townhouses since the 2013
Housing Needs Assessment was completed. The cost of apartment units has decreased since the
2013 Housing Needs Assessment; however, it is important to note that the apartment stock in
Castlegar is extremely limited, as there were a total of 17 apartment listings between 2011 and 2018.
The KREB was able to provide 2018 average sale prices for single-detached homes and townhouses,
but not apartment units, thus the figure on the following page demonstrates the trends from 2011 to
2017. When examining the data for 2018, it is evident prices for single-detached homes and
townhouses have increased substantially since 2017. For single-detached homes, prices increased
26 Housing Needs Report | City of Castlegar | November 2018by 7.4% between 2017 and 2018 from $296,129 to $318,171. For townhouses, prices increased by
20.9% between 2017 and 2018, from $231,800 to $280,278. As with apartment units, there are
limited townhouse units available in Castlegar. Since 2011, there have been a total of 59 townhouse
listings, as compared to 998 single-detached listings. The following section will provide an analysis
of these prices in comparison to average incomes to understand homeownership affordability.
Figure 21: Castlegar Average Sale Prices by Housing Type, 2012-2017
$400,000
$300,000
$200,000
$100,000
$0
2011 2012 2013 2014 2015 2016 2017
Single Detached Townhouse Apartment
Source: Kootenay Real Estate Board, 2012-2017
Stakeholders emphasized the necessity of creating greater diversity in housing form. For many
young families looking to enter the homeownership market, and similarly for seniors looking to
downsize, availability is predominantly limited to single-detached homes. Stakeholders expressed a
desire to see more of the “missing middle” housing in new construction, such as townhouses,
duplexes, and multi-unit housing. These indicators suggest that renters are struggling to find suitable
and affordable housing.
Housing Needs Report | City of Castlegar | November 2018 27Affordability Analysis
Overview
Affordability is the relationship between household median income and the estimated income
available for either purchasing or renting a home. The relative affordability of housing in a
community is determined by the relationship between average shelter costs (rent or monthly
mortgage) and household income. Using CMHC’s standards, housing is considered unaffordable if a
household spends 30% or more of its gross income on shelter costs. Households spending greater
than 50% of their gross income on shelter fall below the housing standard of affordability, and are
considered to be in “core housing need.”
For renters, shelter costs includes rent and utilities. For owners, shelter costs include mortgage
payments (principal and interest), property taxes, condominium/strata fees (if any), and any
payments for electricity, water, and other municipal services. Housing is one factor in the overall cost
of living for individuals and families; other factors include the cost of groceries, transportation, and
childcare.
Rental Affordability Analysis
For rental affordability, median income levels were obtained through Statistics Canada, using a
custom tabulation of tax-filer income data. Median income means that half of the population is
earning more than the median income, and half of the population is earning below the median
income. Table 3 below shows affordability levels of couple families, lone-parent families, and single-
person households by age group in the Castlegar area. The median income for all Castlegar
households is $84,780, which is slightly higher than households throughout B.C. as a whole
($79,750).
Table 3: Rental Affordability for Castlegar Households by Age, 2015
Available for Rent Available for Rent Average
(30% of income) (50% of income) Monthly Rent
Age
Group Single Single
Couple Lone Parent Couple Lone Parent One Two All
Person Person
Households Households Households Households Bed Bed Units
Households Households
Data Data
0 to 24 $999 Suppressed $331 $1,665 Suppressed $551 $721 $755 $742
25 to 34 $2,211 $744 $820 $3,685 $1,240 $1,367 $721 $755 $742
35 to 44 $2,728 $840 $1,098 $4,547 $1,399 $1,829 $721 $755 $742
45 to 54 $3,047 $1,401 $918 $5,078 $2,335 $1,530 $721 $755 $742
55 to 64 $2,621 $2,140 $974 $4,368 $3,566 $1,624 $721 $755 $742
65+ $1,559 $1,496 $665 $2,598 $2,493 $1,108 $721 $755 $742
28 Housing Needs Report | City of Castlegar | November 2018Available for Rent Available for Rent Average
(30% of income) (50% of income) Monthly Rent
Age
Group Single Single
Couple Lone Parent Couple Lone Parent One Two All
Person Person
Households Households Households Households Bed Bed Units
Households Households
ALL $2,194 $1,324 $801 $3,657 $2,206 $1,335 $721 $755 $742
Source: CMHC Rental Market Report 2017; Statistics Canada, Income Statistics, Tax-filer Data, Annual Estimates
for Census Families and Individuals, 2015
The data indicates that median rental housing prices should be affordable for most couple family
age groups in the Castlegar area. For single-person households, rental affordability is more
challenging, particularly for households under the age of 25, who would be unable to afford median
monthly rents using 50% of their gross income. Data has been suppressed for lone-parent
households under the age of 25; however, based on the incomes of lone-parent households ages 25
to 34, who would be unable to afford median monthly rents using 30% of their gross income, it is
likely lone-parent households under the age of 25 would be unable to afford median monthly rents.
While couple households and lone-parent households over the age of 65 should be able to afford
rents within 30% of median gross incomes, lower incomes mean they are more challenged than
other age groups with housing affordability. Many seniors in this category may have limited incomes
and rely on income from federal government programs, such as Old Age Security (OAS) and
Canadian Pension Plan (CPP), and may lack savings and other sources of financial support. At the
same time, some seniors may have assets, may have paid off their mortgages, or have other wealth
accumulation that is not accounted for. Or, conversely, some seniors may have inherited debt. These
are all additional factors that influence households’ ability to afford rent. Furthermore, when
considering average monthly shelter costs, rental prices vary depending on condition and number
of bedrooms and could be more or less affordable than the typical listed price.
Housing Needs Report | City of Castlegar | November 2018 29You can also read