Towards the Reversal of Poverty and Income Inequality Setbacks Due to COVID-19: The Role of Globalisation and Resource Allocation
←
→
Page content transcription
If your browser does not render page correctly, please read the page content below
Munich Personal RePEc Archive

Towards the Reversal of Poverty and
Income Inequality Setbacks Due to
COVID-19: The Role of Globalisation
and Resource Allocation

Ofori, Isaac K. and Armah, Mark K. and Asmah, Emmanuel
E.

University of Insubria, University of Cape Coast

2021

Online at https://mpra.ub.uni-muenchen.de/108619/
MPRA Paper No. 108619, posted 05 Jul 2021 04:50 UTC
European Xtramile Centre of African Studies
 (EXCAS)

 EXCAS Working Paper

 WP/21/043

Towards the Reversal of Poverty and Income Inequality Setbacks Due to
 COVID-19: The Role of Globalisation and Resource Allocation

 Isaac K. Ofori
 (Corresponding Author)
 Department of Economics,
 University of Insubria,
 Via Monte Generoso, 71, 21100, VA, Varese, Italy.
 E-mail: isaac.ofori1@ucc.edu.gh
 ikofori@uninsubria.it;

 Mark K. Armah
 Department of Data Science and Economic Policy
 School of Economics,
 University of Cape Coast, Cape Coast, Ghana.
 E-mail: marmah@ucc.edu.gh

 Emmanuel E. Asmah
 Department of Data Science and Economic Policy,
 School of Economics,
 University of Cape Coast, Cape Coast, Ghana.
 E-mail: easmah@ucc.edu.gh

 1
2021 European Xtramile Centre of African Studies WP/21/043 Research Department Towards the Reversal of Poverty and Income Inequality Setbacks Due to COVID-19: The Role of Globalisation and Resource Allocation Isaac K. Ofori, Mark K. Armah & Emmanuel E. Asmah January 2021 Abstract Policy recommendations for building resilient and all-inclusive societies post COVID-19 pandemic continue to dominate the media and research landscapes. However, rigorous empirical content backing such claims, particularly, on both poverty and income inequality, is hard to find. Motivated by the bleak outlook of the Middle East and North Africa (MENA) region, as driven primarily by the floundering hydrocarbon sector, vulnerable employment, and low foreign direct investment, we analyse the poverty and income inequality effects of globalisation and resource allocation in the region. Using data from the World Bank’s Poverty and Equity Database for the period 1990–2019, we provide estimates robust to several econometric techniques the pooled least square, fixed effect, random effect, and the system generalized method of moments estimators to show that: (1) while economic globalisation reduces both poverty and income inequality, social globalisation matters only for income inequality in MENA; (2) economic globalisation is remarkable in reducing income inequality through resource allocation. Policy recommendations are provided in the light of the geopolitical fragility and rise in social globalisation of the region. Keywords: Economic Integration, Financial Deepening, GMM, MENA, Globalisation, Inequality, Poverty JEL Codes: F14; F15; F6; I3; O53; 055 1.0 Introduction The coronavirus disease (COVID-19) struck at the time the world was on a weak growth pedestal. Indeed, since the 2009 global financial meltdown, the recovery of the world economy towards a resilient growth trajectory is yet to be realized (Kilic Celik et al. 2020; Kose and Ohnsorge 2019). For instance, in 2019, the global economy realised a growth rate of 1.9 per cent before slumping into a record 4.4 per cent contraction in 2020 (IMF 2020a). Within a year, the marginal gains made towards recovery had been completely eradicated. One region hardest hit by the dismal effects of the coronavirus 2
pandemic is the Middle East and North Africa1 (MENA), which contracted by at least 4.2 per cent in 2020 from a mild 0.8 per cent growth in 2019 (World Bank 2020a; IMF 2020a). More crippling is the disruptive effects of the pandemic on welfare gains. In fact, the issue of poverty and income inequality has taken centre stage as the pandemic erodes hard fought gains accumulated in the past one-and-a-half decades on Sustainable Development Goals2 1, 8 and 10 (World Bank 2020b). The concern lies in the implications of poverty and income inequality for the quality of life, health, education, social cohesion, and mortality (World Bank 2020b; Pickett and Wilkinson 2015; Burns 2015). Such ramifications are even more pertinent in a region where Ravallion and Chen (2019) identify as poor and unequal alongside the sub-Saharan Africa (SSA) and the Latin America and Caribbean (LAC) blocks. The MENA region is, therefore, begging for attention. In the wake of the COVID-19 pandemic, the IMF and World Bank (2020) and IMF (2020b) identified resource allocation3 as one of the chief channels for reducing poverty and inequality. In addition to resource allocation is the unprecedented rise in globalisation in the 21st century, which presents policymakers with opportunities for shared growth, as well as challenges that can amplify the vulnerability of economies to poverty and inequality (Bourguignon 2016; Bergh and Nilsson 2014 2010; Stiglitz 2002). The optimism with globalisation is that it has the power to generate durable and equitable wealth through technological transfer, innovation diffusion, job creation, macroeconomic stability and industrialization (Obeng et al. 2021; Bhagwati and Srinivasan 2002). Globalisation can also contribute to shared prosperity through the augmentation of recipient countries’ productive capacity, forward and backward linkages, diversification, global value chain participation and foreign exchange (see, Obeng et al. 2021). If the world ever doubted the power of globalisation, the current crisis hobbled it all. Per current growth prospects of MENA, if policymakers do not map out strategies to harness opportunities globalisation offers, such economies risk being primary supplier in the global value chain providing descent employment opportunities in other countries; and pursuing growth at the expense of shared prosperity. Thus, in rebuilding and propelling the MENA towards a resilient growth path post COVID-19, there is a clarion call for policymakers to map out policies with globalisation4 as a key consideration (see, UNCTAD 2020a; World Bank 2020c). Indeed, economic integration has long been identified as an inclusive growth enhancer in the MENA evidenced by the coming into force of several bilateral and multilateral trade agreements, markedly, the Greater Arab Free Trade Area (GAFTA)and the Gulf Cooperation Council (GCC). However, in a region where poverty5 and income inequality are rising and made even severe due to the coronavirus pandemic (ILO 2020a; World Bank 2020b), globalisation per se may not be an end in itself in achieving shared prosperity. Further, despite evidence of its growth-inducing effects, economic 1 The region has been struggling as growth slumped sharply from 5 per cent in 2016 to 1.3 per cent in 2019 primarily due to poor performance of the hydrocarbon sub-sector amid US sanctions on Iran (World Bank 2019) 2 In respective terms, SDGs 1, 8 and 10 seek to end poverty, ensure decent work and economic growth, and reduce income inequality. 3 The World Bank recognise that mobilizing adequate resources remains the backbone of SDGs, which generally seek to end poverty, lessen inequality and injustice as well as combat climate change by 2030 4 In seeking to rebuild post COVID-19 crisis, the World Bank (2020c) notes that regional integration may help MENA. 5 Corral et al. (2020) reports that the MENA has seen extreme poverty rate rise, from 2.3 percent in 2013 to 3.8 percent in 2015; it then almost doubled to 7.2 percent in 2018. 3
integration has also been found to fuel inequality in the developing world (see, Dorn et al. 2018; Bergh and Nilsson 2010), signifying the need for a new policy paradigm if the globalisation channel is to be harnessed. However, opinions shared on how governments/policymakers can (re)build prosperous and all-inclusive MENA post COVID-19 are deficient of rigorous empirical content. Also, though multilateral trade agreements have generally not yielded the expected welfare objectives in the MENA, the opportunities offered by the Africa Continental Free Trade Area (AfCFTA) and European Union Customs Union (EUCU) are clear glimmers of hope. Conspicuously, the few studies we sighted, which are in line with our view are plagued with some shortfalls from policy perspectives. First, these empirical works focus solely on trade flow indicators, ignoring the fact that economic integration does not mean a total elimination of tariff (see e.g., Le Golf and Singh 2014; Meinhard and Potrafke 2012). Second, the plausible pathway effects of globalisation and resource allocation on both poverty and inequality in the MENA have not been explored. Third, despite the momentous rise in social globalisation 6 in contemporary global interrelations via information and communication technology (e.g., radio, television, telephone, social media), its effect on poverty and income inequality in MENA have not been explored. Our contribution to knowledge is thus twofold first, we investigate the effects of economic and social globalisation on income inequality and poverty in MENA, and second, we explore whether resource allocation has greater poverty- and inequality-reducing effects through globalisation in MENA. The rest of the paper is organised as follows: the next section focuses on the theoretical connections between globalisation, resource allocation, and poverty and income inequality. Section 3 also presents the methods and data underpinning analyses. The last two sections, in respective terms, present the results, and the conclusion and policy recommendations. 2.0 Theoretical link between globalisation, resource allocation, and poverty and income inequality A number of theories posit poverty and income inequality effects of both resource allocation and globalisation. First, despite its much-emphasized simplistic assumption of resource and technological homogeneity across countries, the Heckscher-Ohlin model indicates that countries gain from globalisation by specializing in production activities which they have relatively abundant factor (see, Ohlin 1933). The argument has been enhanced by the International Monetary Fund (2000) who reckon that globalisation can spur growth and poverty alleviation through global value chain participation, macroeconomic stability, employment, and innovation. This is an argument that feeds into the static trade theories of Samuelson (1939) and Bhagwati and Srinivasan (2002), which indicate that surplus labour realises an increase in real incomes when countries open up to trade. In addition is the dynamic theory of globalization, which sees economic integration as a necessary vehicle/lubricant for attracting foreign innovation, spurring private-sector competition, scale economies, and global value chain participation while limiting rent-seeking activities favoured by trade restrictions (see, 6 Social globalisation comprises information, culture and interpersonal relations. 4
Grossman and Helpman 1991; Lucas 1988). The dark side of globalisation, however, is
that it can be harmful to the fight against poverty as it amplifies the susceptibility of
economies to economic and financial meltdown (Cornia, 2004; Taylor, 2004).
Considering the growing diversification and development of socioeconomic systems of
the region, our first hypothesis is to test whether economic globalisation has a
suppressing effect on poverty in the MENA.
 On within- and between-country income distribution, the Stolper-Samuelson and
the factor price equalization theorems posit that globalisation can be a favourable
medium for spurring equitable income distribution through increased demand for
labour and global value chain participation (Samuelson 1948). However, the current
wave of globalisation, which encompasses greater liberalisation of capital accounts, and
financial and labour markets can counterbalance the potential favourable income
distributional effects. As Krusell et al. (2000) and Acemoglu (2003) reckon, the diffusion
and spilling over of skilled-biased innovation in the developing countries characteristic
of globalisation is favouring rising demand for skilled labour and increased wage
dispersion. In particular, within-country income inequality can deepen due to- (1)
demonstration effect (see Piva 2003); (2) the vertical spillovers (see Saggi 1999); (3)
labour turnover and spin-offs (see Kinoshita, 2000); and (4) the competition effect (see
Bayoumi et al. 1999). Despite these possible drawbacks, Stiglitz (2002) and Acemoglu
and Robbinson (2012) argue that stronger and fairer regulatory regimes (labour
unions) are crucial for bridging the wage differential gap. Such is the developing story of
MENA and as such, our second hypothesis is to test whether economic integration has a
negative effect on income inequality.
 A key concern with contemporary globalisation goes beyond the economic
perspective to encompass the spread of western culture, identity and inclusion. This is
the social dimension of globalisation, driven by advances in information and
communication technology (ICT), which continues to influence international
transactions, exchange of information, innovation and migration. Particularly, Atkinson
(1997) argue that such developments may alter the taste and consumption patterns in
the developing world. The result of this is the erosion of the wage bargaining power of
unions and labour settling for a low wage. Our third hypothesis, therefore, is to test
whether social globalisation has a negative effect on poverty and income inequality in
MENA.
 Further, the relevance of financial deepening and government expenditure in
fostering shared prosperity in the developing world cannot be discounted. Indeed, the
MENA is one of the regions in the developing world with low interest rates, growing
infrastructure development and social equity frameworks that can realistically share
globalisation dividends. This is consistent with the argument of Demirgü ç -Kunt and
Levine (2009; 2008) and Stiglitz (2002) that resource allocation and social equity
policies are worthwhile to level the playing field for equitable income growth and
distribution. This ushers us into our final hypothesis, which is to test whether there is
higher poverty- and income inequality-reducing effects of resource allocation in the
presence of enhanced globalisation.

2.1 Poverty and income inequality trends in MENA
Both poverty and income inequality have been found to be socially divisive and
corrosive as they result in the wastage of human capital and potentials, inefficient
resource allocation, high dependency burden, and institutional fragility (Pickett and

 5
Wilkinson 2015; Bourguignon 2004). Some key challenges encountered in the fight
against poverty and inequality in MENA include the slow growth fuelled primarily by a
high dependency on the commodity sub-sector (of which 60% is from oil), growing
precarious unemployment, capital and the surging effects of climate change and (World
bank 2020b; 2016). Particularly, the sluggish growth of the region due to the flailing
hydrocarbon subsector even before COVID-19 pandemic, and the sharp fall in foreign
direct investment (FDI) since the 2009 global financial crisis, presents policymakers
with the greatest headache in tackling inequality and poverty (OECD 2020a; UNCTAD
2020b). It comes as no surprise that following the recent less inclusive growth
trajectories of the MENA, and the emergence of the coronavirus disease, the debate on
the effect of economic integration in tackling poverty and income inequality has been
rekindled (ILO 2020b; UNCTAD 2020a; World Bank 2020c). It is expected that trade and
technological diffusion can be a catalyst for inclusive growth by improving MENA’s
global value chain participation, forward and backward linkages, and job creation.
Despite these potentials, past experience on economic integration in steering the
growth and inclusivity agenda of the region leaves much to be desired. The
interpretations are varied but the significant pointers are the FDI-deterring geopolitical
fragility of the region, weak intra-regional trade, and climate change (World Bank
2020b, 2020d, 2017).
 Indeed, information gleaned from World Bank (2020b) shows that, among all the
regions, the MENA leads in terms of rising poverty (measured by the poverty gap7 of
US$1.90 and US$3.20 a day) and income inequality (i.e., Gini index) levels. More
troubling is the projection that the pandemic would have greater dismal effects in more
unequal economies due to struggling small and medium scale enterprises, food price
shocks, job losses and low social protection (Brown et al. 2020; ILO 2020b).
Particularly, on poverty, the World Bank (2020b) projects that between 2020 and 2030,
the total number of people likely to be pushed into the extreme poverty net is between a
staggering 68 million and 132 million. The picture on income inequality8is not
encouraging either as per ILO (2020a) projections on precarious employment and
under-employment. The report indicates that between 2020 and 2021 alone, 1.7 million
people could to lose their jobs, 700,000 of them women. To put the trend of income
inequality into perspective, we present Figure 1 to show how the MENA compares to
other regions over the past three decades.

7 To reflect recent changes in purchasing power parity (PPP), and data availability on population, inflation, and
national income accounts, Ferreira et al. (2015) revised the 2005-PPP poverty line of US$1.25 to US$1.90 to ensure
maximum international comparison. The new calculation also takes the average value of national poverty lines from
15 of the poorest economies in the world: Chad, Ethiopia, The Gambia, Ghana, Guinea-Bissau, Malawi, Mali,
Mozambique, Nepal, Niger, Rwanda, Sierra Leone, Tajikistan, Tanzania, and Uganda, from a sample of 74 countries.
8 With Alvaredo et al. (2018) showing that between the period 1990-2016, the MENA tops as world’s most unequal

region with the top 1 per cent holding 64 per cent of all incomes, inequality raises serious threats for both poverty
and social cohesion.

 6
Figure 1: Trend of Average Income Inequality Across Regions, 1990 – 2019
Source: Authors’ construct with data from Poverty and Equity Database, 2021

Figure 1 clearly shows that, on average, the MENA boasts of a lower income inequality
score only when compared to regions like Latin America and Caribbean, and
Sub-Saharan Africa. However, while in the past decade, the SSA records an average
5-percentage point drop in income inequality, the MENA recorded a 3-percentage point
upsurge. Two key issues explain this upward trajectory. First, the MENA has not fully
recovered from the brunt of the 2009 global financial crisis, and second, aside the low
social protection expenditure9, the lingering armed conflict and terrorism10 in the Arab
world has meant that foreign investors have substituted the region for the SSA (see,
UNCTAD 2019; World Bank 2020d, 2017). Despite this trend, there is a bit of
country-specific variation experience, which we show in the Figure A1. Figure A1 shows
that income inequality is high in countries such as Djibouti, Turkey, Morocco and Yemen
with a Gini score of at least 0.35. It is worth noting that while Egypt, Tunisia, Djibouti,
and Algeria are recording gains in their fight against income inequality, the other
countries in our study show the contrary case. Though we recognize that the kind of
policies aimed at reducing inequality may depend on the underlying drivers and
country-specific policy and institutional settings (Dabla-Norris et al. 2015), the growing
global dynamism means that the trend in Figure 1 is less likely to persist. Also, the trend
of poverty as we show in Figures 2 and A2 follow a similar course.

9 Lustig, Lopez-Calva and Ortiz-Juarez (2012) show that social protection in the forms of direct transfers partly
accounts for the income inequality reduction gains in the LAC over the last two decades.
10 The Islam State and Al Qaeda terrorist groups have contributed immensely to making the region unsafe for foreign

investors.

 7
Figure 2: Trend of Poverty gap (US$1.90) Across Regions, 1990 – 2019
Source: Authors’ construct with data from Poverty and Equity Database, 2021

It is evident from Figure 2 that across all the regions, only MENA reports rising poverty
levels (i.e., Poverty gap US$1.90) since 201011. Interestingly, this trend is in tandem
with that of fragile and conflict zones, clearly signifying the poor economic
opportunities arising due to conflict, weak social inclusion and protection. For the
within-country variations indicated in Figure A2, we observe that Yemen, Iraq, Tunisia
and Algeria are the countries in the region facing an uphill task in their poverty fight.
 The trends of poverty and income inequality we present in Figures 1 – A2 show
that as the region seek to rebuild post COVID-19, a new policy direction is paramount
towards reversing the current welfare downturn. Though we recognize the IMF (2020a)
admonishing of policymakers to spend to support vulnerable groups, save lives, and
contain the COVID-19 pandemic, the crucial aspect is the medium term to long-term
strategy. With the pandemic lurking, growth decelerating, oil sector floundering,
precarious employment12 rising, and FDI also declining in the MENA, swift, significant,
and substantial policy action is needed. This is where our study fits perfectly as we
provide ways policymakers in MENA can harness the power of globalisation and
resource allocation in alleviating poverty while reducing income inequality.

3.0 Data and methodology
 3.1 Data

11 It is also clear that South Asia observed such developments from 1993 – 2008.
12 The ILO (2020b) projects rising levels of vulnerable employment worldwide with the SSA, LAC and MENA leading
the way.

 8
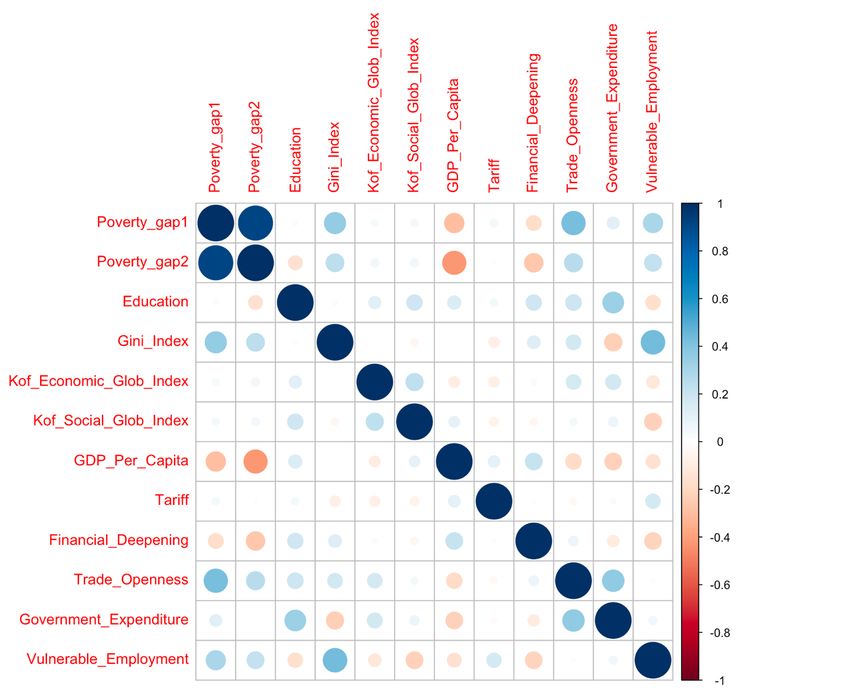
We use macrodata spanning 1990 to 2019 for the analysis. Data on our outcome variables poverty and income inequality are aggregated microdata sourced from the World Bank’s Poverty and Equity Database. Our main outcome variable for the income inequality model is the World Bank’s Gini index 13 (Milanovic ́ 2014), while that of poverty is the poverty gap of US$1.90 (Ferreira et al. 2015). The poverty gap of US$1.90 a day is used as it reflects the depth and incidence of poverty across countries 14. Additionally, we use the Palma ratio, drawn from the Global Consumption and Inequality Project (Lahoti et al. 2016), for checking the robustness of our inequality estimates. Similar checks are conducted for the poverty gap of US$1.90 estimates using the poverty gap of US$3.20 considering the income classification of the countries under consideration. Our variable of interest, globalisation, is captured (1) by economic integration (composed of tariff, trade openness, and economic globalisation), (2) social globalisation, and (3) overall globalisation. While data on social, economic and overall globalisation are sourced from the Konjunkturforschungsstelle (KOF) index of globalisation15 (Gygli et al. 2019; Dreher 2006), data on tariff and trade openness are drawn from the World Development Indicators (World Bank 2020e). For controls, we consider variables such as financial deepening, government expenditure, vulnerable employment, GDP per capita, and education. These control variables are also taken from the World Development Indicators (World Bank 2020e). It is imperative to point out that, of the 21 MENA countries, we provide analysis based on 11 on grounds of data unavailability and empirical prudence. Particularly, data is limited on poverty, income inequality, economic and social globalisation for the United Arab Emirates, Saudi Arabia, Oman, Qatar, Kuwait, Lebanon, Libya, Bahrain, Israel, and Jordan. The description of the variables is provided in Table A1. 3.2 Estimation Strategy The theoretical foundation of our study is the argument that efficient resource allocation and economic integration can create shared prosperity (see, Obeng et al. 2021; Demirgü ç-Kunt and Levine 2009, 2008; Bhagwati 1973). The empirical rigor of our paper begins with the specification of baseline models for both income inequality and poverty. That is, we regress both income inequality and poverty on our controls. Next, though we recognize the argument of Dreher and Gaston (2008) in introducing globalisation and its components in the same model, we follow Bergh and Nilsson (2010) by introducing them in separate models to avoid multicollinearity problems (see the correlation between the variables in Figure A3). We thus introduce globalisation in its various forms economic globalisation, social globalisation and overall globalisation stepwisely into the models. Finally, per our hypothesized higher poverty- and inequality-reducing effects of resource allocation in line with globalisation, we 13 A Gini coefficient of zero expresses perfect equality in given country while 1 denotes the case of extreme inequality. 14 Poverty gap at $1.90 a day (2011 PPP) is the mean shortfall in income or consumption from the poverty line of $1.90 a day (counting the nonpoor as having zero shortfall), expressed as a percentage of the poverty line. 15 The KOF Index of Globalisation is an index measuring the degree of globalisation of 122 countries. The overall index of globalisation provides statistics on three main dimensions of globalisation economic, social, and political. 9
introduce interaction terms16 for economic globalisation and resource allocation. For the estimations, we run our models using the pooled least square estimator, and the fixed effect and random effect estimators. We specify our pooled least square model for income inequality as follows: ( ) = 0 + , −1 + ( ) + 1 ( × ) + 2 ( × ) + + + (1) Similarly, we present our panel fixed effect and random effect models as seen in (2) ( ) = 0 + , −1 + ( ) + 1 ( × ) + 2 ( × ) + 牜 + + (2) Finally, we present similar pooled least square, and fixed effect and random effect models, where poverty is regressed on globalisation and the control variables as seen in equations (3) and (4), respectively. ( ) = 0 + , −1 + ( ) + 1 ( × ) + 2 ( × ) + (3) ( ) = 0 + , −1 + ( ) + 〱1 ( × ) + 2 ( × ) + + + (4) Where gini is the Gini index; is poverty gap of US$1.90 a day; is globalisation captured as economic integration (i.e., tariff, trade openness, economic globalisation), social globalisation and overall globalisation. Also, is a vector of controls economic growth, education, government expenditure, vulnerable employment, financial deepening and inequality17. Moreover, ecoglob*fin is interaction term for financial deepening and economic globalisation; ecoglob*gov is another interaction term for government expenditure and economic globalisation; i is country; t is time; is the natural logarithm; is the country-specific effects; and is the white noise. Taking cues from Cornia and Martorano (2012), however, we identify three possible sources of endogeneity from the aforementioned estimation techniques (1) the potential correlation between country-specific errors and the regressors if the fixed effect technique is appropriate, (2) the simultaneity between income inequality and poverty, and (3) the reverse causality between economic growth and income inequality. To the extent that these endogeneity concerns can bias our estimates, we follow Obeng et al. (2021) and Ofori and Asongu (2021) by running our inequality and poverty models using the system GMM estimator proposed by Arellano and Bond (1995). To 16 These are: (1) economic globalisation and government expenditure, and (2) economic globalisation and financial deepening. 17 Inequality enters the poverty equation only as a control following the argument of Ravallion (2004) and Bergstrom (2020) 10
take this into account empirically, we modify equations (2) and (4) in consonance with the system GMM specification18 as presented in equations (5) and (6), respectively. ( ) = 0 + 1 ( −1 ) + , −1 + ( ) + 1 ( × ) + 2 ( × ) + + + (5) ( ) = 0 + 1 ( −1 ) + , −1 + ( ) + 1 ( × ) + 2 ( × ) + + + (6) 4.0 Results and discussion 4.1 Summary statistics Table 1 shows the summary statistics, which gives a general overview of our data over the study period. The data shows an average depth and intensity of poverty, and income per capita of 1.135 and US$ 3,147 respectively. Also, the average Gini score is 0.36 (36%), denoting a moderately high income inequality in the MENA. Table 1: Summary Statistics (1990 – 2019) Variables Obs. Mean Sd Min Max Kurtosis Skewness Vulnerable Employment 330 35.75 10.28 19.73 60.04 2.085 0.316 GDP Per Capita 330 3,147 1,492 631.5 6,949 2.436 0.462 Government Expenditure 330 16.04 4.910 2.332 28.97 3.086 0.201 Trade Openness 330 72.22 43.13 0.021 348.0 19.76 3.451 Poverty Gap (US$1.90) 300 1.135 1.840 0.00 7.800 8.100 2.432 Poverty Gap (US$3.20) 300 5.151 4.925 0.300 17.90 3.471 1.143 Gini (net) 300 36.78 4.816 27.60 45.10 1.963 -0.052 Education 330 6.593 0.714 6.00 8.00 2.318 0.776 Financial Deepening 330 30.31 23.70 1.267 95.51 2.982 0.922 Tariff 330 15.87 21.96 3.020 217.8 71.67 7.804 Kof. Globalisation (overall) 330 50.52 11.65 25.45 72.11 2.169 -0.119 Kof. Globalisation (economic) 330 47.48 9.839 3.704 67.59 3.704 -0.882 Kof. Globalisation (social) 330 44.59 15.84 17.61 78.14 2.075 0.221 Note: Obs is Observation; Std. Dev is Standard Deviation; Min denotes Minimum; and Max denotes Maximum Further, our data show a mean vulnerable employment of 35.75, which per ILO standards, signifies a considerably high informal sector of the region. 18 (i) the lags of the outcome variables are introduced in the models, and (ii) In all GMM estimations, the instruments used are the lags of the regressors. 11
4.2 Preliminary results on effect of globalisation, resource allocation and income inequality in MENA We start off with the presentation of the results from the pooled least square estimator, which is presented in Table SM1 as supplementary results. The results show that, with the exception of tariff, all the indicators of globalisation report significant income inequality-reducing effects. It is, however, imperative to point out that economic globalisation ranks highest in reducing income inequality in the MENA region. Our controls vulnerable employment, government expenditure and education also prove crucial for income inequality in the MENA. We proceed by presenting our fixed effect and random effect results in Table 2. 12
Table 2: Fixed Effect and Random Effect Results on the Effect of Globalisation, and Resource Allocation on Income Inequality in MENA (Dependent variable is the Gini index)
Variables FE(1) RE(1) FE(2) RE(2) FE(3) RE(3) FE(4) RE(4) FE(5) RE(5) FE(6) RE(6) FE(7) RE(7) FE(8) RE(8)
Vulnerable Employment -0.0007 -0.0007 0.0001 0.0047** -0.0008 0.0038*** -0.0007 -0.0007 -0.0005 0.0043*** -0.0007 -0.0006 -0.0005 0.2062*** -0.0005 0.0056***
 (0.0008) (0.0008) (0.0010) (0.0024) (0.0008) (0.0014) (0.0008) (0.0008) (0.0008) (0.0016) (0.0008) (0.0008) (0.0008) (0.0653) (0.0008) (0.0019)
Government Expenditure -0.0001 -0.0001 -0.0008 -0.0078*** -0.0001 0.0050*** -0.0000 -0.0001 -0.0001 -0.0058*** -0.0001 -0.0003 -0.0000 -0.1944 -0.0001 0.0082***
 (0.0010) (0.0010) (0.0009) (0.0019) (0.0010) (0.0017) (0.0010) (0.0010) (0.0010) (0.0021) (0.0010) (0.0010) (0.0032) (0.3191) (0.0010) (0.0024)
Financial Deepening -0.0007 -0.0005 -0.0011 0.0552*** -0.0006 0.0003 -0.0005 -0.0004 0.0001 0.0069 -0.0008 -0.0003 0.0002 0.1345 0.0003 -0.0086
 (0.0037) (0.0037) (0.0052) (0.0112) (0.0037) (0.0062) (0.0037) (0.0037) (0.0037) (0.0076) (0.0037) (0.0038) (0.0037) (0.3028) (0.0052) (0.0135)
GDP per capita 0.0011 0.0011 0.0007 -0.0097* -0.0011 0.0019 -0.0010 -0.0010 -0.0014 0.0015 -0.0013 -0.0013 -0.0014 0.1087 -0.0014 0.0036
 (0.0022) (0.0022) (0.0021) (0.0051) (0.0022) (0.0042) (0.0022) (0.0022) (0.0022) (0.0052) (0.0022) (0.0023) (0.0022) (0.2123) (0.0022) (0.0061)
Education 0.0186 0.0204 0.0055 0.0593** 0.0187 0.0337*** 0.0185 0.0196 0.0191 0.0459*** 0.0170 0.0221 0.0191 1.6510*** 0.0191 0.0523***
 (0.0142) (0.0138) (0.0142) (0.0261) (0.0142) (0.0119) (0.0142) (0.0139) (0.0140) (0.0120) (0.0143) (0.0138) (0.0141) (0.4301) (0.0141) (0.0123)
Tariff 0.0098 0.0072
 (0.0102) (0.0188)
Trade Openness -0.0002 0.0062***
 (0.0008) (0.0013)
Kof. Overall Globalisation -0.0007 -0.0007
 (0.0032) (0.0032)
Kof. Economic Globalisation -0.0107** -0.0346*** -0.0107** -1.6892*** -0.0107** -0.0466***
 (0.0047) (0.0108) (0.0048) (0.4399) (0.0048) (0.0126)
Kof. Social Globalisation 0.0034 0.0029
 (0.0034) (0.0036)
Kof. Economic Glob. × Gov. -0.0002 0.4671
 (0.0032) (0.3169)
Kof. Economic Glob. × Fin. -0.0002 -0.0142
 (0.0032) (0.0091)
Constant 3.4643*** 3.4451*** 3.4536*** 2.2039*** 3.4681*** 3.0481*** 3.4756*** 3.4613*** 3.6409*** 3.5520*** 3.5380*** 3.4788*** 3.6431*** 34.0029*** 3.6431*** 3.4016***
 (0.1369) (0.1407) (0.1473) (0.2690) (0.1383) (0.1720) (0.1470) (0.1532) (0.1565) (0.2540) (0.1564) (0.1588) (0.1636) (10.6952) (0.1636) (0.3059)
Observations 204 204 204 204 204 204 204 204 204 204 204 204 204 204 204 204
R-squared 0.215 – 0.437 – 0.217 – 0.217 – 0.470 – 0.263 – 0.470 – 0.470 –
Countries 11 11 11 11 11 11 11 11 11 11 11 11 11 11 11 11
Hausman Statistic 5.11 – 28.88 – 5.27 – 4.77 – 5.05 – 4.63 – 4.11 – 4.88 –
 P-value 0.410 – 0.000 – 0.551 – 0.518 – 0.565 – 0.512 – 0.558 – 0.761 –
 Standard errors in parentheses; *** p
For our variables of interest, we find that only tariff is statistically significant in affecting
 inequality though the trade flow indicators (trade openness and economic
 globalisation) report the expected signs. Based on the Hausman test, there is no
 evidence of clear randomness in explaining inequality in the MENA. The Hausman test
 results from model 2 (Column 2) shows evidence of country-specific effect in explaining
 income inequality. This also indicates the presence of correlation between the
 regressors and the unique errors, presenting us with evidence of the endogeneity
 concerns, which we address using the system GMM.

 4.4 Effect of globalisation and resource allocation on income inequality in MENA
 We present our estimates by first pointing out from our baseline results that previous
 year’s level of income inequality, government expenditure and education are crucial
 drivers of income inequality in the MENA (see Column 1, Table 3).

 Table 3: Dynamic System GMM Results on Effects of Globalisation and Resource Allocation
 on Income Inequality in MENA (Dependent Variable: Gini Index)
Variables (1) (2) (3) (4) (5) (6) (7) (8)
Lag of Inequality (Gini) 0.0224*** 0.0239*** 0.0214*** 0.0239*** 0.0242*** 0.0225*** 0.0255*** 0.0255***
 (0.0025) (0.0022) (0.0022) (0.0024) (0.0026) (0.0025) (0.0024) (0.0024)
Vulnerable Employment 0.0002 0.0004 0.0011 0.0002 0.0002 0.0003 0.0006 0.0006
 (0.0008) (0.0009) (0.0007) (0.0008) (0.0008) (0.0008) (0.0008) (0.0008)
Government Expenditure -0.0029*** -0.0025** -0.0031*** -0.0027** -0.0021** -0.0026** -0.0066** -0.0020*
 (0.0011) (0.0011) (0.0007) (0.0011) (0.0010) (0.0011) (0.0026) (0.0010)
Financial Deepening -0.0016 -0.0016 -0.0220*** -0.0006 -0.0042* -0.0012 -0.0030 -0.0055
 (0.0023) (0.0025) (0.0045) (0.0024) (0.0024) (0.0024) (0.0025) (0.0038)
GDP per capita 0.0012 0.0013 0.0033** 0.0005 0.0010 0.0012 0.0003 0.0003
 (0.0017) (0.0018) (0.0015) (0.0017) (0.0017) (0.0018) (0.0017) (0.0017)
Education 0.0158*** 0.0088** 0.0198** 0.0169*** 0.0136*** 0.0180*** 0.0151*** 0.0151***
 (0.0048) (0.0039) (0.0078) (0.0049) (0.0050) (0.0053) (0.0051) (0.0051)
Trade Openness 0.0024**
 (0.0010)
Tariff 0.0028
 (0.0051)
Kof. Overall Globalisation 0.0082***
 (0.0025)
Kof. Economic Globalisation -0.0092* -0.0085* -0.0085*
 (0.0052) (0.0051) (0.0051)
Kof. Social Globalisation 0.0080**
 (0.0033)
Kof. Economic Glob. × Gov. -0.0086***
 (0.0026)
Kof. Economic Glob. × Fin. -0.0086***
 (0.0026)
Constant 2.5628*** 2.5182*** 2.2780*** 2.3970*** 2.6527*** 2.4165*** 2.4750*** 2.4750***
 (0.0778) (0.0739) (0.0694) (0.0840) (0.1287) (0.0801) (0.1228) (0.1228)
Observations 267 267 267 267 267 267 267 267
Countries 11 11 11 11 11 11 11 11
Instruments 8 8 5 8 8 8 8 8
Wald Statistic 3.028e+06 2.706e+06 2.655e+06 3.012e+06 2.942e+06 2.891e+06 2.952e+06 2.952e+06
 Wald P-Value 0.000 0.000 0.000 0.000 0.000 0.000 0.000 0.000
Net-effect – – – – – – 0.039 0.038
Joint Significance Test Statistic – – – – – – 10.9 10.9
 P-Value – – – – – – 0.010 0.010
Sargan P-Value 0.522 0.112 0.652 0.702 0.218 0.780 0.336 0.336
AR(1) 0.000 0.000 0.000 0.000 0.000 0.000 0.000 0.000
AR(2) 0.935 0.774 0.644 0.747 0.991 0.966 0.693 0.693
 Note: Standard errors in parentheses; *** p
Kof. Economic Glob. × Fin. is interaction term for financial deepening and economic globalisation Kof. Economic Glob. × Gov. is interaction term for government expenditure and economic globalisation Albeit not statistically significant, tariff is positive, which is in line with renewed calls for MENA’s integration into the global market. In respective terms also, we find empirical evidence at 5 per cent and 1 per cent levels of significance that both trade openness and overall globalisation induce income inequality in the study area (see Columns 2 and 4 respectively). Our result on trade openness deepens the argument that trade can lead to the eventual preference for labour-saving technologies in response to heightened competition and thus hindering inclusive growth (Wu and Hsu 2012). But in relation to our result on economic globalisation, the result perhaps is due to the shallow definition of trade openness. Our results in Column 5 show that economic globalisation reduces income inequality in the MENA by a modest 0.009 per cent. This finding partly underscores our argument on how economic globalisation can be handled from the policy front to foster equality in opportunities, income and wealth. The implication of this result goes beyond the traditional call for tariff reduction. Instead, it shows that there are three things at play with respect to income inequality reduction in the MENA through economic integration that it should come with (a) the elimination of trade barriers to breed competition and spur innovation, (b) attracting FDI not only into the much dependent oil-sector to boost productivity and trigger higher demand for labour19, and (c) ensuring integration into the global economy. With porous economic outlook, tariff still high, and trade within the region largely mechanized20, the result on economic integration signifies the need for a paradigm shift in economic integration in MENA, which we suggest next. Though we recognize that governments need to spend to lessen the impact of the pandemic in the immediate term IMF (2020a), the concern is the medium to long-term welfare of the masses in the region. The empirical evidence on the pathway effect as we provide in Column 7 signifies that, going forward, government expenditure can be a gamechanger for the region in reducing income inequality. There is a 5 per cent level of significance that increasing government expenditure in line with economic globalisation has a net income inequality reducing effect of 0.039 per cent. Similarly, we show that channelling resources in the form of credit to support the private sector in line with economic globalisation considerations has the potency of reducing income inequality by 0.038 per cent. Two critical implications emanate from our pathway findings. First, policymakers interested in the MENA agenda can participate effectively in their economies by way of building conducive environment in the form of reconstruction expenditure, research and development, and fairer institutions for the private sector to thrive. This can breed competition, trigger FDI inflow and above all improve private-sector efficiency. Second, through the elimination of financial repression, and reduction in the cost of borrowing, 19 The SSA is one of the regions with huge potential for trade gains – in terms of raw materials, youthful manpower and market area. 20 According to the World Bank (2020a), the MENA, and Europe and Central Asia are the two most commodity dependent regions of the world. 15
greater financial deepening can also help the region diversify from the
‘crisis-susceptible’ oil sector. We argue that such resource allocations can aid the region
utilise the fertile grounds provided by the AfCFTA and EUCU to provide shared
opportunities. Also, we find that social globalisation induces income inequality by a
modest 0.008 per cent in the MENA. The result is an empirical evidence for the
assertion that changing norms due to enhanced social and global interaction through
ICT can fuel income inequality as trade unions become less effective (see, Atkinson
1997).
 We shift focus to our ancillary findings, where we show evidence at 1 per cent
level of significance that the lag of income inequality induces current inequality levels
by 0.02 per cent irrespective of the model specification. Likewise, we find that
irrespective of the model specification, education increases income inequality by at
least 0.008 per cent (see Column 2). The results point to the power of differences in
skillset in driving income inequality in MENA. This signifies the need for a flexible
educational system where training and skillset development at the lower and middle
tiers of work are also given attention. Our results further suggest that improvement in
human capital widens income inequality in the MENA. The result indicates that without
efficient fiscal redistribution, return on education, good health and nutrition for a
subset of the population can fuel income inequality in the MENA. If this is not pursued, it
can result in incomes of the skilled and educated workforce growing sharply relative to
that of the uneducated and unskilled labour who can be forced to work below the
average wage rate (World Economic Forum 2016).

4.5 Robustness check for income inequality results
We check the robustness of our estimates using the Palma ratio as an alternative
income inequality measure (see results in Table 4). We find similar results for trade
openness, economic globalisation, and overall globalisation.

 16
Table 4: Dynamic System GMM results on Effects of Globalisation and Resource Allocation on
 Income Inequality in MENA (Dependent variable: Palma Ratio)
Variable (1) (2) (3) (4) (5) (6) (7) (8)
Lag of Inequality (Palma ratio) 0.1245*** 0.2121*** 0.2321*** 0.1100*** 0.1265*** 0.1226*** 0.1207*** 0.1617***
 (0.0158) (0.0209) (0.0174) (0.0185) (0.0189) (0.0177) (0.0203) (0.0164)
Vulnerable Employment 0.0204*** 0.0144* 0.0078 0.0218*** 0.0182*** 0.0226*** 0.0179*** 0.0094**
 (0.0039) (0.0079) (0.0072) (0.0044) (0.0045) (0.0045) (0.0046) (0.0039)
Government Expenditure -0.0170*** -0.0125** -0.0028 -0.0157*** -0.0135*** -0.0151*** -0.0847*** -0.0078**
 (0.0034) (0.0063) (0.0049) (0.0038) (0.0038) (0.0038) (0.0187) (0.0039)
Financial Deepening -0.0557*** -0.0356* -0.0153 -0.0493*** -0.0259** -0.0637*** -0.0163 -0.0493**
 (0.0114) (0.0213) (0.0254) (0.0122) (0.0117) (0.0129) (0.0122) (0.0211)
GDP per capita 0.0389*** 0.0364*** -0.0004 0.0467*** 0.0380*** 0.0366*** 0.0441*** 0.0377***
 (0.0074) (0.0139) (0.0115) (0.0088) (0.0087) (0.0083) (0.0098) (0.0094)
Education 0.3103*** 0.0440* -0.0782** 0.3015*** 0.3103*** 0.3278*** 0.2927*** 0.2437***
 (0.0264) (0.0256) (0.0373) (0.0273) (0.0319) (0.0299) (0.0307) (0.0270)
Trade Openness 0.0782***
 (0.0158)
Tariff 0.1079**
 (0.0519)
Kof. Overall Globalisation 0.0834***
 (0.0163)
Kof. Economic Globalisation -0.1447*** -0.1485*** -0.1752***
 (0.0263) (0.0280) (0.0392)
Kof. Social Globalisation 0.0777***
 (0.0124)
Kof. Economic Glob. × Gov. -0.0731***
 (0.0178)
Kof. Economic Glob. × Fin. -0.0456***
 (0.0156)
Constant -2.1700*** -3.0968*** -0.9025 -0.7024 -0.0624 -3.4294*** 1.2378 0.9248
 (0.2467) (0.4259) (0.5591) (0.4453) (0.5538) (0.3334) (0.7912) (0.8887)
Observations 267 267 267 267 267 267 267 267
Countries 11 11 11 11 11 11 11 11
Instruments 10 10 7 10 10 10 10 10
Wald Statistic 59281 20983 30746 45643 42886 47677 36640 38777
 Wald P-Value 0.000 0.000 0.000 0.000 0.000 0.000 0.000 0.000
Net-effect – – – – – – -0.36 -0.21
Joint Significance Test Statistic – – – – – – 8.49 16.95
 P-Value – – – – – – 0.003 0.000
Sargan P-Value 0.310 0.630 0.117 0.626 0.860 0.600 0.205 0.366
AR(1) 0.000 0.000 0.000 0.000 0.000 0.000 0.000 0.000
AR(2) 0.127 0.170 0.525 0.107 0.476 0.365 0.652 0.756
 Note: Standard errors in parentheses; *** p
More revealing is our result for economic growth proxied by GDP per capita, which
 denotes a case of non-inclusive growth in the region. Also of prime concern is the result
 for vulnerable employment which shows an income inequality-inducing effect of at least
 0.01 per cent (Column 7, Table 4). With the social protection expenditure challenged 21
 and ILO (2020b) projecting a rise in vulnerable employment due to current health and
 economic crisis, this finding supports our call for a new approach. The seriousness of our
 finding on vulnerable employment is seen in how the geopolitically fragile region can
 slip up if productive allocation is not pursued rigorously.

 4.6 Effects of globalisation and resource allocation on poverty in MENA
 In this section, we focus on the system GMM results on the effect of globalisation and
 resource allocation on poverty (see Table 5). It is worth noting that the results from our
 pooled least square estimator as well as fixed effect and random effect estimators are
 reported in Tables SM2 and SM3 respectively as supplementary results.

 Table 5: Dynamic System GMM Results on the Effect of Globalisation and Resource Allocation on
 Poverty in MENA (Dependent Variable: Poverty Gap US$1.90)
Variables (1) (2) (3) (4) (5) (6) (7) (8)
Lag of Poverty Gap ($1.90) 1.9013*** 2.1503*** 1.9271*** 1.8558*** 1.9001*** 2.4978*** 1.8610*** 1.8610***
 (0.1450) (0.3127) (0.1485) (0.1416) (0.1464) (0.1729) (0.1428) (0.1428)
Inequality (Palma ratio) 0.0993*** 0.2030*** 0.1373*** 0.1014*** 0.0961*** 0.0642*** 0.0986*** 0.0986***
 (0.0150) (0.0750) (0.0173) (0.0149) (0.0152) (0.0169) (0.0151) (0.0151)
Vulnerable Employment -0.0668*** -0.3187*** -0.0734*** -0.0518** -0.0559*** -0.0689*** -0.0547*** -0.0547***
 (0.0234) (0.0610) (0.0217) (0.0208) (0.0210) (0.0233) (0.0211) (0.0211)
Government expenditure -0.0531* -0.0161 -0.0678** -0.0515 -0.0610* -0.0996*** -0.0708 -0.0574*
 (0.0320) (0.0472) (0.0330) (0.0319) (0.0324) (0.0356) (0.0982) (0.0324)
Financial Deepening -0.3119*** -0.2631 -0.2774** -0.3376*** -0.2868** -0.1697 -0.3003** -0.3138*
 (0.1187) (0.2860) (0.1224) (0.1232) (0.1210) (0.1343) (0.1257) (0.1796)
GDP per capita -0.0216 -0.0588 -0.0162 -0.0247 -0.0235 -0.0056 -0.0257 -0.0257
 (0.0207) (0.0539) (0.0213) (0.0208) (0.0209) (0.0231) (0.0210) (0.0210)
Tariff 0.2265
 (0.5461)
Trade Openness -0.1267***
 (0.0231)
Kof Overall Globalisation 0.0166
 (0.0956)
Kof Economic Globalisation -0.2434* -0.2438* -0.2438*
 (0.1274) (0.1268) (0.1268)
Kof Social Globalisation -0.1023
 (0.1210)
Kof Economic Glob. × Gov. -0.0134
 (0.0966)
Kof Economic Glob. × Fin. -0.0134
 (0.0966)
Constant 8.1642*** 8.0941 9.5174*** 8.0435*** 12.0090*** 8.6838*** 11.9064*** 11.9064***
 (1.9722) (5.2361) (2.0539) (2.3066) (2.8279) (2.7280) (3.0816) (3.0816)
Observations 267 94 267 267 267 267 267 267
Countries 11 11 11 11 11 11 11 11
Instruments 10 7 10 10 10 10 10 10
Wald Statistic 4666 1352 4358 4750 4735 4230 4759 4759
 Wald P-Value 0.000 0.000 0.000 0.000 0.000 0.000 0.000 0.000
Net-effect – – – – – – – –
Joint Significance Test Statistic – – – – – – – –
 P-Value – – – – – – – –
Sargan P-Value 0.231 0.311 0.637 0.227 0.209 0.644 0.201 0.201

 21 The much dependent oil sector of the region for social protection is floundering,

 18
AR(1) 0.000 0.018 0.000 0.000 0.000 0.000 0.000 0.000
AR(2) 0.825 0.324 0.862 0.823 0.732 0.865 0.738 0.738
 Standard errors in parentheses; *** p
Bergstrom 2020; Lakner et al. 2020). Further, irrespective of the poverty model we specify, we find a strong empirical evidence that previous year’s level of poverty induces current incidence and depth of poverty in MENA by a remarkable 1.8 per cent (Column 8). 4.7 Robustness check for poverty gap US$1.90 results Per the income classification of the economies we analyse, we test the robustness of our results using the poverty gap of US$3.20 (see Table 6). We find similar results highlights being the poverty-reducing effects of our interaction terms for globalisation and resource allocation, and the trade flow indicators. Table 6: Dynamic System GMM Results on Effect of Globalisation and Resource Allocation on Poverty In MENA (Dependent Variable: Poverty Gap US$3.20) Variables (1) (2) (3) (4) (5) (6) (7) (8) Lag of Poverty Gap ($3.20) 0.9842*** 3.5214*** 2.9234*** 2.8841*** 2.9794*** 2.9512*** 2.9260*** 2.9260*** (0.0603) (0.5291) (0.1535) (0.1889) (0.1639) (0.1911) (0.1680) (0.1680) Inequality (Palma ratio) 0.0129 0.1565*** 0.0707*** 0.6112** 0.3264*** 0.8096** 0.3818*** 0.3818*** (0.0181) (0.0547) (0.0163) (0.2696) (0.0991) (0.3290) (0.1164) (0.1164) Vulnerable Employment 0.0066 0.2455*** 0.0519** 0.1206* 0.0531 0.1874** 0.0574 0.0574 (0.0228) (0.0620) (0.0217) (0.0704) (0.0329) (0.0912) (0.0350) (0.0350) Government Expenditure -0.1053*** -0.0451 -0.0002 -0.0677 -0.0327 -0.1046* -0.4028*** -0.0309 (0.0344) (0.0570) (0.0332) (0.0476) (0.0358) (0.0560) (0.1518) (0.0374) Financial Deepening -0.0011 -0.1360 -0.0662 -0.4336** -0.2423** -0.6975*** -0.1908* -0.1812 (0.0958) (0.2642) (0.0891) (0.1825) (0.1111) (0.2629) (0.1128) (0.1775) GDP per capita -0.0271 -0.0338 -0.0351 -0.1462 -0.0400 -0.1379 -0.0814 -0.0814 (0.0813) (0.1530) (0.0757) (0.1164) (0.0825) (0.1135) (0.0892) (0.0892) Tariff 0.4247 (0.4933) Trade Openness -0.0615*** (0.0231) Kof Overall Globalisation -0.5899** (0.2685) Kof Economic Globalisation -0.5645*** -0.6198*** -0.6198*** (0.1792) (0.1951) (0.1951) Kof Social Globalisation -0.0846 (0.1438) Kof Economic Glob. × Gov. -0.3719** (0.1456) Kof Economic Glob. × Fin. -0.3719** (0.1456) Constant -2.8611 -1.5240 3.6114* 22.0899*** 17.7602*** 19.1662*** 24.3902*** 24.3902*** (2.1497) (4.9169) (2.0621) (8.4374) (4.5554) (7.0222) (6.2675) (6.2675) Observations 266 266 266 266 266 266 266 266 Countries 11 11 11 11 11 11 11 11 Instruments 10 7 10 10 10 10 10 10 Wald Statistic 2226 599.4 2646 1591 2086 1515 1912 1912 Wald P-Value 0.000 0.000 0.000 0.000 0.000 0.000 0.000 0.000 Net-effect – – – – – – 1.02 1.61 Joint Significance Test Statistic – – – – – – 6.53 6.53 P-Value – – – – – – 0.011 0.011 Sargan P-Value 0.910 0.998 0.227 0.375 0.832 0.508 0.155 0.155 AR(1) 0.000 0.051 0.000 0.000 0.000 0.000 0.000 0.000 AR(2) 0.929 0.665 0.887 0.744 0.748 0.955 0.576 0.576 Note: Standard errors in parentheses; *** p
Kof. Economic Glob. × Fin. is interaction term for financial deepening and economic globalisation Kof. Economic Glob. × Gov. is interaction term for government expenditure and economic globalisation Our result show that trade openness is probably a shallow measure of globalisation evidenced by its smaller effect (0.06%) as compared to overall globalisation (0.58%) and economic globalisation (0.56%). Finally, the net effects of the interaction terms for government expenditure and economic globalisation on the one hand, and financial deepening and economic globalisation on the other hand, have poverty-reducing magnitudes of 1.02 and 1.61, respectively. The appropriateness of our system GMM estimates is evident in the AR(2) statistics showing the absence of second-order serial correlation in the residuals, and the Sargan P-value providing evidence of the validity of our instrument. 5.0 Conclusion and policy recommendations In this study, we go beyond the array of subjective recommendations on how policymakers can (re)build an all-inclusive and prosperous economies post COVID-19. Using 11 countries22 on grounds of porous economic prospects, data availability, and empirical prudence, we test three hypotheses first, whether economic globalisation reduces poverty and income inequality in the MENA; second, whether social globalisation fuels income inequality and poverty; and third, whether higher poverty- and income inequality-reducing effects of globalisation occurs in the presence of efficient resource allocation. We provide evidence robust to several specifications from the pooled least square, fixed effect, random effect and system GMM estimation techniques to show that: (1) reducing tariff is consistent with renewed call for MENA’s integration into the global economy; (2) economic globalisation reduces both inequality-and poverty; and (3) social globalisation induces income inequality. Also revealing is our remarkable result on the modulating role of globalisation on the effect of resource allocation for poverty alleviation and income equality. With growing economic uncertainties surrounding the hydrocarbon sector, revenue generation, and FDI amid the geopolitical frailty of the region, our results provide cautious optimism. Particularly, resource allocation in the form of government expenditure and financial deepening reduces income inequality and poverty even the more if channelled in line with economic globalisation. Though we do not find such a significant pathway effect for poverty gap (US$1.90), the signs are as expected a priori. Our results suggest that, improved competition and integrated interventions are more likely to succeed than secluded, monolithic interventions. Per our findings on vulnerable employment and the economic outlook of the region, we project a rise in income inequality and poverty in the MENA post COVID-19. This is more so as labour supply is likely to rise as laid off workers seek to find jobs. However, its persistence and 22 Algeria, Djibouti, Egypt, Morocco, Tunisia, Syria, Turkey, Yemen, West Bank, Iran and Iraq. 21
impact can be lessened by the swiftness with which policymakers allocate resources in
the region. Additionally, income inequality is likely to rise in MENA post COVID-19 due
to the rise in social globalisation of the region, which may cause labour unions to lose
bargaining power.
 The pandemic has indeed amplified the power of social globalisation and as such
calls for measures that incentivize the private sector to take advantage of this
youth-friendly wave into real business opportunities. Going forward, losing sight on
social globalisation is likely to cost policymakers in the fight against poverty and income
inequality as interest in technical and vocational training/education is likely to be
affected. Further, the remarkable effects of income inequality on poverty means that
gains through globalisation can be hampered by the depth of poverty. In this situation,
though resource allocation in the form of enhanced financial deepening is imperative
for private-business revitalization, and the possible rippling effects in employment,
policymakers should also not lose sight on social protection.
 We provide recommendations in line with the region’s weak economic
prospects, geopolitical fragility, and globalisation. First, in fostering shared prosperity,
policymakers are to invest strategically in building a sound investor climate while
boosting the manufacturing capacities of their economies to improve global value chain
participation. With FDI on the decline in the region, state support for private sector is
not only imperative for boosting growth but also presents policymakers with a greater
opportunity of addressing labour force polarization. This is worthwhile for building a
diversified MENA, which does not only run on the performance of the oil sector.
 Second, crucial to addressing both poverty and inequality is the relevance of
greater financial deepening, which can address the possibility of labour settling for
precarious employment post COVID-19. Indeed, rising social tensions, fuelled partly by
unemployment resulted in the region’s hard times in 2010 and 2011 (the Arab spring),
which, in itself, underscores the relevance of our pathway effect of globalisation and
resource allocation. Last, policymakers can at least reduce precarious employment and
poverty in the MENA by mapping out strategies integrating ICT (a major social
globalisation facilitator) and innovation skills into technical programmes. This is
needed to respond to the growing demand for ICT products and services, and at the
same time ensure smooth and faster adaptation to innovation to take advantage of
economic globalisation. We do not explore the poverty and income inequality effects of
financial globalisation in this work. We reckon that financial integration is likely to
intensify in line with enhanced globalisation and this may be worth exploring in the
future.

The authors declare that no funding was received for this research.

 22
You can also read