WORLD CITIES RISK 2015-2025 - Cambridge Centre for Risk Studies Cambridge Risk Atlas
←
→
Page content transcription
If your browser does not render page correctly, please read the page content below

Cambridge Centre for Risk Studies
Cambridge Risk Atlas
Part I: Overview and Results

WORLD CITIES
RISK 2015-2025
Cambridge Centre for Risk Studies
University of Cambridge Judge Business School
Trumpington Street
Cambridge, CB2 1AG
United Kingdom
enquiries.risk@jbs.cam.ac.uk
http://www.risk.jbs.cam.ac.uk/

September 2015

The Cambridge Centre for Risk Studies acknowledges the
generous support provided for this research by:

The views contained in this report are entirely those of the research team of the Cambridge
Centre for Risk Studies, and do not imply any endorsement of these views by the organisations
supporting the research.
World City Risk 2025 - Part I: Overview and Results

                  Part I: Overview and Results

       World Cities Risk 2015-2025

Contents
1   Executive Summary                                                        4
2   Overview                                                                 6
3 Risk Atlas                                                                8
4   Results                                                                  9
5   Validation                                                             16
6   Sensitivity studies                                                    18
7   Conclusions                                                            22
8   References                                                             23

                                                                                     3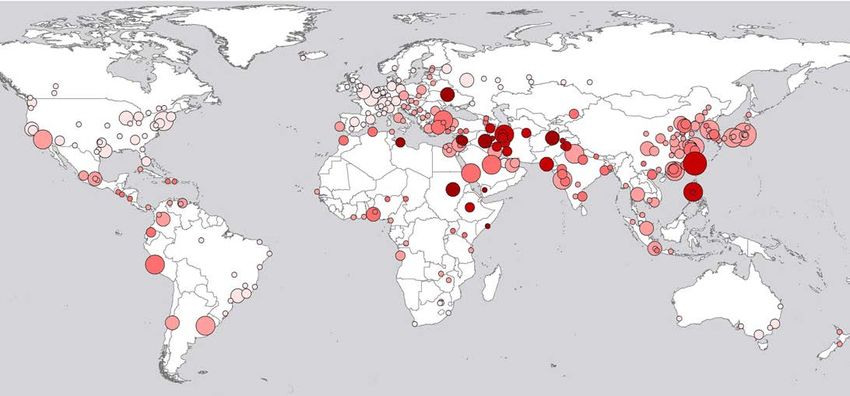
Cambridge Centre for Risk Studies

                               World City Risk 2015
                                       Part I: Overview and Results

    1 Executive Summary
A comprehensive approach to the assessment of                  Framing each threat
catastrophe damage on World Cities
                                                               This report is based on the historical record and
This World City Risk report presents the first analysis        attendant scientific models of 23 different threats
that assesses the combined damage inflicted on                 or perils. The past occurrence of catastrophic
global cities by a comprehensive set of significant            events is used as a guide to future incidents. Each
and recurrent threats. We consider some 23 threats             threat is framed via three characteristic scenarios
in five broad threat classes: Natural Catastrophe &            which vary in magnitude from moderate to very
Climate, including threats such as earthquake and              severe. The geography of risk from different threats
windstorms; Financial, Trade & Business including              is illustrated in our Risk Atlas, which provides a
threats such as market crashes, and commodity price            world map corresponding to each threat, indicating
shocks; Politics, Crime & Security, including political        the proximity of cities to threats, or the contours of
instability, conflicts and terrorism; Technology               magnitudes posed by each threat.
& Space, e.g. cyber catastrophe; and Health &
Environment, e.g. pandemics and famines.                       Characterising cities
                                                               Cities, due to their different locations, may have a
300 World Cities
                                                               different likelihood of being exposed to any of the
Our key output is a ranking of 300 World Cities by their       three characteristic scenarios for a given threat type.
propensity to experience harm. These cities are selected       Each city can also be characterized by its economic
for their economic and geographical significance; they         mix, population over time, quality of construction or
account for around 50% of global GDP today and an              the vulnerability of its physical assets, and an index of
estimated two-thirds of global GDP by 2025. This report        economic resilience, constructed from several factors
proposes a unifying metric of loss, GDP@Risk, that             such as social cohesion, governance capability, value
measures the average loss anticipated over a decade            of capital infrastructure, etc. These city characteristics
from threats across the five threat classes.                   determine the impact, namely value of economic loss,
                                                               of any of the characteristic scenarios. The average loss
Are Taipei and Tokyo the world’s riskiest cities?              combines the chance of exposure to a threat scenario
Taipei and Tokyo form the top tier of cities with respect      over one decade, with the level of economic damage
to GPD@Risk, with tier 2 comprising of Istanbul,               inflicted by that scenario. GDP@Risk is the sum total
Manila, Seoul and Tehran. The tier 3 cities are Bombay,        of losses experienced by all 300 World Cities over all
Buenos Aries, Delhi, Hong Kong, Lima, Los Angeles,             threats and characteristic threat scenarios.
New York and Osaka. The remaining 35 of the 50
                                                               Loss makers topped by Financial Crisis, Human
riskiest World Cities are split into: tier 4, some 25 cities
                                                               Pandemic and Natural Catastrophes
topped by Sao Paolo and including Beijing, Chicago,
Jakarta, Karachi, London, Mexico City, Moscow, Paris           The top six threats with respect to their total GDP
and Riyadh; and tier 5: 10 final cities including Cairo,       damage across the 300 World Cities are Financial
Calcutta, Kiev, Lagos and Santiago.                            Crisis, Interstate War and Human Pandemic,
                                                               closely followed by the Natural Catastrophe triad
Taipei, Tokyo, Istanbul, Osaka exemplify high
                                                               of Windstorm, Earthquake and Flood. About a fifth
economic value cities with high exposure to natural
                                                               of GDP@Risk is due to Financial Crisis alone, while
catastrophes, interstate war and also market crashes
                                                               these six perils together generate more than 60% of
and oil price shocks. A similar description applies
                                                               GDP@Risk. Cyber, Separatism, Oil Price Shock and
to Los Angeles and New York, but with cyber threats
                                                               Sovereign Default round out the top 10 threats which,
instead of war; and also to Hong Kong and Shanghai
                                                               combined, are to blame for around 90% of GDP@Risk.
where risk is augmented significantly by the threat
of human pandemic. War, separatism and terrorism               For comparison, we have compiled the cumulative
pose a third or more of the risk faced by the cities of        direct losses inflicted by several thousand catastrophe
Bombay, Buenos Aries, Seoul and Tehran.                        events since 1900. The results demonstrate that

4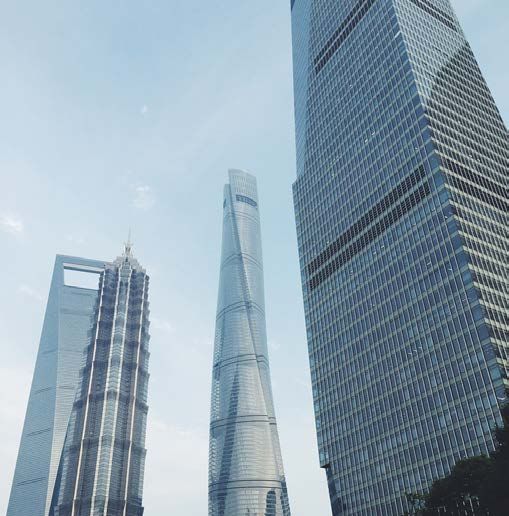
World City Risk 2025 - Part I: Overview and Results

 Taipei, Taiwan                                             Tokyo, Japan

our model produces relativities of risk of economic        institutions and stronger infrastructure, the burden
output loss between threats that are consistent with       of disaster on economic growth were reduced. This is
the direct losses between threats in the past. With        discussed further below.
respect to Natural Catastrophes in particular, our
                                                           The process for GDP@Risk is not statistical; it is
study concurs with Swiss Re’s city vulnerability
                                                           estimated without providing a confidence interval
analysis from 2013.
                                                           around the figure of $5.4 trillion. We can test this
Future risk for World Cities                               value by asking how sensitive it is to changes in
                                                           the characteristic scenarios which describe each
Our analysis identifies three important trends in the      threat. Taking climate change as a possible driver of
global risk landscape that we refer to as ‘future risk’.   uncertainty in our analysis, we consider the possibility
The first is that emerging economies will shoulder         that the frequency of Wind Storm, Flood, Drought,
an increasing proportion of GDP@Risk as a result           Freeze and Heatwave is 10% greater than in our base
of accelerating economic growth, which itself results      models, and the corresponding event severities are
from population growth. The second trend is the            5% higher. The effect is to increase GDP@Risk by 5%.
growing prominence of man-made threats. Finally,
we see a heavy contribution, representing more             The modelling process also allows us to ask what
than a third of GDP@Risk, of threat types which are        value might be gained globally by a hypothetical
rapidly developing, like Cyber events, and therefore       improvement in physical vulnerability or economic
can be viewed as emerging risks.                           resilience of all World Cities. Indeed, about half
                                                           of GDP@Risk can be recovered, in principle, by
Catastrophes losses place a burden of 1.5% on              improving these aspects of all cities.
global GDP
                                                           Irrespective of the precise values of GDP@Risk, the
The analysis suggests that the expected loss across        ranking of cities by GDP@Risk is quite stable. It is
all threat classes amounts to $5.4 trillion for the 300    relatively little affected by sensitivity tests of the
World Cities from 2015 to 2025. The baseline is the        various threats.
forecast total GDP output of these cities over the
same period: some $370 trillion. The expected loss         Conclusion
from catastrophes, therefore, is 1.5% of total GDP         Our analysis of a comprehensive set of threats
output. Economists project that the world’s economy        applied to the 300 World Cities is a first in global
will average 3.2% growth for the next decade. Our          risk analysis. The economic metric of GDP@Risk
estimation of expected catastrophe loss amounts to         provides comparability of cities across all threats and
about half of the expected global growth rate. This        delivers a risk ranking that shows the importance of
analysis suggests that catastrophes put a burden of        systemic events, like Human Pandemics, and man-
1.5% on the world’s economic output. If catastrophe        made catastrophes, such as Financial Crises, beyond
losses were made obsolete, economic growth would           the traditional purview of natural disasters. It is also
be significantly higher.                                   suggestive of where investment can make a large
                                                           impact in risk reduction. Recognizing risk, mapping
Mitigation gains could be substantial
                                                           it out and measuring it consistently are the keys to
Mitigation of catastrophe losses is an investment          managing it in both the long and the short term. This
that could potentially yield an enormous benefit           study is a significant step in that direction.
in perpetuity if, by investing in more resilient

                                                                                                                 5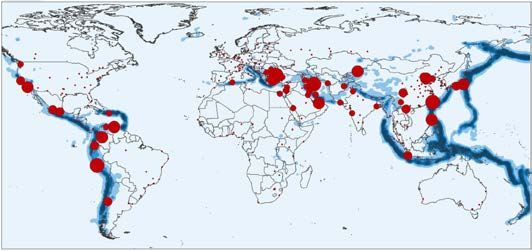
Cambridge Centre for Risk Studies

    2 Overview
                                                                              500
This project provides an analysis of the impact of
crises on economic output from the world’s 300                                450

most major cities. It is the first known quantitative
                                                                              400
study of a comprehensive range of threats on cities
and how much impact they may have. It provides a

                                                                  GDP ($Bn)
                                                                              350                            GDP@Risk
common benchmark of risk to allow different cities
to be ranked and for the influence of each threat to                          300
                                                                                                                        • GDP in 2018 is expected to be             $377 Bn

be compared.                                                                                                            •
                                                                                                                        •
                                                                                                                        •
                                                                                                                          The earthquake causes this to drop to
                                                                                                                          a loss of
                                                                                                                          Takes 4 years to recover
                                                                                                                                                                    $273 Bn
                                                                                                                                                                    $104 Bn of output

                                                                              250                                       • Total lost output =                       $194 Bn

Previous studies have tended to analyze individual                                                                      • Over 10 years, 1 Jan 2015 to 1 Jan 2025,
                                                                                                                          Taipei GDP is expected to be            $4,005 Bn
                                                                                                                        • This event would cost 4.4% of Taipei’s 10 year GDP

threats or to focus on natural hazards, such as                               200
                                                                                 2012 2013 2014 2015 2016 2017 2018 2019 2020 2021 2022 2023 2024 2025
earthquake, wind storm, and flood.1 Natural hazards
are destructive and spectacular shocks that pose a                            Figure 1:  Illustration of methodology employed in
significant threat to certain parts of the globe, but                         this study. A characteristic scenario of an earthquake
                                                                              (Scenario EQ2) impacts Taipei in 2017, taking several
they are not the only threats to the ongoing welfare of                       years to recover. The lost GDP, relative to its projection is
the world’s cities. Our analysis suggests that natural                        measured as GDP@Risk
hazards account for less than a third of the causes of
economic disruption that could be expected in the                             This provides a risk metric – GDP@Risk – which
world’s leading cities. A comprehensive review of                             is the probability-weighted loss (expected loss) of
all the threats which could potentially cause damage                          economic output that could be expected from these
and disruption to social and economic systems has                             crises over the next ten years. GDP@Risk is a metric
identified five primary classes of threats, and around                        that can be used across very different types of threats
55 individual threat types.2 This taxonomy of threats                         as a method of comparison, and in a way that avoids
demonstrates that we live in a world where crises can,                        other metrics of loss, such as number of deaths
and do, occur from a wide range of potential causes,                          or repair costs of damaged property, which skew
many of them unexpected. Good and informed                                    the results towards the most deadly or physically
preparation for the wide range of different types of                          destructive threats. Here, we are concerned with all
potential crisis is a key requisite for effective risk                        threats that can disrupt our economic well-being.
management. This report provides a guide to the risk                          This is the metric that affects how global businesses
of economic disruption to the world economy from                              view the world. The disruption to markets and
all the major causes of global threat.                                        production that these catastrophes cause reflects
Some catastrophes undoubtedly generate growth                                 the revenue losses, supply chain interruptions, and
in the process of recovery and can be net positives                           operational risks that an international corporation
for some societies and in certain situations. These                           will face in doing business in these locations over the
recoveries attract capital from elsewhere and use it                          next decade.
more efficiently than it might have been otherwise, to                        The risk analysis of this wide range of threats is not
boost economic output beyond the level that it would                          a prediction, and does not expect that these specific
have achieved if the catastrophe had not occurred. In                         losses will occur. We are considering extreme events
general however, most catastrophes leave a city or                            with low likelihoods, long “return periods” and a
region, and the global economy, worse off than if they                        high degree of unpredictability and uncertainty as
had not occurred.                                                             to where and when they will occur. These proposed
In this study we have taken a wide range of threats                           crises are all extremely unlikely to take place in this
and standardized an approach to assessing the                                 ten year timeframe for any one of the cities on our
impact that each would have on a particular city,                             list. But some of the cities will be unlucky and crises
and produced a common process for assessing the                               will affect them.
likelihood of these shocks occurring.                                         Crises of these types continue to materialize
                                                                              throughout the world and the rate at which they have
1
    For example Swiss Re, 2013, Mind the Risk: A global ranking               occurred in the past is a guide to how often they might
of cities under threat from natural disasters.                                occur in the future. The effects such crises will have
2
                                                                              today and which locations they hit hardest, however,
    Cambridge Centre for Risk Studies, 2014, A Taxonomy of                    could be vary greatly from events in the past.
Threats for Complex Risk Management.

6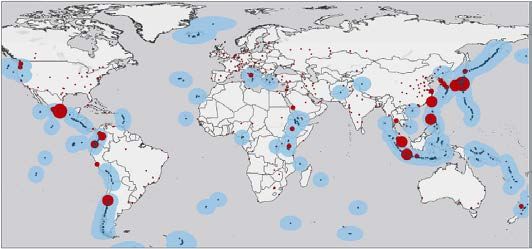
World City Risk 2025 - Part I: Overview and Results
The geopolitical risks that a city faces are the result
of government policies, social and demographic
pressures, and historical enmities that are
documented and are studied in detail by political
scientists.
This study has collated these individual areas of
expertise into a standardized structure of analysis.
Twenty-three individual threats have been studied
and the available science on each one has been
assembled into a threat model. Each threat model
includes a definition of three characteristic scenarios
of different severities (a moderately severe, severe,
and very severe scenario) which illustrate the range
of potential catastrophic impacts that a specific
threat could wreak on a city. Then, for each city, we
estimate the annual probability of a characteristic
scenario based on how often events have occurred in
the past, hazard maps produced by the subject matter
specialists, and other threat assessment studies. The
analysis then considers, if that scenario occurred,
how the city would be affected and how much the
city’s economic output would be reduced by that
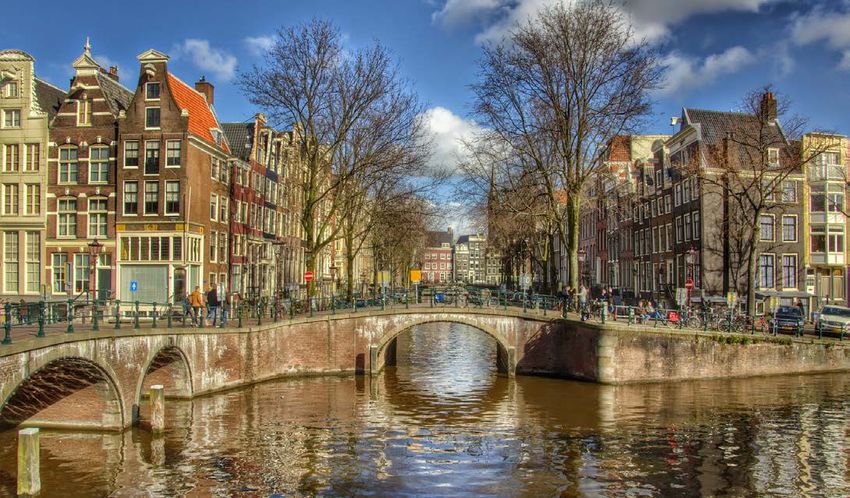
Port au Prince, Haiti, after the 2010 earthquake scenario’s occurrence. The risk of that loss is the
(Credit: Marco Dormino, UN)
probability multiplied by the loss – the risk of a one in
1000 annual probability of a scenario that generates
Catastrophes like those used in this analysis are rare a billion dollar loss is, therefore, an “expected loss”
and surprising when they occur. The unpredictability of of one million dollars. We express all these expected
crises and the long intervals between them means that loss values as GDP@Risk.
societies are often unprepared for their appearance and
These risks are calculated for each characteristic
consequences. If a particular disaster has not befallen a
scenario, for each threat, and for each city. The
city in living memory, it is natural for the occupants of
expected GDP loss values are calculated for the ten
that city to fail to anticipate it happening in the future.
year period of 1 January 2015 to 1 January 2025. These
Human nature tends to discount rare occurrences from
are compared with the total GDP that is projected for
our risk perception. However, painstaking scientific
that city for the same ten year period. GDP@Risk is
studies of the time and place these crises occur have
expressed as total value of loss, usually in billions of
built up a picture of the geography of these threats and
$US, and also as a percentage of the total projected
the frequency and severity of their appearance. This
GDP for that city over the next ten years.
study pulls together the authoritative published science
on a wide variety of threats. The impact of these risks is then summed up in various
ways. The total GDP@Risk from all the threats to
The science of each threat shows where in the world
each city is used to rank the cities by their chance
it is likely to occur, how often and with what severity.
of suffering economic disruption from any type of
This analysis has compiled the leading scientific
crisis – we can assess which threats pose the greatest
studies on each threat and applied them to assess
risk to each city. For any threat, we can review which
these risks for the main cities of the world. The
cities are most at risk. Across all of the 300 cities
location and circumstances of each city influences the
used to represent the main cities of the world, we can
likelihood of its experiencing each particular threat.
assess which threats pose the greatest risk of loss of
The proximity of the city to the coast and its location
GDP to the world economy. This standardized metric
within a hurricane belt determines how likely it is
is a very useful way of comparing and contrasting
to be damaged by a coastal storm surge flood. We
different components of the risk.
can tell how likely the city is to experience a severe
freeze event that will halt the city’s transport system Part II of this report describes the methodology of
from its climatic zone and past temperature records. how this risk assessment was made.
Financial systems, regulations and credit risk ratings
The next section summarizes the results and the
determine the possibility of bank runs and sovereign
conclusions that can be drawn from the analysis.
defaults.
7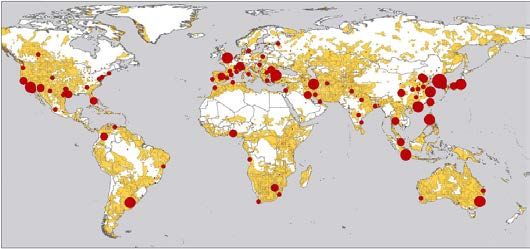
Cambridge Centre for Risk Studies

    3 Risk Atlas
The appendix to this report is a Risk Atlas of all of the   The top 10 cities most at risk from each threat are
individual threat maps and the results of the GDP@          identified. These are the cities that have the largest
Risk analysis for each threat, with the symbol size for     GDP@Risk because of their geographical location,
each city representing the total GDP@Risk from that         their exposure to the hazard of the threat severity for
threat.                                                     that city, the physical vulnerability of the city, and
                                                            their resilience and ability to recover from a crisis.
Note that the scales for the value of GDP@Risk on
each of the maps are different, as each map uses its        In general, cities that have the largest GDPs have
own appropriate scale to highlight the relativities         higher values of GDP@Risk – even moderate threats
between cities for that threat.                             can cause large values of loss. However, although
                                                            some cities with large GDP do feature commonly in
The maps are presented as world maps, and each
                                                            the top ranks of the risks across several threats, the
shows the geography of risk from that threat, with
                                                            patterns of threat identify a wide range of different
the expected loss to each city over the next decade,
                                                            cities in different threat types.
as GDP@Risk.

                      Earthquake                                            Volcanic Eruption

                       Windstorm                                                   Flood

                        Tsunami                                                  Drought

Examples from the Cambridge World City Risk Atlas: Threat Hazard Maps of the World

8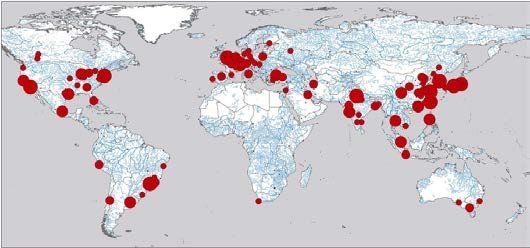
World City Risk 2025 - Part I: Overview and Results

  4 Results

Figure 2:  Total GDP@Risk from All Threats Combined showing Taipei and Tokyo as the world cities most at risk, 2015-2025

The results of this research can be used to assess              The uncertainties in the analysis make it difficult to
the risk profiles of individual cities as well as gain a        place great reliance on the exact ranking order of the
better understanding of how risk affects the global             cities. However, the list is quite stable in terms of the
economy. The final map of the atlas (Figure 2)                  tiers of risk which the various cities occupy. Changing
collection shows total GDP@Risk for the cities from             assumptions within plausible ranges in the individual
all threats combined.                                           risk models may change the ordering of the cities
                                                                by some ranks, but generally does not reallocate
Figure 3 shows the top 50 cities ranked by their
                                                                cities from one tier to another, so the tiering can be
total GDP@Risk from all causes. This represents the
                                                                considered fairly robust.
expected loss (amount of GDP output loss that will
result from a scenario, factored by the probability of          The risk profile of each city varies greatly. Each city
that scenario occurring) for a city over the next ten           has its own set of threats and potential for economic
years, from 1 Jan 2015 to 1 Jan 2025.                           disruption from different types of threat and these
                                                                “risk scoresheets” can be seen in Table 1.
Taipei and Tokyo, which are both vulnerable to a
wide combination of risks, including natural and                Natural catastrophe risk drives localised risk differences
man-made sit at the top of this table, with a combined          between cities, with windstorm being a major threat
GDP@Risk of over US$385bn. Inevitably, cities with              to many of the cities in the top tiers, and the threat of
higher GDP sit at the top of these tables – they have           earthquake as an important component of the risk for
more wealth to lose. However, Figure 4 shows these              six out of the top 10 cities. Financial crises and disease
figures represented as a percentage of the cities’              threats are more general and less localised, reflecting
GDP and here we see some differences in the results             the connectivity and interrelation of how these threats
– with the two top cities, Manila and Rosario both              affect entire regions and financial flows.
in the Philippines and primarily affected by natural
catastrophe losses (wind storm and earthquake,
predominantly). This chart shows how less wealthy
countries are more vulnerable to losing a higher
proportion of their economy, and are particularly
vulnerable to natural catastrophe risk due to a
combination of less advanced infrastructure and low
levels of insurance penetration.

                                                                                                                        9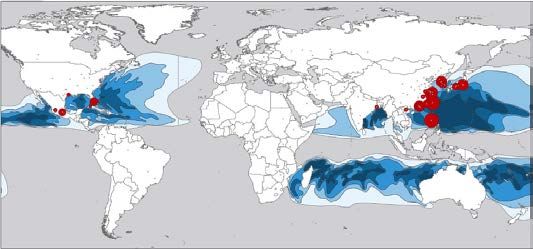
Cambridge Centre for Risk Studies

 Rank    City Name             Country
                                                   GDP@Risk                                GDP@Risk ($US Bn)
                                                   ($US Bn)
                                                                                       0        50     100          150             200
     1   Taipei                Taiwan              202
                                                                             Taipei
     2   Tokyo                 Japan               183                                                                                    Tier 1
                                                                             Tokyo
     3   Seoul                 Republic of Korea   137
                                                                              Seoul
     4   Manila                Philippines         114
                                                                             Manila
     5   Tehran                Iran                109                                                                     Tier 2
                                                                            Tehran
     6   Istanbul              Turkey              106                     Istanbul
     7   New York              United States       91                    New York

     8   Osaka                 Japan               91                        Osaka

     9   Los Angeles           United States       91                  Los Angeles

  10     Shanghai              China               88                     Shanghai

  11     Hong Kong             Hong Kong           88                   Hong Kong                                    Tier 3
                                                                      Buenos Aires
  12     Buenos Aires          Argentina           86
                                                                  Bombay (Mumbai)
  13     Bombay (Mumbai)       India               81
                                                                              Delhi
  14     Delhi                 India               77
                                                                              Lima
  15     Lima                  Peru                73
                                                                         Sao Paulo
  16     Sao Paulo             Brazil              63
                                                                              Paris
  17     Paris                 France              56                        Beijing
  18     Beijing               China               55                  Mexico City

  19     Mexico City           Mexico              54                       London

  20     London                United States       54                      Moscow

  21     Moscow                Russia              54                    Singapore

  22     Singapore             Singapore           51                        Tianjin

                                                                       Guangzhou
  23     Tianjin               China               50
                                                                      Tel Aviv Jaffa
  24     Guangzhou             China               50
                                                                              Kabul
  25     Tel Aviv Jaffa        Israel              49
                                                                        Kuwait City                               Tier 4
  26     Kabul                 Afghanistan         49
                                                                          Bangkok
  27     Kuwait City           Kuwait              49
                                                                           Chengtu
  28     Bangkok               China               49
                                                                            Karachi
  29     Chengtu               China               49                    Shenzhen
  30     Karachi               Pakistan            49                    Khartoum

  31     Shenzhen              China               48                    Hangzhou

  32     Khartoum              Sudan               47                       Jeddah

  33     Hangzhou              China               46                       Riyadh

                                                                           Chicago
  34     Jeddah                Saudi Arabia        46
                                                                     San Francisco
  36     Riyadh                Saudi Arabia        44
                                                              Dongguan, Guangdong
  37     Chicago               United States       43
                                                                            Jakarta
  38     San Francisco         United States       42
                                                                             Berne
  39     Dongguan, Guangdong   China               42
                                                                               Kiev
  40     Jakarta               Indonesia           41
                                                                              Izmir
  41     Berne                 Switzerland         38                         Cairo
  42     Kiev                  Ukraine             37                      Nagoya
                                                                                                         Tier 5
  43     Izmir                 Turkey              35                      Houston

  44     Cairo                 Egypt               34                       Bogotá

  45     Nagoya                Japan               32                     Santiago

  46     Houston               United States       32                        Lagos

                                                                           Calcutta
  47     Bogotá                Colombia            31
  48     Santiago              Chile               31
  49     Lagos                 Nigeria             31
                                                                     Figure 3:  Top 50 cities ranked by nominal GDP@Risk,
  50     Calcutta              India               30
                                                                     2015-2025

10
World City Risk 2025 - Part I: Overview and Results
GDP@Risk % GDP at Risk
Rank City Name Country
($US Bn)
% 1% 2% 3% 4% 5%
1 Manila Philippines 5.0%
Manila
2 Rosario Philippines 4.9%
Rosario
3 Taipei Taiwan 4.5%
Taipei
4 Xiamen China 4.2% Xiamen
5 Kabul Afghanistan 4.1% Kabul
6 Port au Prince Haiti 3.6% Port au Prince
7 Kathmandu Nepal 3.3% Kathmandu
8 Santo Domingo Dominican Republic 3.3% Santo Domingo
9 Ningbo China 3.2% Ningbo
Hangzhou
10 Hangzhou China 3.2%
Guangdong
11 Guangdong China 3.1%
Quito
12 Quito Peru 3.1%
Tehran
13 Tehran Iran 3.0%
Managua
14 Managua Nicaragua 2.8%
Guatemala City
15 Guatemala City Guatemala 2.8%
Calcutta
16 Calcutta India 2.8% Damascus
17 Damascus Syria 2.8% Hanoi
18 Hanoi Vietnam 2.5% Sana'a
19 Sana'a Yemen 2.5% Beirut
20 Beirut Lebanon 2.5% Tangshan
21 Tangshan China 2.5% Kunming
Busan
22 Kunming China 2.5%
Yerevan
23 Busan Republic of Korea 2.4%
Qom
24 Yerevan Armenia 2.3%
Daegu
25 Qom Iran 2.3%
Baghdad
26 Daegu Republic of Korea 2.3%
Izmir
27 Baghdad Iraq 2.3%
Almaty
28 Izmir Turkey 2.3% Ahvaz
29 Almaty Kazakhstan 2.2% San Salvador
30 Ahvaz Iran 2.2% Mogadishu
31 San Salvador El Salvador 2.2% Havana
32 Mogadishu Somalia 2.2% Shiraz
33 Havana Cuba 2.2% Karaj
Kermanshah
34 Shiraz Iran 2.1%
Daejon
36 Karaj Iran 2.1%
Gwangju
37 Kermanshah Iran 2.1%
Changzhou
38 Daejon Republic of Korea 2.1%
Nanning
39 Gwangju Republic of Korea 2.1%
Bandung
40 Changzhou China 2.1%
Tabriz
41 Nanning China 2.1% Addis Abeba
42 Bandung Indonesia 2.1% Lima
43 Tabriz Iran 2.1% Suzhou
44 Addis Abeba Ethiopia 2.1% Adana
45 Lima Peru 2.0% Wuxi
46 Suzhou China 2.0% Islamabad
Tianjin
47 Adana Turkey 1.9%
48 Wuxi China 1.9%
49 Islamabad Pakistan 1.8%
Figure 4: Top 50 cities ranked by percentage of GDP@
50 Tianjin China 1.8% Risk, 2015-2025
11Cambridge Centre for Risk Studies Table 1: Drivers of expected loss by each city for the top 40 cities 12
World City Risk 2025 - Part I: Overview and Results

A shift in the geography of risk                                                   Number of Cities in Top 20
The patterns of GDP@Risk for different threats, and
the final summary map of total GDP@Risk from all                                            Western        China
threats combined, shows that the threat to the world’s                                      Europe          15%
                                                                                             10%
economic growth is most significant in the emerging                                North
                                                                                  America
markets of:                                                                        10%
                                                                                                                    Japan
     •    Southeast Asia;                                                        Indian
                                                                                                                     10%

                                                                              Subcontinent
     •    Middle East;                                                            10%
                                                                                                            Rest of SE Asia
     •    Latin America;                                                                                         15%

     •    Indian Subcontinent.                                                     Latin America
                                                                                        20%
                                                                                                      Middle East
Table 2:  Number of cities in top ranks by region                                                        10%

                                       Number of cities in
                                        Top 20      Top 50                         Number of Cities in Top 50
China                                         3          9                           Eastern Europe
                                                                                           6%
                                                                                   Africa
Japan                                         2          3                          4%
                                                               Western Europe
Rest of SE Asia                               3          6          6%                                      China
                                                                                                             18%
                      SE Asia, Total          8         18
Middle East                                   2          9
                                                                                                                    Japan
Latin America                                 4          6                      North America
                                                                                     10%                             6%
Indian                                        2          4
                                                                                                            Rest of SE Asia
Subcontinent                                                                                                     12%
                                                                  Indian
North America                                 2          5     Subcontinent
                                                                    8%
Western Europe                                2          3                         Latin America
                                                                                        12%
Africa                                        0          2                                            Middle East
                                                                                                         18%
Eastern Europe                                0          3
Oceania                                       0          0
                                                               Figure 5:  Number of cities in top ranking lists by region

This is a shift from historical patterns of loss, which have   spending on basic infrastructure—such as transport,
traditionally shown North America and Europe most at           power, water and communications—currently
risk, representing the mature economic areas of high           amounts to $2.7 trillion a year.1 Ensuring that future
values of exposure. The projected growth of the cities in      investments in infrastructure provide a quality that
emerging markets indicates that exposure will increase         can be resilient to the threats that they are likely to
in many areas that severely vulnerable to various              face, will reduce the economic risk described here.
catastrophes. In some cases, the growth of the markets
                                                               Total risk by threat
in these new regions will, itself, generate further man-
made threats, such as cyber-attack or social unrest.           Figure 6 shows the total GDP@Risk as a combined
                                                               value from all 300 cities, for each threat. This shows
Future catastrophe losses will occur in different
                                                               the relativities between different threats.
geographical regions than they have historically. These
regions may be unprepared for the scale of loss and have       The top seven threats account for three quarters of
less developed market mechanisms for risk transfer,            the total GDP damage across the 300 World Cities.
protection, and recovery processes, and could benefit          By itself, Financial Crisis accounts for 20% of GDP@
from the experience of mature risk transfer markets.           Risk, with Interstate War constituting 15% of the
                                                               risk. Four threats of similar magnitude, Human
The fact that these regions will be growing rapidly over
                                                               Pandemics, Windstorm, Earthquake and Flood,
the next decade and investing in new infrastructure
                                                               comprise the next tier of most damaging threats.
and economic systems provides an opportunity to
introduce more resilient facilities and to mitigate
                                                               1
the impact of these crises when they occur. The
                                                                 World Economic Forum, May 2013 Industry Agenda,
World Economic Forum (WEF) estimates that global               Strategic Infrastructure; Steps to Prepare and Accelerate
                                                               Public-Private Partnerships, p.14

                                                                                                                              13
Cambridge Centre for Risk Studies
Solar Storm Temperate Heatwave
Nuclear Accident Tsunami
Financial Crisis Plant Epidemic
Wind Storm Freeze
Human Pandemics Power
Volcano
Outage
Windstorm
Drought
Earthquake Terrorism
Flood Sovereign Default
Cyber
Oil Price Shock Financial
Crisis
Sovereign Default
Terrorism Oil Price Shock
Drought
Power Outage Cyber
Volcano
Human
Plant Epidemic Pandemics
Solar Storm
Temperate Wind Storm Flood
Freeze
Heatwave Windstorm
Nuclear Accident Earthquake
Tsunami
0 200 400 600 800 1,000
GDP@Risk (US$Bn)
Figure 6: Comparison of risk by threat types; GDP@Risk combined from all cities for each threat
Cyber catastrophe risk is an additional 5% and rounds A catastrophe burden of 1.5% on world growth
out the top 7 threats. Together the top seven threats
The analysis suggests that the expected loss
make up 76% of GDP@Risk.
(probability-weighted losses) from the sum value of
The other 15 threats that make up the remaining additive risks will amount to $5.4 trillion for these
quarter of the risk add an important dimension to 300 cities from 1 Jan 2015 to 1 Jan 2025. The total
the complexity of the risk landscape and cannot GDP projected to be generated from the 300 cities
be ignored, as they are significant drivers of risk in 2015-2025 is $373 trillion, so the expected loss from
their own right for a number of high rank cities: oil catastrophes is 1.5% of total projected GDP output.
price shock is the second largest driver of risk for Economists such as Oxford Economics estimate that
New York, ranked seventh, sovereign default risk the world’s economy will average 3.2% growth for the
is the third largest driver of risk for Tehran, ranked next decade. This expected catastrophe loss amounts
fourth. Terrorism is the fourth largest driver of risk to about half of the expected global growth rate.
for Mumbai, ranked eleventh.
The projections for future growth are based on
The top seven threats account for three quarters of the models of past progress which incorporate actual
total GDP damage across the 300 World Cities. By itself, catastrophe losses. It is very difficult to estimate the
Financial Crisis accounts for 20% of GDP@Risk, with counter-factual effect of what past economic growth
War constituting 15% of the risk. Four threats of similar would have been without the wars, financial crises,
magnitude, Human Pandemics, Windstorm, Earthquake epidemics, and all the other shocks that have slowed
and Flood, comprise the next tier of most damaging progress, but this analysis suggests that catastrophes
threats. Cyber catastrophe risk is an additional 5% and put a burden of 1.5% on the world’s economic output.
rounds out the top 7 threats. Together the top seven If catastrophe losses didn’t occur, economic growth
threats make up 76% of GDP@Risk. would be significantly higher.
The other 15 threats that make up the remaining Mitigation of catastrophe losses is an investment
quarter of the risk add an important dimension to that could potentially yield an enormous benefit in
the complexity of the risk landscape and cannot perpetuity if by investing in more resilient institutions
be ignored, as they are significant drivers of risk in and stronger infrastructure, the burden on economic
their own right for a number of high rank cities: oil growth were reduced. This is discussed further below.
price shock is the second largest driver of risk for
These cities account for around 50% of global GDP
New York, ranked seventh, sovereign default risk
today (and an estimated two thirds of global GDP
is the third largest driver of risk for Tehran, ranked
by 2025). The rest of the world’s GDP is distributed
fourth. Terrorism is the fourth largest driver of risk
in many other locations and is not so concentrated,
for Mumbai, ranked eleventh.
14World City Risk 2025 - Part I: Overview and Results
so it is not straightforward to translate the expected Man-Made Threats: Traditional NatCat:
2.1 Market Crash and Bank Crisis 1.1 Earthquake
losses from the 300 cities from these threats to the 2.2 Sovereign Default 1.2 Volcano
2.3 Oil Price Shock 1.3 Tropical Wind Storm
rest of the global economy. Simply factoring the $5.4 3.1 Interstate War
3.2 Civil War and Separatism
1.4 Temperate Wind Storm
1.5 Flood
trillion from cities that represent 50% of the world’s 3.3 Terrorism
3.4 Social Unrest
Traditional 1.7 Tsunami
GDP today and 67% by 2025 would give a range of $7 4.1 Electrical Power Outage
4.2 Cyber
NatCat
Events
to 10 trillion for the total global economy, but this is 4.4 Nuclear Power Plant Accident 29%
Man-Made
almost certainly an oversimplification. Threats
55% Other
Natural
Other observations Threats
Other Natural Threats:
1.8 Drought
16% 1.10 Freeze
Traditionally, people have focused on natural 1.11 Heatwave
4.3 Solar Storm
5.1 Human Pandemics
catastrophes as the main threats to city prosperity. 5.2 Plant Epidemic
This analysis shows that there are more dimensions Figure 7: Breakdown of threats into natural catastrophe
to the problem of catastrophic disruption to a city’s and man-made
economy than natural disasters alone. Figure 7 shows
that less than a third of the expected loss to all of the
cities will come from natural catastrophes. More than Emerging Risks:
half of the future risk is from man-made threats – the 4.2 Cyber
3.4 Social Unrest
financial shocks, human errors and conflicts. More Emerging 5.1 Human Pandemics
5.2 Plant Epidemic
Risks
than a third of future risks is from rapidly changing 33%
3.1 Interstate War
“emerging risks” – as shown in Figure 8.
Other
This may change the way we think about risk in the Threats
67%
future. Traditional natural catastrophes threatened
the physical “means of production” (buildings and
machinery). Threats to disruption of the social means
of production – our networks, connections, trading Figure 8: Total GDP@Risk from emerging threats
relationships, and access to capital – is becoming
significant and could become even more important
over time.
Two-thirds of the risk is from threats that vary
greatly from year to year – “dynamic threats.” In this
exercise, we have made our best projection of these
for their average rate of occurrence over the next
decade. However, a rigorous analysis of these risks
could produce a different view next year. An annual
review of risk would be likely to update a number of
different aspects of this risk projection each year,
including:
• this year’s change in the ranking of cities;
• which threats have increased (or decreased);
• any progress in mitigation measures that are
significantly reducing risk from catastrophe.
15Cambridge Centre for Risk Studies
5 Validation
Comparison of modelled risk with historical costs at the past 10 years, 20 years, 50 years and 100 years.
for natural catastrophes Historically, over the past century windstorm losses
are around 20% larger than earthquake losses and
The modelled projection for GDP@Risk can be
floods are about 17% less damaging than earthquakes.
compared with historical costs of disasters, as a
In the model, windstorm losses are 27% larger than
check on relativities between different threats. The
earthquake and floods are 7% less than earthquake.
EM-DAT Database of the Centre for Research on the
Epidemiology of Disasters (CRED) is a catalogue of The model expects significant economic output loss
historical natural catastrophe events that contains from volcanic eruption, which is significantly greater
estimates of costs and other impact metrics on 3,806 relative to other threats, than the direct damage costs
disasters since 1900. In Figure 9, we compare the to physical infrastructure that volcanoes have caused
direct costs from observed historical events over the historically.
past 100 years with our modeled estimates for the
Comparisons of economic output loss with costs
same threats for the economic losses that we expect
of past damage to the built environment are not
might be generated over the next decade to our
an exact equivalence for a validation test, but it
sample of 300 cities.
provides indicative benchmarks to calibrate model
parameterization.
Comparisons with other studies
A recent study by the US National Bureau of Economic
Research makes a comparison of GDP erosion from
cyclones with estimates of other threats (Hsiang and
Jina, 2014). It uses a similar approach of lost GDP
growth to estimate loss of income. Its main focus is
on how repeated exposure to cyclone impacts has
imposed an economic burden on countries exposed to
them. They compare other threats with their estimate
of cyclone income per capita. Table 3 compares their
relativities of different threats, normalized to a
cyclone loss of 1.0 and puts this alongside a similar set
of comparable threats, normalized to the total GDP@
Risk from tropical windstorm for our 300 cities as
1.0. It is not clear that the definitions of the different
threats are exactly comparable, but the ranking and
relativities are broadly consistent.
National Income
US NBER
per capita Impact
Cyclone 1.00
Civil War 0.86
Currency Crisis 1.11
Banking Crisis 2.08
Figure 9: Comparison of modeled expected loss to GDP Cambridge Model Global GDP@Risk
with historical direct costs of disasters, for selected
natural catastrophe threats Tropical Windstorm 1.00
Separatism 0.45
The relativities of loss from different threats in the Sovereign Default 0.32
model are broadly consistent with the breakdown Market Crash 1.88
from past events, particularly in the ordering of
largest to smallest. The relativities between threats Table 3: Comparison of study with US NBER estimation of
are reasonably consistent across time periods, looking economic impacts from different threats
16World City Risk 2025 - Part I: Overview and Results
Amsterdam, the Netherlands
Our modeled risk of sovereign default has much lower The top 10 cities identified in our study, which
loss levels than the US NBER estimation of the loss includes additional threats to natural catastrophe,
of income resulting from a currency crisis, and our contains eight of the Swiss Re “Top 10” cities. The
estimates of the costs of separatism are significantly two studies broadly concur on the main natural
lower than the NBER estimation of the cost of civil catastrophe threats and the cities most at risk from
war. each threat.
Comparison with Swiss Re study of city risk There are, however, several differences in the
prioritization and mix of threats between the two
Swiss Re has developed the CatNet system that studies. In the Swiss Re study, river flood is the
contains datasets on natural hazards and cities and dominant peril and river flood and storm surge are
published a study in 2013, which assesses 616 cities modelled separately. The Swiss Re study does not
for 5 perils: identify Seoul or Istanbul as being as high a risk as
• Earthquake; the Cambridge study. The Cambridge analysis does
not have as high a risk value for Amsterdam.
• Wind storm;
• River flood;
• Storm surge;
• Tsunami.1
The study uses “working days lost” as their metric
of GDP loss, and also looks at the value of those
working days in that city as a proportion of the
national economy. The report identifies the impact of
all combined perils on a top 10 set of metropolitan
areas, with additional cities illustrated.2
1
Swiss Re (2013) Mind the Risk: A global ranking of cities
under threat from natural disasters.
2
Fig. 8 of Swiss Re (2013) Mind the Risk, 19
17Cambridge Centre for Risk Studies
6 Sensitivity studies
Reducing the vulnerability of cities
Shanghai, China
The model reflects the destruction of the built
environment that would be caused by damaging
threats – each city is graded into a physical
vulnerability category according to the structural
types, quality and strength of the building stock.
When a threat scenario occurs that involves physical
destruction – e.g., an earthquake – the vulnerability
parameter for the city affects how much damage
occurs and how severely the economy is shocked with
the capital loss and disruption from physical asset
loss.
A sensitivity test for the model is to explore how the
physical vulnerability parameter affects the loss
estimation – how much our model assumes would be
saved if the building stock were less damageable by
the forces of the destructive threat.
Buildings that are engineered to withstand the
destructive forces of winds, ground shaking, blast
and water pressures are more expensive to construct Raising the resilience of cities
and require social organization, building codes and
If we re-run the model and change the vulnerability
compliance processes and checks. Countries that
grading of all the cities in the world to the highest
have good quality codes and high compliance are
grading, i.e. all cities in the world all have the quality
graded as level 1 – “Very Strong” in our vulnerability
and robustness of buildings of New Zealand, then
classification. It includes countries like New Zealand,
risk is reduced by 25%.
Chile and United States, with a good tradition of
engineering and an accepted level of investment The results are similar when it comes to grading of
in building high quality property and resilient social and economic resilience. Resilience is how
infrastructure. Poorer quality countries have a lot of the organization and social and economic structure
vernacular, artisan-constructed buildings, with low of the cities improves how rapidly the city recovers
code compliance or checks. after a catastrophe. We re-ran the model, increasing
the resilience of certain cities - e.g., changing a city
These are rated as level 5 – “Very Weak” in our
that is graded as level 4 to level 3. When we re-run
grading, and includes countries like Haiti that suffer
the model with the cities assigned a better rating for
very high levels of destruction in moderately strong
social and economic resilience, it results in lower
earthquake shaking.
levels of GDP@Risk (Figure 12), because the cities
In Figure 10, a sensitivity test changes the ratings recover more quickly from their catastrophe. The
of all of the cities in our analysis, improving their overall risk is reduced by about 12%.
vulnerability grading from their current level to the
If we re-run the model and change the resilience
next stronger level, for example changing a city that
grading of all the cities in the world to the highest
is graded as level 4 to level 3.
grading (Figure 13), then risk is reduced by 25%.
If we re-run the model and change the vulnerability
If we re-run the model with all the cities being the
grading of all the cities in the world to the highest
highest possible grading of vulnerability and also
grading, i.e. all cities in the world all have the quality
being the highest grading of resilience, the overall
and robustness of buildings of New Zealand, then
risk is reduced by 54%.
risk is reduced by 25%, as seen in Figure 11.
The sensitivity tests suggest that over half of the risk
would be reducible by managing the risk through
improving the infrastructure and better organization
and response.
18World City Risk 2025 - Part I: Overview and Results
Examples # of cities Examples # of cities
Wellington, New Zealand; Los Angeles, Wellington, New Zealand; Los Angeles,
1 Very Strong USA 46 1 Very Strong USA; Frankfurt, Germany; Milan, Italy 105
2 Strong Frankfurt, Germany; Milan, Italy 59 2 Strong Sao Paulo, Brazil; Istanbul, Turkey 113
3 Moderate Sao Paulo, Brazil; Istanbul, Turkey 113 3 Moderate Bangkok, Thailand; Tripoli, Libya 68
4 Weak Bangkok, Thailand; Tripoli, Libya 68 4 Weak Kampala, Uganda; Port au Prince, Haiti 18
5 Very Weak Kampala, Uganda; Port au Prince, Haiti 18 5 Very Weak 0
1.1 Earthquake
1.2 Volcano
1.3 Wind Storm
1.4 Temperate Wind Storm
1.5 Flood
1.7 Tsunami
1.8 Drought
1.10 Freeze
1.11 Heatwave
2.1 Market Crash and Bank Crisis
2.2 Sovereign Default
2.3 Oil Price Shock
3.1 Interstate War
3.2 Civil War and Separatism
3.3 Terrorism
3.4 Social Unrest
4.1 Electrical Power Outage
4.2 Cyber
4.3 Solar Storm
4.4 Nuclear Power Plant Accident
5.1 Human Pandemics
5.2 Plant Epidemic
0 100 200 300 400 500 600 700 800 900 1,000
Was: $ 5.43 Tr
Now: $ 4.87 Tr
Saving: $ 556 Bn
Reduction 10%
Figure 10: Sensitivity test reducing the physical vulnerability of all cities by one grade
Examples # of cities Examples # of cities
1 Very Strong
Wellington, New Zealand; Los Angeles,
46 1 Very Strong All Cities 304
USA
2 Strong 0
2 Strong Frankfurt, Germany; Milan, Italy 59
3 Moderate 0
3 Moderate Sao Paulo, Brazil; Istanbul, Turkey 113
4 Weak 0
4 Weak Bangkok, Thailand; Tripoli, Libya 68
5 Very Weak 0
5 Very Weak Kampala, Uganda; Port au Prince, Haiti 18
1.1 Earthquake
1.2 Volcano
1.3 Wind Storm
1.4 Temperate Wind Storm
1.5 Flood
1.7 Tsunami
1.8 Drought
1.10 Freeze
1.11 Heatwave
2.1 Market Crash and Bank Crisis
2.2 Sovereign Default
2.3 Oil Price Shock
3.1 Interstate War
3.2 Civil War and Separatism
3.3 Terrorism
3.4 Social Unrest
4.1 Electrical Power Outage
4.2 Cyber
4.3 Solar Storm
4.4 Nuclear Power Plant Accident
5.1 Human Pandemics
5.2 Plant Epidemic
0 100 200 300 400 500 600 700 800 900 1,000
Was: $ 5.43 Tr
Now: $ 3.99 Tr
Saving: $ 1.44 Tr
Reduction 26%
Figure 11: Sensitivity test reducing the physical vulnerability of all cities to the lowest vulnerability grade
19Cambridge Centre for Risk Studies
Examples # of cities Examples # of cities
1 Very Strong Resilience UK, USA, Japan 21 1 Very Strong Resilience
UK, USA, Japan + Italy, Israel, UAE,
34
China
2 Strong Resilience Italy, Israel, UAE, China 13
2 Strong Resilience Turkey, South Africa, Brazil 28
3 Moderate Resilience Turkey, South Africa, Brazil 28
3 Moderate Resilience Iran, Mexico, Vietnam 19
4 Weak Resilience Iran, Mexico, Vietnam 19
4 Weak Resilience Sudan, Libya, Pakistan, Bangladesh 27
Sudan, Libya, Pakistan,
5 Very Weak Resilience Bangladesh 27 5 Very Weak Resilience 0
1.1 Earthquake
1.2 Volcano
1.3 Wind Storm
1.4 Temperate Wind Storm
1.5 Flood
1.7 Tsunami
1.8 Drought
1.10 Freeze
1.11 Heatwave
2.1 Market Crash and Bank Crisis
2.2 Sovereign Default
2.3 Oil Price Shock
3.1 Interstate War
3.2 Civil War and Separatism
3.3 Terrorism
3.4 Social Unrest
4.1 Electrical Power Outage
4.2 Cyber
4.3 Solar Storm
4.4 Nuclear Power Plant Accident
5.1 Human Pandemics
5.2 Plant Epidemic
0 100 200 300 400 500 600 700 800 900 1,000
Was: $ 5.43 Tr
Now: $ 4.78 Tr
Saving: $ 646 Bn
Reduction 12%
Figure 12: Sensitivity test improving the resilience of cities by one grade
Examples # of cities Examples # of cities
1 Very Strong Resilience UK, USA, Japan 21 1 Very Strong Resilience All countries 304
2 Strong Resilience Italy, Israel, UAE, China 13 2 Strong Resilience 0
3 Moderate Resilience Turkey, South Africa, Brazil 28 3 Moderate Resilience 0
4 Weak Resilience Iran, Mexico, Vietnam 19 4 Weak Resilience 0
5 Very Weak Resilience Sudan, Libya, Pakistan, Bangladesh 27 5 Very Weak Resilience 0
1.1 Earthquake
1.2 Volcano
1.3 Wind Storm
1.4 Temperate Wind Storm
1.5 Flood
1.7 Tsunami
1.8 Drought
1.10 Freeze
1.11 Heatwave
2.1 Market Crash and Bank Crisis
2.2 Sovereign Default
2.3 Oil Price Shock
3.1 Interstate War
3.2 Civil War and Separatism
3.3 Terrorism
3.4 Social Unrest
4.1 Electrical Power Outage
4.2 Cyber
4.3 Solar Storm
4.4 Nuclear Power Plant Accident
5.1 Human Pandemics
5.2 Plant Epidemic
0 100 200 300 400 500 600 700 800 900 1,000
Was: $ 5.43 Tr
Now: $ 4.02 Tr
Saving: $ 1.41 Tr
Reduction 26%
Figure 13: Sensitivity test improving both the vulnerability and the social and economic resilience of all cities to the highest
grades
20World City Risk 2025 - Part I: Overview and Results
Sensitivity of risk results to climate change
1.1 Earthquake
Climate Change is likely to increase the risk of: 1.2 Volcano
1.3 Wind Storm
• 1.3 Tropical Wind Storm; 1.4 Temperate Wind Storm
1.5 Flood
• 1.4 Temperate Wind Storm; 1.7 Tsunami
1.8 Drought
• 1.5 Flood; 1.10 Freeze
1.11 Heatwave
• 1.8 Drought; 2.1 Market Crash and Bank Crisis
2.2 Sovereign Default
• 1.10 Freeze; 2.3 Oil Price Shock
3.1 Interstate War
• 1.11 Heatwave. 3.2 Civil War and Separatism
3.3 Terrorism
This sensitivity analysis tested how risk results might 3.4 Social Unrest
change with increasing frequency and severity of 4.1 Electrical Power Outage
4.2 Cyber
threats affected by climate change. For the climate
4.3 Solar Storm
change threats: 4.4 Nuclear Power Plant Accident
5.1 Human Pandemics
• All frequencies of these threats increased by 5.2 Plant Epidemic
10%, 0 200 400 600 800 1,000
• All event severities increased by 5%
Was: $ 5.43 Tr
The results are shown in Figure 14 - global GDP@ Now: $ 5.59 Tr
Risk increases by $156 Billion, an increase of 3% on Increase: $ 156 Bn
the total. Increase of: 3%
Some studies suggest that climate change could also Figure 14: Climate Change sensitivity test
increase the threat of
• 5.1 Human Pandemics;
• 5.2 Plant Epidemic;
• 3.4 Social Unrest;
• 3.1 Interstate War;
• 3.2 Civil War and Separatism.
21Cambridge Centre for Risk Studies
7 Conclusions
A decade of risk lies ahead. There is no reason to This report suggests that the patterns of risk are
believe that the next ten years will have fewer shocks changing – there is a shift in the geography of risk so
than any other decade in recent history. It won’t that future losses might be expected more in Asia and
always be a smooth ride to economic prosperity. the developing markets. The threats are themselves
evolving, and we will see more disruption occurring
Managers of global businesses and the population
from the emerging and man-made risks that affect
who expect the current rate of economic progress to
our global social and economic network.
continue unabated need to be aware of the potential
threats. Awareness is a key part of risk management. But this report also indicates that this risk is not
inevitable or unavoidable. It shows that improvements
It remains impossible to predict exactly when and
and investment can change these losses. Improving
where future catastrophes will occur, but patterns
the vulnerabilities of our cities can make a significant
of risk – the “landscape of risk” – can be described
reduction in risk. Developing more resilience and
and there is a major resource of scientific studies
faster recovery after a crisis has even more positive
that contribute to the recognition of these patterns.
benefits. Overall, half of all the risk isolated in this
The science of each separate threat tends to be in its
study is reducible.
own academic domain and studied in isolation. These
studies become useful when collated and put into a The landscape of city risk could look very different for
single framework for comparison and analysis. This future generations. Recognizing the risk - measuring
report is intended to make a useful contribution to it consistently, and mapping it out - is a key step in
this process. managing it. This report is a key step towards that
objective.
It is necessary to be aware of the wide range of
potential threats beyond natural catastrophes that
could occur and will impact businesses and financial
output.
22World City Risk 2025 - Part I: Overview and Results
8 References
2009 UNISDR Terminology on Disaster Risk Re- Kennedy, Christopher, The Evolution of Great World
duction. United Nations, 2009 Cities: Urban Wealth and Economic Growth,
University of Toronto Press, (Toronto, 2011)
Andersen, Torben Juul, ‘Globalization and Natural
Disasters: An Integrative Risk Management Per- ‘Lump together and like it’, The Economist, Nov. 6,
spective’, from Building Safer Cities, pp.57-74. 2008
Beall, Jo and Sean Fox, Cities and Development, Marshall, Alex, How Cities Work: Suburbs, Sprawl
Routledge Perspectives on Development, Taylor and the Roads Not Taken, University of Texas
& Francis, (London and New York, 2009) Press, (Austin, 2000)
Benson, Charlotte and Edward J. Clay, ‘Disasters, Montgomery, John, The New Wealth of Cities, City
Vulnerability and the Global Economy.’ Paper Dynamics and the Fifth Wave, Ashgate, (Burl-
prepared for ProVention/World Bank confer- ington, 2007)
ence on The Future Disaster Risk: Building Saf- N.L., ‘Urbanisation: The city triumphs, again’, The
er Cities, December 4-6, 2002 Economist, (2013, Jun.) Retrieved from: http://
Building Safer Cities, the Future of Disaster Risk, ed. www.economist.com/blogs/babbage/2013/06/
Margaret Arnold, Anne Carlin and Alcira Kreim- urbanisation (accessed 8.20.14)
er, The World Bank Disaster Risk Management Solomon M. Hsiang, Amir S. Jina, 2014, ‘The Causal
Series, (Washington, 2003)
Effect of Environmental Catastrophe on Long-
Cizmar, F., Donaldson, R., Gabriel, L., Jones, D., Run Economic Growth: Evidence From 6,700
Khan, A., Marx, J., McBrien, R., McColgan, S., Cyclones’, U.S. National Bureau of Economic Re-
McIlheney, C., McLernon, L., Ocasio, L., Peche- search; Pre-Publication Manuscript July 2014.
nik, T., Piestrzynska, I., and Sand, W., ‘Cities of Swiss Re, 2013, Mind the Risk: A global ranking of
Opportunity’ Vol. 6, PWC, 2014 cities under threat from natural disasters, Swiss
Coburn, A.W.; Bowman, G.; Ruffle, S.J.; Foulser-Pig- Re CatNet publications. Retrieved from: http://
gott, R.; Ralph, D.; Tuveson, M.; 2014, A Taxon- media.swissre.com/documents/Swiss_Re_
omy of Threats for Complex Risk Management, Mind_the_risk.pdf
Cambridge Framework series; Centre for Risk Tourism Resources, ‘Is Tourism an Economic Ac-
Studies, University of Cambridge.
tivity to Pursue?’: Retrieved from http://www.
Dobbs, R., Smit, S., Remes, J., Manyika, J., Rox- communitydevelopment.uiuc.edu/tourism/n_
burgh, C., and Restrepo, A., Urban World: resources.html
Mapping the economic power of cities, McK- The City as a Growth Machine: Critical Perspectives
insey & Company, (March, 2011) Two Decades Later, ed. Andrew E. G. Jonas
Environmental Change Initiative, 2014. ND-GAIN and David Wilson, State University of New York
[WWW Document]. Notre-Dame Glob. Adapt. Press, (Albany, 1999)
Index. Retrieved from: http://gain.org/ (ac- The State of the World’s Cities 2010/2011: Bridging
cessed 8.28.14) the Urban Divide, UN Habitat, UN Human Set-
tlements Programme (Nairobi, 2010)
Hendrick-Wong Y. and D. Choog, Mastercard Glob-
al Destination Cities Index, 2Q, 2013. Retrieved The World Bank, 2014. Data. URL: http://data.
from: http://insights.mastercard.com/wp-con- worldbank.org/ (accessed 8.29.14)
tent/uploads/2013/05/Mastercard_GDCI_Fi- World Tourism Organisation, ‘Collection of Tourism
nal_V4.pdf Expenditure Statistics’, No. 2, 1995 ; Retrieved
‘How to feed the world in 2050,’ Food and Agricul- from: http://pub.unwto.org/WebRoot/Store/
ture Organisation of the United Nations, Con- Shops/Infoshop/Products/1034/1034-1.pdf
ference report; (Rome, 2009) World Tourism Organisation, ‘World Tourism Ba-
Inklaar, R., Feenstra, R.C., and Timmer, M.P., 2014, rometer’, Vol. 11, (January 2013) Retrieved
Penn World Table, Groningen Growth and De- from: http://dtxtq4w60xqpw.cloudfront.net/
velopment Centre. Retrieved from: www.ggdc. sites/all/files/pdf/unwto_barom13_01_jan_ex-
net/pwt (accessed 8.29.14). cerpt_0.pdf
Jacobs, Jane, The Economy of Cities, Random House,
(New York, 1961)
23Report citation:
Coburn, A.W.; Evan, T.; Foulser-Piggott, R.; Kelly, S.; Ralph, D.; Ruffle, S.J.; Yeo, J. Z.; 2015, World City
Risk 2025: Part I Overview and Results; Cambridge Risk Framework series; Centre for Risk Studies,
University of Cambridge.
Research Project Team
World City Risk Project Leads
Simon Ruffle, Director of Technology Research and Innovation
Dr Andrew Coburn, Director of External Advisory Board
Cambridge Centre for Risk Studies Research Team
Professor Daniel Ralph, Academic Director
Dr Michelle Tuveson, Executive Director
Dr Andrew Coburn, Director of External Advisory Board
Simon Ruffle, Director of Technology Research and Innovation
Dr Scott Kelly, Senior Research Associate
Dr Olaf Bochmann, Research Associate
Dr Andrew Skelton, Research Associate
Dr Andrew Chaplin, Risk Researcher
Dr Jay Chan Do Jung, Risk Researcher
Eireann Leverett, Risk Researcher
Dr Duncan Needham, Risk Researcher
Edward Oughton, Risk Researcher
Dr Louise Pryor, Risk Researcher
Dr Ali Rais Shaghaghi, Research Assistant
Jennifer Copic, Research Assistant
Tamara Evan, Research Assistant
Jaclyn Zhiyi Yeo, Research Assistant
Consultants and Collaborators
Cytora Ltd., with particular thanks to Joshua Wallace and Andrzej Czapiewski
Cambridge Architectural Research Ltd., with particular thanks to Martin Hughes and Hannah Baker
Dr Gordon Woo, RMS, Inc.
Dr Helen Mulligan, Director, Cambridge Architectural Research Ltd., and co-founder Shrinking Cities
International Research Network (SCiRN),
Oxford Economics Ltd., with particular thanks to Nida Ali, Economist
Cambridge Centre for Risk Studies
Website and Research Platform
http://www.risk.jbs.cam.ac.uk/You can also read