CPB - Monitoring Progress in Urban Road Safety Safer City Streets - European Driving ...
←
→
Page content transcription
If your browser does not render page correctly, please read the page content below

CPB
               Corporate Partnership
               Board

Monitoring Progress in
Urban Road Safety
                                       Safer City Streets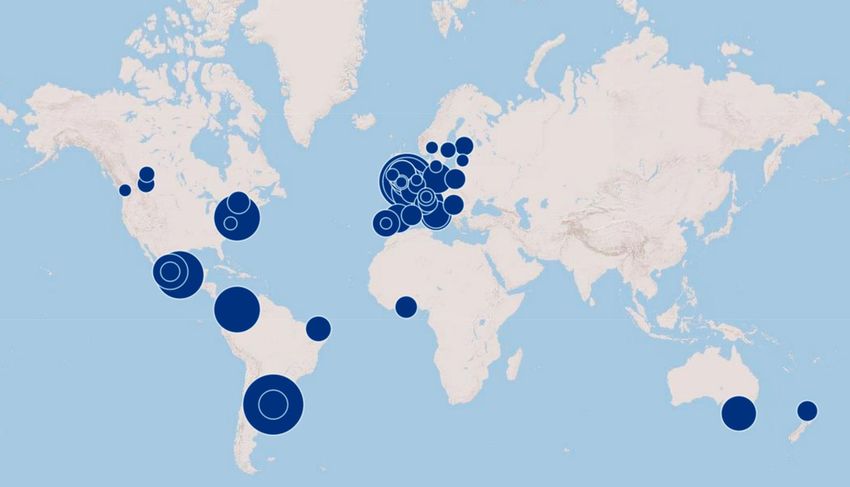
Monitoring Progress in
Urban Road Safety
                         Safer City Streets
The International Transport Forum

The International Transport Forum is an intergovernmental organisation with 62 member countries. It acts
as a think tank for transport policy and organises the Annual Summit of transport ministers. ITF is the only
global body that covers all transport modes. The ITF is politically autonomous and administratively
integrated with the OECD.
The ITF works for transport policies that improve peoples’ lives. Our mission is to foster a deeper
understanding of the role of transport in economic growth, environmental sustainability and social
inclusion and to raise the public profile of transport policy.
The ITF organises global dialogue for better transport. We act as a platform for discussion and pre-
negotiation of policy issues across all transport modes. We analyse trends, share knowledge and promote
exchange among transport decision-makers and civil society. The ITF’s Annual Summit is the world’s largest
gathering of transport ministers and the leading global platform for dialogue on transport policy.
The Members of the Forum are: Albania, Armenia, Argentina, Australia, Austria, Azerbaijan, Belarus,
Belgium, Bosnia and Herzegovina, Bulgaria, Canada, Chile, China (People’s Republic of), Croatia,
Czech Republic, Denmark, Estonia, Finland, France, Georgia, Germany, Greece, Hungary, Iceland, India,
Ireland, Israel, Italy, Japan, Kazakhstan, Korea, Latvia, Liechtenstein, Lithuania, Luxembourg, Malta,
Mexico, Republic of Moldova, Mongolia, Montenegro, Morocco, the Netherlands, New Zealand,
North Macedonia, Norway, Poland, Portugal, Romania, Russian Federation, Serbia, Slovak Republic,
Slovenia, Spain, Sweden, Switzerland, Tunisia, Turkey, Ukraine, the United Arab Emirates, the
United Kingdom, the United States and Uzbekistan.

                                      International Transport Forum
                                            2 rue André Pascal
                                          F-75775 Paris Cedex 16
                                           contact@itf-oecd.org
                                             www.itf-oecd.org

                    Case-Specific Policy Analysis Reports
The ITF’s Case-Specific Policy Analysis series presents topical studies on specific issues carried out by the
ITF in agreement with local institutions. Any findings, interpretations and conclusions expressed herein are
those of the authors and do not necessarily reflect the views of the International Transport Forum or the
OECD. Neither the OECD, ITF nor the authors guarantee the accuracy of any data or other information
contained in this publication and accept no responsibility whatsoever for any consequence of their use.
This work is published under the responsibility of the Secretary-General of the ITF. This document, as well
as any data and map included herein, are without prejudice to the status of or sovereignty over any
territory, to the delimitation of international frontiers and boundaries and to the name of any territory,
city or area.
Cite this work as: ITF (2020), “Monitoring Progress in Urban Road Safety”, International Transport Forum
Policy Papers, No. 79, OECD Publishing, Paris.
FOREWORD

                                               Foreword

Every minute, someone in the world dies in urban traffic. To put the brakes on needless road deaths, cities
are taking the lead in the battle for road safety. Their actions – speed limit reductions and radical changes
in street design, for example – are delivering measurable results. In 2019, two major European capital
cities, Helsinki and Oslo, reduced the number of pedestrians and cyclists killed in traffic to zero.
Safer streets are crucial for making cities more liveable. If streets are dangerous, efforts to promote
walking and cycling are undermined. Reducing the risks of urban traffic not only saves lives, it opens doors
to sustainable forms of transport, which can reduce pollution, cut emissions, fight congestion and improve
citizens’ physical and mental health.
Cities offer countless opportunities for experimentation and policy innovation. Their efforts complement
important actions led by other stakeholders, including national governments and inter-governmental
organisations, who have substantial impact on vehicle design standards, research and training. Carefully
considered road safety policies ensure that cities have a critical and growing role in achieving the United
Nations Global Sustainability Goals and implementing the New Urban Agenda.
The International Transport Forum (ITF) launched the ITF Safer City Streets initiative at the UN Habitat III
conference in 2016. It brings together road safety experts working in cities and explores the solutions
developed at a local level. Cities in the network improve their urban road safety performance by sharing
data, experience and knowledge and learning from each other.
Safer City Streets replicates at city-level the International Road Traffic Safety Analysis and Data (IRTAD)
group, a global road safety network of countries hosted by the ITF, which has run for more than 25 years.
The IRTAD group has been commended by the World Health Organization as “a model of a
multicounty effort”.
Only measurable results provide evidence of best practice. At the core of the ITF Safer City Streets initiative
is data collection, with the development and maintenance of a city-level database on mobility and road
safety statistics.
Thanks to the Safer City Streets programme, the ITF published in 2018 the world’s first road safety
benchmark at city-level to include meaningful risk indicators for each road user type. The ITF used this
network and database again in 2020 to investigate the safety of micromobility.
The present report updates the benchmark first published in 2018. Once again, it highlights best practice
and identifies room for progress towards better urban road safety policies. A complete list of the cities
mentioned in this report is available in Annex A.

Young Tae Kim
Secretary-General
International Transport Forum

MONITORING PROGRESS IN URBAN ROAD SAFETY © OECD/ITF 2020                                                   3
ACKNOWLEDGEMENTS

                                Acknowledgements

This report was written by Alexandre Santacreu, with contributions from Rafaella Basile of the
International Transport Forum. It is part of the Safer City Streets initiative, a project co-ordinated by
Alexandre Santacreu.
The author is grateful for the support of the POLIS network in organising joint meetings with the ITF on
urban road safety. The author also benefitted from direct conversations with Jan Jakiel, City Road
Administration in Warsaw; Maja Cimmerbeck, City Environment Agency in Oslo; and Tony Churchill, Joanna
Domarad and Alex Caufield, City of Calgary.
The document was reviewed by Stephen Perkins and copy edited by Hilary Gaboriau at the International
Transport Forum. The author is very grateful for external comments received from George Yannis and
Katerina Folla, National Technical University of Athens; Liliana Quintero and Joshua Pablo, City of
Vancouver; Markus Egelhaaf and Andreas Shäulbe, DEKRA; and Maria Andrea Forero Moncada, Nancy
Rocio Romero Rodriguez, Olga Patricia Numpaque Gutierrez, Claudia Andrea Diaz Acosta, Lina Marcela
Quiñones Sanchez and Pedro César del Campo Neira, City of Bogotá. Other members of the Safer City
Streets network kindly provided comments through online workshops organised on 29 and 30 July 2020.
Members of the Safer City Streets network, mostly found in local governments’ road safety teams,
dedicated their time to collect and share their local road safety figures. National and European level
government officers and experts from research institutes kindly complemented the data collection where
gaps were identified. In particular, the Danish Technical University submitted data from the Danish
National Travel Survey.
The Safer City Streets initiative is funded by the International Automobile Federation (FIA) Road Safety
Grant Programme and delivered by the ITF. This work benefits from the guidance and support of the ITF’s
permanent working group on road safety data, the group for International Road Traffic safety Analysis and
Data (IRTAD). The IRTAD group organised the pilot stage and established the methodological framework.
Funding from the European Commission supported further database development and the elaboration of
new risk indicators.

 4                                                   MONITORING PROGRESS IN URBAN ROAD SAFETY © OECD/ITF 2020
TABLE OF CONTENTS
Table of contents
Executive summary .............................................................................................................................. 7
About the cities in this report .............................................................................................................. 9
Reducing road deaths and serious injuries: Progress made................................................................ 10
Road deaths drop by 3.2% annually............................................................................................... 10
Serious injuries drop 1.9% annually ............................................................................................... 11
Cycling casualties follow a different trend ..................................................................................... 12
Is cycling getting more dangerous over time? ............................................................................... 14
Cities can outperform the national average .................................................................................. 15
Benchmarking urban road safety ....................................................................................................... 17
Mortality ........................................................................................................................................ 17
Pedestrian safety ........................................................................................................................... 18
Cycling safety ................................................................................................................................. 19
Powered two-wheeler safety......................................................................................................... 21
Road user behaviour ...................................................................................................................... 22
Who is killed in cities? Road deaths by mode and gender ............................................................. 23
Alternative road safety indicators.................................................................................................. 25
Notes ................................................................................................................................................. 28
References ......................................................................................................................................... 29
Annex A. City population statistics ..................................................................................................... 31
Figures
Figure 1. Cities contributing to the ITF Safer City Streets database ...................................................... 9
Figure 2. Road traffic deaths since 2010 ............................................................................................ 10
Figure 3. Serious injuries since 2010 .................................................................................................. 12
Figure 4. Road traffic deaths by mode, 2010-2018............................................................................. 13
Figure 5. Serious injuries by mode, 2010-2018 .................................................................................. 13
Figure 6. Cycling trips and risk per trip, 2010-2018 ............................................................................ 14
Figure 7. Road traffic deaths by city and country, 2010-2018 ............................................................ 15
Figure 8. Road traffic deaths per 100 000 daytime population........................................................... 17
MONITORING PROGRESS IN URBAN ROAD SAFETY © OECD/ITF 2020 5TABLE OF CONTENTS
Figure 9. Pedestrian fatality risk across cities, 2014-2018 average ..................................................... 18
Figure 10. Vancouver’s guidelines for cycling facilities for people of all ages and abilities.................. 19
Figure 11. Cycling fatality risk across cities, 2014-2018 average......................................................... 20
Figure 12. Powered two-wheeler fatality risk across cities, 2014-2018 average................................. 21
Figure 13. Modal share of road fatalities by city, 2014-2018.............................................................. 24
Figure 14. Ratio between male and female fatalities ......................................................................... 25
Figure 15. Number of fatalities per year per 10 000 vehicles registered, 2014-2018 ......................... 26
Figure 16. Number of fatalities per billion vehicle-kilometres, 2014-2018 ......................................... 26
Figure 17. Number of road deaths per year and per 1 000 kilometres of road network length .......... 27
Tables
Table 1. Protective equipment wearing rate by city ........................................................................... 22
Table A.1. Population and density for cities mentioned in this report ................................................ 31
Boxes
Box 1. Can cities make Vision Zero a reality? Lessons from Helsinki and Oslo .................................... 11
Box 2. Functional Urban Areas: A common definition ........................................................................ 16
Box 3. Cycling safety in Vancouver: Design for all ages and abilities ................................................... 19
6 MONITORING PROGRESS IN URBAN ROAD SAFETY © OECD/ITF 2020EXECUTIVE SUMMARY
Executive summary
What we did
This report tracks the progress in reducing the number of road traffic fatalities and serious injuries in cities
since 2010. It presents traffic safety data collected in 48 cities participating in the ITF Safer City Streets
network and compares urban with national road safety trends. It provides indicators for the risk of traffic
death for different road user groups, thereby enhancing the evaluation, monitoring and benchmarking of
road safety outcomes.
What we found
The cities examined have achieved large reductions in the number of road deaths since 2010. That said,
very few are improving traffic safety at a pace that will cut road deaths by 50% in the decade leading up
to 2030, in line with UN road safety targets. In most cities, the number of road deaths fell between 18%
and 29% in the period 2010-18. Reductions for vulnerable road users were slower. In large cities, the
number of traffic fatalities among pedestrians fell consistently slower than for occupants of cars
and trucks.
The number of serious cycling injuries increased in most cities. Paradoxically, cycling has become safer
over time, at least in cities for which data on cycling trips are available. The growth in the number of bicycle
trips in these cities far outweighs any increases in the number of cyclist deaths or injuries.
The number of road deaths per inhabitant varies; some cities are ten times safer than others. Such
differences also exist for the risk of death among pedestrians, cyclists and motorcyclists. Making such gaps
between well-performing and not-so-well-performing cities transparent, as this report does, can help
lagging cities to catch up with the safest of their peers, and set the right targets.
What we recommend
Set ambitious targets to reduce the number of casualties
Cities should adopt targets for the rapid reduction in the number of fatalities and serious injuries. Large
gaps in road safety performance exist between cities. Drawing attention to these can help secure political
support for ambitious casualty reduction targets. These should aim at the behaviours most critical for
improvement, most importantly speeding.
Create joint mobility and safety observatories in cities
Local governments should collect urban mobility data alongside crash data in a regular fashion. This will
make the interpretation of road safety trends easier. The analysis should include data on behaviour,
attitudes and enforcement. Dedicating staff and budget to establish a road safety observatory is most likely
to deliver a robust and consistent set of indicators over time. A sustainable urban mobility plan (SUMP)
MONITORING PROGRESS IN URBAN ROAD SAFETY © OECD/ITF 2020 7EXECUTIVE SUMMARY can provide mandate and funding for an observatory. The changes in mobility patterns triggered by the Covid-19 pandemic strengthen the case for systematic collection of urban mobility data. Put the focus on protecting vulnerable road users Cities should intensify their efforts to improve the safety of vulnerable road users. These are most at risk in city traffic and constitute the vast majority of fatalities on urban roads. Cities should manage streets in better ways that provide safe conditions for walking and cycling. Adopting a Safe System approach when setting speed limits is particularly recommended: this includes 30 km/h limits where motor vehicles mix with vulnerable road users. Automated enforcement and adequate street design principles will maximise compliance with speed limits. Reallocating road space in dense urban areas will make city centres safer if the reallocation succeeds in replacing a share of short car and motorcycle trips by walking, cycling and other forms of low-speed micromobility. Measure the safety of vulnerable road users in cities with appropriate indicators Analysts should control for the volume of travel to assess the level of risk experienced by a specific road user group. This is particularly important for micromobility, given the rapid growth of cycling in many cities at the current time. Analysts should monitor the number and length of trips made by each mode with household travel surveys or other means. Where funding for monitoring is a problem, local governments should explore partnerships with national authorities and public health bodies. Simplified, innovative, standardised survey methods can also reduce costs. 8 MONITORING PROGRESS IN URBAN ROAD SAFETY © OECD/ITF 2020
ABOUT THE CITIES IN THIS REPORT
About the cities in this report
This report builds on data from 48 cities in 26 countries, mainly in Europe and the Americas (Figure 1).
Annex A provides the full list of the cities mentioned in this report. The selection includes cities of
various shapes:
land area ranges from 80 square kilometres in The Hague to more than 8 800 in Melbourne
resident population varies from just over 400 000 in Zurich to over 14 million in Greater
Buenos Aires
resident population per square kilometre varies from 330 in Auckland to nearly 21 000 in Paris.
Out of the 48 cities, ten have their boundary defined by their functional urban area1 (FUA). The FUA
consists of a city plus its commuting zone, according to the definition jointly adopted by the OECD and the
European Commission (OECD, 2012). For a detailed comparison of road safety performance across FUAs
in Europe, see ITF (2019).
Figure 1. Cities contributing to the ITF Safer City Streets database
Helsinki
Oslo
Manchester Stockholm
Birmingham Copenhagen Riga
Berlin
Dublin The Hague
Warsaw
Bristol Brussels
London
Edmonton Paris
Calgary Montreal Zurich
Vancouver
Milan
New York City Turin Belgrade
Washington D.C.
Rome
Lisbon
Barcelona
Guadalajara Mexico City Madrid
Bogota Accra
Fortaleza
Auckland
Buenos Aires
Melbourne
Note: Circle area is proportional to resident population. Concentric circles occur where data is available at multiple
geographic levels. Three levels exist in London for instance: Inner London, Greater London and the London
Functional Urban Area.
Source: ITF Safer City Streets database, Esri basemap.
MONITORING PROGRESS IN URBAN ROAD SAFETY © OECD/ITF 2020 9REDUCING ROAD DEATHS AND SERIOUS INJURIES: PROGRESS MADE
Reducing road deaths and serious injuries:
Progress made
Most cities (26 of the 28 that have data from the entire 2008 to 2018 period) have reduced the number
of road deaths between 2010 and 2018. Some cities have more than halved that number. Fewer cities
have achieved a reduction in serious injuries over the same period. Overall, however, very few cities are
progressing at a pace sufficient to deliver the UN’s goal of a 50% reduction in road deaths over the decade2.
This chapter examines the trends since 2010, separates progress by mode of transport and compares city-
level with national-level trends.
Road deaths drop 3.2% annually
Two cities, Oslo and Warsaw, have reduced the number of road deaths by more than 7% a year between
2010 and 2018. Such progress sets them on track to deliver the UN road safety target to halve the number
of road deaths in a decade.
Figure 2. Road traffic deaths since 2010
2010 2011 2012 2013 2014 2015 2016 2017 2018
+10%
+5%
0
-5%
% Difference from 2010
-10%
-15%
-20%
-23%
-25%
-30%
-35%
-40%
Note: For each year, the dot represents the median percentage change since 2010 across 28 cities. Vertical bars
represent the inter-quartile range: observations between the 25th and the 75th percentiles. The number of deaths
is captured by a three-year average – for instance, a 2010 value represents the 2008-2010 average. Source: ITF
Safer City Streets database.
All other cities fall short of this target. Across 28 cities, the median annual reduction in road deaths is 3.2%,
which equates to a 23% reduction over the eight-year period for which data is available3. Most cities
delivered a reduction between 2.4% and 4.2% per year. Aggregated data across all cities shows no
10 MONITORING PROGRESS IN URBAN ROAD SAFETY © OECD/ITF 2020REDUCING ROAD DEATHS AND SERIOUS INJURIES: PROGRESS MADE
consistent sign of acceleration: the rate of reduction in road deaths was relatively stable over the years
considering the distribution of results (Figure 2).
Box 1. Can cities make Vision Zero a reality? Lessons from Helsinki and Oslo
In 2019, both Oslo and Helsinki achieved zero deaths of pedestrians and cyclists. Lessons from Oslo and
Helsinki serve as valuable guidance for eliminating road deaths in urban areas. So far, none of the 158 cities
over 500 000 inhabitants in the Dekra Vision Zero Map has achieved zero road deaths across all
user groups.
The implementation of safe speed limits was a key factor in the success of both cities. Helsinki lowered
maximum speeds in 2018, and the new limits took force in 2019. As a result, streets in residential areas
and the city centre are limited to 30 km/h. On trunk roads, the speed limit is 50 km/h in suburban areas
and 40 km/h in the inner city. Oslo adopted similar speed limits, supported by Norway’s 2001 Vision
Zero strategy.
Cities act in multiple areas simultaneously to reduce road danger. Helsinki not only changed speed limits,
but also worked on street design, increased traffic police resources, facilitated the uptake of vehicle safety
technologies and improved emergency post-crash response. Oslo has also invested in limiting car use to
make streets safer for pedestrians and cyclists. The city reduced parking opportunities in the city centre,
built speed bumps, closed some streets to car traffic and implemented car-free zones around schools.
Large and long-term investments in public transport, walking and cycling facilities accompanied this
transformation.
Source: Dekra (2020), City of Helsinki (2020) and SmartCitiesWorld (2020).
Serious injuries drop 1.9% annually
Most cities achieved some reduction in serious injuries between 2010 and 2018: the median annual
reduction stands at 1.9%, resulting in a -14% change over eight years (Figure 3). However, the number of
serious injuries increased between 2010 and 2018 in seven out of 19 cities for which data is available. Here
again, the trend does not suggest any faster reduction in serious injuries in recent years.
One should bear in mind the difficulties of injury data collection and the difficulties in making comparisons
due to cities adopting different definitions. The ITF Safer City Streets database monitors two indicators for
the number of serious injuries:
1. the number of people hospitalised for 24 hours or more, excluding those who die within 30 days
(Figure 3)
2. the number of people whose injuries are assessed at level 3 or more on the Maximum Abbreviated
Injury Scale (MAIS), which is optimal for international comparisons but is used in fewer cities.
MONITORING PROGRESS IN URBAN ROAD SAFETY © OECD/ITF 2020 11REDUCING ROAD DEATHS AND SERIOUS INJURIES: PROGRESS MADE
Figure 3. Serious injuries since 2010
2010 2011 2012 2013 2014 2015 2016 2017 2018
+20%
+15%
+10%
+5%
% Difference from 2010
0
-5%
-10%
-15% -14%
-20%
-25%
-30%
Note: For each year, the dot represents the median percentage change since 2010 across 19 cities. Vertical bars
represent the inter-quartile range: observations between the 25th and the 75th percentiles.
Source: ITF Safer City Streets database.
Cycling casualties follow a different trend
Trends in traffic safety figures vary across transport modes. The reduction in the number of deaths and
serious injuries is slower among vulnerable road users and slowest among cyclists.
Since 2010, the number of pedestrian fatalities has fallen in 21 out of 26 cities. The rate of improvement,
however, is relatively low. Across all cities, pedestrian fatalities fell typically by 2.8% per year, adding up to
20% over eight years, using median values (Figure 4).
In each of the seven cities4 with the highest absolute numbers of fatalities, the number of pedestrian
deaths fell more slowly than car and truck occupant deaths. The rationale for looking at the largest cities,
those where road fatality numbers are highest, is to make the statistical analysis less vulnerable to the
natural fluctuation of small numbers.
Since 2010, the number of cycling fatalities has fallen in only 14 out of 26 cities. Considering median values
across 26 cities, the reduction in cycling fatalities stands at 1.8% per year, adding up to 14% over eight
years. In comparison, the number of car and truck occupant fatalities fell nearly three times faster, by 5.1%
per year, or 34% over the same period (Figure 4).
Serious injuries trends diverge even more across transport modes. The number of serious cycling injuries
increased in 11 cities, was stable in two cities, and fell in only four. Considering median values across
17 cities, the number of serious cycling injuries increased by 3.5% per year, or 32% over the eight-year
period. In comparison, the number of seriously injured fell across all other user groups. Among car and
truck occupants, they fell by 1.8% per year or 14% over the period (Figure 5).
12 MONITORING PROGRESS IN URBAN ROAD SAFETY © OECD/ITF 2020REDUCING ROAD DEATHS AND SERIOUS INJURIES: PROGRESS MADE
Figure 4. Road traffic deaths by mode, 2010-2018
+30%
+20%
+10%
0
-10% -14%
-20%
-20% -25%
-30% -34%
-40%
-50%
-60%
Pedestrian Bicycle Powered 2-Wheeler Other
Note: For each mode, the chart represents the median percentage change across 26 cities. Vertical bars represent
the inter-quartile range, which is the range of values observed in half of the cities. The number of deaths is
captured by a three-year average – i.e., a 2010 value represents the 2008-2010 average.
Source: ITF Safer City Streets database.
Figure 5. Serious injuries by mode, 2010-2018
+50%
+40%
+30%
+32%
+20%
+10%
0
-10% -12% -17% -14%
-20%
-30%
-40%
-50%
Pedestrian Bicycle Powered 2-Wheeler Other
Note: For each mode, the chart represents the median percentage change across 17 cities. Vertical bars represent
the inter-quartile range. The number of deaths is captured by a three-year average – i.e., a 2010 value represents
the 2008-2010 average.
Source: ITF Safer City Streets database.
MONITORING PROGRESS IN URBAN ROAD SAFETY © OECD/ITF 2020 13REDUCING ROAD DEATHS AND SERIOUS INJURIES: PROGRESS MADE
Is cycling getting more dangerous over time?
The share of cyclists is going up in the total number of road traffic victims, according to the trends
presented above. This raises the question: is cycling becoming more dangerous or more popular?
The number of bicycle trips increased in most cities between 2010 and 2018. It more than doubled in New
York City, Auckland and Vancouver. In nearly all cities, the number of trips increased more than the number
of cyclist deaths and injuries. As a result, the risk of death or injury per trip went down in most cities
(Figure 6).
Cycling is becoming safer over time in cities taking part in the Safer City Streets initiative. But, is it safe
enough for policy makers to encourage it? From the perspective of personal health, cycling is safe: it brings
health benefits that extend life expectancy even after the risk of collision is accounted for (Mueller et al.
2018). In addition, cycling is far safer than riding a motorcycle or a moped, as shown in the next chapter.
Some pieces of analysis include third-party crash victims for a more complete assessment of the risks
imposed on all road users. Shaun et al. (2018) examined mode choice in the male population aged 17-25
and found cycling to be safer than driving. Earlier research in the Safer City Streets programme concluded
that a bicycle trip in a dense urban area is less likely to result in road deaths than a car trip, regardless of
gender and age (ITF, 2019). City centres would become safer if walking, cycling and other forms of low-
speed micromobility replaced car and motorcycle trips (ITF, 2020c).
Figure 6. Cycling trips and risk per trip, 2010-2018
Trips Cyclist deaths per billion trips Serious injuries per billion trips
+150%
+100%
+50%
0
-50%
-100%
Note: The numbers of trips, deaths and injuries are captured by a three-year average. The chart, therefore,
represents the percentage change from the 2008-2010 average to the 2016-2018 average. Montreal: change in
trip numbers assumed equal to change in kilometres travelled.
Source: ITF Safer City Streets database.
14 MONITORING PROGRESS IN URBAN ROAD SAFETY © OECD/ITF 2020REDUCING ROAD DEATHS AND SERIOUS INJURIES: PROGRESS MADE
The recent increase in the number of cycling injuries hides substantial progress in cycling safety, but shows
that all stakeholders could do more. The Covid-19 pandemic has further accelerated growth in cycling,
underlining the case for road space redistribution (ITF, 2020b). With e-bikes, cargo-bikes, urban logistics,
e-scooters and other low-speed micro-vehicles on the rise, the demand for wide and safe cycle routes
could quickly outpace current supply. Cities need wide and safe cycle routes to accommodate the
predictable growth in cycling and need to support policies that allow for modal shift towards cycling.
Cities can outperform the national average
Several cities have outperformed the national-level fatality reduction figures: this is most remarkable in
Calgary, Buenos Aires, New York and Bogotá. The phenomenon is particularly striking in Calgary, thanks to
a combination of province and city-level factors. The province of Alberta upgraded its sanctions against
impaired driving in 2018 with the immediate suspension of a driver’s license on the roadside. Calgary
identified road safety as a priority and adopted Vision Zero with the launch of the city’s Safe Mobility Plan
(City of Calgary, 2015). The city implemented hundreds of 30 km/h zones, using traffic calming measures
to increase compliance with the lowered speed limits. The police created a new unit in 2016 dedicated to
traffic safety in high-risk areas such as school zones and other locations with high pedestrian activity
(Calgary Police Service, 2018).
Figure 7. Road traffic deaths by city and country, 2010-2018
City Whole country
+30%
+20% +4%
+3%
+10%
0
-11%
-8%
-38%
-29%
-25%
-22%
-20%
-48%
-45%
-39%
-35%
-32%
-30%
-29%
-29%
-25%
-23%
-23%
-22%
-21%
-21%
-20%
-18%
-15%
-5%
-10%
-5%
-20%
-30%
-40%
-50%
Note: The number of deaths is captured by a three-year average, in both cities and countries. The chart,
therefore, represents the percentage change from the 2008-2010 average to the 2016-2018 average.
Source: ITF’s IRTAD database, ITF’s Safer City Streets database.
MONITORING PROGRESS IN URBAN ROAD SAFETY © OECD/ITF 2020 15REDUCING ROAD DEATHS AND SERIOUS INJURIES: PROGRESS MADE
Buenos Aires, New York City and Bogotá also outperform the national casualty reduction figure in their
countries, thanks to consistent efforts to elaborate ambitious, data-driven road safety policies. Several
aspects of their work stand out as best practice and feature in a separate report by the ITF (2020a).
Progress was the fastest in Warsaw, Oslo and Barcelona. Warsaw shows rapid improvement from a low
base. Several initiatives have contributed to the rapid reduction in the number of road deaths. A bike share
system and a new metro line opened in 2012 and 2015 respectively. The network of cycle routes grew
from less than 200 km in 2010 to 640 km in 2019 (Warsaw Public Roads Authority, 2020). The design of
the new cycle routes includes physical separation from motorised traffic. The City Road Administration is
completing a safety audit and upgrade of more than 4 000 pedestrian crossings, collecting data on traffic
volume and speed distribution. Much room for further progress remains in Warsaw, as in the whole of
Poland, where inflation has eroded penalties for infringing traffic regulations, which have reportedly lost
their deterrent effect for speeding violations5.
Box 2. Functional Urban Areas: A common definition
The OECD and the European Commission have jointly developed a methodology to define functional urban
areas (FUAs) consistently across countries. A harmonised definition of urban areas as “functional economic
units” overcomes the limitations of administrative boundaries. This facilitates international comparisons
and policy analysis at the urban level. (OECD, 2012)
Functional urban areas are relevant units for territorial policy and spatial planning. An FUA consists of a
densely inhabited city and a surrounding area (commuting zone) whose labour market is highly integrated
with the city. For that, the methodology uses population density to identify urban cores and travel-to-work
flows to identify the hinterlands. (OECD, 2012)
Ten European FUAs are included in sections of this report focussed on benchmarking the risk of fatality
experienced by vulnerable road user groups (figures 9, 11 and 12). The ITF Safer City Streets database
contains a total of 41 FUAs. ITF (2019) has previously reported the road safety performances of
those FUAs.
In Oslo, decades of policies towards safe and active mobility have contributed to the rapid drop in road
fatalities. Since 1990, Oslo has had a congestion-charging zone, generating income that supports
investment in public transport. The city has also made notable efforts to cut speeds around schools and to
build protected bike routes. As a result, travel surveys reveal a rapid change in the mobility of residents.
The share of trips travelled by car dropped rapidly, from 37% in 2014 to 32% in 2018. People instead make
more trips on public transport and by bicycle (Oslo Municipality, 2020). Not a single pedestrian or cyclist
died in Oslo in 2019 (Murray, 2020).
Barcelona has received global media coverage for its programme of “superblocks”, which replaces
motorised through-traffic with people-friendly outdoor space for the community (Roberts, 2019).
However, this programme does not explain all of the rapid reduction in road fatalities between 2010 and
2018. Consistent long-term efforts to foster safe active and public transport options explains much of the
change observed. Engaged since 2012 with the ITF for the pilot phase of the Safer City Streets initiative,
Barcelona has developed a strong expertise for injury data analysis and elaborated effective data-driven
road safety policies (ITF, 2020a).
16 MONITORING PROGRESS IN URBAN ROAD SAFETY © OECD/ITF 2020BENCHMARKING URBAN ROAD SAFETY
Benchmarking urban road safety
The ITF published its first global benchmark for urban road safety in November 2018 (Santacreu, 2018b).
With data collected from 31 cities in 20 countries, the report revealed striking differences in road safety
performance between cities. The number of road fatalities in the benchmarked cities ranged from 0.9 to
24 deaths per 100 000 inhabitants, for the 2011-2015 period. The present report uses data over
2016-2018 to re-examine the differences between cities.
Mortality
Mortality is a concept widely adopted for the comparison of road deaths across countries. It is defined as
the ratio of road traffic deaths over the number of inhabitants. In cities, however, the number of
inhabitants does not always account for the true level of activity, and daytime population is used instead
to better reflect urban mobility (ITF, 2019). The number of fatalities recorded ranges from 0.6 to 10.3 per
100 000 daytime population (Figure 8). These new figures confirm the large performance gaps between
cities, and the scope for rapid progress where solutions are transposed from one city to another.
Figure 8. Road traffic deaths per 100 000 daytime population
10.3
9.3
6.0
5.9
4.7
4.2
3.6
3.4
2.8
2.6
2.4
2.3
2.2
2.1
2.1
1.8
1.8
1.6
1.6
1.4
1.4
1.4
1.4
1.3
1.3
1.3
1.2
1.2
1.2
1.2
1.0
1.0
0.8
0.6
Zürich
Milan
Oslo
Guadalajara area
Warsaw
Buenos Aires
Accra
Washington D.C.
Calgary
Rome
Montreal
Lisbon
Brussels
Edmonton
Bogotá D.C.
Barcelona
Inner London
Copenhagen
Paris area
Vancouver
Melbourne
Auckland
Fortaleza
Paris City
Bristol
New York City
Stockholm
Berlin
The Hague
Dublin City
Belgrade District
Greater Manchester
Greater London
Greater Buenos Aires
Note: 2016-2018 average. Daytime population is the sum of the resident population and the net influx of
commuters.
Source: ITF Safer City Streets database.
Mortality is lower in Inner London, Paris and Buenos Aires than in their respective metropolitan areas.
These recent observations confirm earlier analysis by the ITF (2019) showing that population density
MONITORING PROGRESS IN URBAN ROAD SAFETY © OECD/ITF 2020 17BENCHMARKING URBAN ROAD SAFETY
correlates with safety. The analysis revealed that mortality falls 20% as density doubles, which is likely due
to lower vehicle speed and greater use of public transport in more densely developed areas.
Pedestrian safety
This report measures the safety of walking. It computes two indicators that capture the likelihood of dying
in a crash while controlling for the number of trips walked or the number of kilometres walked. Santacreu
(2018b) first computed such risk indicator for benchmarking safety in cities. ITF (2019) subsequently scaled
up the analysis by including functional urban areas in England where walking data was available.
Figure 9. Pedestrian fatality risk across cities, 2014-2018 average
Deaths per billion kilometres walked
64
32
logarithmic scale
16
8
13
14
22
25
38
12
12
13
16
22
22
31
33
57
9
8
4
256
Deaths per billion trips walked
128
64
logarithmic scale
32
16
8
4
239
20
24
36
44
57
11
13
13
14
25
27
30
33
36
64
88
90
6
2
Note: Data was collected for the cities marked with (*) between 2011 and 2015. Vertical bars represent 80%
confidence intervals, based on the observed number of deaths.
Source: ITF Safer City Streets database.
18 MONITORING PROGRESS IN URBAN ROAD SAFETY © OECD/ITF 2020BENCHMARKING URBAN ROAD SAFETY
Oslo, Copenhagen, Paris, Berlin and Barcelona are the five safest cities to walk in. Together, the cities
average 11 pedestrian fatalities per billion trips walked, and ten pedestrian fatalities per billion kilometres
walked. Figure 9 shows consistent conclusions, whether one looks at risk per trip or per kilometre. Analysis
of the figure leads to the conclusion that Auckland and Vancouver must reduce pedestrian risk by a factor
of four to catch up with the “top five” cities.
Figure 9 includes confidence intervals, which reflect the statistical uncertainty that comes from the
observation of a relatively small number of events. The higher the number of pedestrian deaths in a city,
the more accurate the walking risk estimate.
Cycling safety
Figure 11 identifies Vancouver, Copenhagen, Oslo, Berlin and Montreal as the five safest cities for riding a
bike, averaging 18 fatalities per billion trips and five fatalities per billion kilometres. Several cities have
substantive room for progress, recording a risk at least ten times higher: these include Bogotá, Rome, and
the functional urban areas around the cities of Rome, Turin and Lisbon.
Box 3. Cycling safety in Vancouver: Design for all ages and abilities
In the past years, Vancouver has encouraged active mobility and the use of public transport. The city’s
Transportation Plan goal for 2020 of more than 50% of trips made by foot, bike or transit was already
achieved by 2016. Cycling deaths in Vancouver are rare. Only one such casualty occurred between 2014
and 2018, in spite of growing bicycle traffic, as measured by automated counters. The growth in cycling
and the low number of fatalities is the result of Vancouver’s efforts to make cycling safe.
To encourage the uptake of cycling, Vancouver placed safety high on the list of specifications for bike
infrastructure. The goal was that a larger spectrum of the population, including women, adopt the new
infrastructure. From the current bike network of 325 kilometres, 25% qualifies as safe and comfortable for
people of all ages and abilities (rated AAA) and follows specific design guidelines (Figure 10).
Figure 10. Vancouver’s guidelines for cycling facilities for people of all ages and abilities
Sources: City of Vancouver (2016, 2019).
MONITORING PROGRESS IN URBAN ROAD SAFETY © OECD/ITF 2020 19BENCHMARKING URBAN ROAD SAFETY
Figure 11. Cycling fatality risk across cities, 2014-2018 average
Deaths per billion passenger trips
1024
512
256
logarithmic scale
128
64
32
16
160
167
240
299
100
101
110
571
820
885
15
16
19
49
50
57
21
24
27
29
29
31
33
46
58
78
91
95
8
256
Deaths per billion passenger kilometres
128
64
logarithmic scale
32
16
8
4
2
192
178
11
11
19
32
10
11
11
11
18
18
22
30
32
35
65
6
9
3
4
6
9
1
Note: Data was collected for the cities marked with (*) between 2011 and 2015. Vancouver and Calgary:
2011-2018. Vertical bars represent 80% confidence intervals, based on the observed number of deaths.
Source: ITF Safer City Streets database.
To reduce risk, policy makers can reduce the speed of motor vehicles. This improves safety across all user
groups (ITF, 2018). To improve cycling safety specifically, the ITF recommends investing in protected and
connected cycle routes. A wide range of solutions exists. One consists of changing the circulation plan to
remove motorised through-traffic from residential streets. Another consists of allocating space for cycling,
with a physical separation. (Santacreu, 2018a).
The Covid-19 pandemic strongly affected mobility patterns during lockdown periods (ETSC, 2020) but may
also have triggered a permanent shift towards cycling in cities. Automatic counters in French cities
recorded a 33% increase in bicycle traffic in May and June 2020 (post-lockdown) in comparison to 2019
(Vélo et Territoires, 2020). Collecting bicycle traffic data – which is essential for monitoring the level of risk
– will be more important than ever in a context of disruption.
20 MONITORING PROGRESS IN URBAN ROAD SAFETY © OECD/ITF 2020BENCHMARKING URBAN ROAD SAFETY
Powered two-wheeler safety
Barcelona, Bristol, Milan, Paris and Berlin provide the safest environments for riding motorcycles and
scooters, with an average of 190 fatalities per billion trips or 24 fatalities per billion kilometres. In
comparison with risk levels observed in other modes, the risk of riding a motorcycle or a moped is very
high. In particular, the risk is five times higher than that of riding the same distance on a bicycle.
Warsaw, Calgary and Auckland record a powered two-wheeler fatality risk ten to 20 times higher than that
observed in Barcelona. This demonstrates once again that there remains considerable room for progress
in urban road safety policies.
Figure 12. Powered two-wheeler fatality risk across cities, 2014-2018 average
Deaths per billion passenger trips
2048
1024
logarithmic scale
512
256
128
1 067
1 126
2 364
64
173
210
276
354
104
366
400
458
600
32
256
Deaths per billion passenger kilometres
128
logarithmic scale
64
32
16
123
177
20
21
28
31
18
45
60
73
79
90
8
Note: Data was collected for the cities marked with (*) between 2011 and 2015. Vertical bars represent 80%
confidence intervals, based on the observed number of deaths.
Source: ITF Safer City Streets database.
MONITORING PROGRESS IN URBAN ROAD SAFETY © OECD/ITF 2020 21BENCHMARKING URBAN ROAD SAFETY
Road user behaviour
Between 19% and 89% of cyclists use a helmet, according to surveys and roadside observations in seven
locations (Table 1). Relatively few cities choose to monitor this indicator, as their cycling safety priorities
lie elsewhere. National level figures were submitted in lieu of city-level figures in Copenhagen and Warsaw.
Table 1 reveals the absence of a direct relationship between helmet wearing rates and cycling safety levels.
Denmark is one of the world’s safest countries for cycling (Santacreu, 2018a), despite only 35% of riders
wearing a helmet. With a helmet wearing rate of 89%, cycling in Auckland still remains five times more
likely to result in the loss of life than cycling in Copenhagen.
Table 1. Protective equipment wearing rate by city
City Helmet Seat belt in passenger cars
Bicycle Powered Child restraint Driver Front seat Rear seat
two-wheeler passengers passengers
Accra 72% 12% 80%
Auckland 89% 92% 97% 86%
Belgrade District 93% 57% 80% 76% 10%
Bogotá D.C. 97% 26% 90% 80% 8%
Bristol 98% 96% 88%
Brussels 44% 99% 92% 94% 93%
Buenos Aires 19% 82% 54% 65% 50% 17%
Copenhagen 35% 90% 96% 85%
Dublin City 44% 99% 94% 95% 80%
Fortaleza 86% 34% 82% 77% 30%
Melbourne 96% 97% 96% 96%
Montreal 44% 98% 98%
Oslo 95% 95% 95%
Stockholm 78% 100% 97% 97%
The Hague 68% 97% 97% 82%
Warsaw 99% 95% 94% 96% 60%
Note: average values of figures available between 2014 and 2018. Helmet wearing rates of Copenhagen and
Warsaw refer to national rates. Seat belt wearing rates of Auckland, Copenhagen and Oslo refer to national rates.
Source: ITF Safer City Streets database.
The value of helmets in protecting riders of motorcycles is uncontested and most cities record a rate of
helmet use above 90%. Table 1 nevertheless shows significant variation. Frequent collection of this
indicator could help authorities evaluate the success of their education and enforcement campaigns.
The use of seat belts remains far from universal in cities: it ranges from 50% to 98% on front seats. On rear
seats, the use of seat belts remains much lower. In Belgrade and Bogotá, no more than 10% of rear-seat
22 MONITORING PROGRESS IN URBAN ROAD SAFETY © OECD/ITF 2020BENCHMARKING URBAN ROAD SAFETY passengers wear a seat belt, whereas over 80% of drivers wear one. Policy makers should investigate which behavioural and vehicle design factors explain this phenomenon. Survey methods and definitions vary across countries. The figures in Table 1 thus require careful interpretation. More behaviours and attitudes are also worth monitoring and comparing across cities. Speed is, of course, a key factor in the occurrence and severity of crashes (ITF, 2018). The monitoring of speed and of attitudes towards speeding should be integrated into the Safer City Streets database but a consistent approach to monitoring speeds must first be developed. Who is killed in cities? Road deaths by mode and gender Pedestrians, cyclists and riders of powered two-wheelers represent over 50% of road traffic deaths in almost all cities taking part in ITF’s Safer City Streets initiative (Figure 13). Vulnerable road users (VRUs) represent between 77% and 94% of road fatalities in the six most densely populated cities, those with over 10 000 inhabitants per square kilometre. The over-representation of VRUs in casualty statistics explains why road safety policies in urban areas tend to focus on protecting these users. This involves measures such as lowering speed limits, enforcing speed limits and redistributing road space. Figure 13 is valuable in setting policy priorities. It should not, however, be interpreted as a risk analysis: the very high proportion of cyclists killed in The Hague and Copenhagen is due to a large proportion of cycling trips, rather than a risky cycling environment. Figure 11 earlier showed that the two cities are among the world’s safest places to ride a bicycle. Men are over-represented in road traffic deaths. In the vast majority of cities, they are two or more times more likely to die in traffic, in comparison to women (Figure 14). The use of powered two-wheelers could explain some of the differences between cities. Riders of motorcycles and mopeds represent at least three in ten road fatalities in Barcelona, Bogotá, Buenos Aires, Fortaleza and Rome, the cities in which men are at least three times more likely than women to die in traffic. The city of Buenos Aires explored road fatalities by gender and age to better understand the victims’ profiles. What emerged is a gender-specific pattern of traffic deaths: around 70% of women who died in traffic were pedestrians, while 60% of the men were motorcyclists. The differences also apply by age group: fatalities of pedestrians are most common among people over 55 years old, while motorcyclist deaths peak between 25 and 34 years old. (GCBA, 2020) A policy focus on male drivers and riders could help some cities reduce their overall mortality figures. Cities with the highest overall mortality are those where male and female mortality differs the most. The five cities with a male/female mortality ratio greater than three are also the cities with the highest mortality rates (Figure 8). These are Fortaleza, Belgrade District, Bogotá, Rome and Buenos Aires. MONITORING PROGRESS IN URBAN ROAD SAFETY © OECD/ITF 2020 23
BENCHMARKING URBAN ROAD SAFETY

                               Figure 13. Modal share of road fatalities by city, 2014-2018

                                  Pedestrian     Bicycle         Powered two-wheeler           Other

             Paris City                       50%                                 8%                 36%
          Bogotá D.C.                         50%                                 11%                31%
        Inner London                            55%                                     14%             23%
            Barcelona                      42%                         5%                   45%
             Fortaleza                   35%                 7%                          45%
           Dublin City                     42%                               19%    25%
                 Accra                                     69%                    3% 13%
                  Oslo                         52%                          24%         10%
            Paris area                      45%                 5%            35%
      Greater London                           52%                    8%          24%
         Buenos Aires                   36%             3%              40%
                 Milan                    40%               10%             30%
                 Berlin                  38%                      25%            15%
           The Hague                 27%                      38%                 14%
                Zürich                   38%                     25%            16%
              Warsaw                               59%                     7%     12%
         Copenhagen                  28%                     35%                15%
        New York City                             56%                     8%     12%
            Montreal                            53%                    10%     9%
           Stockholm                       42%                 12%         19%
           Vancouver                                62%                       7%
                 Rome                    37%             3%          29%
  Greater Manchester                         46%                 6%      16%
                Lisbon                      44%                    18%
                Bristol                  38%             3%     18%
           Edmonton                      37%                  14%
          Melbourne                24%           5%      21%
               Calgary                 34%                 15%
     Belgrade District                    39%                 7%
             Auckland            17%      3%     16%
                          0%               20%                   40%                   60%               80%         100%
        High density                           51%                                7%               28%
      Medium density                        43%                             12%              22%
         Low density                      39%                      10%            16%
                          0%       10%     20%     30%           40%        50%        60%    70%        80%   90%   100%
Note: average values of figures available between 2014 and 2018. Low population density (n=13) is less than
5 000 inhabitants per square kilometre, medium (n=11) is less than 10 000, high (n=6) is 10 000 and above.
Where cities are grouped, the chart presents the unweighted average across cities in the group.

Source: ITF Safer City Streets database.

 24                                                                MONITORING PROGRESS IN URBAN ROAD SAFETY © OECD/ITF 2020
BENCHMARKING URBAN ROAD SAFETY
Figure 14. Ratio between male and female fatalities
Zürich 0.9
Edmonton 1.5
Vancouver 1.5
Warsaw 2.0
Montreal 2.0
Stockholm 2.4
Copenhagen 2.4
New York City 2.4
Auckland 2.7
Inner London 2.7
Melbourne 2.9
Greater Manchester 3.0
Greater London 3.0
Belgrade District 3.1
Calgary 3.2
Barcelona 3.3
Buenos Aires 3.7
Rome 3.7
Bogotá D.C. 3.9
Accra 4.0
Bristol 4.7
Fortaleza 4.9
Note: 2014-2018 average. The ratio controls for male and female resident population but does not control for
differences in mobility patterns.
Source: ITF Safer City Streets database.
Alternative road safety indicators
There are several alternative road safety indicators, frequently used for the additional insights they
provide. All three indicators presented in this section share a common focus on the number of road traffic
fatalities – that is the sum of road deaths across all modes – but differ in the choice of denominator: the
value used to normalise the absolute number of fatalities and make it comparable across cities. The first
controls for the size of the vehicle fleet, the second for the volume of traffic, and the third for the length
of the road network.
Figure 15 shows a number of fatalities over thirty times higher in Fortaleza than in Oslo and over one
hundred times higher in Accra than in Oslo, controlling for fleet size6. This supports the case for an
alignment towards high vehicle safety standards all over the world. Standards for safe vehicles include
active safety technologies, such as Intelligent Speed Assistance, but also passive safety solutions to reduce
the impact of a crash not just on car occupants but also on pedestrians and on all third parties in general.
ITF (2019) reported figures from Bogotá where seven out of eight people killed in a crash involving a car
were vulnerable road users.
MONITORING PROGRESS IN URBAN ROAD SAFETY © OECD/ITF 2020 25BENCHMARKING URBAN ROAD SAFETY
Figure 15. Number of fatalities per year per 10 000 vehicles registered, 2014-2018
Oslo 0.1
Stockholm 0.2
Bristol 0.3
Melbourne 0.3
Montreal 0.3
The Hague 0.3
Barcelona 0.3
Berlin 0.3
Warsaw 0.4
Brussels 0.4
Edmonton 0.4
Vancouver 0.4
Auckland 0.4
Greater London 0.4
Greater Manchester 0.4
Calgary 0.5
Milan 0.5
Paris City 0.6
Copenhagen 0.7
Inner London 0.7
Rome 0.7
Buenos Aires 0.9
New York City 1.1
Belgrade District 1.9
Bogotá D.C. 2.6
Fortaleza 3.3
Accra 17.7
logarithmic scale
Note: average values of figures available between 2014 and 2018.
Source: ITF Safer City Streets database.
Figure 16. Number of fatalities per billion vehicle-kilometres, 2014-2018
Melbourne 2.8
Bristol 3.5
Auckland 3.7
Greater London 4.3
Vancouver 5.2
Copenhagen 5.2
Barcelona 6.5
Brussels 7.4
Note: average values of figures available between 2014 and 2018. Vehicle traffic includes all types of road motor
vehicles subject to registration. It excludes pedal cycles but includes mopeds, motorcycles, cars, goods vehicles
and buses.
Source: ITF Safer City Streets database.
26 MONITORING PROGRESS IN URBAN ROAD SAFETY © OECD/ITF 2020BENCHMARKING URBAN ROAD SAFETY
Figure 16 shows that Brussels has almost three times more fatalities than Melbourne, when controlling for
traffic volumes. This indicator generally reveals higher fatality rates in areas that are the most densely
populated, likely because of a high number of vulnerable road users (VRUs) and the high likelihood of
conflict between VRUs and motor vehicles.
Figure 17 shows that Fortaleza has fifty times more fatalities than Oslo, controlling for the length of the
road network. This indicator reflects differences in the urban fabric, with some cities having larger blocks
served by wider, busier streets. Such cities would particularly benefit from considerable changes in street
design. New street design could prevent speeding and reallocate space to safer transport options: walking,
cycling and public transport.
Figure 17. Number of road deaths per year and per 1 000 kilometres of road network length
Oslo 1
Calgary 1
Stockholm* 3
Melbourne 4
Edmonton 4
Greater Manchester 6
Lisbon* 6
Montreal* 6
The Hague 7
Bristol 7
Auckland 7
Dublin City* 8
Greater London 8
Berlin* 8
Vancouver 9
Paris area 10
Zürich 11
Inner London 12
Brussels* 13
Rome 15
New York City 19
Belgrade District* 19
Barcelona 19
Warsaw 20
Riga* 22
Bogotá D.C. 39
Buenos Aires 48
Fortaleza 59
0 10 20 30 40 50 60
Notes: 2016-2018 average. Cities marked with (*) have their data collected over 2013-2015.
Source: ITF Safer City Streets database.
MONITORING PROGRESS IN URBAN ROAD SAFETY © OECD/ITF 2020 27You can also read