Ice Thickness Estimation from Geophysical Investigations on the Terminal Lobes of Belvedere Glacier (NW Italian Alps) - MDPI
←
→
Page content transcription
If your browser does not render page correctly, please read the page content below
Article
Ice Thickness Estimation from Geophysical
Investigations on the Terminal Lobes of Belvedere
Glacier (NW Italian Alps)
Chiara Colombero 1,*, Cesare Comina 2, Emanuele De Toma 2, Diego Franco 1 and Alberto Godio 1
 1 Department of Environment, Land and Infrastructure Engineering (DIATI), Politecnico di Torino,
   10129 Torino, Italy; diego.franco@polito.it (D.F.); alberto.godio@polito.it (A.G.)
 2 Department of Earth Sciences (DST), Università degli Studi di Torino, 10125 Torino, Italy;

   cesare.comina@unito.it (C.C.); emanuele.detoma@edu.unito.it (E.D.T.)
 * Correspondence: chiara.colombero@polito.it

 Received: 27 February 2019; Accepted: 2 April 2019; Published: 3 April 2019

 Abstract: Alpine glaciers are key components of local and regional hydrogeological cycles and real-
 time indicators of climate change. Volume variations are primary targets of investigation for the
 understanding of ongoing modifications and the forecast of possible future scenarios. These
 fluctuations can be traced from time-lapse monitoring of the glacier topography. A detailed
 reconstruction of the ice bottom morphology is however needed to provide total volume and
 reliable mass balance estimations. Non-destructive geophysical techniques can support these
 investigations. With the aim of characterizing ice bottom depth, ground-penetrating radar (GPR)
 profiles and single-station passive seismic measurements were acquired on the terminal lobes of
 Belvedere Glacier (NW Italian Alps). The glacier is covered by blocks and debris and its rough
 topography is rapidly evolving in last years, with opening and relocation of crevasses and diffuse
 instabilities in the frontal sectors. Despite the challenging working environment, ground-based GPR
 surveys were performed in the period 2016–2018, using 70-MHz and 40-MHz antennas. The 3D ice
 bottom morphology was reconstructed for both frontal lobes and a detailed ice thickness map was
 obtained. GPR results also suggested some information on ice bottom properties. The glacier was
 found to probably lay on a thick sequence (more than 40 m) of subglacial deposits, rather than on
 stiff bedrock. Week deeper reflectors were identified only in the frontal portion of the northern lobe.
 These interfaces may indicate the bedrock presence at a depth of around 80 m from the topographic
 surface, rapidly deepening upstream. Single-station passive seismic measurements, processed with
 the horizontal-to-vertical spectral ratio (HVSR) method, pointed out the absence of sharp vertical
 contrast in acoustic impedance between ice and bottom materials, globally confirming the
 hypotheses made on GPR results. The obtained results have been compared with previous
 independent geophysical investigations, performed in 1961 and 1985, with the same aim of ice
 thickness estimation. The comparison allowed us to validate the results obtained in the different
 surveys, supply a reference base map for the glacier bottom morphology and potentially study ice
 thickness variations over time.

 Keywords: Alpine glaciers; Belvedere Glacier; ice thickness estimation; ice bottom morphology and
 properties; ground-penetrating radar (GPR); single-station passive seismic measurements;
 horizontal-to-vertical spectral ratio (HVSR)

1. Introduction
    Mountain glaciers are visible indicators of climate change, providing some of the clearest
evidence of global warming, perturbation in the atmospheric flow pattern and consequent

Remote Sens. 2019, 11, 805; doi:10.3390/rs11070805                         www.mdpi.com/journal/remotesensing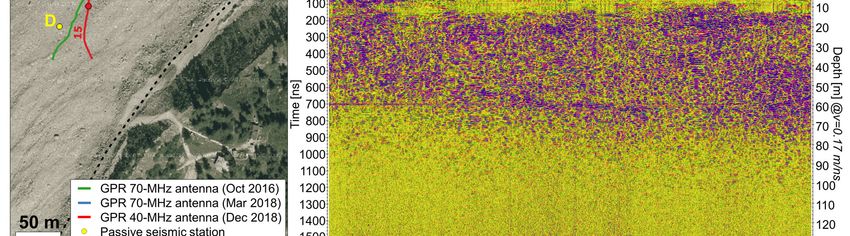
Remote Sens. 2019, 11, 805                                                                       2 of 19

precipitation regime. Due to their relatively small size and high mass turnover rates, these glacial
bodies demonstrate extremely sensitive to temperature and precipitation modifications [1,2]. For the
European continent, Alpine glaciers are a key component of local and regional hydrogeological
cycles. The globally observed retreat of these ice masses over the last century has significant impacts
on the surrounding environment, affecting both physical and socioeconomic systems [3–5]. The loss
of freshwater storage and its consequent release into seas and oceans, modifications in resource
availability for water consumption, irrigation and power generation, glacier-related natural hazards
(e.g., landslides, avalanches and outburst of glacial lakes, causing floods and debris flows) are
between the potential consequences of the general shrinkage trend.
      Variations in glacier volume and mass are therefore primary targets of investigation for the
understanding of ongoing modifications and the forecast of possible future scenarios. Remote sensing
techniques (e.g., geodetic surveys, satellite images, GNSS or LiDAR surveys) can help to monitor
these fluctuations [6–9] from accurate time-lapse reconstructions of the topographic surface of the
glacier. Comprehensive knowledge of the ice bottom depth and morphology is however needed to
provide a total volume estimate and reliable mass balance evaluations [10–12]. Ice thickness
characterization and monitoring are also of primary importance for the modeling of future glacier
dynamics [13], hydrological projections [14], glacier-related natural hazards [15] and ice core analyses
[16].
      Traditional glaciological measurements, i.e., local probe deployment for snow and firn/ice
thickness variations or density measurements, are usually limited to the shallowest part of the glacier
and do not extensively cover wide areas of investigations. Despite their relevance, ice bottom depth
and morphology are often poorly known, mainly due to inadequate characterization methods and
logistical issues. Geophysical methods can overcome these limitations, mitigating the operational
efforts and enlarging the depth of investigation and data density of traditional techniques.
      In the last decades, the ground-penetrating radar (GPR) technique has assumed an increasingly
important role in the glacial exploration for the imaging of subsurface conditions [17]. The non-
magnetic and low-conductive snow/ice column is indeed generally favorable for the efficient
propagation of electromagnetic (EM) pulses, enabling a successful mapping of bottom morphology.
In addition, GPR can also help in the evaluation of the glacier bottom properties, the search for
internal water floods or underground channels and the recognition of internal glacial structures (as
snow layering and crevasses detection). Several GPR applications are reported in the literature on
Arctic and Antarctic ice caps and high-elevation icefields of the Tibetan Plateau [18–21]. Growing
applications are also recorded in the Alpine context. Del Longo et al. [22] acquired GPR profiles on a
Dolomitic glacier to identify the ice bottom depth. Binder et al. [23] investigated two glaciers in the
Austrian Alps, for determination of total ice volume and ice-thickness distribution. Merz et al. [24]
acquired a dense grid of helicopter-borne GPR, combined with ground-based seismic and geoelectric
profiles, on a rock glacier of western Swiss Alps to reconstruct the 3D bedrock topography. Airborne
GPR surveying generally overcomes problems in accessibility of the steeper glacier sectors and wave
scattering on large boulders in close vicinity of the antenna, which are particularly disturbing in case
of debris-cover and rock glaciers. Dossi et al. [25] performed quantitative 3D GPR analysis to estimate
the total volume and water content of a glacier in Eastern Alps.
      Techniques complementary to GPR surveys have also been applied. Maurer and Hauck [26]
reviewed possible additional methods and proposed the joint interpretation of GPR, geoelectric and
seismic surveys for analyzing the subsurface conditions of two rock glaciers in the Eastern Swiss
Alps, with a special focus on the distribution of ice and water, the occurrence of shear horizons and
the bedrock topography. However, geoelectric and reflection seismic methods require long arrays to
reach considerable investigation depths and high-resolution imaging of the glacier subsurface, thus
complicating field operations. Single-station passive seismic measurements may offer an effective
and logistically affordable method to mitigate the problems of multi-channel active surveys, thanks
to the use of portable and compact broadband seismometers and no need of energetic active sources.
Picotti et al. [27] presented a pioneer study on the application of single-station passive measurements
to determine ice thickness on five Alpine glaciers. Data were processed with the horizontal-to-vertical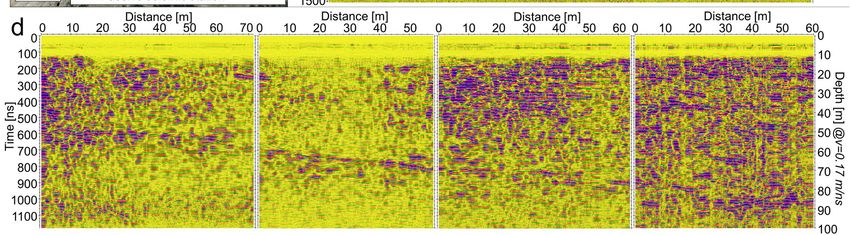
Remote Sens. 2019, 11, 805                                                                           3 of 19

spectral ratio (HVSR, [28,29]) technique and validated using GPR, geoelectric and active seismic
profiling methods. The HVSR method is based on the computation of the ratio between the spectra
of the horizontal and vertical components of a triaxial seismic station, to retrieve the fundamental
resonance frequency of a site [30,31]. Generally, the resonance originates from the trapping of seismic
waves in sites with sufficiently high S-wave impedance contrast (e.g., soft sediments overlying a stiff
bedrock). For these sites, a clear peak is found in the HVSR curve. The frequency of this peak is related
to the depth of the interface between the two materials [32]. The origin of the HVSR peak is still
debated and generally related to a superposition of Rayleigh-, Love- and/or shear-wave resonances
[33].
      In a glacial environment, the impedance contrast between ice and bedrock is expected to
generate resonance phenomena and similar effects on the HVSR curves. Comparing HVSR data with
other geophysical imaging results, Picotti et al. [27] showed that the resonance frequency depicted in
the HVSR curves is correlated with the ice thickness at the site, in a wide range of ice bottom depths,
from few tens of meters to more than 800 m. The reliability of the method mainly depends on the
coupling of the sensor at the glacier surface and on the basal impedance contrast. However, beside
the intrinsic limitation of the 1D approximation, very few Alpine glaciers lay directly on stiff bedrock
for all their extent, while a basal layer of subglacial deposits and debris of significant thickness is
generally present below the ablation zone [34], thus attenuating the vertical impedance contrast.
      In this study, we acquired both GPR profiles and single-station passive seismic measurements
on the terminal lobes of the debris-covered Belvedere Glacier (Macugnaga, NW Italian Alps), with
the aim of ice thickness estimation and bottom morphology reconstruction. Very poor and conflicting
reference information on ice thickness is indeed available for the glacier, from previous geophysical
investigation attempts [35,36]. GPR data acquired in different seasons and with different antennas
were processed and manual picking of the bottom surface was performed on the radargrams showing
the clearest subsurface imaging. Retrieved ice depths were then spatially interpolated to reconstruct
the 3D bottom morphology and compared with previous geophysical results [35,36]. Some single-
station passive seismic tests were performed in the same area imagined with GPR profiles. Seismic
recordings were processed with the HVSR method and interpreted in the light of the GPR results, for
a combined evaluation attempt of the ice bottom morphology and properties.

2. Study Site
      Belvedere Glacier is a debris-covered glacier located NE of the highest peaks of Monte Rosa
Massif, in NW Italian Alps (Figure 1). Thanks to the debris cover and the favorable solar exposure,
its frontal sectors reach considerably low altitudes and end approximately 2 km W of Macugnaga
(VB). Belvedere Glacier represents the terminus of four higher-elevation glaciers (Nordend, Monte
Rosa, Signal and Northern Locce Glaciers). Measurements of the Italian Glaciological Committee
(CGI-CNR, http://www.glaciologia.it/i-ghiacciai-italiani) carried out in 2006 indicated a surface area
of 1.46 km2, a maximum length of 3091 m, spanning in elevation from 2397 m to 1770 m above sea
level (a.s.l.), with an average slope of 8°. The terminal portion of the glacier is bilobate. Both lobes are
currently exhibiting a visible retreat. Nowadays, the bigger N lobe has an average length of 650 m,
reaching a minimum elevation of about 1810 m a.s.l. (i.e., 40 m higher than measurements of 2006),
while the S lobe has a length of 350 m, reaching an elevation of 1840 m a.s.l. at its front. The two lobes
are separated by a median morainic relief, hosting the chair lift station and the Belvedere Mountain
Hut (Figure 1).
Remote Sens. 2019, 11, 805                                                                                 4 of 19

      Figure 1. (a) Geographical location and (b) aerial view of the north-eastern glaciers of the Monte Rosa
      Massif. The main glacial masses are delimited by light blue areas (modified from the Italian
      Glaciological Committee (CGI-CNR), http://www.glaciologia.it/i-ghiacciai-italiani).

      Despite several glaciological studies were carried out on site since the beginning of the 20th
century [37,38], the first attempt towards ice thickness characterization is reported by De Visintini
[35]. P-wave reflection seismic measurements were indeed carried out on the glacier in 1957 for ice
bottom contouring. Explosive sources were adopted, and the active shots were recorded with a 12-
channel analog seismograph. Seven local areas of the glacier were surveyed with seismic profiling,
from the vicinity of the Zamboni Zappa Mountain Hut (Figure 1), down to the confluence between
the two lobes. A global contour map of ice bottom depth was achieved from the interpolation of these
measurements, even if some glaciers parts (e.g., the two terminal lobes) were not investigated during
this survey.
      A later study by VAW-ETH [36] was performed using the GPR technique, with the aim of
completing ice bottom characterization in unexplored compartments. A low-frequency GPR
instrumentation (USGS Monopulse-radar, with variable central frequency in the range 1–5 MHz) was
adopted, with 40 sparse measurements located along 9 transverse profiles covering almost all the
glacier length. For each measurement, the time delays between the transmitted EM pulse and the
received echoes were recorded. The highest-amplitudes echoes were referred to ice bottom
reflections, their depth was estimated from the time delay (considering a constant velocity of the EM
pulse in ice) and an interpretation of the bottom morphology was retrieved from data interpolation
along the 9 cross-sections.
      In the upper part of the glacier (W and SW of Zamboni Zappa Mountain Hut) both radar and
seismic results seemed to locate the bedrock at depths of 200–250 m. Progressing northwards, major
discrepancies in ice bottom determination arose between the two techniques. Particularly, radar
bottom reflectors were found to be located approximately 100 m higher than the seismic reflectors in
the central part of the glacier. The two techniques, sensitive to different physical changes in the
subsurface, seemed therefore to identify different interfaces. This difference in ice bottom location
was interpreted as the result of the presence of a layer of subglacial deposits with relevant thickness
(up to more than 100 m in the central part of the glacier) between ice and bedrock. Glacial deposits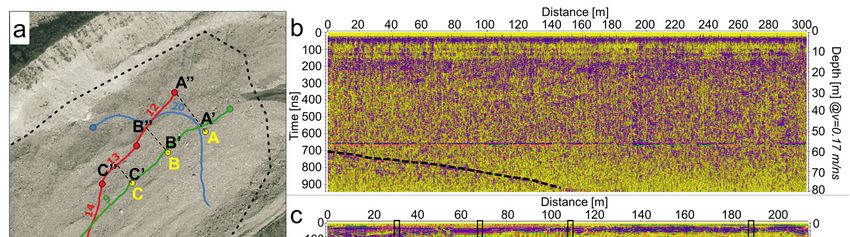
Remote Sens. 2019, 11, 805                                                                         5 of 19

revealed transparent to the seismic reflection profiling, but were identified by the radar investigation,
probably due to the significant contrast in electrical properties between these sediments and ice.
      In a more recent work, Diolaiuti et al. [39] estimated the changes in ice volume between 1957
and 1991 and measured the debris thickness above the whole glacier area. The debris cover was
indeed found to slow down the ablation rate of Belvedere Glacier, with respect to other similar
glaciers of the same region lacking this peculiarity. A contour map of ice thickness was also presented.
However, this map was based just on the results of reflection seismic [35] and did not consider the
possible lower ice thicknesses, due to the presence of thick subglacial deposits, as highlighted by the
later radar study [36].
      In the last decades, geophysical prospection experienced greatly advanced in instrumentation,
acquisition and processing techniques. Digital multi-channel recordings and high-sampling big data
storage capacities allow for continuous radar profiling with respect to the study of VAW-ETH [36].
Passive seismic acquisitions require lighter instrumentation and no active sources with respect to the
measurements of De Visintini [35]. At the light of these advances, new geophysical prospections at
the site can therefore help in understanding the discrepancies between the previous works and
provide new and more extensive information on the glacier bottom morphology and properties.
Despite these considerations, the presence of blocks and debris with variable thickness and lateral
distribution at the surface, the rough topography and heterogeneities inside the investigated glacial
mass deeply complicate data acquisition and potentially affect the quality of the final results.

3. Methods

3.1. Ground-Penetrating Radar
      Several GPR campaigns were carried out at the Belvedere Glacier between 2016 and 2018. In
October 2016, 29 GPR profiles were acquired with an air-coupled 70-MHz GPR monostatic antenna
(Subecho-70, Radarteam), for a total surveyed length of 2169 m (blue traces in Figure 2). The antenna
was connected to an IDS K2 TR200 acquisition unit and manually transported above the ground
surface. Traces were recorded for a total length of 1000 ns, with a sampling of 1024 samples/trace,
and georeferenced by means of a GPS Ublox EVK-5T system.
      In March 2018, 22 radar profiles were acquired with the same air-coupled 70-MHz antenna
(green traces in Figure 2) transported on skis, for a total length of 2696 m of acquisitions (trace length
= 2000 ns, 2048 samples/trace).
      Finally, in December 2018 a lower frequency (40 MHz, Subecho-40, Radarteam) air-coupled
antenna was manually moved along 15 profiles (red traces in Figure 2) focused on the terminal sector
of the northern lobe of the glacier, for a total length of 2169 m of acquisitions (total recorded trace
length = 1200 ns, 1024 samples/trace). The acquisition setup is shown in Figure 3a. The same
acquisition unit and georeferencing instruments of October 2016 were adopted in all the later
campaigns. In all surveys, the snow cover on site was limited (from absent to a few tens of centimeters
on the debris cover). Unfortunately, due to the rough and rapidly evolving topography of the glacier
along the years, the opening and/or relocation of crevasses and diffuse instabilities in the frontal
sectors, it was not possible to follow the same profiles in each survey operating in safe conditions. In
addition, due to the shape of both low-frequency antennas and the encountered topographic
conditions, it was not possible to direct drag the instruments on the glacier surface to maximize the
coupling. In each survey, the antenna was consequently maintained a few centimeters above the thin
layer of snow partially hiding the cover of blocks and debris of the glacier (Figure 3a).
      Data processing was performed in ReflexW software. A basic processing procedure was
adopted: (i) Start time of each trace was shifted to delete samples before the main bang and obtain
exact zero time; (ii) low-frequency components were removed (dewow); (iii) high-pass horizontal
filtering was applied to remove horizontally coherent components (background removal); (iv)
geometrical spreading correction was applied, to gain signal amplitude with depth (divergence
compensation).
Remote Sens. 2019, 11, 805 6 of 19
Manual picking of the ice bottom reflections was finally performed on the processed time
sections. Due to the reduced snow cover during the surveys, the picking of the reference glacier
topography (corresponding to the top of the debris cover) was neglected. A uniform ice velocity of
0.17 m/ns was considered for a time to depth conversion, disregarding the top debris cover. The latter
is expected to have significant lateral and vertical variations, from a few centimeters up to a metric
thickness in correspondence of boulders and blocks.
Figure 2. Geophysical surveys carried out at the Belvedere Glacier. Green lines: 70-MHz ground-
penetrating radar (GPR) profiles acquired on October 2016; blue lines: 70-MHz GPR profiles acquired
on March 2018; red lines: 40-MHz GPR profiles acquired on December 2018. GPR profiles are labelled
with a progressive number for each survey. Yellow dots (AD): Single-station passive seismic
measurements (HVSR method). Orange lines (FF’ and GG’): Past cross-sections of the glacier
interpreted from radar measurements, from VAW-ETH [36]. The background orthophoto was
acquired during summer 2015 (AGEA 2015, RGB orthophoto, WMS service at
www.geoportale.piemonte.it). The black dashed line highlights the approximate glacier perimeter in
October 2016 (first GPR campaign).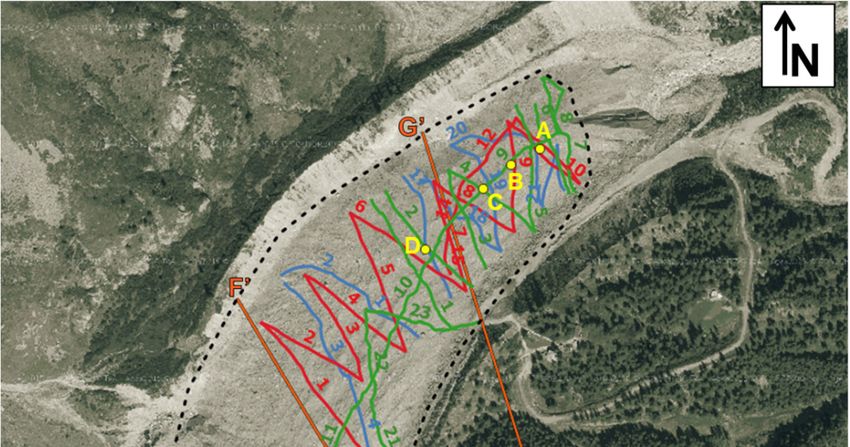
Remote Sens. 2019, 11, 805                                                                               7 of 19

      Figure 3. On-site operations for GPR and passive seismic acquisitions. (a) GPR instrumentation and
      acquisition setup. Note that the GPR antenna is not ground-coupled, but maintained a few
      centimeters above the ground surface during acquisition. (b–e) Installation of the broadband triaxial
      seismometer and passive seismic instrumentation details.

3.2. Single-Station Passive Seismic Measurements
     Four single-station passive seismic measurements were carried out on the N lobe of the
Belvedere Glacier (A to D, in Figure 2). A 3-D 1-Hz broadband seismometer (L-4-3D, Sercel Inc.)
connected to a 24-bit 3-channel digitizer was adopted for the acquisitions. To obtain the best coupling
between sensor and ice, the surface layers of snow, ice, and debris were removed. The 3D
seismometer was placed in direct contact with compact ice and then buried with the excavated
materials to minimize external noise (Figure 3b to Figure 3e). At each station, noise recording lasted
from 30 to 45 minutes, with a sampling frequency of 100 Hz.
     Details on the theoretical formulation and assumption underling the application of the HVSR
methods in a glacial environment can be found in Picotti et al. [27]. If the width of the glacier is
considerably larger than the ice thickness, the subsurface conditions can be approximated with a 1D
model for which:

                                                        =       ,                                             (1)
                                                            4
where f0 is the resonance frequency depicted from the HVSR curve, VS is the average S-wave velocity
of ice and H is the ice thickness. If 2D effects are present at the station, f0 value should be multiplied
by correcting factors accounting for the shape of the basin [27,40]. Station locations along the axial
position of the N lobe were chosen to minimize 2D lateral effects, due to the valley sides.
     HVSR computation was carried out in Geopsy software. The original recordings (30–45 minutes)
were divided into 120-s non-overlapping windows. An anti-triggering STA/LTA (short time average
over long time average) algorithm was applied to each time window. This filtering procedure is based
on the computation of the average signal amplitude over short (STA = 1 s) and long (LTA = 30 s)
moving windows. If the STA/LTA ratio exceeds user-defined thresholds (STA/LTA < 0.2 or STA/LTA
> 2.5, in this study), the window is filtered out from further computations. Otherwise, amplitude
spectra of the horizontal components are combined using vector summation and the horizontal to
vertical spectral ratio is computed. A smoothing function, with a 10% cosine taper and a bandwidth
coefficient of 30 [32], was then applied to the resulting HVSR curve to ensure a constant number of
points at low and high frequencies. This computation was repeated for all the 120-s windows passing
the anti-triggering filter. The average curve and the standard deviation over the accepted HVSR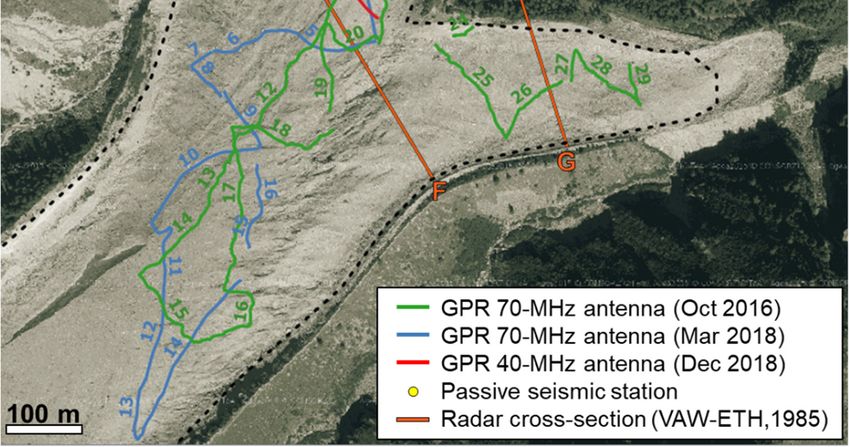
Remote Sens. 2019, 11, 805                                                                     8 of 19

curves were finally obtained. The spatial directivity of the HVSR peaks was computed using the same
processing parameters, to check for the absence of 2D effects on the detected resonance frequencies.
    The results were analyzed to search for HVSR peaks clearly indicating the presence of sharp
subsurface contrasts in acoustic impedance and potentially estimate their embedment depth. Since
no clear peaks were detected, further processing attempts, including inverse [41] or forward
modeling [42,43] of the measured HVSR curves were not undertaken.

4. Results

4.1. Ground-Penetrating Radar
     Representative radargrams obtained from the three GPR campaigns are shown in Figure 4. Some
clear artifacts, due to electromagnetic noise are still visible in the data, even after the described
processing sequence, e.g., the horizontal events at 650 ns and 700 ns in Figure 4b and Figure 4c. The
overall data quality is very poor if compared with the typical S/N ratio of GPR data acquired on other
glaciers. High scattering is noticed along the profiles, with extremely high attenuation of the EM
signals with depth. Not always clear readability in the processed profiles was observed for the 70-
MHz surveys. Even increasing the total recording time (Figure 4c compared to Figure 4b), no
reflections were observable in the data below 900 ns. Better results were obtained with the 40-MHz
antenna (Figure 4d). In these radargrams, reflections appear more clearly and can be spatially
followed and correlated between adjacent profiles. An exemplificative marked interpretation of the
ice bottom morphology on the radargrams of Figure 4 is reported in Figure 5. Similar interpretations
have been performed on the remaining profiles of the different campaigns for which ice bottom
picking was clear and reliable.
     The ice bottom appears as a discontinuous reflecting horizon in all the surveys. Layering with
different orientations is noticed in some parts of the radargrams at the ice bottom location (e.g.,
distance = 38 m, time = 1000 ns in profile 15 of Figure 4d and Figure 5d). A low-amplitude reflector
deeper than the ice bottom is depicted in profile 12 of Figure 4d and Figure 5d. This interface is
characterized by a steeper dipping with respect to the ice bottom, in dip direction opposite to the
glacier movement, reaching times higher than 1150 ns (depth > 100 m) in the center of the profile, at
a distance of approximately 120 m from the glacier front.
     In Figure 5c and Figure 5d, the approximate locations (A’ to D’ and A’’ to D’’) of the single-
station passive seismic measurements (A to D) are projected on the GPR sections, for further
comparisons between the two geophysical methods.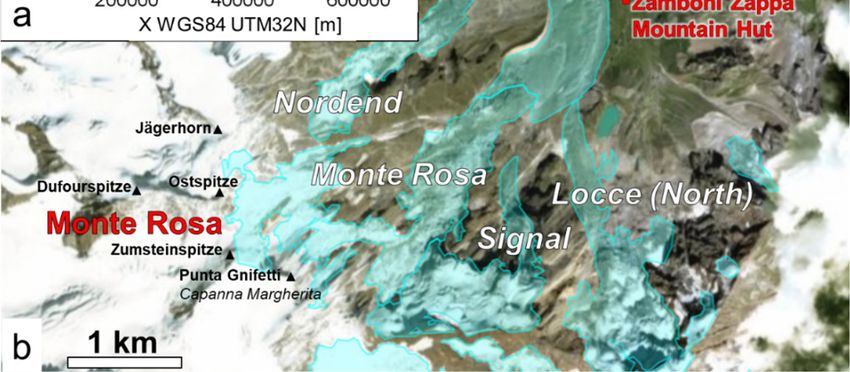
Remote Sens. 2019, 11, 805 9 of 19
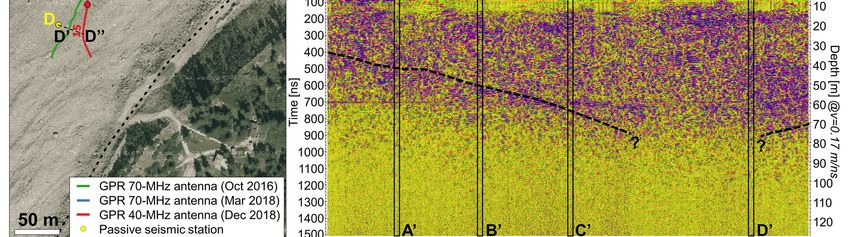
Figure 4. GPR results. (a) Location of the GPR profiles are shown in the right and bottom sections.
The starting point of each profile is highlighted with a dot. (b) Profile 9 (70-MHz antenna, October
2016). (c) Profile 20 (70-MHz antenna, March 2018). (d) Profile 12 to 15 (left to right, 40-MHz antenna,
December 2018). The vertical scale of some radargram is cut (no reflections for higher recorded times).
Remote Sens. 2019, 11, 805                                                                                   10 of 19

      Figure 5. GPR results (same as Figure 4) with glacier bottom interpretation. The ice bottom
      morphology is highlighted in the radargrams with the dashed black lines. The possible bedrock top
      is underlined in (d) with the dotted black line. The approximate location of single-station passive
      measurements projected on the GPR profiles is shown in (a) with letters A’ to D’ (on 70-MHz profile
      9) and A’’ to D’’ (on 40-MHz profiles 12 to 15), and in (c) and (d) with the black rectangles, for further
      comparison between GPR and HVSR results.

      Figure 6. (a) Summary of the GPR profiles for which ice bottom picking was retrieved. (b) Map of the
      resulting ice bottom picks.
Remote Sens. 2019, 11, 805 11 of 19
The results of ice bottom picking along GPR profiles are summarized in Figure 6. All the 40-
MHz radargrams provided quite clear imaging of the subsurface conditions. Conversely, only 12
radargrams acquired on October 2016 (70 MHz) supplied information on ice thickness, close to the
front of the N lobe, on the S lobe and at the confluence. These areas correspond to generally lower ice
thicknesses with respect to the surrounding zones. Analogously, the 70-MHz GPR campaign of
March 2018 resulted in only 5 radargrams for which ice bottom picking was clearly interpretable. No
information on ice thickness was recovered from the GPR data for the glacier main body, upstream
the terminal bifurcation (Figure 6a). Ice thickness retrieved from ice bottom picking is shown in
Figure 6b. A traditional U-shaped bottom morphology seems to be reconstructed for the N lobe, with
considerable ice depths in the axial part (100–110 m) despite the proximity to the terminus. The S lobe
is conversely characterized by significantly shallower ice depths and a probably flatter morphology.
4.2. Single-Station Passive Seismic Measurements
The results of HVSR processing are shown in Figure 7. No clear single peaks are found in the
results, at least two to three HVSR minor peaks can be depicted for each station. HVSR amplification
is low (< 2) for all the measured points. For the first three stations, the peak with the highest amplitude
(f0) is located at similar frequency values, progressively decreasing from A to C. A higher frequency
peak is noticed at station D.
Figure 8 shows HVSR directivity, as a function of frequency and azimuth (0° = N, 90° = E),
measured at the four stations. These results clearly highlight that f0 spectral peaks spread over a wide
azimuthal range, covering from 100° to 180°. These resonance frequencies seem therefore almost
azimuth independent, denoting the absence of 2-D effects. The secondary peaks located at
frequencies lower than 3 Hz conversely showed more focused directivities.
Figure 7. HVSR results on stations (a) A, (b) B, (c) C and (d) D (location in Figure 2). In each panel,
the black bold and dashed curves are the average and standard deviation obtained from all the
accepted 120-s window curves for each station.Remote Sens. 2019, 11, 805 12 of 19
Figure 8. Directional HVSR azimuth (in degrees from N direction) on stations (a) A, (b) B, (c) C and
(d) D. In each panel, the white dashed lines highlight the location of the highest spectral peaks (f0)
identified in Figure 7.
5. Discussion
Geophysical characterization of rock glaciers and debris-covered glaciers is usually complicated
by several factors: Logistically challenging and expensive transport of equipment and personnel on
site, extremely rugged topographic conditions inhibiting antenna dragging on the surface, and
inaccessibility of same areas, due to safety concerns [44]. In addition, despite the advances in
geophysical prospection and instrumentation of the last decades with respect to the previous
reference ice bottom investigations carried out on the Belvedere Glacier, recent surveys are not free
of interpretation issues. Widespread scattering and high attenuation of the EM signals, often referred
to as clutter, are noticed in all the 70-MHz GPR profiles. Slightly better results are obtained with a
lower frequency of the GPR antenna (40 MHz vs. 70 MHz). No information is however retrieved for
depths higher than 100–150 m below the glacier surface.
Many causes may have contributed to the poor quality of GPR imaging on this glacier. The
absence of direct coupling with the ground, with possible centimetric variations in the height of the
antenna, limits the amount of EM energy inserted in the subsurface, resulting in rapidly decreasing
energy to image the reflectors with depth and laterally variable trace amplitudes. In addition, the
presence of the top debris cover, characterized by extreme variability in grain size, thickness and
lateral distribution, generates diffuse scattering and attenuation of the EM pulses transmitted to the
underlying ice column, with respect to GPR prospections in glaciers lacking this surface layer. Pecci
et al. [45] discussed the negative clutter effects on GPR data quality caused by the surface debris cover
with a highly variable thickness of Calderone Glacier (Central Apennines, Italy). Intense clutter
phenomena were observed also at a depth of few meters from the surface and were related to the
presence of ice layers containing a high concentration of debris. As a consequence, the reflectors
corresponding to the ice-bedrock interface could not be clearly and continuously detected.
Similar results were obtained on a debris-covered glacier of Italian Dolomites [22]. Most of the
GPR scans pointed out the presence of intense clutter effects, due to the presence of heterometricRemote Sens. 2019, 11, 805 13 of 19
debris at the surface. Authors were able to detect the ice-bedrock only with an acquisition adopting
bistatic antennas in parallel-polarized modality. This arrangement was observed to be more sensitive
to buried targets oriented parallel to the main axes of the antennas and relatively insensitive to
depolarized scattered fields. However, moving this configuration on a rugged topography could be
a logistical issue, especially when low-frequency antennas with long dipoles are adopted.
Despite these considerations, the presence of debris at the surface and the use of air-coupled
antennas are common to other GPR surveys in debris-covered glaciers and rock glaciers (e.g., [24,26])
which led to satisfactory data quality. As a consequence, we hypothesize that widespread internal
heterogeneities in the glacier mass may have had an additional and primary role in scattering and
attenuation of the GPR signals. Beside the possible widespread presence of solid rock debris within
the ice body [45], enhanced radar scattering, due to water englacial inhomogeneities is reported by
several authors. Bamber [46] performed a numerical analysis to quantify the back scattering of water-
filled cavities on the scale of decimeters affecting GPR results on several glaciers in Svalbard Islands.
Numerical results illustrated the difficulties that may be encountered while sounding temperate
glaciers possessing widespread englacial water bodies and explained the absence of bed echoes in
the accumulation zone of these glaciers. GPR profiles collected by Murray et al. [47] in the ablation
zone of Tsanfleuron Glacier (Swiss Alps) and Bakaninbreen Glacier (Svalbard) showed a two-layered
structure, with an upper layer characterized by low returned GPR power and a lower layer of strong
scattering. The thickness of these layers was observed to rapidly change along the profiles at both
sites. At Tsanfleuron Glacier, the two layers were interpreted as dry ice, with a water content of 1.18%,
overlapping ice containing small water bodies, up to decimeter in size, occupying 3.90% by volume.
At Bakaninbreen Glacier, the upper radar layer was interpreted as cold ice with no measurable water-
content and the lower layer as warm ice with a water content of 1.29%. Barrett et al. [48] modeled
layers of randomly distributed scatters of decimeter-scale dimensions with an undulating upper
boundary or confined to obliquely dipping planes to reproduce the scattering effects noticed on the
radargrams acquired on Bakaninbreen Glacier. Numerical results supported the hypothesis that
scattering originates from multiple planar sets of water-filled cavities. These features are expected to
be common in glaciers surging by a thermally regulated soft bed mechanism, both at the end of the
surge and into early quiescence phases. The presence of surge-type movements at the Belvedere
Glacier, supporting the hypothesis of abundant water presence within the glacial mass, is well-
documented in the literature [49].
As a consequence of the poor GPR data quality, ice thickness estimation was possible only in the
glacier sectors characterized by the lowest ice thickness. Layering with different orientations,
probably indicating the overlap of lateral morainic deposits on the bottom materials, was found to
locally emphasize the bottom morphology. Only close to the terminus of the N lobe, deeper and
steeper reflectors were imaged below the ice bottom. These observations suggest that the glacier
bottom is not characterized by stiff bedrock, but by a thick sequence of fine-grained glacial deposits,
as already hypothesize in the study of VAW-ETH [36]. If this hypothesis is valid, the glacial deposits
have an average thickness of 40 m close to the glacier front and bedrock is located at a depth of
approximately 80 m (e.g., rectangle A’’ in Figure 5d). The thickness of the bottom deposits rapidly
increases upstream if the steep dipping of bedrock is constant.
Single-station passive seismic measurements confirmed the absence of sharp acoustic
impedance contrasts in the glacier subsurface. The lack of a single clear peaks with high HVSR
amplification values are a key piece of evidence for the absence of ice in direct contact with stiff
bedrock. The occurrence of a multi-layered subsurface, with several weak contrasts in acoustic
impedance at depth, can conversely help to explain the obtained HVSR results. The progressive
lowering in the frequency of f0 peak from station A to C (Figure 7) is coherent with the presence of
interfaces which are progressively deeper upstream, as highlighted in the GPR results (Figure 5d).
HVSR complex results are however difficult to interpret with single simplified equations (e.g.,
Equation 1), due to the existence of multiple interfaces whose resonance phenomena are
superimposed. The stratigraphic condition appearing from all the above considerations is also at the
limit of validity of the assumptions underlying further processing and interpretation of the measuredRemote Sens. 2019, 11, 805 14 of 19
curves. Despite the challenging working environment and investigated ice mass, a comparison
between past and present geophysical surveys at the Belvedere Glacier is worthy of investigation.
The ice-thickness map obtained from triangulation with linear interpolation of the GPR bottom peaks
(Figure 6b) is shown in Figure 9a. The map confirms the previous observations of a traditional U-
shaped bottom morphology for the N lobe and of shallow ice depths and flatter bottom surface for
the S lobe. A digitized version of the ice thickness map of De Visintini [35], reported in Diolaiuti et
al. [39], is shown for the same area of the glacier in Figure 9b. It must be noticed that the only reflection
seismic measurements on this area were performed at the confluence of the two lobes (black bold
lines in Figure 9b) and no data coverage was directly available on the lobes. As a consequence, this
map is the result of a more approximated data interpretation with respect to the continuous GPR
profiling from which Figure 9a is derived. Despite these considerations, Figure 9c shows the
difference in ice thickness between the present and past maps.
Figure 9. (a) Interpolated glacier bottom map from GPR results (2016–2018). (b) Reference glacier
bottom map from De Visintini [35] and Diolaiuti et al. [39]. The black bold lines in (b) indicate the
location of the only seismic reflection measurements in the area of interest. (c) Difference between (a)
and (b) maps. The black dashed line highlights the approximate glacier perimeter in October 2016
(first GPR campaign).
A general agreement in ice thickness estimation is found along the axial position of the N lobe
and on a wide area of the south lobe. Visible negative values (reduction in ice thickness) are found
close to the northern front, underlying the accelerating retreat and shrinkage of the glacier in recent
times. A visible decrease in ice thickness is also noticed close to the confluence between the lobes.
This result can be considered quite reliable given the good data coverage of both present and previous
surveys close to this point. By contrast, the unrealistic increases in ice thickness close to the glacier
sides are more likely due to an erroneous approximation of ice thickness in the past study, rather
than to a significant increase in ice volume in these marginal sectors.Remote Sens. 2019, 11, 805 15 of 19
An independent comparison between the glacier cross-sections obtained from the interpretation
of the radar measurements of VAW-ETH [36] and the closest GPR profiles of the present study is
presented in Figure 10. In this case, the adopted geophysical technique is the same, even if in different
frequency bands. Both surveys should therefore have depicted the same interfaces. The ice bottom
morphology presented in the previous work (black dashed lines in Figure 10b and Figure 10c) is
however the results of only two points of measure on each lobe (white triangles in Figure 10b and
Figure 10c), for both FF’ and GG’ sections [36] and not of continuous profiling.
Figure 10. Comparison between the radar cross-sections of VAW-ETH [36] and the closest GPR
profiles of the present study with successful glacier bottom picking. (a) Location of the profiles. (b)
Section FF’. (c) Section GG’. The original data interpretation is shown in black (white triangles and
gray rays indicate the radar measurement points and the interpreted EM ray paths as reported in
[36]), while recent GPR results are shown in red for Profiles 1 and 7 (40 MHz, December 2018) and in
green for Profile 25 (70 MHz, October 2016). Bold line: Topography, dashed line: Estimated ice bottom
location.
Along the FF’ cross-section, the 40-MHz profile 1 shows a depressed glacier topography with
respect to the one of 1985. An acceptable discrepancy of around 15 m between the maximum ice
bottom depth of the two surveys is noticed. Major differences in the morphology of the bottom
surface are observed between the two campaigns. Recent GPR profiles outline a narrower and more
asymmetric section of the N lobe, steeper on the side of the moraine hosting the Belvedere Mountain
Hat. It is however interesting to notice that the reflection points related to the ray paths of two radar
measurements performed on the N lobe well overlap with the recent bottom estimation from
continuous GPR profiling. The lateral discrepancies can therefore be explained as the consequence of
insufficient lateral data coverage of previous surveys. Similar results are found on GG’ cross-section.
Along this section, the topographic variations appear less marked on the N lobe. On the S lobe, profile
25 has higher topography than previous data, due to the fact that it is located almost 100 m upstream
the reference GG’ section trace. A good agreement between the present and past data is however
found for the S lobe bottom. On the N lobe, the maximum depth depicted in the two surveys is the
same, but the GPR profile 7 defines again a narrower ice bottom section. A wider and smoother
bottom morphology was considered during the interpretation of previous radar measurements and
a clear mismatch is observed between the two surveys. Differently from the original data
interpretation, past radar echoes (and related ray paths) were probably originated from the deepest
and narrowest axial sector of the glacial valley rather than from the lateral moraines. This comparison
definitely highlights the undeniable advantages of continuous GPR profiling in maximizing dataRemote Sens. 2019, 11, 805 16 of 19
coverage and improving bottom morphology reconstruction, with respect to previous sparse and
local measurements.
6. Conclusions
Geophysical surveys, including 40-MHz and 70-MHz GPR profiling and single-station passive
seismic measurements, were acquired at the Belvedere Glacier with the aim of ice thickness
reconstruction. The surveys were intended to fill a knowledge gap on the glacier bottom morphology,
since the existing bottom information was only retrieved from sparse and local past geophysical
measurements. Despite a dense GPR survey distribution, the ice bottom surface was detected only in
radargrams acquired on the frontal lobes, while noisy and uninterpretable results were obtained
upstream. The globally observed low data quality was attributed to the presence of a widespread
debris cover, the absence of direct coupling between antenna and glacier surface and the probable
widespread presence of debris and/or small-scale water bodies within the ice column. The
concurrence of all these features probably caused the observed significant scattering and attenuation
of the transmitted EM pulses. The lower frequency 40-MHz survey generally showed clearer results.
Ice thickness estimations based on these results were interpolated to reconstruct a detailed ice
thickness map that was compared with the previous study of De Visintini [35]. Some discrepancies
between the two estimations arose, mainly due to different data coverage and acceleration in the
glacier retreat over the last decades. A better fitting with the results of the radar measurements of
VAW-ETH [36] was obtained. Also in this case, continuous GPR profiling provided denser data
coverage with respect to previous local measurements, enabling for a better definition of the ice
bottom morphology. Significant ice thickness variations were detected in the upper part of the N
lobe, with a transition from convex to concave glacier topography. Below the ice bottom, low-
amplitude reflectors having steeper dip were identified only in the frontal portion of the N lobe.
These elements may indicate the bedrock presence at a depth of around 80 m from the glacier surface
close to the northern terminus and rapidly deepening upstream. Consequently, a thick layer (more
than 40 m) of subglacial deposits may be present between ice and bedrock.
Single-station passive seismic measurements were processed following the HVSR method. The
results showed the absence of a clear contrast in acoustic impedance (i.e., ice on bedrock) at depth,
providing at least a general confirmation of the hypothesized subsurface conditions. However,
without the reference GPR profiles, no information on the ice bottom could have been retrieved from
HVSR curves. These tests highlighted the limitations of passive seismic measurements for glacier
characterization, i.e., 1D approximation of the investigated subsurface, need to simultaneously have
a dense grid of measurements but avoiding 2D effects, time-consuming acquisitions with respect to
continuous GPR profiling, poor results in absence of a bottom ice-bedrock interface. Differently from
GPR investigations, for which the denser data coverage of continuous profiling revealed the key point
to improve the past knowledge about bottom morphology, due to the peculiar investigated
conditions passive seismic methods did not succeed in improving past active seismic results, despite
the lighter instrumentation, logistically easier acquisition and no need of active sources.
Future perspectives of the method may be addressed to glacier monitoring. Multi-station long-term
passive seismic measurements can potentially be used for the investigation of the ongoing glacial
processes (hydrogeological modifications, meltwater flow, seepage and accumulation) and of the
glacier movements and stability conditions (e.g., icequakes, opening of crevasses, basal movements,
serac falls and stability of the frontal compartments).
Further glaciological analyses are planned to understand the influence of the glacier subsurface
conditions on the measured geophysical data. Future geophysical campaigns on site should be
addressed to reach satisfactory imaging of the glacier bottom in the upstream sectors, and to monitor
ice thickness variations over the investigated frontal areas. Alternative survey configurations,
including the test of parallel-polarized antennas for data collection, will be tested to map the ice
bottom, reducing the effect of clutter on GPR data quality.Remote Sens. 2019, 11, 805 17 of 19
Author Contributions: Conceptualization, Ch.C., Ce.C., E.D.T., D.F. and A.G.; Data processing, Ch.C. and
E.D.T.; Funding acquisition, A.G.; Investigation, D.F.; Methodology, Ch.C., Ce.C. and A.G.; Supervision, Ce.C.
and A.G.; Validation, Ch.C.; Visualization, Ch.C.; Writing – original draft, Ch.C.; Writing – review and editing,
Ch.C., Ce.C., E.D.T., D.F. and A.G.
Funding: This research was partially supported by educational funds from Alta Scuola Politecnica Milano-
Torino (ASP project DREAM, DRone tEchnology for wAter resources Monitoring).
Acknowledgments: The geophysical campaigns described in this study were carried out in the framework of
the Climate Change Glacier Lab of the Department of Environment, Land and Infrastructure Engineering of
Politecnico di Torino. The authors are grateful to the Alpine guides that supervised and helped the field
operations.
Conflicts of Interest: The authors declare no conflict of interest.
References
1. Beniston, M. Climatic Change in Mountain Regions: A Review of Possible Impacts. In Climate Variability
and Change in High Elevation Regions: Past, Present & Future; Diaz, H.F., Beniston, M., Bradley, R.S., Eds.;
Springer Netherlands: Dordrecht, The Netherlands, 2003; Volume 15, pp. 5–31, doi:10.1007/978-94-015-
1252-7_2.
2. Harris, C.; Arenson, L.U.; Christiansen, H.H.; Etzelmüller, B.; Frauenfelder, R.; Gruber, S.; Haeberli, W.;
Hauck, C.; Hölzle, M.; Humlum, O.; et al. Permafrost and Climate in Europe: Monitoring and Modelling
Thermal, Geomorphological and Geotechnical Responses. Earth-Sci. Rev. 2009, 92, 117–171,
doi:10.1016/j.earscirev.2008.12.002.
3. Haeberli, W.; Beniston, M. Climate Change and Its Impacts on Glaciers and Permafrost in the Alps. Ambio
1998, 27, 258–265.
4. Dyurgerov, M.B.; Meier, M.F. Twentieth Century Climate Change: Evidence from Small Glaciers. Proc. Natl.
Acad. Sci. USA 2000, 97, 1406, doi:10.1073/pnas.97.4.1406.
5. Kääb, A.; Reynolds, J.M.; Haeberli, W. Glacier and Permafrost Hazards in High Mountains. In Global Change
and Mountain Regions; Huber, U.M., Bugmann, H.K.M., Reasoner, M.A., Eds.; Springer Netherlands:
Dordrecht, The Netherlands, 2005; Volume 23, pp. 225–234, doi:10.1007/1-4020-3508-X_23.
6. Ye, Q.; Kang, S.; Chen, F.; Wang, J. Monitoring Glacier Variations on Geladandong Mountain, Central
Tibetan Plateau, from 1969 to 2002 Using Remote-Sensing and GIS Technologies. J. Glaciol. 2006, 52, 537–
545, doi:10.3189/172756506781828359.
7. Bamber, J.L.; Rivera, A. A Review of Remote Sensing Methods for Glacier Mass Balance Determination.
Glob. Planet. Change 2007, 59, 138–148, doi:10.1016/j.gloplacha.2006.11.031.
8. Kulkarni, A.; Bahuguna, I.; Rathore, B.; Singh, S.; Randhawa, S.; Sood, R.; Dhar, S. Glacial retreat in
Himalaya using Indian Remote Sensing satellite data. Curr. Sci.2007, 92, 69–74.
9. Zhou, Y.; Hu, J.; Li, Z.; Li, J.; Zhao, R.; Ding, X. Quantifying Glacier Mass Change and Its Contribution to
Lake Growths in Central Kunlun during 2000–2015 from Multi-Source Remote Sensing Data. J. Hydrol.
2019, 570, 38–50, doi:10.1016/j.jhydrol.2019.01.007.
10. Farinotti, D.; Huss, M.; Bauder, A.; Funk, M. An Estimate of the Glacier Ice Volume in the Swiss Alps. Glob.
Planet. Change 2009, 68, 225–231, doi:10.1016/j.gloplacha.2009.05.004.
11. Hagen, J.O.; Liestøl, O. Long-Term Glacier Mass-Balance Investigations in Svalbard, 1950–88. Ann. Glaciol.
1990, 14, 102–106, doi:10.3189/S0260305500008351.
12. Zemp, M.; Hoelzle, M.; Haeberli, W. Six Decades of Glacier Mass-Balance Observations: A Review of the
Worldwide Monitoring Network. Ann. Glaciol. 2009, 50, 101–111, doi:10.3189/172756409787769591.
13. Zekollari, H.; Fürst, J.J.; Huybrechts, P. Modelling the Evolution of Vadret Da Morteratsch, Switzerland,
since the Little Ice Age and into the Future. J. Glaciol. 2014, 60, 1155–1168, doi:10.3189/2014JoG14J053.
14. Gabbi, J.; Farinotti, D.; Bauder, A.; Maurer, H. Ice Volume Distribution and Implications on Runoff
Projections in a Glacierized Catchment. Hydrol. Earth Syst. Sci. 2012, 16, 4543–4556, doi:10.5194/hess-16-
4543-2012.
15. Vincent, C.; Descloitres, M.; Garambois, S.; Legchenko, A.; Guyard, H.; Gilbert, A. Detection of a Subglacial
Lake in Glacier de Tête Rousse (Mont Blanc Area, France). J. Glaciol. 2012, 58, 866–878,
doi:10.3189/2012JoG11J179.Remote Sens. 2019, 11, 805 18 of 19
16. Eisen, O.; Nixdorf, U.; Keck, L.; Wagenbach, D. Alpine Ice Cores and Ground Penetrating Radar: Combined
Investigations for Glaciological and Climatic Interpretations of a Cold Alpine Ice Body. Tellus B 2003, 55,
1007–1017, doi:10.1034/j.1600-0889.2003.00080.x.
17. Navarro, F.; Eisen, O. Ground-penetrating radar in glaciological applications. Remote Sens. Glaciers 2009,
195–229, doi:10.1201/b10155-12.
18. Arcone, S.A. High Resolution of Glacial Ice Stratigraphy: A Ground-penetrating Radar Study of Pegasus
Runway, McMurdo Station, Antarctica. Geophysics 1996, 61, 1653–1663, doi:10.1190/1.1444084.
19. Urbini, S.; Baskaradas, J.A. GPR as an Effective Tool for Safety and Glacier Characterization: Experiences
and Future Development. In Proceedings of the XIII Internarional Conference on Ground Penetrating
Radar, Lecce, Italy, 21–25 June 2010; pp. 1–6, doi:10.1109/ICGPR.2010.5550268.
20. Navarro, F.J.; Martín-Español, A.; Lapazaran, J.J.; Grabiec, M.; Otero, J.; Vasilenko, E.V.; Puczko, D. Ice
Volume Estimates from Ground-Penetrating Radar Surveys, Wedel Jarlsberg Land Glaciers, Svalbard. Arct.
Antarct. Alp. Res. 2014, 46, 394–406, doi:10.1657/1938-4246-46.2.394.
21. Kutuzov, S.; Thompson, L.G.; Lavrentiev, I.; Tian, L. Ice Thickness Measurements of Guliya Ice Cap,
Western Kunlun Mountains (Tibetan Plateau), China. J. Glaciol. 2018, 64, 977–989, doi:10.1017/jog.2018.91.
22. Del Longo, M.; Finzi, E.; Galgaro, A.; Godio, A.; Luchetta, A.; Pellegrini, G.B.; Zambrano, R. Responses of
the Val d’Arcia small dolomitic glacier (Mount Pelmo, Eastern Alps) to recent climatic changes.
Geomorphological and geophysical study. Geografia Fisica e Dinamica Quaternaria 2001, 24, 43–55.
23. Binder, D.; Brückl, E.; Roch, K.H.; Behm, M.; Schöner, W.; Hynek, B. Determination of Total Ice Volume
and Ice-Thickness Distribution of Two Glaciers in the Hohe Tauern Region, Eastern Alps, from GPR Data.
Ann. Glaciol. 2009, 50, 71–79, doi:10.3189/172756409789097522.
24. Merz, K.; Maurer, H.; Rabenstein, L.; Buchli, T.; Springman, S.M.; Zweifel, M. Multidisciplinary
Geophysical Investigations over an Alpine Rock Glacier. Geophysics 2016, 81, WA147–WA157,
doi:10.1190/geo2015-0157.1.
25. Dossi, M.; Forte, E.; Pipan, M.; Colucci, R.R. Quantitative 3-D GPR Analysis to Estimate the Total Volume
and Water Content of a Glacier. In Proceedings of the 2018 17th International Conference on Ground
Penetrating Radar (GPR), Rapperswil, Switzerland, 18–21 June 2018; pp. 1–6,
doi:10.1109/ICGPR.2018.8441636.
26. Maurer, H.; Hauck, C. Geophysical Imaging of Alpine Rock Glaciers. J. Glaciol. 2007, 53, 110–120,
doi:10.3189/172756507781833893.
27. Picotti, S.; Francese, R.; Giorgi, M.; Pettenati, F.; Carcione, J.M. Estimation of Glacier Thicknesses and Basal
Properties Using the Horizontal-to-Vertical Component Spectral Ratio (HVSR) Technique from Passive
Seismic Data. J. Glaciol. 2017, 63, 229–248, doi:10.1017/jog.2016.135.
28. Nogoshi, M.; Igarashi, T. On the amplitude characteristics of microtremor (part 2). J. Seism. Soc. Jpn. 1971,
24, 26–40.
29. Nakamura, Y. A method for dynamic characteristics estimation of subsurface using microtremor on the
ground surface. Quart. Rep. Railway Techn. Res. Inst. 1989, 30, 25–33.
30. Lachetl, C.; Bard, P.-Y. Numerical and Theoretical Investigations on the Possibilities and Limitations of
Nakamura’s Technique. J. Phys. Earth 1994, 42, 377–397, doi:10.4294/jpe1952.42.377.
31. Wohlenberg, J.; Ibs-von Seht, M. Microtremor Measurements Used to Map Thickness of Soft Sediments.
Bull. Seismol. Soc. Am. 1999, 89, 250–259.
32. Konno, K.; Ohmachi, T. Ground-Motion Characteristics Estimated from Spectral Ratio between Horizontal
and Vertical Components of Microtremor. Bull. Seismol. Soc. Am. 1998, 88, 228–241.
33. Bonnefoy-Claudet, S.; Köhler, A.; Cornou, C.; Wathelet, M.; Bard, P.-Y. Effects of Love Waves on
Microtremor H/V RatioEffects of Love Waves on Microtremor H/V Ratio. Bull. Seismol. Soc. Am. 2008, 98,
288–300, doi:10.1785/0120070063.
34. Boulton, G.S.; Hindmarsh, R.C.A. Sediment Deformation beneath Glaciers: Rheology and Geological
Consequences. J. Geophys. Res. Solid Earth 1987, 92, 9059–9082, doi:10.1029/JB092iB09p09059.
35. De Visintini, G. Rilievo sismico a riflessione sul Ghiacciaio del Belvedere (Monte Rosa). Bollettino del
Comitato Glaciologico Italiano, Serie II 1961, 10, 65–70.
36. VAW-ETH Studi sul comportamento del Ghiacciaio del Belvedere, Macugnaga, Italia. Relazione 97 1985, 3,
76-109.
37. Porro, F.; Somigliana, C. Ghiacciaio di Macugnaga. Bollettino del Comitato Glaciologico Italiano, Serie I 1918,
3, 187–190.Remote Sens. 2019, 11, 805 19 of 19
38. Monterin, U. Il Ghiacciaio di Macugnaga dal 1870 al 1922. Bollettino del Comitato Glaciologico Italiano, Serie I
1922, 5, 12–40.
39. Diolaiuti, G.; D’Agata, C.; Smiraglia, C. Belvedere Glacier, Monte Rosa, Italian Alps: Tongue Thickness and
Volume Variations in the Second Half of the 20th Century. Arct. Antarct. Alp. Res. 2003, 35, 255–263,
doi:10.1657/1523-0430(2003)035[0255:BGMRIA]2.0.CO;2.
40. Bard, P.-Y.; Bouchon, M. The Two-Dimensional Resonance of Sediment-Filled Valleys. Bull. Seismol. Soc.
Am. 1985, 75, 519–541.
41. Wathelet, M.; Jongmans, D.; Ohrnberger, M. Surface wave inversion using a direct search algorithm and
its application to ambient vibration measurements. Near Surf. Geophys. 2004, 2, 211–221.
42. Herak, M. ModelHVSR—A Matlab® Tool to Model Horizontal-to-Vertical Spectral Ratio of Ambient Noise.
Comput. Geosci. 2008, 34, 1514–1526, doi:10.1016/j.cageo.2007.07.009.
43. Lunedei, E.; Albarello, D. On the Seismic Noise Wavefield in a Weakly Dissipative Layered Earth. Geophys.
J. Int. 2009, 177, 1001–1014, doi:10.1111/j.1365-246X.2008.04062.x.
44. Malehmir, A.; Socco, L.V.; Bastani, M.; Krawczyk, C.M.; Pfaffhuber, A.A.; Miller, R.D.; Maurer, H.;
Frauenfelder, R.; Suto, K.; Bazin, S.; et al. Chapter Two—Near-Surface Geophysical Characterization of
Areas Prone to Natural Hazards: A Review of the Current and Perspective on the Future. In Advances in
Geophysics; Nielsen, L., Ed.; Elsevier: Amsterdam, The Netherlands, 2016; Volume 57, pp. 51–146,
doi:10.1016/bs.agph.2016.08.001.
45. Pecci, M.; De Sisti, G.; Marino, A.; Smiraglia, C. New radar surveys in monitoring the evolution of the
Calderone glacier (Central Apennines, Italy). Suppl. Geogr. Fis. Dinam. Quat. 2007, V, 145–150.
46. Bamber, J.L. Enhanced Radar Scattering From Water Inclusions In Ice. J. Glaciol. 1988, 34, 293–296,
doi:10.3189/S0022143000007048.
47. Murray, T.; Booth, A.; Rippin, D.M. Water-Content of Glacier-Ice: Limitations on Estimates from Velocity
Analysis of Surface Ground-Penetrating Radar Surveys. JEEG 2007, 12, 87–99, doi:10.2113/JEEG12.1.87.
48. Barrett, B.E.; Murray, T.; Clark, R.; Matsuoka, K. Distribution and Character of Water in a Surge-Type
Glacier Revealed by Multifrequency and Multipolarization Ground-Penetrating Radar. J. Geophys. Res.
Earth Surface 2008, 113, doi:10.1029/2007JF000972.
49. Haeberli, W.; Kääb, A.; Paul, F.; Chiarle, M.; Mortara, G.; Mazza, A.; Deline, P.; Richardson, S. A Surge-
Type Movement at Ghiacciaio Del Belvedere and a Developing Slope Instability in the East Face of Monte
Rosa, Macugnaga, Italian Alps. Norsk Geografisk Tidsskrift—Nor. J. Geogr. 2002, 56, 104–111,
doi:10.1080/002919502760056422.
© 2019 by the authors. Licensee MDPI, Basel, Switzerland. This article is an open
access article distributed under the terms and conditions of the Creative Commons
Attribution (CC BY) license (http://creativecommons.org/licenses/by/4.0/).You can also read