The influence of physical parameters on the in- situ metal carbonyl complex formation studied with the Fast On-line Reaction Apparatus (FORA) - De ...
←
→
Page content transcription
If your browser does not render page correctly, please read the page content below
Radiochim. Acta 2021; aop

Yves Wittwer, Robert Eichler*, Dominik Herrmann and Andreas Türler

The influence of physical parameters on the in-
situ metal carbonyl complex formation studied
with the Fast On-line Reaction Apparatus (FORA)
https://doi.org/10.1515/ract-2020-0035                                1 Introduction
Received April 8, 2020; accepted January 23, 2021;
published online February 12, 2021
                                                                      In 1890, the synthesis and identification of Ni(CO)4 by
                                                                      Ludwig Mond and Co-workers marked the beginning of a
Abstract: The Fast On-line Reaction Apparatus (FORA)
                                                                      new class of chemical compounds, the metal carbonyl
was used to investigate the influence of various reaction
                                                                      complexes (MCCs) [1]. Nowadays, MCCs and their de-
parameters onto the formation and transport of metal
                                                                      rivatives provide a large class of compounds with various
carbonyl complexes (MCCs) under single-atom chemistry
                                                                      applications including the usage as new pharmaceuticals
conditions. FORA is based on a 252Cf-source producing
                                                                      and as reagents in organic chemistry [2–7]. A rather new
short-lived Mo, Tc, Ru and Rh isotopes. Those are recoiling
                                                                      application of MCCs focuses on the chemical investigations
from the spontaneous fission source into a reaction
chamber flushed with a gas-mixture containing CO. Upon                 of transactinides (TAs). Transactinides are elements with a
contact with CO, fission products form volatile MCCs which             proton number Z ≥ 104. Due to strong relativistic effects
are further transported by the gas stream to the detection            being expected to influence the electronic structures of
setup, consisting of a charcoal trap mounted in front of a            elements in this heavy region of the periodic table, TAs
HPGe γ-detector. Depending on the reaction conditions,                might show unique and unexpected chemical properties
MCCs are formed and transported with different effi-                   [8–12]. However, chemical investigations of TAs are chal-
ciencies. Using this setup, the impact of varying physical            lenging. Since TAs were not found in nature up to today,
parameters like gas flow, gas pressure, kinetic energy of              they need to be produced in nuclear fusion reactions at a
fission products upon entering the reaction chamber and                rate of a few atoms per day up to a few atoms per month
temperature of the reaction chamber on the formation and              depending on the investigated isotope. Additionally, their
transport yields of MCCs was investigated. Using a setup              half-lives are generally low, being usually in the range of a
similar to FORA called Miss Piggy, various gas mixtures of            few seconds [8–10, 13, 14]. Due to all these limitations,
CO with a selection of noble gases, as well as N2 and H2,             efficient and fast experimental setups are required to
were investigated with respect to their effect onto MCC               investigate TAs. Particularly, when using short-lived iso-
formation and transport. Based on this measurements,                  topes, studies are usually performed in the gas-phase.
optimized reaction conditions to maximize the synthesis               Since the refractory TAs (Z = 104–106) as well as noble
and transport of MCCs are suggested. Explanations for the             metal TAs (Z = 107–111) are not volatile in their elemental
observed results supported by simulations are suggested               state, this requires synthesizing a volatile TA compound
as well.                                                              first. In the past, volatile compounds synthesized from
Keywords: carbonyl complexes; single atom chemistry;                  TAs included halides [15–20], oxyhalides [21–23], oxide
transition metals.                                                    hydroxides [24] and oxides [25] depending on the element
                                                                      [8–10, 13, 26]. Since MCCs are expected to be volatile
                                                                      enough for gas-phase studies, transforming TAs into MCCs
                                                                      might provide an efficient method to investigate those
                                                                      unique elements and to make them available in labora-
                                                                      tories shielded from their production place using pure gas-
                                                                      jets. Additionally, the metal atom in a MCC has a formal
*Corresponding author: Robert Eichler, Paul Scherrer Institute,       oxidation state of 0, which is a new feature among all TA
Villigen, Switzerland, E-mail: robert.eichler@psi.ch                  compounds investigated up to today. It is expected that Sg,
Yves Wittwer, Paul Scherrer Institute, Villigen, Switzerland; and
University of Bern, Bern, Switzerland
                                                                      Bh, Hs and Mt form volatile MCCs, based on the behavior or
Dominik Herrmann, Paul Scherrer Institute, Villigen, Switzerland      their lighter homologous in the corresponding groups of
Andreas Türler, University of Bern, Bern, Switzerland                 the periodic table. Mt was not chemically investigated in
  Open Access. © 2021 Yves Wittwer et al., published by De Gruyter.    This work is licensed under the Creative Commons Attribution 4.0
International License.
2          Y. Wittwer et al.: Fast On-line Reaction Apparatus (FORA)

the past at all [14, 27]. The synthesis of a volatile MCC from              the reaction chamber. Short-lived Mo, Tc, Ru and Rh isotopes pro-
Sg, Sg(CO)6 was recently accomplished by an international                   duced in the spontaneous fission branch of 252Cf are recoiling through
                                                                            a chosen hole of the aluminum-wheel and are entering the reaction
research group [28]. However, it became quickly apparent
                                                                            chamber, where they thermalize and thus come into close contact with
that the synthesis of MCCs under single-atom chemistry                      the gas flushing the reaction chamber. If the gas contains CO,
conditions goes along with low formation and transport                      depending on the reaction conditions, volatile MCCs are formed in-situ
yields. Interestingly, this was not only the case for heavy                 and are transported out of the reaction chamber by the carrier gas flow.
elements, but also for their lighter homologous. For                        MCCs are transported through a 2 m long PFA-TEFLON® capillary
                                                                            until they reach a charcoal trap, where they are adsorbed. Using a
example, Mo(CO)6 could only be produced with a yield of
                                                                            HPGe γ-detector pointing at the charcoal trap, the decay of the short-
about 40%. For W(CO)6 and Sg(CO)6, the overall yields
                                                                            lived isotopes is monitored. The formation and transport yield for each
were at maximum about 20 and 5%, respectively [27]. These                   MCC compound is proportional to the spectroscopic signal of its cor-
low yields represent a critical problem for the application                 responding metal isotope in the γ-spectrum. In all cases, it is assumed
of MCCs in transactinide research. Here, investigations are                 that fission products form MCCs if not mentioned otherwise. The iso-
presented on the formation and transport of MCCs under                      topes 104Mo, 107Tc, 110Ru and 111Rh were chosen for investigation as
                                                                            described in [32]. The charcoal was purchased from Sigma-Aldrich, CO
similar single-atom chemistry conditions with the goal to
                                                                            (99.997%) was obtained from Carbagas. For measurements using
clarify the impact of various physical and chemical reac-                   FORA, given uncertainties were calculated according to a procedure
tion parameters and point out critical factors. The results                 described in detail elsewhere [32]. The scattering of data-points during
are not only relevant in TA chemistry but potentially in                    operation under constant reaction conditions is indicative for the
other fields as well, for example the generation of new                      reproducibility of the measurement. Therefore, where not mentioned
                                                                            otherwise, the 2-sigma statistical error is given for measurements
radioactive beams from refractory elements [29, 30]. To
                                                                            using FORA. Here, FORA was used to investigate the effects of gas
avoid the expensive and limited access to heavy ion ac-
                                                                            flow, pressure, kinetic energy of fission products and temperature of
celerators, a model system called Fast On-line Reaction                     the reaction chamber on the formation and transport of MCCs. In
Apparatus (FORA) was constructed, allowing investigation                    previous investigations using the FORA setup [32], it was found that
of MCCs from Mo, Tc, Ru and Rh. The nuclides serve as                       the measured yields have a tendency to increase as a function of time,
model systems for elements of their corresponding groups                    despite no apparent change of measurable reaction parameters,
                                                                            before reaching roughly constant values after about 12 h. The effect is
6 to 9 in the periodic table. The influence of gas flow,
                                                                            studied in [33] being related to the superposition of carrier-gas drying
pressure, used gas mixture, temperature of the reaction                     and the in-situ formation of macroscopic amounts of metal carbonyls
chamber and kinetic energy of the atoms recoiling into the                  from steel components of the loop. It was found to be only pronounced
reaction chamber was investigated. To assist FORA, an                       if FORA is completely evacuated and filled with fresh CO-gas. How-
older setup based on a similar principle, Miss Piggy [31],                  ever, it is important to assure that such a systematic change in yield as
was used in some cases specified in the experimental                         a function of time does not interfere with the investigated reaction
                                                                            parameters. To avoid any significant contributions from such in-
section.
                                                                            terferences, a number of safety measures was employed, which will be
                                                                            described in more detail in the chapter dealing with the investigated
                                                                            parameters. In summary, three safety precautions were employed:
2 Experimental                                                              – It was waited for at least 12 h after complete evacuation and
                                                                                 refilling of the FORA setup with CO. This was done to minimize
                                                                                 the influence of time-dependent effects. Additionally, continuous
2.1 FORA                                                                         measurements were performed during this time period to assure a
                                                                                 decent signal stability was achieved before starting any
The FORA-setup was already described in a previous study [32].                   experiment.
Briefly, the system is based on a 252Cf-source, which is located closely     – Measurements were performed in a randomized order. For
below a reaction chamber with two gas-inlets at the bottom and one               example, in measurements where the pressure of the process gas
gas-outlet at the top. An aluminum-wheel containing eight holes on its           was varied (compare with chapter 2.3), the investigated pressure
periphery and one closed position is mounted between the 252Cf-source            values were not systematically increased or decreased, but
and the reaction chamber. By turning this wheel, the reaction chamber            randomly varied. If systematic, time dependent effects interfered
can be opened towards the source. The holes in the aluminum-wheel                with the performed measurements, this would results in a strong
can be occupied with degrader foils of various thicknesses, allowing to          scattering of the obtained data. If, clear trends are observed
degrade the kinetic energy for fission products before entering the               instead, this means that the effects caused by the intended
reaction chamber. The entire FORA-system is designed to be a closed              parameter changes had a stronger impact onto the investigated
gas-loop. After initially filling it with a process gas containing CO, the        system than any unintended interference.
system can be continuously operated. A set of exchangeable purifi-           – Certain, selected measurements were repeated multiple times
cation columns allows to control and maintain the purity of the used             right after each other using identical reaction conditions. From
process gas. Pressure, gas flow and dew point of the process gas are              the obtained scaterring of those values, the stability of the system
continuously monitored. The gas flow is controlled using a Mass-Flow-             and therefore the impact of time-dependent intereferences can be
Controller (MFC). During operation, the 252Cf-source is opened towards           estimated.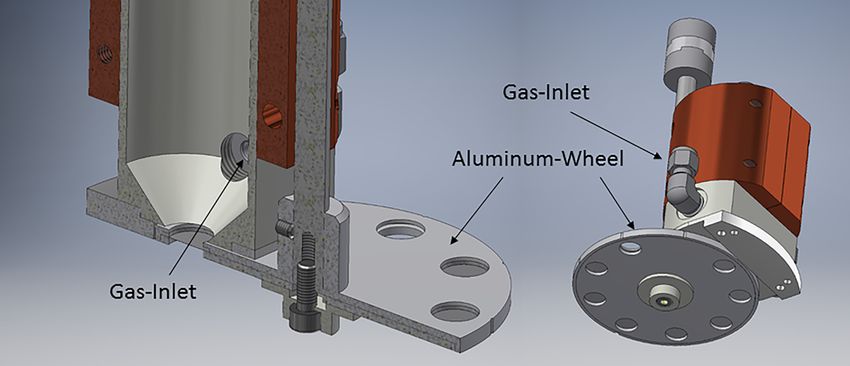
Y. Wittwer et al.: Fast On-line Reaction Apparatus (FORA)             3

      It is important to emphasize that the safety measures mentioned      100% CO as well as in various gas mixtures: 75% CO, 50% CO and 25%
above were not employed to remove interferences, but to reduce their       CO with He. The gas flow was kept constant at 1000 ml/min. In an
impact to a point where they are not significantly contributing to the     additional measurement series, the pressure dependency in 100% CO
observed trends, i.e., their impact is much smaller than the impact of     at two more gas flows, 750 ml/min and 500 ml/min respectively, was
the actually varied experimental parameter. The same is true for the       investigated as well. For 100% CO, pressures between 0.5 and 1 bar
so-called precursor effects which were investigated thoroughly for the     were investigated. For the other gas mixtures, the range between
selected fission product isotopes similar to [32]. No significant influ-      0.65 and 1.15 bar was chosen. It was accounted for the fact that the
ence was observed, since quite distinct variations in trends have been     actual gas flow is a function of pressure. The relationship is:
observed for the genetically linked pairs of Mo/Tc, Tc/Ru and Ru/Rh
                                                                                                                      preal T 0
isotopes. However, at conditions, where the absolute yields are small,                            Qstand. = Qreal ×        ×                     (1)
                                                                                                                       p0 T real
an influence of precursor effects cannot be excluded. A quantification
attempt based on the γ-spectrometry results failed, due to the gener-      where Qstand is the standard gas flow as given by the MFC, Qreal is the
ally small activities at these conditions.                                 actual, real gas flow, preal and Treal are pressure and temperature of the
                                                                           gas and p0 and T0 are standard values, 1 atm and 0 °C, respectively. In
                                                                           preliminary experiments, it was found that the pressures in front of the
2.2 Miss Piggy                                                             reaction chamber and in front of the charcoal trap were not much
                                                                           different. Therefore, a constant gas flow can be assumed between the
Next to FORA, an additional setup for investigating the formation of       reaction chamber and the charcoal trap. Thus, preal was set to the value
MCCs under single-atom chemistry conditions called Miss Piggy is           indicated by the pressure sensor in front of the reaction chamber. Treal
located at the University of Bern. Miss Piggy was described in detail in   was set to 25 °C. The MFC controlling the gas flow was then adjusted
[31, 34]. The working principle is the same as for FORA with a 252Cf-      accordingly before removing or adding process gas in order to reach
source producing short-lived isotopes forming MCCs, which are then         the desired pressure value. Like this, an interference from varying gas
transported to a charcoal trap where their decay is detected using         flows can be excluded during the pressure dependency measure-
γ-spectroscopy. Contrary to FORA, Miss Piggy is not operated as a gas      ments. The gas-correction factor for each MFC was adjusted to the
loop. Gases can only be initially added and mixed using two Mass-          investigated gas mixture according to the procedure given by MKS
Flow-Controllers (MFCs). The process gas flows through the reaction         instruments [35]. The setup used to add and remove gas without
chamber, along a PFA-TEFLON® capillary to the charcoal trap, con-          interrupting the gas flow in FORA is depicted in Figure 2. Removal of
nected to a pump over a needle valve. The schematic of the setup is        process gas was performed by slowly removing process gas from the
depicted in Figure 1.                                                      active loop between the charcoal trap and the membrane pump using
      Gas flow and pressure in Miss Piggy are controlled using the         a turbomolecular pump (Hi-Cube™, Pfeiffer GmbH). A needle valve
initial MFCs and the needle valve located behind the charcoal trap.        was used to control the gas flow into the pump. Care was taken to
The pressure in the system is monitored at the gas-inlet. Miss Piggy       always maintain vacuum in the pump to avoid intake of air into
was used to investigate the effects of different gas mixtures. The used    the loop.
gases CO (99.997%), CH4 (99.95%), H2 (99.999%), N2 (99.999%), He                 Two MFCs were used to mix and add fresh gas between the
(99.999%), Ne (99.99%) and Ar (99.999%) were all purchased from            charcoal trap and the metal bellows pump at a gas flow rate of about
Carbagas.                                                                  100 sml/min. The low gas flow rate for adding process gas was chosen
                                                                           to avoid a pressure push to the charcoal trap. Pre-evacuation of the
                                                                           filling branch using a vacuum pump connected over a needle valve
2.3 Pressure and gas flow                                                  avoided the intake of air. A Sicapent™ column prevented the intake of
                                                                           moisture from the bottled gases. FORA was operated for at least 12 h
Investigations on pressure and gas flow were performed very simi-          after complete evacuation and refilling prior to starting experiments.
larly. As previously noted, evacuating and refilling FORA with fresh       Additionally, FORA was operated for 1.5 h before the start of each
process gas resulted in an initial continuous increase of MCC-yield        measurement after manipulating the process gas. This time was cho-
lasting for about 12 h, before reaching stable conditions [32]. This       sen to allow for purification of the process gas by the used purification
behavior is associated with a certain risk when evaluating pressure        columns. All pressure measurements were performed in a pseudo-
and gas flow dependencies continuously using FORA. Varying the gas          randomized order, namely 1 bar, 0.75 bar, 0.5 bar, 0.65 bar and at last
flow and pressure requires to either add or remove process gas from         0.85 bar for 100% CO and 1 bar, 0.75 bar, 0.65 bar, 0.85 and 1.15 bar for
the active gas-loop. Therefore, special care had to be taken that im-      mixtures to visualize possible unwanted systematic effects due to,
purities are not added during those processes, which might cause           e.g., intake of impurities. Therefore, gas was removed in the beginning
interferences. Experiments with pressure variations were performed in      to lower the system pressure and then added again at the end.

                                                                                                    Figure 1: Schematic of the Miss Piggy based
                                                                                                    setup as used during the investigations
                                                                                                    presented here. The gray lines represent
                                                                                                    steel tubes, the orange ones PFA-TEFLON®
                                                                                                    tubes. A description is given in the text. MFC
                                                                                                    stands for Mass-Flow-Controller.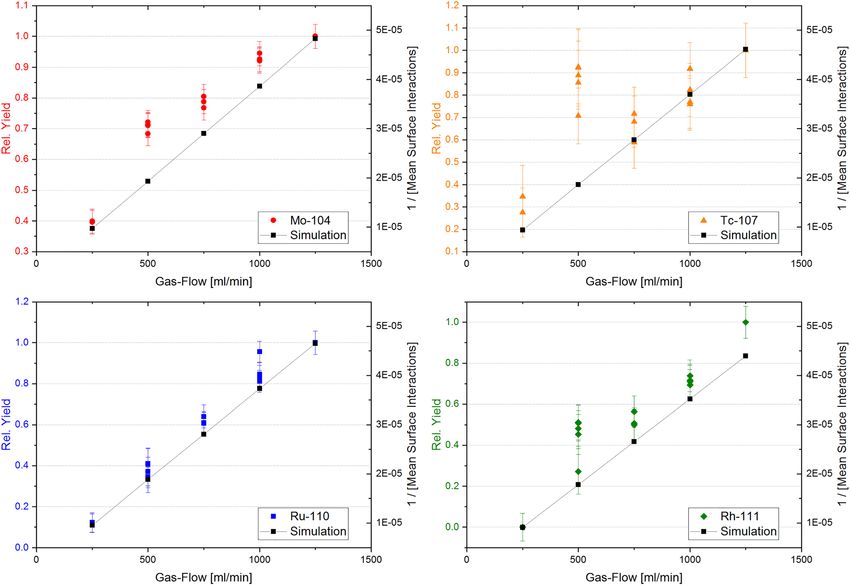
4          Y. Wittwer et al.: Fast On-line Reaction Apparatus (FORA)

                                                                                                     Figure 2: FORA setup as used during gas flow
                                                                                                     and pressure investigations.
                                                                                                     The black parts are made from steel, the red
                                                                                                     ones from PFA-TEFLON®. The blue arrows
                                                                                                     mark the gas flow during normal operation,
                                                                                                     the green ones during addition/removal of
                                                                                                     process gas. The circles represent three-
                                                                                                     way valves. MFC stands for Mass-Flow-
                                                                                                     Controller, VFM for Volume-Flow-Meter.
                                                                                                     MFC4 was turned to either add or remove
                                                                                                     gas at controlled gas flow rates. After
                                                                                                     complete evacuation, FORA was filled by
                                                                                                     adding gas directly into the buffer-volume
                                                                                                     (not shown here).

Measurements at 1.0 and 0.5 bar were repeated multiple times right          were investigated in combination with various degraders. Two
after each other to reveal the reproducibility of the measurements. To      different purification setups were used. The first purification setup was
vary the gas flow rate while keeping pressure constant, a very similar       the same as in previous accelerator based studies, consisting of a
approach was used. Again, the necessary standard gas flow was                column filled with MnO, to catch O2 and transform it into CO2, a col-
calculated by Equation (1) to reach the desired actual gas flow while        umn filled with TEPAN (Tetraethylenepentamine on Poly(methyl
keeping pressure constant. The effect of gas flow on the overall yield       methacrylate)-adsorber, PMMA, support [36]), to adsorb CO2, and a
was measured varying gas composition and pressure as follows: 100%          Sicapent™ column to remove water impurities. The columns were
CO at 1.0 bar, 100% CO at 0.5 bar and a mixture of 50:50 CO:He at           mounted in this order. The second configuration was chosen to
1.0 bar. For the measurements at 1.0 bar, the gas flow was varied            maximize the purity of the used process gas. A Sicapent™ followed by
between 250 ml/min and 1250 ml/min. For measurements at 0.5 bar, it         a MicroTorr 602F column were used. Using MnO, TEPAN and Sica-
was varied between 200 ml/min and 800 ml/min. The same pre-                 pent™, the impact of kinetic energy was investigated in 50:50 gas
cautions as before were taken to avoid interferences. The order of the      mixtures of CO in He, N2 and Ar. Pressure was set to 1 bar and gas flow
measurements was pseudo-randomized. A Sicapent™ column fol-                 to 1650 ml/min, being the highest gas flow reliably achievable with
lowed by a MicroTorr 602F purification cartridge were used for process       FORA in this configuration. All measurements were performed in a
gas purification. Sicapent™ was used to remove moisture while the            random order to exclude time-dependent effects on the yields, as they
MicroTorr 602F column is a professionally made purification column           were observed previously. A measurement time of 2 h was sufficient. It
made specifically to purify CO. It is certified to remove a large number      was waited for at least 12 h after setting up the system for equilibration
of impurities, including O2 and H2O to volume concentrations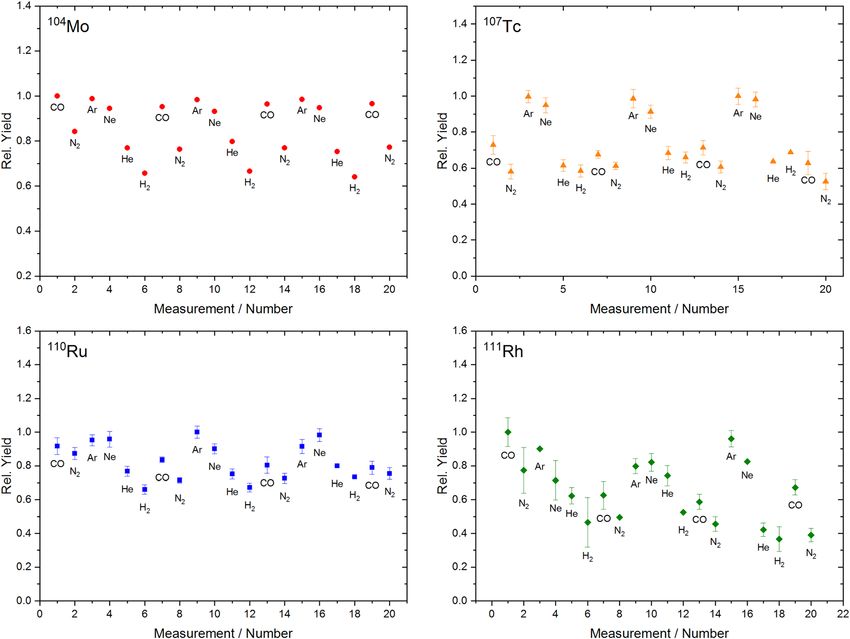
Y. Wittwer et al.: Fast On-line Reaction Apparatus (FORA)               5

                                                                                                      Figure 3: The aluminum-wheel with the re-
                                                                                                      action chamber mounted on top is depicted
                                                                                                      from two different angles. The left picture
                                                                                                      shows a cross section of the setup.
                                                                                                      The 252Cf-source is mounted directly under
                                                                                                      the chamber inlet below the wheel. The
                                                                                                      eight holes in the aluminum-wheel can be
                                                                                                      occupied with degrader foils of various
                                                                                                      thicknesses. One hole was always left
                                                                                                      open. The wheel includes a closed position.
                                                                                                      Also visible is one of the two gas-inlets of
                                                                                                      the chamber. The other one is located on
                                                                                                      the other side of the chamber.

was filled with air and the catcher foil was removed. The catcher foil
was wrapped up, placed into a PFA-TEFLON® tube and positioned
subsequently in front of a γ-detector. After waiting for about 24 h to
reduce the amount of interfering short-lived fission products decaying
on the catcher foil, a γ-spectrum was recorded for 24 h. Care was taken
to make sure that the procedure, including timing and measurement
geometry, was the same for all catcher measurements.
     Since timing and measurement geometry were equal for all
catcher foil measurements, the determined peak areas in the γ-spectra
can be directly compared. By investigating a γ-peak corresponding to a
rather long lived 252Cf fission product as a function of degrader-
thickness, it is possible to determine the relative transmission of
fission products with comparable atomic number through each
degrader foil according to Equation (2).
                                        A( x)
                              T( x) =                                  (2)
                                         A0

       A(x) is the empirical γ-peak area of the chosen marker isotope
measured corresponding to the catcher foil mounted on top of the
degarder with thickness x µm. A0 is the empirical reference peak area for    Figure 4: Experimentally measured transmission through degrader
the same tracer isotope but collected without using a degrader foil. T(x)    foils with different thicknesses in the FORA-setup.
is the fraction of fission products being collected by the catcher foil and   A thickness of 0 μm corresponds to not using any degrader foil at all.
therefore also entering the reaction chamber in a FORA experiment,           The error bars correspond to the statistical uncertainty of each
with an x μm thick degrader foil placed between 252Cf-source and             measurement.
catcher. The data measured in the actual FORA experiments are then
corrected for the degrader foil transmission by dividing the obtained
signal through the corresponding T(x)-value (see Figure 4). 103Ru
(t1/2 = 39.26 days) with an associated γ-emission at 497 keV was used as     reaction chamber of FORA. The heater surrounding the chamber is
tracer isotope for this measurement. 103Ru is produced with a cumula-        depicted in Figure 5.
tive fission yield of 5.45% by spontaneous fission of 252Cf. It is mostly           The heater was made from a copper-block with two heating ele-
implanted into the catcher foil as 103Zr, 103Nb and 103Mo with indepen-      ments. The heating elements (type: HS/VDE) were provided by Probag
dent fission yields of 0.84, 3.06 and 1.47% respectively [37]. Unfortu-       Wärmetechnik AG with a diameter of 6.5 mm, a length of 40 mm and a
nately, Mo, Tc and Rh do not have long-lives isotopes produced by            heating power of 100 Watt. A thermocouple was used to monitor the
spontaneous fission of 252Cf suitable for similar determination studies of    temperature of the oven. Note that during regular operation the tem-
transmission rates. Their transmission rates as a function of different      perature of the copper-block was monitored, not the one of the actual
degrader-thicknesses were estimated to be the same as determined for         gas flowing through the reaction chamber. Since the reaction chamber
103                                                                          is made from PFA-TEFLON®, it was decided to limit the maximum
   Ru. This is considered appropriate since the atomic numbers of all
investigated isotopes are close enough to 103Ru.                             investigated temperature to 150 °C to avoid any damage.
                                                                                  Figure 6 shows the temperature of the process gases used for
                                                                             temperature investigations as a function of the copper-heater tem-
2.5 Temperature                                                              perature. The temperatures of the investigated gases and gas mixtures
                                                                             were measured in preparatory measurements by inserting a thermo-
To investigate the effect of temperature onto the formation of MCCs, an      couple into the volume of the reaction chamber before heating. The
heating device was built to control elevated temperatures of the             chamber was flushed with process gas at a pressure of 1.00 bar and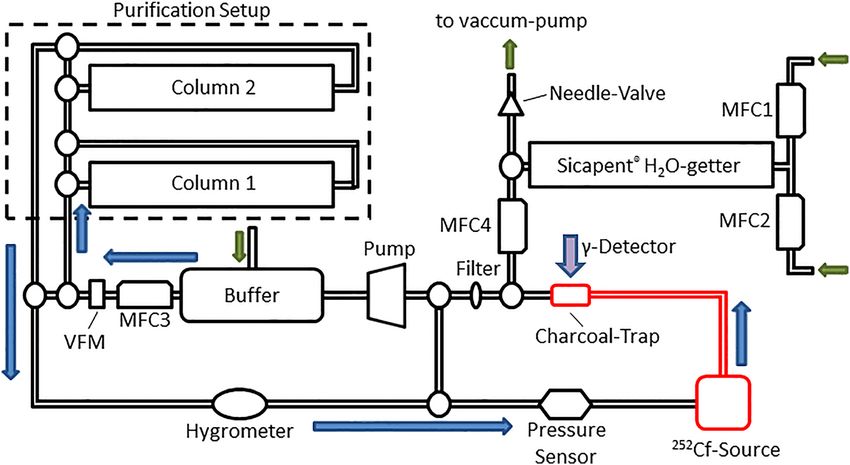
6         Y. Wittwer et al.: Fast On-line Reaction Apparatus (FORA)

                                                                          Figure 6: Temperature of the process gas passed through the
                                                                          reaction chamber as a function of the temperature of the heater.
                                                                          The red circles were measured using 100% CO, the blue squares
                                                                          were measured using 50:50 CO:He.

                                                                          of the gases always being CO and the other one being varied. He, Ne,
                                                                          Ar, N2 and H2 were investigated in this order. The entire measurement
                                                                          series was repeated three times. Prior to usage, Miss Piggy was flushed
                                                                          with N2 at 100 sml/min for two days. The pressure was kept constant at
                                                                          1.2 bar. Slight over pressure was chosen to minimize potential
Figure 5: Top-view of the reaction chamber, emphasizing the               air-intake. The total gas flow rate was set to be always equal to
copper heating jacket (brown mantle mounted around the chamber).          600 sml/min. The measurement time was set to 30 min.
The copper-block was heated using heating-elements that fitted into
holes on top of the copper-mantle (one visible). The temperature
was permanently monitored using a thermocouple mounted in an              2.7 Simulations
additional hole of the heating jacket.
                                                                          The adsorption of MCCs during transport was simulated using Matlab
                                                                          R2019a. A Monte Carlo based method developed by I. Zvara was used
1000 ml/min, resembling the conditions in the actual measurement.         [39]. The reaction chamber was represented by a 72 mm long tube with
This thermocouple was removed for the subsequent FORA measure-            a diameter of 40 mm followed by a 2 m long tube with a diameter of
ments to have the produced MCCs only in contact with PFA-TEFLON®.         2 mm, both made from PFA-TEFLON®. The chamber is illustrated in
After evacuating and filling FORA with fresh process gas the gas loop      Figure 7. In the code, this was achieved by changing the inner diam-
was operated for at least 12 h before starting an experiment. The         eter of the column from 40 to 2 mm as soon that a particle traveled
chamber was heated from RT to 150 °C in steps of 50 °C, cooled down       further than 72 mm. The corresponding adsorption enthalpies on
overnight and then heated again to 75 and 125 °C. Measurements were       PFA-TEFLON® were taken from [40–42]. 10,000 particles were
performed in 100% CO and 50:50 CO:He at constantly 1 bar pressure         simulated for each investigated experimental condition. Simulations
and 1000 ml/min gas flow. A Sicapent™ and a MicroTorr 602F puri-           targeted at determining the number of surface interactions of a
fication cartridge were used permanently for gas purification. The          molecule during transport were performed using the same simulation.
measurement duration was set to 3 h. Increasing the temperature of        It was counted how often a molecule collides with a surface on its way
the process gas decreases its density which in turn decreases its         to the charcoal trap. The value depicted in Figure 12 is the mean value
stopping power. Using the ideal gas law, the data shown in Figure 6       of 10,000 simulated molecule trajectories for each investigated con-
and the SRIM software [38], the increase in ion range can be estimated    dition. Only the capillary connecting the reaction chamber and the
to be about 18% for pure CO and 8% for a 50:50 gas mixture of CO:He       charcoal trap was considered for this simulation. Simulations con-
upon heating the reaction chamber from 25 to 150 °C. Especially for       cerning the range of fission products in the reaction chamber were
pure CO, it cannot be excluded that this reduced the observed yield.      performed using a combination of SRIM2013 [38] and Matlab R2019a.
                                                                          The general method will be briefly summarized in here. Detailed
                                                                          descriptions for all simulations and calculations are given in the
2.6 Gas mixtures                                                          supporting information. In a first step, it is considered that fission
                                                                          products must be emitted from the fission source with a certain initial
The synthesis and transport of MCCs in various gas-mixtures was           trajectory in order to cross the aluminum-wheel between 252Cf source
investigated using Miss Piggy. Gases were mixed in a 1:1 ratio with one   and reaction chamber, serving as a collimator. Using a Monte Carlo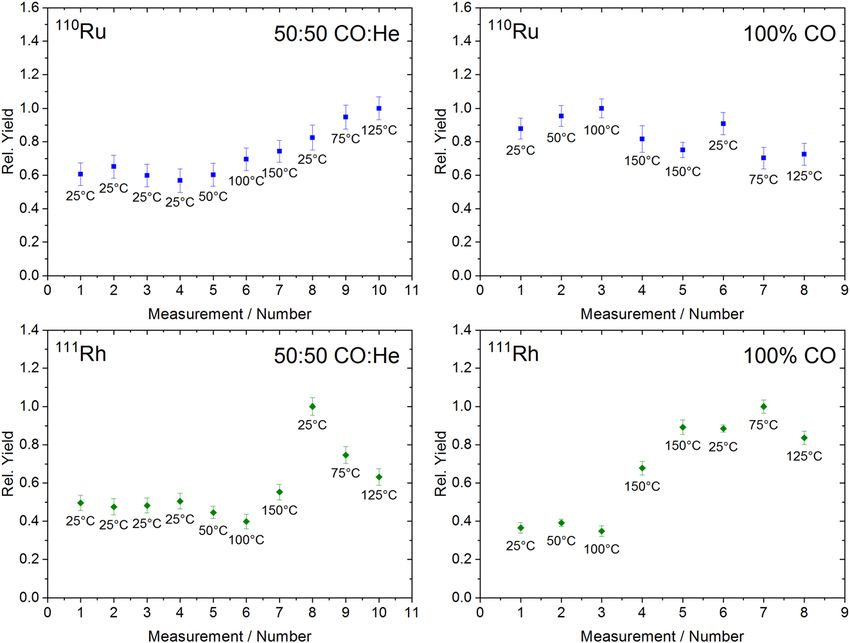
Y. Wittwer et al.: Fast On-line Reaction Apparatus (FORA) 7
Table : Highest and lowest absolute chemical yields for each
MCC-species investigated during this study.
Chemical Speces Lowest chemical yield Highest chemical yield
Mo(CO) ± ±
Tc(CO)n ±
Ru(CO) ± ±
Rh(CO)m ±
presented here, but by the reference values required for calculation. In
case of Tc(CO)n and Rh(CO)m, the lowest obtained yields correspond to
non-observation above background signal in the associated gamma
spectra.
3 Results and discussion
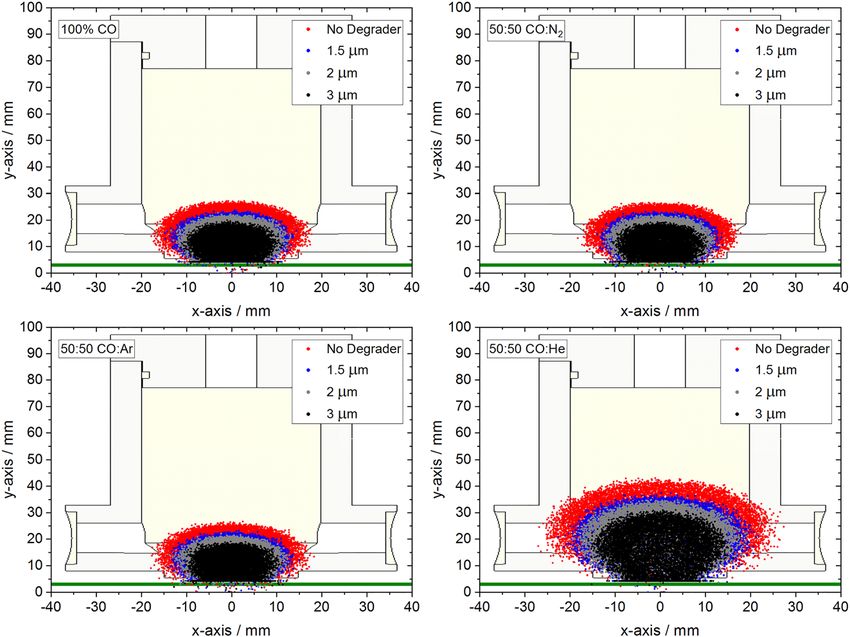
Figure 7: The schematic of the reaction chamber in the FORA setup.
The 252Cf fission source is located below the chamber (indicated by
3.1 Gas flow
the red bar).
The dependency of the overall MCC-yield on the gas flow
based approach, suitable initial trajectories were determined for
was investigated for two different gas mixtures and two
10,000 recoiling atoms. In a second step, those initial trajectories are
used as input for the SRIM-software [38], which evaluates the range
pressures. Results are depicted in Figures 8–10.
and complete trajectories of fission products in a set matrix. The According to the results presented here, high gas flows
SRIM-software calculates the position of each of the 10,000 particles are desirable in any case, having a rather large impact on
after being thermalized. These positions were used for further evalu- the overall yield for MCCs. On a first glance, this is intui-
ation. The matrices were adapted to each experiment. They included tively understandable since high gas flows result in lower
the used process gas as well as degrader foils.
transport times and therefore higher yields, especially for
Simulations were performed for 104Mo with an initial energy of
103 MeV [43]. They should be representative for 107Tc, 110Ru and 111Rh as elements with short half-lives. However, the black points in
well due to similar atomic numbers. A correction factor determined Figures 8–10 connected by dotted lines represent the ex-
from [44] was used to account for the underestimation of stopping pected yield assuming the decay of the isotopes under
power by SRIM in the gas phase. consideration during their transport to be relevant. It is
based on a simple volume-flow model, which is further
2.8 Absolute yields described in the supporting information. The prediction
generally overestimates the yields. Overestimation is
As it was described in more detail in [32], converting the obtained data especially severe for Mo. 104Mo, has the longest half-life of
into absolute chemical yields for the synthesis of each investigated all investigated isotopes and should therefore be the least
species is possible in principle, but results in large uncertainties.
sensitive towards gas flow alterations. Experimentally, it is
These uncertainties are not caused by the quality of the performed
measurements, but by the literature values required for calculation, observed that Mo is about equally sensitive towards gas
especially γ-branching ratios and fission yields, as well as the effi- flow variations as the other elements, indicating that the
ciency calibration of the gamma detector. Due to this reason, the data observed behavior cannot be caused by pure transport time
presented here are not converted to absolute yields but instead effects. Aside from pure transport based effects, adsorption
normalized as described in the caption of each figure for the error bars retention might cause the observed yield drop too.
to reflect the precision of the actual measurement and allow for a
In Figure 11, data obtained in 100% CO at 1 bar and a
proper representation of the investigated trends. To give a rough
estimation concerning the efficiency of the chemical reactions gas flow of 1000 ml/min are compared with simulations
observed in this study as well as to give a rough idea about the dif- including the effects of adsorption during transport from
ferences in yields for the different investigated species, the absolute the reaction chamber to the charcoal trap. Introducing the
chemical yields for the highest and lowest activities measured during effect of adsorption does not significantly impact the pre-
the studies presented here are shown for each species in Table 1. The
dicted yields in comparison with the model only account-
absolute chemical yields were calculated using a method based on
determining the activity of the 252Cf source used within FORA by using ing for overall transport. The effect is not explaining the
catcher foils. The method is described in [33]. Note again that the large observed difference between experiment and prediction.
uncertainties given are not caused by the quality of the measurements An alternative explanation would be the formation of side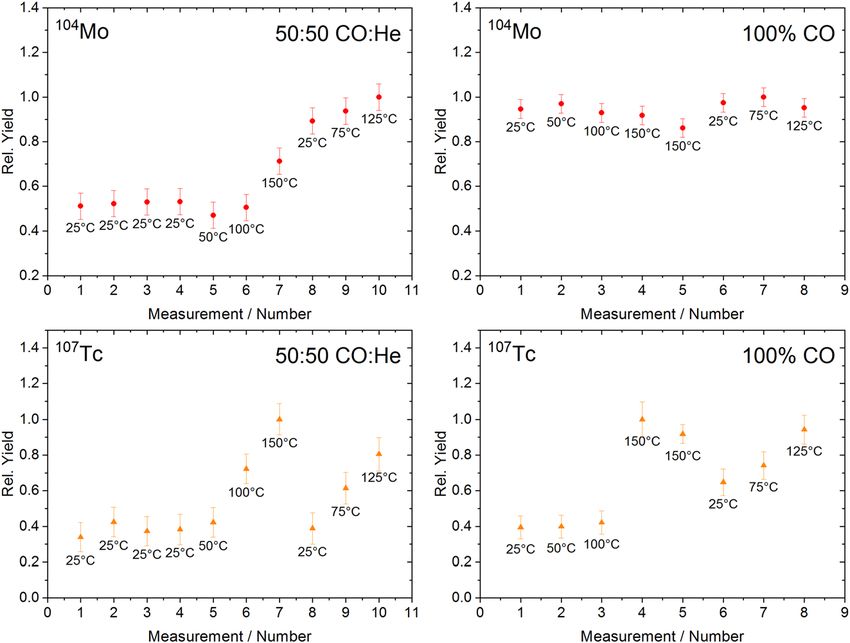
8        Y. Wittwer et al.: Fast On-line Reaction Apparatus (FORA)

                                                                                         Figure 8: Effect of changing gas flows onto
                                                                                         formation and transport of MCCs.
                                                                                         The experimental data are shown as colored
                                                                                         symbols. 50:50 CO:He at 1 bar was used.
                                                                                         The actual gas flow calculated by
                                                                                         Equation (1) is depicted. The black squares
                                                                                         connected by black, dotted lines
                                                                                         correspond to expectation values based on
                                                                                         transport time and thus decay loss
                                                                                         assuming a laminar flow profile. The data
                                                                                         are normalized to the highest measured
                                                                                         yield.

                                                                                         Figure 9: Effect of changing gas flows onto
                                                                                         formation and transport of MCCs.
                                                                                         The experimental data are shown as colored
                                                                                         symbols. 100% CO at 1 bar was used. The
                                                                                         data are normalized to the highest signal.
                                                                                         The actual gas flow calculated by
                                                                                         Equation (1) is depicted. The black squares
                                                                                         connected by black, dotted lines
                                                                                         correspond to expectation values based on
                                                                                         transport time and thus decay loss
                                                                                         assuming a laminar flow profile. The data
                                                                                         are normalized to the highest measured
                                                                                         yield.

products. If side reactions with O2 or H2O are assumed to            at high O2-concentrations. An effect of H2O is more prob-
take place during transport, a shorter transport time might          able. Nevertheless, studies concerning the mechanism
reduce the degree of non-volatile side product formation             behind the yield-reducing effect of O2 and H2O were also
due to a more limited reaction time available. The forma-            performed, during which it was shown that impurities
tion of radioactive MCCs in FORA upon addition of various            mostly affect the formation of MCCs, while the transport is
impurities was studied in the past [32]. An effect of O2 is          less affected. However, the coverage of PFA-TEFLON® with
very unlikely for Mo, Tc and Ru, since a reduction of yield          adsorbed H2O is still expected to have a strong impact on
for their associated volatile compounds was only observed            the transport yield of MCCs, as surface reactions of MCCs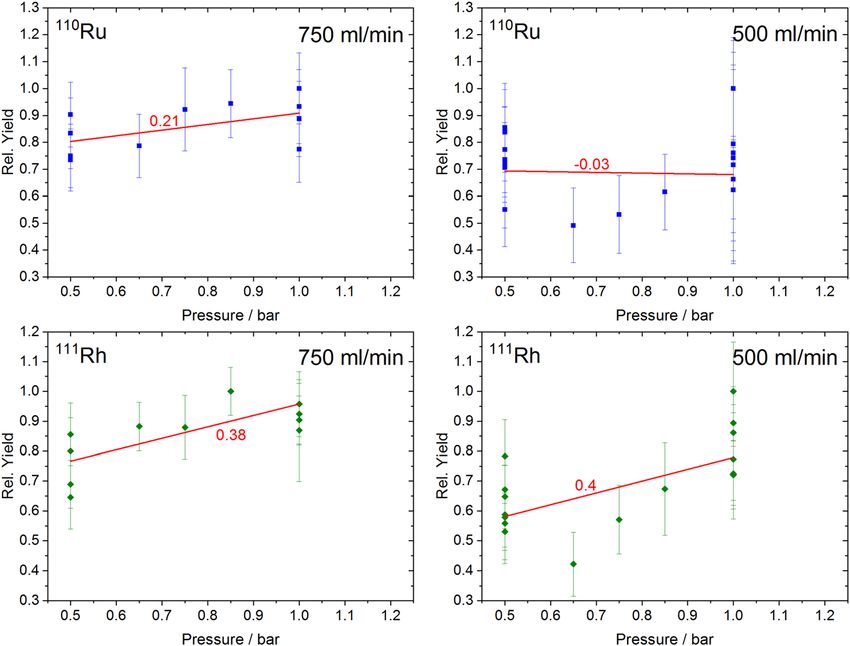
Y. Wittwer et al.: Fast On-line Reaction Apparatus (FORA)        9

                                                                                    Figure 10: Effect of changing gas flows onto
                                                                                    formation and transport of MCCs.
                                                                                    The experimental data are shown as colored
                                                                                    symbols. 100% CO at 0.5 bar was used. The
                                                                                    data are normalized to the highest signal.
                                                                                    The actual gas flow calculated by
                                                                                    Equation (1) is depicted. The black squares
                                                                                    connected by black, dotted lines
                                                                                    correspond to expectation values based on
                                                                                    transport time and thus decay loss
                                                                                    assuming a laminar flow profile. The data
                                                                                    are normalized to the highest measured
                                                                                    yield.

                                                                                    Figure 11: The data from Figure 9 compared
                                                                                    with simulations including the effects of
                                                                                    adsorption (see text for details).
                                                                                    The colored symbols correspond to the
                                                                                    experimental data measured in 100% CO at
                                                                                    1 bar. The black squares connected by
                                                                                    dotted black lines correspond to
                                                                                    expectation values based on transport time
                                                                                    and thus decay loses including the effect of
                                                                                    adsorption on PFA-TEFLON®.

with moisture might cause significant losses. It is assumed   adsorbed on PFA-TEFLON®, it is expected to cause side
that MCCs are in an equilibrium with partially decomposed    reactions forming non-volatile products upon adsorption.
products. For example:                                       As an increased gas flow reduces possible interactions
                                                             between MCCs and the walls with adsorbed H2O, this re-
               Mo( CO)6 ⇌ Mo( CO)5 + CO
                                                             veals a favorable effect on the overall yield. Additional
    If such a decomposition reaction happens in the          indication arises from the results during investigations of
adsorbed state of the carbonyl in close proximity to H2O     the reaction temperature (see Section 2.5).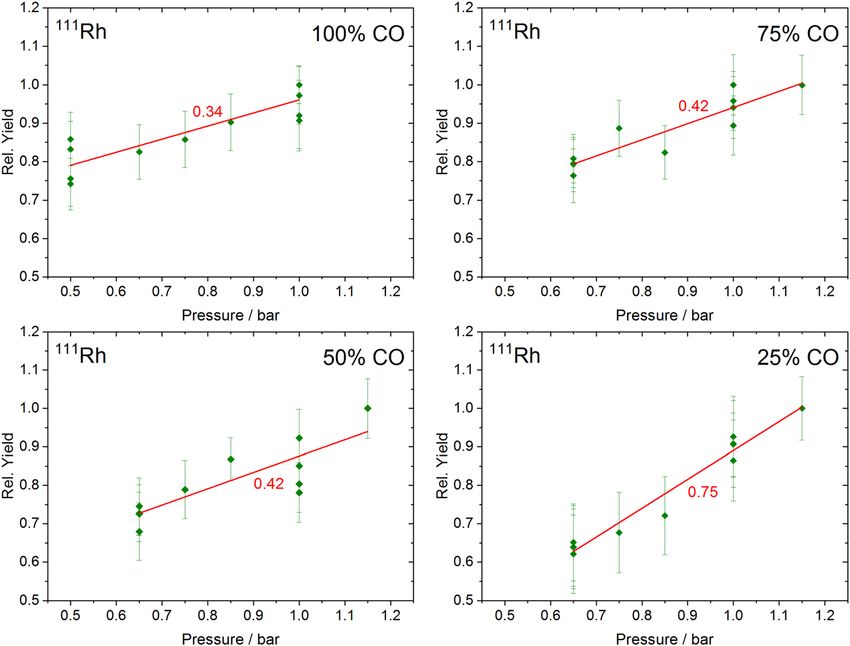
10         Y. Wittwer et al.: Fast On-line Reaction Apparatus (FORA)

Figure 12: The data from Figure 9 compared with simulations counting the number of surface interactions of a carbonyl complex while being
transported from the reaction chamber to the charcoal trap.
Shown is the average number of surface interactions simulated for 10,000 particles at each gas flow. To allow for comparison with the
experimental data, the inverse number of average interactions is shown. The colored, left y-axis represents the experimental data, the black,
right y-axis the simulations.

     In order to gain additional evidence for this assump-                   For Mo and Rh, an increase in yield upon increasing
tion, it was simulated how often a carbonyl complex en-                  pressure is observed independent of other reaction condi-
counters a surface on its way from the reaction chamber to               tions. For Mo, the effects correspond to an increase be-
the charcoal trap as a function of the applied gas flow                  tween 10 and 30% with higher pressure in the investigated
(compare with chapter 2.7). The results are shown in                     range. For Rh, the effect is stronger, amounting to about
Figure 12. The obtained simulations qualitatively repro-                 20–50%. For Tc and Ru, the pressure-dependency appears
duce the experimentally obtained linear trends very well,                to be less pronounced. The observed increase in yield upon
which provides support to the assumption that surface                    increasing the system pressure was already observed in
collisions as a function of the gas flow correlate with the               previous studies by Usoltsev [34]. The data shown here
experimentally observed trends, probably due to side re-                 confirm this. The effect is expected to be related to an
actions with adsorbed H2O.                                               increased collision frequency with CO-molecules at high
                                                                         pressure and increased diffusion times for both, the
                                                                         incomplete MCC products to the walls and the reactive
3.2 Pressure                                                             trace contaminants to the incomplete MCC products. It is
                                                                         unexpected that the effect of pressure appears to be less
The resulting yields for the four investigated tracer isotopes           pronounced for Tc and Ru in comparison with Mo and Rh.
forming MCCs obtained for pressure variations in different               The effects can neither be assigned to increased impurity
gas mixtures are depicted in Figures 13–16. Pressure                     concentrations upon pressure increase nor to transport
investigations for different gas flows are depicted in                    effects. 111Rh has the shortest half-life and is expected to be
Figures 17 and 18.                                                       the most sensitive element towards impurities in the
Y. Wittwer et al.: Fast On-line Reaction Apparatus (FORA) 11
Figure 13: Pressure dependence of the
overall yield for Mo-MCCs (red symbols) in
different gas-mixtures.
Linear fits (red lines) were applied to all
data to compare the slopes given as red
numbers. The data are normalized to the
highest yields.
Figure 14: Pressure dependence of the
overall yield for Tc-MCCs (orange symbols)
in different gas-mixtures.
Linear fits (red lines) were applied to all
data to compare the slopes given as red
numbers. The data are normalized to the
highest yields.
process gas. If yield-lowering effects are expected for Tc Decreasing the range of fission products by increasing
and Ru due to those two causes, they would have been the thickness of the used degrader foil was found to
expected to affect Rh even stronger. decrease the overall yield for all investigated isotopes by
up to 80%. A series of simulations was performed to obtain
insight into the observed dependency between overall
3.3 Kinetic energy MCC-yield and the kinetic energy of fission products
entering the reaction chamber.
It was investigated if the kinetic energy of fission products Figure 23 shows the reaction chamber of FORA scaled
recoiling into the reaction chamber impacts the formation to the shown coordinate system together with the results
of MCCs. The results are shown in Figures 19–22. from the SRIM simulations as an overlay. The position of12 Y. Wittwer et al.: Fast On-line Reaction Apparatus (FORA)
Figure 15: Pressure dependence of the
overall yield for Ru-MCCs (blue symbols) in
different gas-mixtures.
Linear fits (red lines) were applied to all
data to compare the slopes given as red
numbers. The data are normalized to the
highest yields.
Figure 16: Pressure dependence of the
overall yield for Rh-MCCs (green symbols) in
different gas-mixtures.
Linear fits (red lines) were applied to all
data to compare the slopes given as red
numbers. The data are normalized to the
highest yields.
the aluminum-wheel in which the degrader foils are 1.5 μm thick foil (second highest range) causes a decrease
mounted (cf. Figure 3) is indicated by the green horizontal in yield of roughly 50% while going from 1.5 to 3 μm
line in Figure 23, 3 mm above the origin. In (smallest range) causes an additional decrease by about
Figures 19–22 a decrease in overall yield upon reduction of 20%. Arguably, the decrease in 50:50 CO:Ar when going
fission product kinetic energy is observed. For 100% CO as from 1.5 to 3 μm is smaller than for 50:50 CO:N2 and 100%
well as 50:50 gas mixtures of CO:N2 and CO:Ar, this CO. Considering the simulations shown in Figure 23, it is
decrease is quantitatively comparable for all investigated expected that 100% CO and 50:50 CO:N2/Ar show a very
isotopes and all mentioned process gases. Changing from similar behavior towards kinetic energy variations, as the
operation without a degrader foil (maximum range) to a emission profiles of fission products in the three matricesY. Wittwer et al.: Fast On-line Reaction Apparatus (FORA) 13
Figure 17: Pressure investigations for Mo
(upper panels, red symbols) and Tc (lower
panels, orange symbols) in 100% CO at two
different gas flows. Linear fits (red lines)
were applied to all data to compare the
slopes given as red numbers.
The data are normalized to the highest
yields.
Figure 18: Pressure investigations for Ru
(upper panels, blue symbols) and Rh (lower
panels, green symbols) in 100% CO at two
different gas flows.
Linear fits (red lines) were applied to all
data to compare the slopes given as red
numbers. The data are normalized to the
highest yields.
are very similar. As this was also found experimentally, reaction chamber are flushed out more efficiently, thereby
it illustrates that indeed, the observed behavior is caused resulting in shorter transport times. However, the fact that
104
by kinetic energy variations and not a potential interfer- Mo having a half-life of 60 s and 111Rh with a half-life of
ence, e.g., by impurities. There is a number of possible only 11 s show the same behavior makes a simple transport
scenarios potentially explaining the observed decrease in based mechanism unlikely. As discussed in Section 3.1,
yield. According to our simulations, fission products are reactions between partially decomposed MCCs and water
stopped rather soon after entering the reaction chamber, adsorbed on PFA-TEFLON® surfaces are expected.
between the two gas inlets at the side of the chamber. It Depending on the overall gas dynamics and diffusion ki-
could be argued that particles penetrating deeper into the netics, it cannot be excluded at this point that fission14 Y. Wittwer et al.: Fast On-line Reaction Apparatus (FORA)
Figure 19: Effect of kinetic energy onto
formation and transport of MCCs in 100%
CO (colored symbols).
The thickness of the used degrader foil is
depicted on the x-axis. A degrader
thickness of 0 μm corresponds to no
degrader foil being used at all.
Experimental details are given in the text.
The signal is normalized to the highest
obtained yield. The trend line (red line) is
there to guide the eye.
Figure 20: Effect of kinetic energy onto
formation and transport of MCCs in 50:50
CO:N2 (colored symbols).
The thickness of the used degrader foil is
depicted on the x-axis. A degrader
thickness of 0 μm corresponds to no
degrader foil being used at all.
Experimental details are given in the text.
The signal is normalized to the highest
obtained yield. The trend line (red line) is
there to guide the eye.
products being stopped earlier have a higher chance to volume could be arbitrarily defined in y-direction (along
come into contact with PFA-TEFLON® surfaces and the y-axis in Figure 23). A particle not surpassing this
therefore with adsorbed water molecules. range, is then assumed to not be transported, despite
An alternative explanation for the observed behavior maybe still forming a MCC. By checking how many parti-
might be associated with atoms being able to enter the cles are, according to this definition, not entering the
reaction chamber as a function of the applied degrader foil. chamber and assuming all such particles to be lost in
One can assume that only fission products entering the respect to the overall yield, one can predict overall yields as
larger volume of the reaction chamber are transported to shown in Figure 24 and compare the outcome with the
the charcoal trap. A critical particle range to enter this actual experiment. Figure 24 shows two sets of simulationsY. Wittwer et al.: Fast On-line Reaction Apparatus (FORA) 15
Figure 21: Effect of kinetic energy onto
formation and transport of MCCs in 50:50
CO:Ar (colored symbols).
The thickness of the used degrader foil is
depicted on the x-axis. A degrader
thickness of 0 μm corresponds to no
degrader foil being used at all.
Experimental details are given in the text.
The signal is normalized to the highest
obtained yield. The trend line (red line) is
there to guide the eye.
Figure 22: Effect of kinetic energy onto
formation and transport of MCCs in 50:50
CO:He (colored symbols).
The thickness of the used degrader foil is
depicted on the x-axis. A degrader
thickness of 0 μm corresponds to no
degrader foil being used at all.
Experimental details are given in the text.
The signal is normalized to the highest
obtained yield. The trend line (red line) is
there to guide the eye.
assuming fission products to require different critical experimentally determined stopping ranges of atoms
ranges to be available for reaction and transport. The limit recoiling into gases with the ones determined by SRIM and
of 5.5 mm is the minimal distance fission products need to found a discrepancy between the two values. The correc-
travel in order to reach the very bottom of the reaction tion factor obtained in their work was deduced from ele-
chamber according to the geometry of the FORA-setup. The ments much heavier than the ones investigated in this
limit of 13.9 mm results from a least square error minimi- study. Since this correction factor is used in the simulations
zation procedure to find the critical range resulting in the depicted in Figure 23, it is possible that actual ranges of
best fit between simulations and experimental data, still fission products are overestimated or underestimated
not describing the observation. Note that such simulations by 20–50%. However, the comparison between the exper-
must be handled with caution. Wittwer et al. [44] compared imental data and results of the simulations shown in16 Y. Wittwer et al.: Fast On-line Reaction Apparatus (FORA)
Figure 23: 2D-representation of the SRIM
simulations depicting the position of
fission products after thermalization in
various process gases with various
degrader foils.
An overlay of the results obtained from the
SRIM simulations and the reaction chamber
of the FORA-setup is depicted. The green
horizontal line indicates the position of the
aluminum-wheel with the incorporated
degrader foil. Details concerning the
simulations are given in the supporting
information.
Figure 24 reveals that the stopping of fission products prior factor is related to implantation of fission products into the
to entering the reaction chamber impacts the overall yield, chamber walls prior to thermalization. The data shown in
but is not the only cause of the observed trend. Another loss Figure 23 include the implantation loss of ions into the
chamber walls. This loss appears significant in the CO/He
mixture and not in the other gas mixtures. Severe im-
plantation losses are not expected in 100% CO and 50:50
CO:N2/Ar, else an opposite trend would have then be
observed experimentally. However, it is worth pointing at
the observed trend in 50:50 CO:He (Figure 22). It appears
again that overall yields are decreasing with decreasing
kinetic energies, but the yield loss determined between no
degrader and a 1.5 μm thick degrader foil amounts to only
about 30%, being significantly lower than for the other
systems (cf. Figures 19–21). Figure 23 illustrates the much
higher ranges of fission products in 50:50 CO:He in com-
parison to the other gas mixtures used, due to the small
stopping power of He. The lower difference in relative
yields observed in 50:50 CO:He is assumed to be caused by
an already reduced yield without degrader foil due to im-
plantation losses. This is in agreement with the measured
data comparing the yield in different gas mixtures with
Miss Piggy (see Figure 27).
Figure 24: Influence of the degrader thickness on the yields for
104
Mo(CO)6 as shown in Figure 19 (red dots).
The black squares correspond to simulations assuming that fission
products have to recoil at least 5.5 mm away from the 252Cf-source to 3.4 Temperature
form MCCs and to be thus transported to the detection setup. The
black triangles correspond to the same, but assuming a minimal The effect of heating the reaction chamber of FORA was
distance of 13.9 mm instead. These yields are calculated using the
investigated.
data shown in Figure 23. These data include the implantation loss of
ions into the chamber walls. All data sets were normalized to the Figures 25 and 26 depict the results obtained when
yield measured for the maximum ion range, i.e., without degrader. varying the temperature of the reaction chamber. To
The lines are shown to guide the eye. elucidate the observed behavior, the data are not plottedY. Wittwer et al.: Fast On-line Reaction Apparatus (FORA) 17
Figure 25: Effect of temperature onto the
formation and transport of MCCs from Mo
(upper panels) and Tc (lower panels).
50:50 CO:He (left) and 100% CO (right) at
1.00 bar and 1000 ml/min were used. The
data are normalized to the highest
measured yield. The temperature of the
copper-oven is indicated below each
measurement point.
Figure 26: Effect of temperature onto the
formation and transport of MCCs from Ru
(upper panels) and Rh (lower panels).
50:50 CO:He (left) and 100% CO (right) at
1.00 bar and 1000 ml/min were used. The
data are normalized to the highest
measured yield. The temperature of the
copper-oven is indicated below each
measurement point.
against the temperature but against chronologically reduction of the temperature. If a yield increase was caused
increasing measurement number. The temperature of the by the temperature primarily, e.g., due to activation en-
reaction chamber at each point of measurement is depicted ergy, by the selective decomposition of non-volatile side
below the data points. It was found that increasing the products or more frequent gas-phase interactions of the
temperature of the reaction chamber increases the yield for atoms and incomplete MCC molecules with CO due to
formation/transport of volatile compounds. An increase in Boltzmann statistics, one would expect the yield to
yield was observed for Tc and Rh in 100% CO as well as in decrease again if the system is cooled back to room tem-
50:50 CO:He. For Mo and Ru, the increase in yield was only perature. This was only observed for Tc. For all other ele-
pronounced in 50:50 CO:He. However, interestingly the ments, the yield remained higher after cooling the system
yield does not decrease again after the subsequent back down to room temperature. The non-reversibility18 Y. Wittwer et al.: Fast On-line Reaction Apparatus (FORA) Figure 27: Investigations concerning the influence of different gas mixtures onto the overall yield for MCCs as measured with Miss Piggy. Each measurement was repeated multiple times to ensure reproducibility. 50:50 gas mixtures were used. Half of the process gas was always CO. The remaining 50% of the process gas was varied. The varied gases are indicated by the description below each measurement point. The pressure was set to 1.2 bar and the total gas flow to 600 sml/min. The uncertainties correspond to the statistical error of the measurement. associated with heating of the reaction chamber suggests a column in front of the reaction chamber, desorption of permanent change being caused by the increased tem- water causes a permanent change to the reaction condi- perature to the process gas or/and the FORA-system itself. tions slowly lowering the water content in the gas-phase As briefly discussed in the experimental section, it was and on the surfaces of the reaction chamber leading to the found that the obtained yields in FORA are not constant but observed irreversibility of the heating effect. A water- changing over time. This was assigned to H2O being slowly induced loss during adsorption of MCCs on the surface desorbed from the inner surfaces of the FORA-loop and being responsible for the observed dependency on gas flow subsequently adsorbed by the Sicapent™ column. Indeed, was discussed in Section 3.1. This explanation fits the it was recently found that H2O has a strong effect onto the behavior of Mo and Ru. It corresponds to their sensitivity formation of inactive MCCs from Mo and Ru. For Tc, an towards H2O. In 100% CO, the effect was not visible. It is increase in yield was observed upon adding larger however expected that impurity effects become more se- amounts of water and for Rh, the data were unfortunately vere at lower partial pressures of CO, where the formation not allowing for a clear conclusion about the dependence time of the MCCs shall be increased leaving a larger part of of its yield on the gas phase humidity [32]. It is suggested the incomplete MCCs to the competing water. For Rh, the that the effects of temperature can be explained by effect is in principle observed as well. The yield appears to desorption of water from the surfaces of the reaction decrease again after a few hours in 50:50 CO:He which chamber upon heating. If the chamber is heated, desorp- might be caused by a small re-accumulation of impurities. tion of water is enhanced. It is subsequently transported Indeed, Rh was suggested to be most sensitive towards along the setup and either depositing somewhere else or impurities among the investigated elements, particularly being adsorbed by a purification column. Since FORA is a towards H2O and O2 [32]. Tc is different as the yield for its closed, continuously operating gas-loop with a Sicapent™ MCC was decreasing to a much larger extend after cooling
Y. Wittwer et al.: Fast On-line Reaction Apparatus (FORA)   19

down the reaction chamber again. This is actually closer to      power are used. For 50:50 CO:He, this was found to be a
the behavior expected from a direct effect of temperature.       dominant process at high kinetic energies. The reaction
There is a number of possible explanation concerning the         chamber in Miss Piggy is identical to the one used in FORA.
observations for Tc. As it was observed in [32] that larger      Therefore, implantation in 50:50 CO:He (see Figure 23) will
amounts of H2O appear to increase the yield for volatile Tc-     be equally severe. The same will be true in 50:50 CO:H2,
compounds. The desorption of water might increases the           explaining why those two gas mixtures gave the lowest
observed Tc-yield due to an increase of moisture in the gas-     overall yields for MCCs. N2 has similar stopping power for
phase. This would be a reversible effect upon cooling the        fission products as CO. Therefore, ranges in 100% CO and
reaction chamber. Alternatively, it is also possible that an     50:50 CO:N2 will be similar. The lower yields obtained for
increased gas flow (compare with Equation (1)) is partially       50:50 CO:N2 in comparison with 100% CO can be clearly
responsible for the observed behavior. By comparison with        assigned to the higher CO content in the latter. The high
Figures 6, 8, and 9, the expected increase in yield from gas     yields for volatile compounds of Tc and less pronounced
flow only upon heating the system from 25 to 150 °C,              for Ru in 50:50 CO:Ar and 50:50 CO:Ne might be related to
assuming homogeneous heating of the process gas be-              the kinetics of side reactions. Since Miss Piggy is not a gas-
tween reaction chamber and charcoal trap, amounts to a           loop and does not include purification columns, the used
maximum of 20%. However, gas flow based effects would             process gas contains larger amounts of impurities
influence the other MCC yields too, particularly 104Mo (cf.       compared to FORA. In recent studies, the effect of Ar im-
Figures 8 and 9).                                                purities in CO onto the overall yield for MCCs was investi-
                                                                 gated using FORA [32]. No effect was found up to 10 Vol-%
                                                                 of Ar in CO. According to the data presented here, this
3.5 Gas-mixtures                                                 means that at an Ar-concentration >10 Vol-%, the
                                                                 MCC-yield should start to increase despite the increasing
The dependency of the overall MCC-yield on the used gas          dilution of CO. Further investigations will be necessary to
mixture using the Miss Piggy setup is depicted in Figure 27.     confirm this. As implantation effects in 50:50 CO:H2 and
      For Mo and Ru, it was found that 100% CO, 50:50 CO:Ar      CO:He are assumed to be the major source of losses, in-
and 50:50 CO:Ne give the highest yields. For Tc, the yields      vestigations of MCC-yields in those gas mixtures using re-
in 50:50 CO:Ar and 50:50 CO:Ne were found to be the              action chambers with different geometries might be worth
highest. In recent studies using the Miss Piggy setup [32], it   performing. It is possible, that those gas mixtures will show
was not possible to obtain an analyzable signal for              a significantly better performance if a differently sized
111
    Rh(CO)m, probably due to its short half-life and high        chamber is used.
sensitivity towards impurities since, contrary to FORA,
Miss Piggy does not use any gs purification setups. To
counteract this issue, the transport capillaries for this        4 Conclusion
experiment were shortened in comparison to previous
studies in order to reduce transport times. The reduced          The data suggest a wide variety of reaction parameters
transport times allowed for an quantitative investigation of     being available for optimizing the yield for formation and
111
    Rh(CO)m, but the determined uncertainties are still          transport of MCCs. Experiments requiring high yields for
higher than for the other investigated elements, Rh(CO)m         MCCs under single-atom chemistry conditions are sug-
being more chemically sensitive. However, the overall            gested by this work to be performed at the highest pressure
observation appears to be similar to the other elements,         and gas flow values experimentally possible. As the effect
meaning that yield in CO:Ar and CO:Ne have a tendency            of gas flow appears to be more significant than the one of
being higher than for the other gas mixtures. Particularly,      pressure, maximizing the gas flow should be of higher
for Tc it was found that different gas mixtures have a strong    priority. For group 6 elements, it is furthermore suggested
impact on the overall yield for volatile compounds. It ap-       to perform experiments in gas-mixtures containing large
pears that gas mixtures of 50:50 CO:Ar and 50:50 CO:Ne           percentages of CO, optimally 100%. 50:50 CO:Ar and 50:50
can result in higher yields than 100% CO, which is not in        CO:Ne are promising candidates as well, due to impurity
agreement with previous investigations concluding that           dilution, stopping range and gas phase diffusion effects.
overall yields are generally higher if higher CO contents in     For the elements of group 7 and 8 these mixtures seem to
the process gas are used [34, 40–42, 45, 46]. As discussed in    provide an alternative superior to pure CO. In accelerator-
Section 3.3, implantation of fission products is expected to      based setups including separators, the kinetic energy is a
lower overall yields if gas mixtures with reduced stopping       parameter that can be adjusted to some extent by using
You can also read