Brief Communication: The reliability of gas extraction techniques for analysing CH4 and N2O compositions in gas trapped in permafrost ice wedges
←
→
Page content transcription
If your browser does not render page correctly, please read the page content below
The Cryosphere, 14, 1311–1324, 2020
https://doi.org/10.5194/tc-14-1311-2020
© Author(s) 2020. This work is distributed under
the Creative Commons Attribution 4.0 License.

Brief Communication: The reliability of gas extraction techniques
for analysing CH4 and N2O compositions in gas trapped in
permafrost ice wedges
Ji-Woong Yang1,a , Jinho Ahn1 , Go Iwahana2 , Sangyoung Han1 , Kyungmin Kim1,b , and Alexander Fedorov3,4
1 School of Earth and Environmental Sciences, Seoul National University, Seoul, South Korea
2 InternationalArctic Research Center, University of Alaska, Fairbanks, USA
3 Melnikov Permafrost Institute, Russian Academy of Science, Yakutsk, Russia
4 North-Eastern Federal University, Yakutsk, Russia
a now at: Laboratoire des Sciences du Climat et de l’Environnement, LSCE/IPSL, CEA-CNRS-UVSQ,

Université Paris-Saclay, Gif-sur-Yvette, France
b now at: Division of Earth and Planetary Materials Science, Department of Earth Science,

Graduate School of Science, Tohoku University, Sendai, Japan

Correspondence: Jinho Ahn (jinhoahn@snu.ac.kr)

Received: 16 October 2019 – Discussion started: 21 October 2019
Revised: 9 March 2020 – Accepted: 25 March 2020 – Published: 23 April 2020

Abstract. Methane (CH4 ) and nitrous oxide (N2 O) compo-          cause thawing permafrost may lead to decomposition and/or
sitions in ground ice may provide information on their pro-       remineralisation of the buried soil C and N and their abrupt
duction mechanisms in permafrost. However, existing gas           emission into the atmosphere in the form of greenhouse gases
extraction methods have not been well tested. We tested           (GHGs) such as carbon dioxide (CO2 ), methane (CH4 ), and
conventional wet and dry gas extraction methods using ice         nitrous oxide (N2 O), which in turn can trigger positive feed-
wedges from Alaska and Siberia, finding that both methods         backs (e.g. Salmon et al., 2018). In addition, projected po-
can extract gas from the easily extractable parts of the ice      lar amplification (e.g. Masson-Delmotte et al., 2013) may
(e.g. gas bubbles) and yield similar results for CH4 and N2 O     strengthen these positive feedbacks. However, the processes
mixing ratios. We also found insignificant effects of micro-      responsible for in situ C and N remineralisation and GHG
bial activity during wet extraction. However, both techniques     production in ground ice are poorly understood, despite the
were unable to fully extract gas from the ground ice, presum-     fact that ground ice accounts for a substantial portion (up to
ably because gas molecules adsorbed onto or enclosed in soil      ∼ 40–90 % by volume) of Pleistocene ice-rich permafrost, or
aggregates are not easily extractable. Estimation of gas pro-     Yedoma (e.g. Kanevskiy et al., 2013; Jorgenson et al., 2015).
duction in a subfreezing environment of permafrost should            The gases trapped in ground ice allow unique insights into
consider such incomplete gas extraction.                          the origin of ground ice and evidence for in situ microbial
                                                                  aerobic and anaerobic respiration (Boereboom et al., 2013;
                                                                  Kim et al., 2019; Lacelle et al., 2011). Among others, the
                                                                  GHGs in ground ice may provide detailed information on in
1   Introduction                                                  situ biogeochemical processes responsible for GHG produc-
                                                                  tion (i.e. methanogenesis, nitrification, and denitrification)
Permafrost preserves large amounts of soil carbon (C) and         (e.g. Boereboom et al., 2013; Kim et al., 2019). However,
nitrogen (N) in a frozen state (e.g. Hugelius et al., 2014;       the relevant analytical methods remain poorly scrutinised.
Salmon et al., 2018), temporarily removing this frozen C and      Boereboom et al. (2013) utilised the conventional melting–
N from active global cycles. Therefore, future projections        refreezing method (wet extraction) used in polar ice core
of permafrost stability are of great interest, particularly be-

Published by Copernicus Publications on behalf of the European Geosciences Union.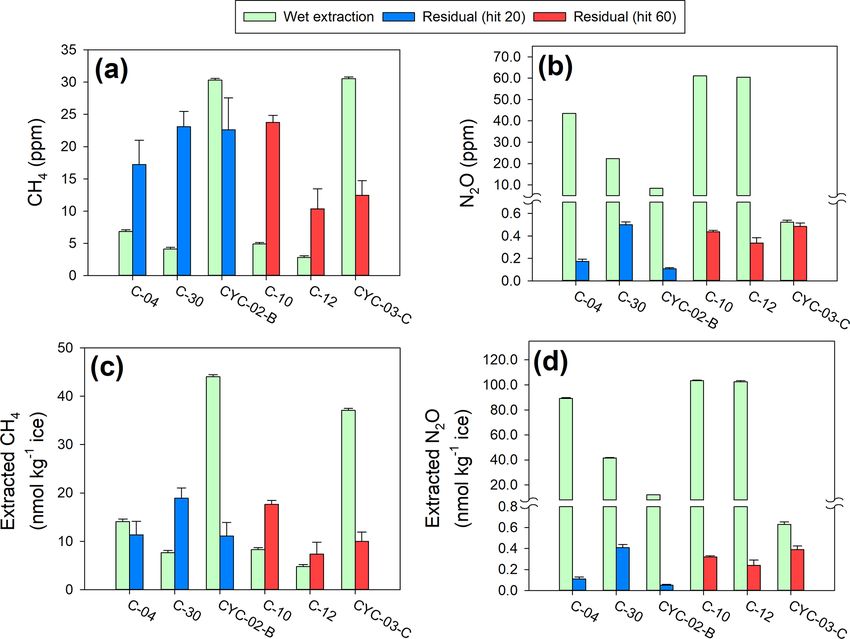
1312                                                                        J.-W. Yang et al.: Gas extraction from ice wedges

analyses, in which the ice samples were melted under a vac-       tary of the Kolyma River, ∼ 22 km north of Zyryanka. Site
uum to liberate the enclosed gases and then refrozen to ex-       B (Zy-B) was ∼ 14 km west of the start of the Kolyma tribu-
pel the dissolved gases present in the meltwater. Other stud-     tary, which begins ∼ 11 km north of Zyryanka. Site F (Zy-F)
ies conducted by Russian scientists used an on-site melting       was located ∼ 4 km west of the tributary that leads to site B.
method, in which a large (1–3 kg) block of ground ice sample      The ground ice samples were collected from riverbank walls
was melted in a saturated sodium chloride (NaCl) solution         exposed by lateral erosion using a chainsaw (Fig. S4). Most
in order to minimise gas dissolution (Arkhangelov and Nov-        of the outcrops that were sampled for ground ice were on the
gorodova, 1991). A recent study instead used a dry extraction     first (lowest) terrace of the river.
technique to prevent microbial activity during wet extraction        For the Alaskan sampling locations, Bluff03 (69.40◦ N,
(Kim et al., 2019), which employed a needle crusher in a vac-     150.95◦ W) and Bluff06 (69.14◦ N, 150.61◦ W) were located
uum to crush approximately 10 g of ice sample without melt-       in the Alaska North Slope region, ∼ 120 and ∼ 150 km
ing (Shin, 2014).                                                 from the Arctic Ocean, or ∼ 100 and ∼ 70 km northwest of
   In this study, for the first time, we tested the reliability   the Toolik Field Station (68.63◦ N, 149.59◦ W), respectively.
of both wet and dry extraction methods for CH4 and N2 O           Samples from Bluff03 were collected by chainsaw from bluff
mixing ratios and contents (volume or moles of gas in a unit      walls that had developed by gully formation on a gentle slope
mass at standard temperature and pressure (STP) conditions)       of the Yedoma. Samples from Bluff06 were collected from
using permafrost ground ice samples. Ice-wedge samples            outcrops within eroded frozen peatland in a thaw lake basin
from Alaskan and Siberian permafrost were used because            (Fig. S5). All ice-wedge samples used in this study were
ice wedges are one of the most abundant morphological fea-        stored in a chest freezer at < −18 ◦ C before analysis.
tures of massive ground ice, consisting of approximately 5–          Ice-wedge ice is different from polar ice cores in that
50 % by volume of the upper permafrost (Kanevskiy et al.,         its gas mixing ratios are not homogeneous (e.g. Kim et al.,
2013; Jorgenson et al., 2015). More specifically, we aimed        2019), which may hinder exact comparison with results from
to address the following scientific questions: (1) do wet and     adjacent ice samples. We therefore randomly mixed subsam-
dry extraction methods yield different results? (2) Are the       ples to reduce the effect of the heterogeneous gas composi-
melting–refreezing results affected by microbial activity dur-    tion distribution (the “random cube” method, hereafter). Ap-
ing gas extraction? (3) How effectively does the wet/dry ex-      proximately 100–200 g of an ice-wedge sample was cut into
traction extract gases from ice wedges? To address the first      25–50 cubes of 3–4 g each; for each experiment, ∼ 10–12
question, we compared CH4 and N2 O results from dry and           cubes were randomly chosen so that the total weight of the
wet extractions. For the second question, we applied the wet      subsample was ∼ 40 g.
extraction method to both biocide-treated and control sam-
ples. Finally, for the third question we carried out tests with   2.2     Gas extraction procedures
and without extended needle system hits in a crushing cham-
ber, as well as additional dry extraction from ice samples that   2.2.1    Dry extraction (needle crusher)
had been degassed by our wet extraction method.
                                                                  For dry extraction, we used a needle-crusher system at Seoul
                                                                  National University (SNU, Seoul, South Korea) (Shin, 2014).
2     Materials and methods                                       In brief, 8–13 g of ice sample was crushed in a cold vacuum
                                                                  chamber (extraction chamber). The ice samples were usually
2.1    Ice samples and sample preparation                         hit five times by the needle set. The temperature within the
                                                                  extraction chamber was maintained at −37 ◦ C using a cold
The ice-wedge samples used in this study were collected           ethanol-circulating chiller. The extracted gas was dried by
from Churapcha, Cyuie (central Yakutia), and Zyryanka             passing it through a water vapour trap at −85 ◦ C and cryo-
(northeastern Yakutia) in Siberia, as well as from north-         genically trapping it in a stainless-steel tube (sample tube) at
ern Alaska (Fig. S1 in the Supplement). The Churapcha             approximately −257 ◦ C using a helium closed-cycle refriger-
site (61.97◦ N, 132.61◦ E) was located approximately 180 km       ator (He-CCR). Since the extraction chamber cannot accom-
east of Yakutsk, while the Cyuie site (61.73◦ N, 130.42◦ E)       modate ∼ 40 g of ice at once, the ∼ 40 g of random cube sub-
was located approximately 30 km southeast of Yakutsk. The         samples were extracted using three sequential extractions and
Cyuie samples were collected from two outcrops (CYB and           the gas liberated from each extraction was trapped in a sam-
CYC) (Kim et al., 2019). At each site, 30 cm long ice-            ple tube.
wedge cores were drilled perpendicular to the outcrop sur-           Following extraction, the sample tubes were detached
face (Figs. S2 and S3).                                           from the He-CCR, warmed to room temperature (∼ 20 ◦ C),
   Zyryanka is located in the southern boreal region of the       and attached to a gas chromatograph (GC) equipped with
Kolyma River, at the junction of the Chersky and Yukaghir         an electron capture detector (ECD) and a flame ionisation
ranges, in a region affected by thermokarst development (Fe-      detector (FID) to determine the mixing ratios of CH4 and
dorov et al., 1991). Site A (Zy-A) was located on a tribu-        N2 O. Details of the GC system are given in Ryu et al.

The Cryosphere, 14, 1311–1324, 2020                                                   www.the-cryosphere.net/14/1311/2020/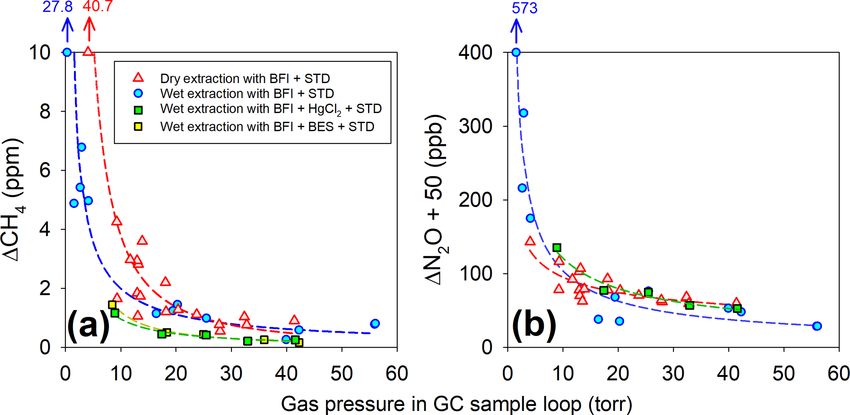
J.-W. Yang et al.: Gas extraction from ice wedges                                                                           1313

(2018). The daily calibration curves were established using       2.3    Gas content
working standards of 15.6 ± 0.2 ppm CH4 , 10 000 ± 30 ppm
CH4 , 2960±89 ppb N2 O, 29 600±888 ppb N2 O, and a mod-           The analytical methods described previously were used to
ern air sample from a surface firn at Styx Glacier, Antarc-       determine the mixing ratios of CH4 and N2 O in the extracted
tica (obtained in November 2016), which was calibrated as         gas. Converting these mixing ratios into moles of CH4 and
1758.6 ± 0.6 ppb CH4 and 324.7 ± 0.3 ppb N2 O by the Na-          N2 O per unit mass of ice-wedge sample (CH4 and N2 O con-
tional Oceanic and Atmospheric Administration (NOAA).             tent, respectively, hereafter) required data on the amount of
                                                                  gas extracted. As the gas content is a measure of gas volume
                                                                  enclosed in a unit mass of ice sample at STP (in mL kg−1  ice ),
2.2.2   Wet extraction (melt–refreeze)                            the CH4 and N2 O contents can be calculated using the gas
                                                                  content, the total mass of the random cube ice, and the gas
For the control and HgCl2 -treated wet extraction experi-         mixing ratio. The gas content in the control and HgCl2 -
ments, a melting–refreezing wet extraction system at SNU          treated wet extraction experiments was calculated from the
was employed (Yang et al., 2017; Ryu et al., 2018). The gas       temperature and pressure of the extracted gas and the internal
extraction procedure was identical to the procedure described     volume of the vacuum line. The details of the extraction sys-
in Yang et al. (2017) and Ryu et al. (2018), except for the       tem and correction methods used for estimating gas content
sample gas trapping procedure (see below). Ice-wedge sub-         are described in Yang (2019). Similarly, the gas content of
samples of ∼ 40 g (composed of 10–12 ice cubes for each)          the dry extraction samples was also inferred from the volume
were placed in a glass container welded to a stainless-steel      and pressure of gas inside the vacuum line once the sample
flange (sample flask), and the laboratory air inside the sample   tube was attached to the line for GC analysis. The uncertain-
flasks was evacuated for 40 min. The sample flasks were then      ties of the calculated CH4 and N2 O contents were calculated
submerged in a warm (∼ 50 ◦ C) tap water bath to melt the ice     by using the error propagation of the blanks and gas content
samples. After melting was complete, the meltwater was re-        uncertainties (see Appendix for uncertainty estimation of the
frozen by chilling the sample flasks with cold ethanol (below     blank corrections and gas contents).
−70 ◦ C). The sample gas in the headspace of each sample
flask was then expanded to the volume-calibrated vacuum           2.4    Dry soil content
line to estimate the volume of extracted gas and trapped in
                                                                  Dry soil content was measured using the leftover meltwater
a stainless-steel sample tube by the He-CCR device. We at-
                                                                  from the control wet extraction tests. After these were com-
tached the He-CCR device to our wet extraction line, and the
                                                                  plete, the sample flasks were shaken thoroughly and the melt-
gas samples in the flasks were cryogenically trapped. There
                                                                  water samples were each poured into a 50 mL conical tube.
were two reasons for using He-CCR instead of direct expan-
                                                                  The meltwater and soils were separated by a centrifugal sep-
sion to a GC: (1) to better compare the dry and wet extraction
                                                                  arator at 3000 rpm for 10 min. The separated wet soils were
methods by applying the same trapping procedure, and (2) to
                                                                  wind-dried in evaporating dishes at ∼ 100 ◦ C for 24 h. The
maximise the amount of sample gas for GC analysis, because
                                                                  weight of each individual evaporating dish was pre-measured
gas expansion from a large flask allows only a small fraction
                                                                  before use. The dry soil content was calculated by subtract-
of gas to be measured by the GC.
                                                                  ing the weight of the evaporating dish from the total weight
   For biocide-treated tests, 1.84 mmol of mercuric chloride
                                                                  of the dried soil sample plus the evaporating dish.
(HgCl2 ) was applied per unit kilogram of soil, following es-
tablished procedures for soil sterilisation (Fletcher and Kauf-
man, 1980). We obtained the average dry soil mass (0.33 g)        3     Results and discussion
from the leftover meltwater samples of the previous wet ex-
tractions, which were carried out for comparison between          3.1    Comparison between wet and dry extraction
dry and wet extractions. Taking this into account, we added              methods
24 µL of saturated HgCl2 solution (at 20 ◦ C) to the sample
flasks. The flasks with HgCl2 solution were then frozen in        The results from the wet and dry extractions were compared
a deep freezer at < −45 ◦ C to prevent the dissolution of am-     using 23 CH4 and 21 N2 O ice-wedge samples from Alaska
bient air into the solution during ice sample loading. After      and Siberia. In both the CH4 and N2 O mixing ratio analy-
the wet extraction procedure was complete, the extracted gas      ses, we found that the wet and dry extraction results did not
was trapped in a sample tube and the CH4 and N2 O mixing          differ significantly (p > 0.1), regardless of sampling site or
ratios were determined using the same GC–ECD–FID sys-             soil content (Fig. 1a–d). We note that the heterogeneous dis-
tem as the dry-extracted gas. The resulting CH4 and N2 O          tribution of gas mixing ratios at the centimetre scale (Kim
mixing ratios were not corrected for partial dissolution in ice   et al., 2019) may not have been completely smoothed out by
melt in the flasks, because CH4 and N2 O trapped in refrozen      our subsample selection, although we randomly chose 8–12
ice were negligible compared to the ranges of the systematic      ice cubes for each measurement. Some previous studies have
blanks (see Appendix).                                            avoided using the wet extraction method because of poten-

www.the-cryosphere.net/14/1311/2020/                                                   The Cryosphere, 14, 1311–1324, 2020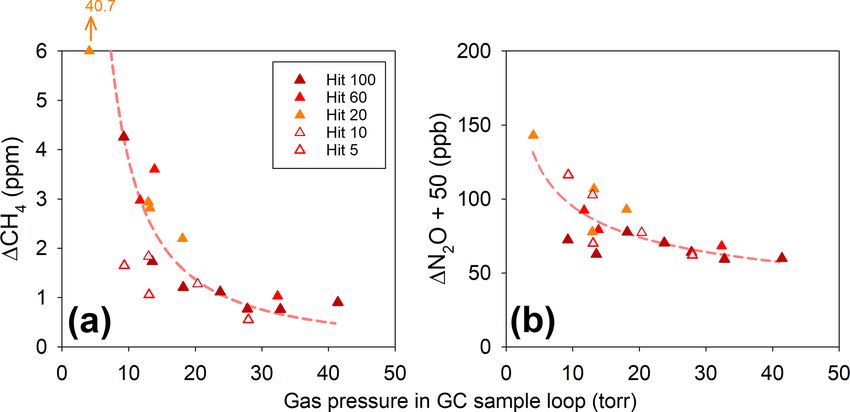
1314 J.-W. Yang et al.: Gas extraction from ice wedges
tial reactivation of microbial CH4 and/or N2 O production in estimate the gas contents if the gas is not completely ex-
ice melt (e.g. Cherbunina et al., 2018; Kim et al., 2019). As- tracted. Another possible bias in the gas mixing ratios arises
suming that activation of microbial metabolism is unlikely if the CH4 and N2 O compositions are different between the
during dry extraction at a temperature of −37 ◦ C in the ex- crushed and uncrushed portions of the ice-wedge samples.
traction chamber for < 1 h, our findings may imply that wet To estimate the biases arising from incomplete gas extrac-
extraction does not stimulate microbial reactivation to a mea- tion, we designed a series of tests to identify the differences
surable extent. of the CH4 and N2 O mixing ratios and contents between the
crushed and uncrushed sample portions. Each randomly col-
3.2 Testing microbial alteration during wet extraction lected ice-wedge sample was first crushed by the regular dry
extraction procedure (by hitting it five times with the needle
To test the microbial production of CH4 and N2 O during wet system, “hit5”), and the gas liberated from the sample was
extraction more accurately, we conducted wet extraction ex- trapped in a sample tube. We then performed an additional
periments on samples treated with HgCl2 , a commonly used 100 hits on the leftover ice (“hit100”), monitored the amount
effective biocide (e.g. Torres et al., 2005), and compared the of additional gas liberated, and trapped the additional gas in
results with those of untreated (control) wet extractions. We a separate sample tube. Comparisons between the hit5 and
prepared 12 additional ice-wedge samples using the random hit100 results are summarised in Fig. 2 and Table A1.
cube method for these tests (see Sect. 2). We found no sig- We regarded the ratio of gas content of hit100 to that of
nificant differences between the control and HgCl2 -treated hit5 (hit100 / hit5 ratio, hereafter) as a measure of the gas
wet extraction results for both CH4 and N2 O mixing ratios extraction efficiency of the needle-crusher system. The re-
(Fig. 1e and f), indicating that the bias due to microbial ac- sults demonstrate an average hit100 / hit5 ratio of gas con-
tivity during ∼ 1 h of the melting–refreezing procedure was tent of 0.40 ± 0.07 for the Zyryanka samples, 0.24 ± 0.07
not significant. This was further supported by tests on an ad- for the Bluff samples, and 0.14 ± 0.11 for the Cyuie sam-
ditional 12 ice-wedge samples (using the random cube pro- ples (Table A1). Despite the fact that the number of sam-
tocol) treated with 2-bromoethanesulfonate (BES), a specific ples was limited, the ice-wedge samples from the different
methanogenesis inhibitor (e.g. Nollet et al., 1997) (Fig. A3). sites showed distinct hit100 / hit5 ratios of the amount of ex-
Similar to the HgCl2 -treated experiments, 25 µL of a satu- tracted gas. However, we observed that the leftover ice from
rated BES solution was added to each sample flask. These the Bluff and Zyryanka samples was not well crushed, even
additional tests were carried out only for CH4 . The two-sided after 100 hits with the needle crusher. This was especially
t test for the CH4 data indicated an insignificant difference true if the ice subsamples contained soil aggregates: in these
between the two results (p > 0.9). Data from individual sam- cases the frozen soil aggregates were barely crushed. In con-
pling sites also did not show significant differences (p > 0.9 trast, the Cyuie samples were relatively well crushed, and
for the Alaskan samples and p > 0.5 for the central Yakutian the leftover samples were apparently finer-sized ice flakes.
samples). We also observed that the hit100 / hit5 ratios of gas content
According to microbial sequencing studies that have were highly variable within samples from a particular site,
shown the presence of viable microbes in permafrost and implying that the extraction efficiency of the needle crusher
ground ice (e.g. Katayama et al., 2007), it is likely that depended not only on-site characteristics but also on the in-
culturable microbes exist in the ice-wedge samples used in dividual ice sample hardness. When compared with the dry
this study. However, considering that at least 14 d and up soil content measured from the subsamples used for wet ex-
to 3 months of culturing was required to identify microbe traction, no relationship was observed between the dry soil
colonies extracted from ground ice (Katayama et al., 2007; content and the extraction efficiency (Figs. 1 and A3). In ad-
Lacelle et al., 2011), our melt–refreeze time of an hour was dition, in the case of samples uncrushed by the hit100 test,
insufficient for microbial activity to resume production of it was difficult to estimate the extraction efficiency using the
CH4 and N2 O. hit100 / hit5 ratio of gas content, as the hit100 tests liberated
only a marginal portion of gas from these samples. This was
3.3 Dry extraction efficiency and gas mixing ratios because the large-sized uncrushed soil aggregates or parti-
cles may have prohibited the needle crusher from crushing
One limitation of our needle crushing dry extraction tech- the small-sized ice flakes or grains. The needles move up and
nique was the inability to completely extract gas from ice down together as they are fixed to a pneumatic linear motion
samples, because small ice particles and/or flakes placed in feedthrough device, so if there is a sizeable soil clod that can-
the space between the needles were not fully crushed. The not be crushed, it blocks the needle crusher from moving fur-
gas extraction efficiency of the SNU needle-crusher system ther down. Therefore, we do not recommend using a needle-
has been reported as ∼ 80–90 % for polar ice core samples crusher system to measure gas contents in ice-wedge sam-
(Shin, 2014). However, the gas extraction efficiency has not ples.
been tested for ice-wedge samples. Depending on the ex- The hardness of the ice samples may also affect the gas
traction efficiency, the needle crushing method could under- mixing ratio analysis in the hit5 and hit100 procedures. The
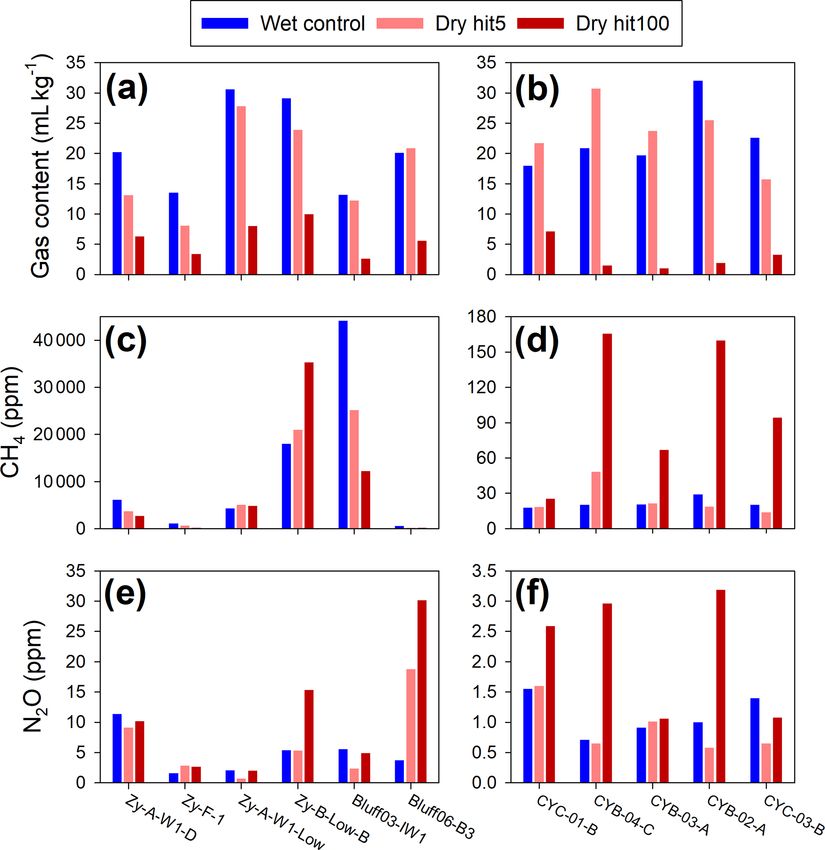
The Cryosphere, 14, 1311–1324, 2020 www.the-cryosphere.net/14/1311/2020/J.-W. Yang et al.: Gas extraction from ice wedges 1315 Figure 1. Comparison of CH4 and N2 O mixing ratios and contents obtained by different extraction methods. Shown are scatter plots between wet and dry (hit5) extraction results of CH4 (a and b) and N2 O (c and d), and between control and biocide-treated wet extraction results for CH4 (e) and N2 O (f). The “hit5” denotes the dry extraction with five hits (see Sect. 3.3). Left panels (a, c, and e) and panel (f) present the mixing ratios of gas in bubbles, while panels (b) and (d) in the right column present moles of gas in a unit mass of ice (gas content). The sampling locations are indicated by different symbols. The colour of each data point indicates the dry soil weight in the subsamples used in control wet extraction. The 1σ uncertainties of the mixing ratios (a, c, e, and f) are magnified by 5×, 20×, 100×, and 500× as denoted as blue error bars (see Appendix). The error bars are not visible where the error bars are smaller than markers. The grey dashed lines are 1 : 1 reference lines. Note that the units of the axes of the insets in (e) and (f) are identical to the original plots. The p value of the two-sided Students t test of each comparison is denoted at the bottom right corner of each plot. hit100 / hit5 ratios of the CH4 mixing ratio of the Bluff and Considering these results with those discussed previously, Zyryanka samples were less than one in four out of six sam- we speculate that there are three ways gas can be trapped ples, yielding an average of 0.9 ± 0.5. However, all five sam- in ice-wedge ice: enclosed in bubbles, adsorbed on soil par- ples from the Cyuie ice wedges had ratios greater than 1, with ticles, and entrapped in soil aggregates. The better-crushed an average of 4.7 ± 2.6 (Table A1). The higher hit100 / hit5 leftover ice flakes in the Cyuie samples may have allowed ratio of CH4 mixing ratios of Cyuie samples indicated that most of the gas in bubbles and part of the CH4 molecules ad- the gases extracted via the hit100 procedure had higher CH4 sorbed on soil particles and/or trapped in microsites within mixing ratios than the gases extracted via the hit5 procedure. soil aggregates to be liberated. Thus, the hit5 CH4 mixing www.the-cryosphere.net/14/1311/2020/ The Cryosphere, 14, 1311–1324, 2020
1316                                                                        J.-W. Yang et al.: Gas extraction from ice wedges

ratios of the Cyuie samples may have better reflected the
gas mixing ratios in bubbles, while the hit100 results re-
flected more of the contribution from gas adsorbed on soil
and trapped within soil aggregates because the ice sample
containing larger-sized aggregates had greater hardness than
those with smaller aggregates or fine particles. If this was the
case for the Cyuie samples, we can infer that CH4 is more
concentrated in soil particles and in microsites within soil
aggregates than in bubbles in the ice. This is partly supported
by evidence that ice-wedge layers exhibit relatively trace
amounts of CH4 compared to the surrounding permafrost soil
layers (Rivkina et al., 2007); however, this needs to be fur-
ther evaluated by detailed microbial and chemical analyses.
Meanwhile, in the Bluff and Zyryanka samples, the hit5 re-
sults reflected the mixing ratios of the gases from the crushed
portions, regardless of their origin: bubbles, particle adsorp-
tion, or microsites in aggregates (Fig. 2 and Table A1). Given
that some of the Bluff and Zyryanka ice-wedge samples were
not fully crushed by the hit100 tests, additional hits or an-
other extraction technique may have been required. Unlike
CH4 , the N2 O mixing ratios from the hit100 extractions were
higher than the hit5 in 10 of 11 samples, regardless of the
sampling site. The hit100 / hit5 ratios of N2 O mixing ratios      Figure 2. Results of dry extraction tests with 5 and an additional
of the Bluff and Zyryanka samples (1.9 ± 0.8 on average)           100 hits to ice-wedge samples, denoted as “hit5” and “hit100”, re-
                                                                   spectively (c–f). Also plotted are gas content results from both ex-
were not significantly different (p = 0.32) from those of the
                                                                   periments, where the hit100 values are given in units of millilitre per
Cyuie samples (2.9 ± 1.8 on average). This can probably be         kilogram (mL kg−1 ) at STP conditions (a and b). It should be noted
explained by the fact that the N2 O mixing ratio is not neces-     that the hit100 gas content results indicate the additional amount of
sarily higher in soil-rich ice because N2 O is an intermediate     gas extracted after hit5 crushing and evacuation.
product of denitrification, while CH4 is produced as the final
product of methanogenesis.
   Although a different crushing technique might be more           pendix). Therefore, we concluded that our findings were not
suitable for ice-wedge samples, none of the existing dry           artefacts of metal friction during crushing.
extraction techniques – centrifugal ice microtome (Bereiter           To summarise, from the hit5 and hit100 comparison tests,
et al., 2013), mechanical grater (Etheridge et al., 1988), or      we found that (1) the needle-crusher method was not able
ball-mill crusher (Schaefer et al., 2011) – is more advanta-       to fully crush the ice-wedge ice samples and thus was un-
geous for ice-wedge analysis than the needle-crusher system        suitable for measuring gas content in a unit mass of ice, and
used in this study. The hard portion of ice wedges (e.g. frozen    (2) weak crushing (e.g. a small number of hits by the needle-
soil aggregates and large soil particles) could easily damage      crusher system) may better reflect gas mixing ratios in the
the metal blades of the centrifugal ice microtome and me-          soft parts of the samples (such as air bubbles) than strong
chanical grater devices, or block the space within the ball-       crushing (e.g. a greater number of hits).
mill chamber, limiting the movement of the milling balls.
   It is worth noting that friction between stainless-steel sur-   3.4   Residual gas mixing ratios and content after wet
faces could produce CH4 with carbon from the damaged sur-                extraction
face and hydrogen gas (Higaki et al., 2006). If needle crush-
ing causes contamination in this way, the dry extraction re-       To examine how well the gas was extracted by wet extraction,
sults should be affected by the number of hits. To check the       we applied the dry extraction method to refrozen ice-wedge
impact of the needle crushing procedure on ice-wedge CH4           samples after wet extraction. We first prepared degassed ice-
and N2 O measurements, we carried out blank tests by chang-        wedge samples that had undergone repetitive wet extractions
ing the number of hits from 5 to 100. The results of these tests   (wet-degassed ice, hereafter). Once the wet extraction exper-
showed no systematic offset among the experiments with dif-        iments were completed, we repeated two cycles of melting–
ferent numbers of hits (Fig. A2), implying that the crushing       refreezing and evacuation procedures to degas the ice melt.
procedure did not affect the dry extraction results for CH4        After degassing by a total of three cycles of wet extraction
and N2 O. Even though minor contamination did occur, its           and evacuation, the outermost surfaces (∼ 2 mm) of the wet-
effects had already been subtracted via blank correction and       degassed ice were trimmed away in the walk-in freezer at
taken into account in the overall error estimation (see Ap-        SNU on the morning of experiments. The wet-degassed ice

The Cryosphere, 14, 1311–1324, 2020                                                      www.the-cryosphere.net/14/1311/2020/
J.-W. Yang et al.: Gas extraction from ice wedges 1317 Figure 3. Comparison of wet-extracted gas and residual gas for CH4 and N2 O mixing ratios (a and b) and contents (c and d). The residual gas was extracted from the dry extraction method using the wet-degassed ice samples. The light green bars show the results of initial wet extraction, and the blue and red bars indicate the dry extraction of wet-degassed ice with 20 and 60 hits, respectively. The Cyuie samples are denoted as “CYC”, while “C” indicates the Churapcha samples. was then inserted into the needle crusher, the crusher cham- and the soil particles settled at the bottom of the sample flask ber was evacuated, a specific amount of standard air was in- without any physical impact to the soil particles, causing the jected, and the wet-degassed ice samples were hit 20 or 60 adsorbed CH4 molecules on the soil particles to remain ad- times by the needle crusher. The amount of gas and the gas sorbed, and (2) during refreezing the soils accumulated at mixing ratio of the additionally extracted gas from the wet- the bottom of the flasks crumpled around the centre of the degassed ice are given in Fig. 3 and Table A2. refrozen ice because the sample flasks were chilled from out- These tests using the wet-degassed ice showed an addi- side, which facilitated gas entrapment within the frozen soil tional gas extraction of ∼ 12–20 mL kg−1 ice , which was ∼ 43– aggregate. In contrast, the N2 O mixing ratios of the resid- 88 % of the amount of gas extracted during the initial wet ual gas exhibited very low values compared to those from extraction. The additionally extracted gas from the dry ex- the initial wet extraction (Fig. 3 and Table A2). These results traction is referred to as residual gas hereafter. This was in re- implied that most of the N2 O in ice wedges was extracted markable contrast to the < 1 % residual fraction of the SNU by three melting–refreezing cycles, such that only a small wet extraction system for ice from polar ice sheets. If such amount of N2 O was left adsorbed or entrapped in ice-wedge a considerable amount of gas was left intact by repeated wet soils. We therefore suggest that this might be attributed to the extractions, the composition of the additional gas must be high solubility of N2 O to water compared to CH4 (Fogg and important for understanding the extent of the bias for con- Sangster, 2003). However, further investigation is needed to ventional wet extraction results. better understand this. Figure 3 and Table A2 show the mixing ratios and con- In summary, we found that a certain amount of gas re- tents of CH4 and N2 O in the residual gas. The mixing ratios mained in ice wedges, even after three cycles of wet ex- of the residual gas were estimated using mass balance calcu- traction, and that it was extractable instead by needle crush- lations with observed mixing ratios and the amounts of the ing. This implies that, unlike polar ice cores, wet extraction injected standard and extracted residual gas. The CH4 mix- of ice wedges does not guarantee near-complete gas extrac- ing ratios of the residual gas ranged from 10.37 to 23.78 ppm, tion, and therefore precise measurements of the gas content similar to the range of the wet-extracted gas, indicating that of ice wedges are difficult to obtain. This difficulty in mea- CH4 in ice wedges cannot be fully extracted by a melting– suring gas content imposes a large uncertainty when esti- refreezing procedure. We suspect two possible reasons for mating CH4 and N2 O contents. Furthermore, we found that this: (1) during wet extraction, the ice-wedge samples melted the residual gas had a similar-order CH4 mixing ratio to the www.the-cryosphere.net/14/1311/2020/ The Cryosphere, 14, 1311–1324, 2020
1318                                                                      J.-W. Yang et al.: Gas extraction from ice wedges

gas extracted by initial melting–refreezing, indicating that           by hit5 extraction, e.g. Cyuie ice wedges in this study).
a comparable amount of CH4 still remained unextracted in               Although the N2 O content in ice wedges may be mea-
ice wedges. Hence, a novel extraction method is required               sured by using repeated wet extractions, this is not the
to produce reliable gas content and gas mixing ratios in ice           case for determining the N2 O mixing ratio.
wedges. In contrast, our results show that the N2 O content of
the residual gas was at trace levels, suggesting that most of       4. Previous estimates of ground ice CH4 and N2 O budget
the N2 O in ice wedges is extractable during initial melting–          may be underestimated, implying that the greenhouse
refreezing. Therefore, wet extraction could be applicable for          gas production in subfreezing permafrost environments
estimating the N2 O content of ice wedges. However, given              is larger than the current understanding.
that the above evidence resulted from three consecutive cy-         5. Saturated NaCl solution is unnecessary for prevent-
cles of melting–refreezing and evacuation, it is unclear how           ing microbial activity during melting, as employed by,
many melting–refreezing cycles are required to extract most            for example, Cherbunina et al. (2018). However, it re-
N2 O from ice wedges. It should be noted that combination of           mains an open question how effectively the adsorbed
repetitive wet extractions with dry extraction does not guar-          gas molecules can be extracted by this method.
antee reliable estimation of the N2 O mixing ratio, because
extraction efficiency of the other gas components may be
different from that of N2 O. Our findings imply that previ-
ous estimates of CH4 budgets in ground ice based on the
wet extraction principle (e.g. Boereboom et al., 2013; Cher-
bunina et al., 2018) might have been underestimated, and
that CH4 production within subfreezing permafrost environ-
ments could be larger than previously estimated. Future study
should be devoted to a novel extraction method able to easily
and effectively extract gas molecules from ice.

4    Conclusions

In this study we carried out comparisons between (1) wet
and dry extraction, (2) untreated and biocide-treated wet ex-
traction, and (3) gas extraction from the easy-to-extract and
difficult-to-extract parts of ice-wedge ice in order to better
understand the characteristics of each extraction method and
adequately analyse CH4 and N2 O mixing ratios and gas con-
tents from permafrost ice wedges. Based on these compar-
isons, our major findings can be summarised as follows:

    1. Existing wet and dry extraction methods allow gas ex-
       traction from the soft parts of ice (e.g. ice bubbles) and
       show insignificant differences in CH4 and N2 O mixing
       ratios.

    2. Wet extraction results are unlikely to be affected by mi-
       crobial production of CH4 and N2 O during the melting–
       refreeze procedure.

    3. Both dry and wet extraction methods are not able to
       fully extract gas from ice-wedge samples, presumably
       due to gas adsorbed on soil particles or enclosed within
       soil aggregates, which may have different gas mixing
       ratios compared to the gas in bubbles. Further research
       is required to develop a proper method to quantify and
       extract adsorbed and enclosed gases. In the meantime,
       we propose that both existing techniques may be suit-
       able for gas mixing ratio measurements for bubbles in
       relatively soft ice wedges (i.e. easily crushed ice wedges

The Cryosphere, 14, 1311–1324, 2020                                                  www.the-cryosphere.net/14/1311/2020/
J.-W. Yang et al.: Gas extraction from ice wedges 1319
Appendix A: Systematic blank correction and ties of blank corrections (Fig. 1). Since the ice-wedge data
uncertainty estimation used in this study showed pressure in the GC sample loop of
about 8–50 Torr, the RMSDs were estimated from the blank
Since the SNU dry extraction systems, including the sample test data within this pressure range. The uncertainty of the
tubes, were originally designed for CO2 measurements from gas content measurement was calculated by error propaga-
polar ice cores, these systems have not been tested for CH4 tion from those of pressure, line volume, and mass of ice
and N2 O analysis. We therefore carried out a series of tests samples.
to estimate the systematic blank, which is defined here as
blanks.
The systematic blanks were tested with bubble-free ice
(BFI) and standard air in a cylinder calibrated by NOAA.
The BFI was prepared as described in Yang et al. (2017),
other than cutting the BFI block into small pieces of 3–4 g to
mimic the random cube sampling protocol (see Sect. 2). The
systematic blanks for the dry extraction method were tested
as follows. A total of ∼ 45 g of BFI cubes were placed into
the crushing chamber, which was sealed with a copper gasket
and evacuated until the interior gas pressure dropped lower
than ∼ 60 mTorr because of the vapour pressure formed by
sublimation of the BFI. After evacuation was completed,
standard gas was injected into the crushing chamber. The
amount of standard injected was controlled by a volume-
calibrated vacuum line in the dry extraction system. Then the
BFI samples were hit with the needle system 5–100 times
and the gases in the chamber were passed through a water
trap and cryogenically pumped into the sample tubes, using
the He-CCR. The number of hits did not significantly affect
the systematic blank (Fig. A2), and the regression curve for
blank correction was fitted to the entire set of data points (red
dashed curve in Fig. A1).
For the wet extraction, a total of ∼ 45 g of BFI cubes were
placed into each sample flask. The flasks were connected
to the wet extraction line, sealed with a copper gasket, and
then evacuated. Once a vacuum was established, a known
amount of standard gas was injected into each flask and the
flasks were submerged into a warm water bath for ∼ 40 min
to melt completely. The flasks were then submerged into
a cold ethanol bath (chilled to −80 ◦ C) to refreeze. For the
HgCl2 - and sodium-2-BES-treated experiments, we first pre-
pared saturated solutions of HgCl2 and BES at room temper-
ature (20 ◦ C) and added 24 µL of HgCl2 or 20 µL of BES so-
lution into the empty flasks in a fume hood. Then we placed
the flasks in a deep freezer (at −45 ◦ C for 20 min) to freeze
the solutions before the BFI pieces were placed.
The results of the blank experiments are shown in Fig. A1.
The systematic blanks appeared to be inversely correlated
with the gas pressure in the sample tube. The systematic
blank test results were fitted using exponential regression
curves (dashed lines in Fig. A1), and these regression curves
were then used for systematic blank correction in our ice-
wedge sample analyses.
To calculate uncertainties of the blank corrections, the
blank test data were fitted with exponential regression curves
(Fig. A1). The root-mean-square deviations (RMSDs) of the
data from the regression curves were taken as the uncertain-
www.the-cryosphere.net/14/1311/2020/ The Cryosphere, 14, 1311–1324, 20201320 J.-W. Yang et al.: Gas extraction from ice wedges Figure A1. Systematic blank of the needle crushing (dry extraction) and melting–refreezing (wet extraction) methods for (a) CH4 and (b) N2 O measurements in control and biocide (HgCl2 )-treated experiments. Also plotted are the CH4 blanks of BES-treated wet extractions. The dashed lines represent exponential regression curve fittings. Note that all data are plotted against the amount of gas trapped in the sample tube, presented here as the pressure in the GC sample loop when the sample gas is expanded. The grey shaded areas indicate the range of ice-wedge samples used in this study (see main text). The capital-delta (1) notation on the y axes indicates the offset from the values of the standard used. Figure A2. Influence of different amounts of hitting on the systematic blank of the needle crushing (dry extraction) system for (a) CH4 and (b) N2 O measurements. Note that all data are plotted against the amount of gas trapped in the sample tube, presented here as the pressure in the GC sample loop when the sample gas is expanded (see main text). The capital-delta (1) notation on the y axes indicates the offset from the values of the standard used. The Cryosphere, 14, 1311–1324, 2020 www.the-cryosphere.net/14/1311/2020/
J.-W. Yang et al.: Gas extraction from ice wedges                                                                                                                                                   1321

Table A1. Results of dry extraction tests with 5 and an additional 100 hits to the ice-wedge samples, denoted as “hit5” and “hit100”,
respectively. “hit100/hit5” is the ratio in extracted gas content or gas mixing ratio of the hit100 to hit5 cases. Also shown are gas content
results from both experiments, where the hit100 values are given in units of millilitre per kilogram (mL kg−1 ) at STP conditions. It should
be noted that the hit100 gas content results indicate the additional amount of gas extracted after hit5 crushing and evacuation.

  Site location   Sample           Soil                    gas content                                      CH4 mixing ratio                                       N2 O mixing ratio
                                content   Wet control   Dry hit5    Dry hit100    hit100/   Wet control     Dry hit5   Dry hit100    hit100/     Wet control       Dry hit5      Dry hit100      hit100/
                                 wt. %      mL kg−1     mL kg−1      mL kg−1         hit5           ppm        ppm             ppm      hit5              ppm           ppm              ppm        hit5
  Zyryanka,       Zy-A-W1-D      0.155          20.2       13.1           6.3       0.48           6138        3713         2721      0.7329             11.37          9.10         10.15         1.12
  Northeastern    Zy-F-1         0.618          13.5        8.1           3.4       0.42           1080       655.6        173.5      0.2646              1.57          2.81          2.65        0.942
  Siberia         Zy-A-W1-Low    0.049          30.6       27.8           8.0       0.29           4309        5073         4818      0.9497              2.07          0.69          2.02           2.9
                  Zy-B-Low-B     0.107          29.1       23.9          10.0      0.418          18 030     21 010       35 290       1.680              5.37          5.32         15.36         2.89
  Northern        Bluff03-IW1     2.07          13.2       12.2            2.6      0.21          44 160     25 230       12 240      0.4851              5.58          2.36          4.93         2.09
  Alaska          Bluff06-B3     0.078          20.1       20.9            5.6      0.27           558.7      164.2        219.5       1.337              3.74         18.78         30.14        1.605
  Cyuie,          CYC-01-B       0.252          18.0       21.7            7.1      0.33            18.0       18.3         25.4        1.39              1.55          1.60             2.59      1.62
  central         CYB-04-C       0.498          20.9       30.7            1.5     0.049            20.2       48.4        165.6        3.42              0.71          0.65             2.96       4.5
  Yakutia         CYB-03-A       0.420          19.7       23.7            1.0     0.041            20.5       21.5         67.1        3.12              0.91          1.01             1.06      1.05
                  CYB-02-A       0.403          32.0       25.5            1.9     0.073            29.1       18.7        159.8        8.55              1.00          0.58             3.19       5.5
                  CYC-03-B       0.830          22.6       15.7            3.3      0.21            20.3       13.9         94.5        6.80              1.40          0.65             1.08       1.7

Table A2. Comparison of results from extracted gas from the conventional wet extraction method and the residual gas in ice after three wet
extractions. The residual gas was extracted by a needle crusher (see Sect. 3.4 for details of the methods).

  Site                          Sample           Soil                            Wet extraction                                                            Residual gas
  location                                    content        Gas        CH4        N2 O             CH4           N2 O              Gas          CH4        N2 O                 CH4              N2 O
                                                          content     mixing      mixing          content       content          content       mixing      mixing              content          content
                                                                        ratio       ratio                                          ratio         ratio
                                                wt. %    mL kg−1         ppm        ppm     nmol kg−1        nmol kg−1          mL kg−1          ppm             ppm     nmol kg−1         nmol kg−1
  Churapcha, central Yakutia    C-10            0.524        37.9         4.9      61.13             8.3            103              16.6        23.8       0.437                17.6            0.324
  Churapcha, central Yakutia    C-30             1.03        41.7         4.1      22.28             7.7           41.5              18.4         23         0.50                 19              0.41
  Cyuie, central Yakutia        CYC-03-C         1.09        27.2        30.5       0.52            37.1           0.63              17.9        12.5        0.48                10.0             0.39
  Churapcha, central Yakutia    C-04             1.38        46.0         6.9      43.46              14           89.2              14.7         17         0.17                 11              0.11
  Cyuie, central Yakutia        CYC-02-B         1.12        32.5        30.3       8.34            44.0           12.1              11.0          23        0.11                  11            0.053
  Churapcha, central Yakutia    C-12            0.370        38.0         2.8      60.47             4.8            103              15.9         10         0.34                 7.3             0.24

www.the-cryosphere.net/14/1311/2020/                                                                                                 The Cryosphere, 14, 1311–1324, 2020
1322 J.-W. Yang et al.: Gas extraction from ice wedges Figure A3. Comparison between control and BES-treated wet ex- traction results for CH4 . The sampling area is indicated by different symbols. The colour of each data point indicates the dry soil weight in the subsamples used in control wet extraction. The grey dashed lines are 1 : 1 reference lines. The blue error bar indicates the 1σ uncertainty of mixing ratios magnified by 10×. The Cryosphere, 14, 1311–1324, 2020 www.the-cryosphere.net/14/1311/2020/
J.-W. Yang et al.: Gas extraction from ice wedges                                                                                      1323

Data availability. All data used in this study are available at the   Etheridge, D. M., Pearman, G. I., and de Silva, F.: Atmo-
Zenodo repository: https://doi.org/10.5281/zenodo.3701243 (Yang          spheric trace-gas variations as revealed by air trapped in an ice
et al., 2020).                                                           core from Law Dome, Antarctica, Ann. Glaciol., 10, 28–33,
                                                                         https://doi.org/10.3189/S0260305500004110, 1988.
                                                                      Fedorov, A. N., Botulu, T. A., Vasiliev, I. S., Varlamov, S. P., Grib-
Supplement. The supplement related to this article is available on-      anova, S. P., and Dorofeev, I. V.: Permafrost-landscape map of
line at: https://doi.org/10.5194/tc-14-1311-2020-supplement.             the Yakut ASSR, Gosgeodezia, Moscow, Russia, Map, 1991 [in
                                                                         Russian].
                                                                      Fletcher, C. L. and Kaufman, D. D.: Effect of sterilization methods
Author contributions. JWY and JA conceived the research and de-          on 3-chloroaniline behavior in soil, J. Agric. Food Chem., 28,
signed the experiments. GI, JA, KK, and AF drilled the ice-wedge         667–671, https://doi.org/10.1021/jf60229a016, 1980.
ice samples from Alaska and Siberia. JWY, JA, SH, and KK con-         Fogg, P. G. T., and Sangster, J.: Chemicals in the Atmosphere: Solu-
ducted the laboratory experiments. JWY and JA led the manuscript         bility, Sources and Reactivity, John Wiley and Sons, Inc., Chich-
preparation with inputs from all other co-authors.                       ester, 2003.
                                                                      Higaki, S., Oya, Y., and Makide, Y.: Emission of methane
                                                                         from stainless steel surface investigated by using tri-
                                                                         tium as a radioactive tracer, Chem. Lett., 35, 292–293,
Competing interests. The authors declare that they have no conflict
                                                                         https://doi.org/10.1246/cl.2006.292, 2006.
of interest.
                                                                      Hugelius, G., Strauss, J., Zubrzycki, S., Harden, J. W., Schuur, E.
                                                                         A. G., Ping, C.-L., Schirrmeister, L., Grosse, G., Michaelson, G.
                                                                         J., Koven, C. D., O’Donnell, J. A., Elberling, B., Mishra, U.,
Acknowledgements. The authors greatly acknowledge those who              Camill, P., Yu, Z., Palmtag, J., and Kuhry, P.: Estimated stocks
contributed to collect ice-wedge ice samples. We thank Gwangjin          of circumpolar permafrost carbon with quantified uncertainty
Lim and Jaeyoung Park for their help in sample preparations and          ranges and identified data gaps, Biogeosciences, 11, 6573–6593,
gas extraction experiments, and Min Sub Sim for kind advice on           https://doi.org/10.5194/bg-11-6573-2014, 2014.
inhibition experiments for methanogen.                                Jorgenson, M. T., Kanevskiy, M., Shur, Y., Moskalenko, N., Brown,
                                                                         D. R. N., Wickland, K., Striegl, R., and Koch, J.: Role of ground
                                                                         ice dynamics and ecological feedbacks in recent ice wedge
Financial support. This project was supported by the Basic Sci-          degradation and stabilization, J. Geophys. Res., 120, 2280–2297,
ence Research Program through the National Research Foundation           https://doi.org/10.1002/2015JF003602, 2015.
of Korea (NRF) (grant nos. NRF-2018R1A2B3003256 and NRF-              Kanevskiy, M., Shur, Y., Jorgenson, M. T., Ping, C. -L., Michael-
2018R1A5A1024958) and the NASA ABoVE (Arctic Boreal and                  son, G. J., Fortier, D., Stephani, E., Dillon, M., and Tum-
Vulnerability Experiment (grant no. NNX17AC57A)).                        skoy, V.: Ground ice in the upper permafrost of the Beau-
                                                                         fort Sea coast of Alaska, Cold Reg. Sci. Technol., 85, 56–70,
                                                                         https://doi.org/10.1016/j.coldregions.2012.08.002, 2013.
Review statement. This paper was edited by Ylva Sjöberg and re-       Katayama, T., Tanaka, M., Moriizumi, J., Nakamura, T., Brouchkov,
viewed by two anonymous referees.                                        A., Douglas, T. A., Fukuda, M., Tomita, F., and Asano, K.:
                                                                         Phylogenetic analysis of bacteria preserved in a permafrost ice
                                                                         wedge for 25 000 years, Appl. Env. Microbiol., 73, 2360–2363,
                                                                         https://doi.org/10.1128/AEM.01715-06, 2007.
                                                                      Kim, K., Yang, J. -W., Yoon, H., Byun, E., Fedorov, A., Ryu,
References                                                               Y., and Ahn, J.: Greenhouse gas formation in ice wedges at
                                                                         Cyuie, central Yakutia, Permafrost Periglac. Process., 30, 48–57,
Arkhangelov, A. A. and Novgorodova, E. V.: Genesis of massive ice        https://doi.org/10.1002/ppp.1994, 2019.
  at “Ice Mountains”, Yenesei River, Western Siberia, according to    Lacelle, D., Radtke, K., Clark, I. D., Fisher, D., Lauriol, B., Utting,
  results of gas analyses, Permafrost Periglac. Proc., 2, 167–170,       N., and Whyte, L. G.: Geomicrobiology and occluded O2 -CO2 -
  https://doi.org/10.1002/ppp.3430020210, 1991.                          Ar gas analyses provide evidence of microbial respiration in an-
Bereiter, B., Stocker, T. F., and Fischer, H.: A centrifugal ice         cient terrestrial ground ice, Earth Planet. Sci. Lett., 306, 46–54,
  microtome for measurements of atmospheric CO2 on air                   https://doi.org/10.1016/j.epsl.2011.03.023, 2011.
  trapped in polar ice cores, Atmos. Meas. Tech., 6, 251–262,         Masson-Delmotte, V., Schulz, M., Abe-Ouchi, A., Beer, J.,
  https://doi.org/10.5194/amt-6-251-2013, 2013.                          Ganopolski, A., Rouco, J. F. G., Jansen, E., Lambeck, K., Luter-
Boereboom, T., Samyn, D., Meyer, H., and Tison, J.-L.: Sta-              bacher, J., Naish, T., Osborn, T., Otto-Bliesner, B., Quinn, T.,
  ble isotope and gas properties of two climatically contrasting         Ramesh, R., Rojas, M., Shao, X., and Timmerman, A.: Infor-
  (Pleistocene and Holocene) ice wedges from Cape Mamontov               mation from paleoclimatic archives, Climate change 2013: The
  Klyk, Laptev Sea, northern Siberia, The Cryosphere, 7, 31–46,          Physical science basis, Contribution of working group I to the
  https://doi.org/10.5194/tc-7-31-2013, 2013.                            fifth assessment report of the Intergovernmental Panel on Cli-
Cherbunina, M. Y., Shmelev, D. G., Brouchkov, A. V., Kazancev, V.        mate Change, Cambridge: Cambridge University Press, 383–
  S., and Argunov, R. N.: Patterns of spatial methane distribution       464, https://doi.org/10.1017/CBO9781107415324.013, 2013.
  in the upper layers of the permafrost in central Yakutia, Mosc.
  Univ. Geol. Bull., 73, 100–108, 2018.

www.the-cryosphere.net/14/1311/2020/                                                          The Cryosphere, 14, 1311–1324, 2020
1324 J.-W. Yang et al.: Gas extraction from ice wedges Nollet, L., Demeyer, D., and Verstraete, W.: Effect of 2- Shin, J.: Atmospheric CO2 variations on millennial time scales dur- bromoethanesulfonic acid and Peptostreptococcus products ing the early Holocene, Master thesis, School of Earth and En- ATCC 35244 addition on stimulation of reductive acetogenesis vironmental Sciences, Seoul National University, South Korea, in the ruminal ecosystem by selective inhibition of methanogen- 58 pp., 2014. esis, Appl. Environ. Microbiol., 63, 194–200, 1997. Torres, M. E., Mix, A. C., and Rugh, W. D.: Precise δ 13 C analy- Rivkina, E., Shcherbakova, V., Laurinavichius, K., Petrovskaya, sis of dissolved inorganic carbon in natural waters using auto- L., Krivushin, K., Kraev, G., Pecheritsina, S., and Gilichin- mated headspace sampling and continuous-flow mass spectrom- sky, D.: Biogeochemistry of methane and methanogenic ar- etry, Limnol. Oceanogr.-Methods, 3, 349–360, 2005. chaea in permafrost, FEMS Microbiol. Ecol., 61, 1–15, Yang, J.-W.: Paleoclimate reconstructions from greenhouse gas and https://doi.org/10.1111/j.1574-6941.2007.00315.x, 2007. borehole temperature of polar ice cores, and study on the origin Ryu, Y., Ahn, J., and Yang, J. -W.: High-precision measurement of of greenhouse gas in permafrost ice wedges, Ph.D. thesis, School N2 O concentration in ice cores, Environ. Sci. Technol., 52, 731– of Earth and Environmental Sciences, Seoul National University, 738, https://doi.org/10.1021/acs.est.7b05250, 2018. Seoul, 188 pp., 2019. Salmon, V. G., Schadel, C., Bracho, R., Pegoraro, E., Celis, Yang, J.-W., Ahn, J., Brook, E. J., and Ryu, Y.: Atmospheric G., Mauritz, M., Mack, M. C., and Schuur, E. A. G.: methane control mechanisms during the early Holocene, Clim. Adding depth to our understanding of nitrogen dynam- Past, 13, 1227–1242, https://doi.org/10.5194/cp-13-1227-2017, ics in permafrost soils, J. Geophys. Res., 123, 2497–2512, 2017. https://doi.org/10.1029/2018JG004518, 2018. Yang, J. -W., Ahn, J., Iwahana, G., Han, S., Kim, K., and Fedorov, Schaefer, H., Lourantou, A., Chappellaz, J., Luthi, D., Bere- A.: Comparison of different gas extraction techniques to ana- iter, B., and Barnola, J.-M.: On the stability of partially lyze CH4 and N2 O compositions in gas trapped in permafrost ice clathrated ice for analysis of concentration and δ 13 C of palaeo- wedges, Zenodo, https://doi.org/10.5281/zenodo.3701243, 2020. atmospheric CO2 , Earth Planet. Sci. Lett., 307, 334–340, https://doi.org/10.1016/j.epsl.2011.05.007, 2011. The Cryosphere, 14, 1311–1324, 2020 www.the-cryosphere.net/14/1311/2020/
You can also read