Place your bets? The market consequences of investment advice on Reddit's Wallstreetbets
←
→
Page content transcription
If your browser does not render page correctly, please read the page content below
Place your bets? The market consequences of investment advice on Reddit’s Wallstreetbets

 Daniel Bradleya, Jan Hanousekb, c, Russell Jamed, and Zicheng Xiaoe
 a
 Department of Finance, University of South Florida, Tampa, FL 33620, danbradley@usf.edu
 b
 Department of Finance, University of South Florida, Tampa, FL 33620, janhanousek@usf.edu
 c
 Faculty of Business and Economics, Department of Finance, Mendel University in Brno, Czech Republic
 d
 Gatton College of Business, University of Kentucky, Lexington, KY 40515, 859.218.1793, russell.jame@uky.edu
 e
 Department of Finance, University of South Florida, Tampa, FL 33620, zicheng@usf.edu

 March 2021
______________________________________________________________________________
 Abstract
We examine the market consequences of due diligence (DD) reports on Reddit’s Wallstreetbets (WSB)
platform. We find average ‘buy’ recommendations result in two-day announcement returns of 1.1%.
Further, the returns drift upwards by 2% over the subsequent month and nearly 5% over the
subsequent quarter. Retail trading increases sharply in the intraday window following publication, and
retail investors are more likely to be net buyers following reports that earn larger returns. Thus, in
sharp contrast to regulators concerns that WSB investment advice is harming retail traders, our
findings suggest that both WSB posters and users are skilled.

Keywords: Reddit, Wallstreetbets, retail trading, social media

JEL classifications: G20, G23

______________________________________________________________________________
Place your bets? The market consequences of investment advice on Reddit’s Wallstreetbets

1. Introduction
 On February 18, 2021 the CEOs of Reddit and Robinhood along with a Reddit user testified
before Congress for their role in the well-publicized Gamestop short squeeze that sent shares to
almost $500 before plummeting to around $50 a few days later. 1 With the explosion of social media
platforms devoted to investment advice in recent years, it is not surprising that regulators expressed
concerns about market manipulation and retail investors becoming victim to fraud to information
posted on social media. 2 While academic research on the impact of social media on retail trading
behavior is limited, contrary to regulator concerns, some recent evidence suggests that retail investors
benefit from social media (Farrell, Green, Jame and Markov, 2020). On the other hand, several recent
studies suggest that social media advice induces cognitive biases that harm investors and can impede
price discovery (Cookson, Engelberg, and Mullins, 2020; Jia, Redigolo, Shu, and Zhao, 2020).
 In this paper, we focus on the investment advice provided on Reddit’s Wallstreetbets (WSB),
the forum targeted in the recent Congressional probe. WSB is a forum (called a subreddit) where users
post investment advice and the community comments on the idea. WSB is known for its brash culture
and its emphasis on highly speculative trading strategies. It is by far the most popular finance-related
subreddit experiencing explosive growth with currently 9.5 million subscribers (9x increase year-over-
year). On January 28th, 2021 WSB generated more than 271 million pageviews, ranking it as the third
most visited cite on the day (behind only Google (#1) and Youtube (#2), and ahead of Facebook
(#4). 3
 WSB’s tremendous growth, coupled with its emphasis on more speculative strategies has raised
significant concern, particularly among regulators, that WSB induces uninformed trading that harms
unsophisticated retail investors. For example, William Gavin, Secretary of the Commonwealth of
Massachusetts proposed a trading halt in Gamestop, the most popular stock on WSB, to protect “small

1 Hedge funds Melvin Capital and Citadel also testified. For the transcript of the testimony, see https://www.c-
span.org/video/?508545-2/gamestop-hearing-part-2
2 While this may be the most publicized recent example, policy makers have long been concerned about social media and

financial markets. For instance, see https://www.nytimes.com/2013/04/29/business/media/social-medias-effects-on-
markets-concern-regulators.html.
3 https://mashable.com/article/reddit-wallstreetbets-subreddit-record-traffic-gamestop/ As a reference, other prominent

social finance sites such as Seeking Alpha, Motley Fool, and Estimize generate roughly 1.1 million, 13,000, and 6,500
average daily pageviews.

 1
and unsophisticated investors.” 4 On the other hand, many people more familiar with WSB suggest
that the posters and users are actually quite sophisticated. For example, WSB moderators write that,
“Moderating WSB has taught us that retail investors can be every bit as sophisticated as institutional
investors, and, in some cases even more so. We have researchers, mathematicians, momentum traders,
gamblers, and so much more.” 5
 Motivated by these competing views, our paper examines both the value of the investment
advice provided on WSB, and the impact of this investment advice on retail trading. Our focus is
exclusively on single firm ‘Due Diligence” (DD) reports, which are reports identified by the poster
(and verified by moderators) as containing some type of analysis and a clear buy or sell signal. Our
sample includes 2,340 DD reports issued between 2018 and 2020. The number of DD reports increase
exponentially through time coinciding with the exponential growth in the WSB user base. Consistent
with the view that WSB emphasize speculative investments, we find that DD reports tilt towards
unprofitable, volatile stocks with low institutional ownership.
 After examining the determinants of WSB reports, we turn to the investment value of DD
recommendations. We find ‘buy’ DD recommendations (~80% of all DD reports) earn two-day
abnormal returns of roughly 1.12% percent. These returns are statistically significant and economically
large, albeit smaller than the average returns to sell-side analyst recommendations (Womack 1996;
Crane and Crotty, 2020), but substantially larger than the returns to Seeking Alpha recommendations
(Farrell, Jame, and Qiu, 2020). We do not however, find significant abnormal returns to ‘sell’
recommendations. 6
 We next examine if this price movement is transitory (e.g., due to short-term uninformed price
pressure) or permanent. We fail to find any evidence of reversals. In fact, the returns continue to drift
in the same direction over the next month. For instance, we find Day (2,21) returns of 1.45%, which
are highly statistically and economically significant. Further, the cumulative one-quarter return
following buy DD recommendations exceeds 6%.
 One possible explanation for the significant returns following WSB buy recommendations is
that WSB users simply piggyback off other information events that tend to have considerable drift
(Altinkilic and Hansen, 2009; Bradley, Clarke, Lee and Ornthanalai, 2014)). We repeat our analysis on
the subsample of DD reports that do not coincide with major information events including earnings

4 https://www.cnbc.com/2021/01/27/gamestop-speculation-is-danger-to-whole-market-massachusetts-regulator.html
5https://www.bloomberg.com/news/articles/2021-01-29/wallstreetbets-mods-focus-on-growth-say-culture-

misunderstood
6 However, we find that the returns to buy recommendations are significantly larger the returns to sell recommendations.

 2
news, sell-side analyst research, abnormal media coverage, or a previous WSB DD report. The results
for this subset of non-confounded DD reports remain highly significant and are of similar economic
magnitude. In other words, WSB posters ability to forecast future stock returns is not limited to
piggybacking off other information events.
 Finally, we examine the impact of DD reports on retail trading activity, estimated using the
method in Boehmer, Jones, Zhang, and Zhang (2020). Similar to Farrell et al. (2020), our identification
strategy exploits changes in retail trading over short windows before and after the DD report. Among
DD reports that are released during trading hours, we find an average 7% increase in retail trading in
the five half-hours after the report is released relative to the five-half hours before the report is
released. Our estimate is comparable to the increase in retail trading around Seeking Alpha reports in
Farrell et al. (2020). We also find some modest evidence that retail order imbalances (i.e., net-buying)
tend to be greater for DD reports that earn subsequently larger returns. This finding is consistent with
retail investors perhaps having some ability to discern the quality of DD reports.
 Collectively, our evidence suggests that 1) WSB DD posters have skill and 2) retail investors
may have some ability to discern report quality. Our evidence is in sharp contrast to the conventional
view that WSB only attracts uninformed investors and to regulators fears that following the advice of
user reports on WSB results in significantly less informative retail trading. . 7
 Our study contributes to two strands of literature. First, our study adds to the literature on the
role of social media in financial markets. While some papers find a significant positive relation between
investment opinions on social finance sites and future stock returns (e.g., Chen et al., 2014; Jame,
Johnston, Markov, and Wolfe, 2016; and Crawford, Gray, Johnson, and Price, 2018), others do not
(Tumarkin and Whitelaw, 2001; Kim and Kim, 2014; and Giannini, Irvine, and Shu, 2018). We
contribute to this literature by providing a first look at the investment value of DD reports on WSB,
which has recently become the most influential social finance site by many metrics. 8 Although WSB
may be viewed as highly speculative and ripe for fraudulent activity, our findings suggest that DD
report recommendations on WSB contain significant investment value.

 This study also contributes to the literature on retail trading. Early work finds that retail traders
are uninformed ‘dumb money’ (Hvidkjaer, 2008; Frazzini and Lamont, 2008). However, more recent

7https://medium.com/concoda/meet-the-reddit-community-where-members-gamble-their-life-savings-f3c3b7699627
8 To our knowledge, the only other paper that uses WSB data is Eaton, Green, Roseman, and Wu (2021) who use
Wallstreetbets posts to proxy for stocks favored by Robinhood account holders. They do not, however, examine the market
consequences of investment advice on the platform.

 3
evidence suggests that retail trades are informed (Kelley and Tetlock, 2013; Boehmer, Jones, Zhang,
and Zhang, 2020) and are skilled at processing public information (Farrell et al., 2020). Our evidence
that retail traders have some ability to discern the quality of WSB report is consistent with this more
recent evidence.
 The rest of the paper proceeds as follows. Section 2 provides background details of Reddit’s
WSB, describes the sample, and provides an analysis on the determinants of WSB reports. Section
3examines the abnormal returns associated with following DD report recommendations. . Section 4
proceeds with an examination of retail trading activity. Section 5 concludes.

2. Data and Descriptive Statistics
2.1 Reddit and Wallstreet Bets – Background and Sample
 Reddit is a social media platform founded in June 2005. Like many other social media websites,
contributors post content and other users can add comments in response to the original post. The
Reddit community is a collection of forums, where each forum is dedicated to particular topic called
a subreddit. Each subreddit is then organized in several pages based on users’ ranking criteria. For
instance, the default page is the ‘Hot Page,’ which lists the currently most viewed posts or posts with
the most active commentators. ‘New Posts’ lists posts based on the listing timestamp and ‘Top posts’
lists the posts with the most likes (upvotes) and comments for a specified period. When a new post is
written, it is only visible in the new post category. The post can then move up to the hot page if it
reaches sufficient traffic.
 Wallstreetbets (WSB) is one of many subreddits within the Reddit community. It was created
on January 31, 2012 with a particular emphasis on highly speculative trading strategies. While this is
not the only subreddit dedicated to investing strategies (i.e., r/Investing, r/Personalfinance, r/Stocks,
etc.), we focus on this particular subreddit for two primary reasons. First, with over 9 million
subscribers, it is by far larger than other finance related subreddits. Second, and perhaps most
importantly, it is the subreddit that has recently attracted significant media and regulatory attention
from its role in the Gamestop short squeeze. 9 The conventional view is that this forums’ user base is
predominantly unsophisticated retail investors who are more interested in gambling than investing.

9 https://markets.businessinsider.com/news/stocks/sec-hunting-fraud-misinformation-social-media-reddit-driven-
trading-frenzy-2021-2-1030042965

 4
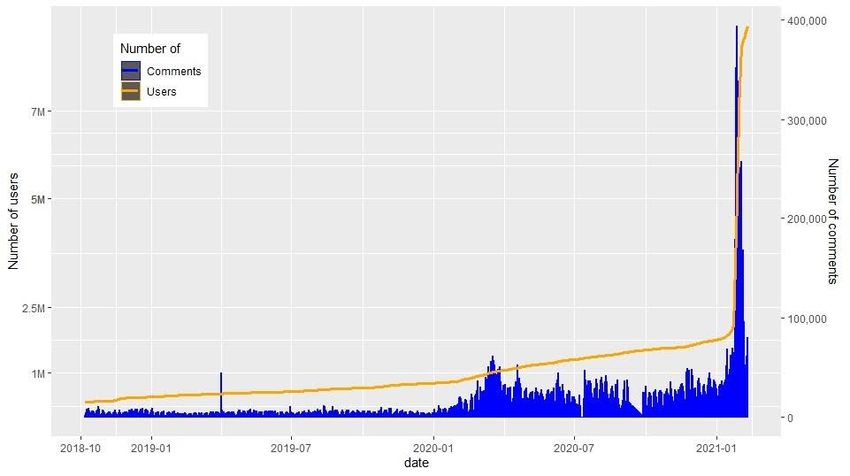
There has also been significant concern that the “research” on WSB is at best uninformative, and at
worse a force that destabilizes stock prices and contributes to significant retail trading losses.
 Importantly, the view of WSB as having a niche clientele that prioritize speculative trading
strategies over more traditional investment research, suggest that the impact of WSB on financial
markets and retail investor trading may differ substantially relative to other social finance sites studied
in the prior literature. For example, several studies on Seeking Alpha suggest that a large fraction of
seeking alpha posts and contributors are skilled (see, e.g., Chen et al., 2014; Farrell, Jame, and Qiu,
2020), and Seeking Alpha research helps facilitate more informative retail trading (Farrell et al., 2020).
However, apart from the fact that both WSB and Seeking Alpha have approximately the same number
of subscribers (~9 million), the two social finance platforms have very little in common. For example,
there is limited quality control on WSB with no barriers to entry, whereas Seeking Alpha employs an
editorial team to review all research reports to ensure quality. 10 Further, WSB reports tend to be
considerably less in-depth than the average Seeking Alpha article, and the user base of WSB is likely
to have significantly less financial sophistication. 11

 ***Insert Figure 1***

 Figure 1 shows the explosive growth trajectory in the WSB forum, in terms of both the number
of users and comments. For example, the forum has grown from roughly 500,000 users at the start of
2019 to more than 9 million users as of January 2021. Similarly, the average number of comments per
day trended below 50,000 for all of 2019 but is now approaching 400,000. The huge spike in the
beginning of 2021 corresponds to the timing of the Gamestop short squeeze.
 We scrape all posts on WSB from 2018 to 2020. The API allows us to obtain all DD posts,
including posts later deleted by users, and is thus free from selection biases. 12 We begin in 2018
because as Figure 1 shows, the number of users is sparse before then and unlikely to have any
meaningful market impact. Our analysis focuses on Due Diligence (DD) reports. These reports are

10 One SA contributor describes the extensive editorial review process here (https://walletsquirrel.com/first-article-on-
seeking-alpha/).
11 With respect to article depth, we find that the average WSB post in our sample is 352 words, which is roughly half of

the length of a typical SA report (675 words), as reported in Chen et al., 2014. With respect to investor sophistication, the
average Seeking Alpha user has a household income of $321,000 and roughly $1.5 million in investable assets (see
https://static.seekingalpha.com/uploads/pdf_income/sa_media_kit_04_2020.pdf ). While these figures are unknown for
WSB users, anecdotal evidence suggests that these estimates would be substantially smaller.
12
 There is, however, a period between April 2020 and July 2020 where all DD reports are missing. This is likely due to an
issue with Reddit’s API.

 5
vetted by the moderators as containing information where 1) at least some analysis has been performed
and 2) the author provides a clear investment recommendation (long or short). 13 For each DD report,
we manually review the report to identify the investment recommendation and ticker. Although the
author’s investment recommendation is clear to anyone reading the report, there is no standardized
format for listing the recommendations which necessitates a manual review of each post. The manual
review of tickers is also needed for two reasons. First, users may place special characters before or
after a ticker symbol that a program would misclassify. Second, users may intentionally post a wrong
ticker to misdirect hedge funds and other institutional investors that monitor message boards using
algorithms. 14
 We limit the sample to DD reports focused on a single ticker (e.g., we eliminate DD reports
that focus on market-wide or industry analysis), and we also limit the sample to common stocks (CRSP
share codes 10 and 11) with available data in the CRSP-Computstat merged database. Appendix A
provides an example of a DD report in our sample. The header of the report includes the user, firm
name and ticker. Although not visible in Appendix A, each DD report also includes the timestamp of
the report (i.e. 3/20/2020 18:54:53 eastern time), which allows us to examine the market’s reaction to
the report over short windows. For each report, we also collect the total number of words in the
report (report length), the total number of comments, the fraction of voters that “upvoted” the article,
and the number of awards that the DD report received. Awards are given by other Reddit users when
they find posts or comments useful. These awards are accompanied by virtual coins that users can
purchase and then allocate as they wish. 15
 We use Report length as our measure of article quality. While other measures (e.g., awards,
comments, etc.) are likely also correlated with article quality, they suffer from a potential look-ahead
bias. In particular, users may choose to give an award only after the DD report has turned out to be
correct. In untabulated analysis, we confirm that article length is significantly correlated with (p
the post received any awards (ρ = 0.36), and a continuous measure of the total number of awards (ρ
= 0.19). Thus, we believe that Report length is a plausible measure of ex-ante research quality.

 ***Insert Table 1***

 Panel A of Table 1 provides summary statistics. The final sample includes 2,340 DD reports,
of which roughly 80% (1,886) are buy recommendations. The 2,340 reports cover 612 unique firms.
Thus, conditional on having at least one DD report, the average firm in the sample has 3.8 unique
reports. The average report is roughly 352 words, although there is sizeable variation with the
interquartile range spanning from 99 words to 418 words (unreported). We also observe the dramatic
growth in the number of DD reports over time, with roughly 75% of total DD reports occurring in
the last year of the sample.
 As we discuss in greater detail in Section 3, to reduce the impact of potentially important
confounding events, much of our analysis will rely on sub-samples of the data. The first sub-sample,
Non-Confounded reports, excludes any reports that have a confounding information event, defined as
an earnings announcement, I/B/E/S research report, abnormal media coverage, or a DD report by a
different user, over the [-1,0] window, where day 0 is the day of the DD report. The second sample,
Intraday reports, limits the sample to posts that occur during trading hours (i.e., between 9:30 am and
4:00 pm eastern on a day where the market is open for trading).
 Panels B and C of Table 1 report the summary statistics for the Non-Confounding reports and
Intraday reports, respectively. We find excluding DD reports that coincide with information events
shrinks the sample from 2,340 to 578 reports, consistent with many DD reports being motivated by
major information events (e.g., a recent earnings announcement or a previous DD report). We also
find Non-Confounded reports tend to be longer than Confounded reports (404 words versus 335 words)
consistent with Non-Confounding reports containing more in-depth analysis. Our sample also includes
869 Intraday reports which tend to be slightly shorter than after-hour posts.

2.2 Other Variable Construction
 We obtain financial statement data, including book value of equity, book value of debt, book
value of assets, earnings before interest taxes depreciation and amortization (EBITDA), and total
common shareholders from Compustat. We obtain financial market data including daily data on share
price, shares outstanding, stock returns, and volume from CRSP. We complement the daily return

 7
data from CRSP with intraday trade and quote data from NYSE TAQ. Earnings announcement dates
and sell-side analyst earnings forecast data are from the I/B/E/S unadjusted US detail history file and
sell-side analyst recommendations from the I/B/E/S detail recommendation file. We collect the
number of shares held by institutions from the Thomson Reuters Institutional Holdings database, and
data on media coverage from Bloomberg.
 We identify retail trading from TAQ data using the approach of Boehmer, Jones, Zhang, and
Zhang (BJZZ, 2020). Specifically, we classify trades with TAQ exchange code “D” and prices just
below a round penny (fraction of a cent between 0.6 and one) as retail purchases, while trades on
exchange code “D” and prices just above a round penny (fraction of a cent between zero and 0.4) are
classified as retail sales. This classification is conservative in the sense that is has a low type 1 error
(i.e., trades classified as retail are very likely to be retail). However, this classification does omit retail
trades that occur on exchanges as well as limit orders that are not immediately executable.

2.3 Determinants of WSB Coverage
 We next examine the characteristics of firms with DD posts. We expect that many of the
determinants of research coverage on other social finance sites (e.g., Seeking Alpha) are likely to be
relevant on WSB as well. For example, we expect that WSB will also have a significant tilt towards
stocks more heavily owned by retail investors. However, relative to Seeking Alpha, we expect that
WSB users will tend to post on more speculative stocks, including stocks with greater volatility.
 To facilitate a comparison with Farrell et al. (2020) [hereafter FGJM] who study the
determinants of SA coverage, we use a similar set of firm characteristics studied in FGJM as potential
determinants of WSB coverage. Specifically, we estimate the following panel regression:

 , = + 1 ℎ , −1 + ℎ + , . (1)

The dependent variable, WSB Coverage, is the natural log of 1 plus the total number DD reports issued
for firm i during month m. Chars is the vector of firm characteristics used in FGJM and includes the
percentage of the firm’s shares held by institutional investors at the end of the prior year (Inst.
Ownership), the number of common shareholders (Breadth of Ownership), market capitalization (Size),
book to market (BM), return volatility (Volatility), share turnover (Turnover), past one-month returns
(Returnm-1), past returns over the prior two to twelve months (Retm-2, m-12) past one-year profitability
(Profitability), an indicator equal to one if past one-year profitability was negative (Negative Prof) the

 8
number of unique media articles mentioning the firm in the prior year (Media Coverage), and the number
of sell-side analysts issuing a forecast for the firm in the prior year (IBES Coverage). See Appendix B
for detailed definitions. We winsorize all continuous variables at the 1st and 99th percentiles, we log all
continuous variables other than Profitability and Return, and we standardize all variables to have zero
mean and unit variance. We include month fixed effects and cluster standard errors by firm and month.

 ***Insert Table 2***

 We find that the determinants of WSB coverage are frequently similar to those of SA coverage.
For example, consistent with SA coverage, we find that WSB coverage is increasing in firm size,
turnover, volatility, and decreasing with institutional ownership. In most cases, the magnitude of the
estimates for WSB are amplified. For example, FGJM document that a one standard deviation increase
in institutional ownership is associated with a 27% decline in SA coverage, whereas we estimate a
decline of 49%. Further, consistent with WSB preference for more speculative stocks, we find that a
one-standard deviation increase in past volatility is associated with a 50% increase in WSB coverage,
which is more than double the corresponding estimate in FGJM or 21%. WSB preference for more
speculative stocks is further reinforced by their tendency to cover stocks with negative profitability.
 Specifications 2 and 3 also examine whether firm characteristics can help explain the direction
of the investment recommendation.. We repeat Equation (1) after replacing the total number of DD
reports with either the number of DD reports issuing a buy recommendation (Specification 2), the
number of DD reports issuing a sell recommendation (Specification 3), or the difference in the
number of buy versus sell recommendations (Specification 4). Turning to Specification 4, we find that
WSB users are more likely to issue buy recommendations (relative to sell recommendations) for stocks
with less institutional ownership, greater volatility, and negative profitability. These findings are again
consistent with WSB users preferring to take the long side of more speculative investments.

3. The Event-Period Market Reaction to DD Reports
3.1 The Returns following All DD Reports
 In this section, we examine event-time returns following DD reports. We estimate the
abnormal return for each DD report (αk) as:

 9
 = [∏ =0(1 + ) − ∏ =0(1 + )], (2)

where is the return on stock discussed in report k on day t, and is the return on a benchmark
portfolio. We measure returns starting from day 0. For reports issued outside of trading hours, the
day 0 return is the CRSP return for the trading day following the recommendation. For reports issued
during trading hours, we obtain the prevailing midpoint quote from TAQ for the stock at the time the
post is published on WSB, and we calculate the day 0 return from the quoted midpoint to the closing
price. We measure the cumulative returns from day 0 through day x, where we set x equal to either
zero, one, five, or 21 trading days.
 The return analysis ends as of the end of December 2020, the last period for which we have
CRSP return data. Thus, for many December 2020 posts, the 21-day holding period is cut short.
Importantly, this cutoff also results in all our analysis pre-dating the frenzied returns of GameStop
and other meme stocks frequently mentioned on WSB. Excluding these observations from our
analysis will naturally attenuate the average returns associated with DD reports on WSB. Nevertheless,
we are primarily interested in understanding the investment value of WSB prior to the unusual events
of January 2021.
 Following Crane and Crotty (2020), for the intraday return (i.e., the day 0 return for reports
released during trading hours), the benchmark portfolio return is the return on the SPY index over
the same horizon. For all other horizons, we consider two benchmark portfolio returns. The first is
the return on the CRSP value-weighted market portfolio (i.e., market-adjusted return), and the second
is the equally-weighted return on a portfolio of stocks matched on size, book-to-market, and
momentum (i.e., DGTW-adjusted returns). 17

 ***Insert Table 3***

 Panel A of Table 3 reports the event-time returns following DD report buy recommendations.
Row 1 reports the results using market-adjusted returns. Across the 1,878 DD reports with buy
recommendations, we find that the average return from the DD post until the close of trading is 0.91%
The estimate grows to 1.20% over the [0,1] holding period and 1.76% over the [0,5] holding period.
All three estimates are statistically significant at a 1% level based on standard errors double clustered

17See Daniel, Grinblatt, Titman, and Wermers (1997) for a more detail discussion of the construction of the DGTW
benchmark portfolio.

 10
by firm and day. Further, the economic magnitudes are sizeable. As a benchmark, Womack (1996)
find that the average 3-day size adjusted return following sell-side analysts’ recommendations is 2.98%,
and Farrell, Jame, and Tiu (2020) find that the five-day abnormal returns to Seeking Alpha
recommendations is 0.38%.
 We also find that the market adjusted returns continue to increase over longer horizons. For
example, over the [0,21] period the abnormal return increases to 3.92%. The 21-day holding period
return is also considerably larger than the two-day return [0,1], suggesting that there is a significant
drift. We test this formally, by examining the return over the [2, 21] holding period. The estimate of
2.78% remains highly significant (p
continue to drift upwards over time. At the end of the 13-week holding, the average buy DD report
has earned an abnormal return of 6.17%. We find that the abnormal returns to sell reports generally
hover close to zero regardless of the holding period. In sum, the longer horizon returns provide no
support for the price pressure explanation.

 ***Insert Figure 2***

3.2 Confounding Information Events
 The significant returns following DD reports could simply be a consequence of DD reports
piggybacking off other news events (see, e.g., Altinkilic and Hansen, 2009). Alternatively, it is possible
that DD reports contain more novel information production. While both channels are potentially
valuable to users who rely on WSB for investment advice, distinguishing these explanations provides
insight into the source of the investment value.
 We partition all DD reports into those that coincide with major information events (Confounded
Sample) and those that do not (Non-Confounded Sample). The confounded sample includes any reports
where an earnings announcement, I/B/E/S research report (recommendation or earnings forecast
revision), or a DD report by a different user, was issued over the [-1,0] window, where day 0 is the
day of the DD report. In addition, we collect media coverage intensity from Bloomberg. Bloomberg
records the number of news articles released for a stock over the hour and then creates a number
score each hour by comparing past 8-hour average count to all hourly counts over the previous 30
days for the same stock. A value of 0 indicates that the media coverage is in the lowest 80% of the
hour counts relative to the previous 30 days. Similarly, Bloomberg assigns a score of 1, 2, 3, or 4 if the
average is the value is in the 80% to 90%, 90% and 94%, 94 and 96%, or greater than the 96%.
Bloomberg creates a daily score by taking the maximum of these hourly scores. To be conservative,
we classify a firm as having a confounding event if the daily media score is greater than zero on either
day [0] or day [-1]. 18 All remaining reports are classified as Non-Confounded Reports.

 ***Insert Table 4***

18 Some prior work classifies an event as confounding if the firm has any media coverage on a day. However, larger firms
(e.g., Apple and Telsa) have media coverage on every single day of the sample. We believe that focusing on a firm’s
abnormal media coverage is a better approach to capturing economically important confounding events.

 12
Panel A of Table 4 reports the DGTW-adjusted returns following Confounded and Non-
Confounded DD reports with a buy recommendation. The majority of all DD buy reports (~75%) are
Confounded, consistent with most DD reports following significant information events. Further, the
abnormal returns following Confounded DD buy reports are significantly positive. This could be
consistent with WSB users forecasting drift following news events, or this may be a consequence of
WSB users skillfully processing public information. Regardless of the specific mechanism, users
following Buy DD reports following information events would earn abnormal returns. 19 We also find
significant positive returns following Non-Confounded reports. In fact, the abnormal returns are typically
larger for Non-Confounded reports than Confounded reports(although the estimates are not reliably
different from each other). The significant positive returns following Non-Confounded reports are
consistent with WSB having skill at information production.
 Panel B presents analogous results for sell reports. We find no evidence that Confounded or
Non-Confounded sell DD reports are associated with significant abnormal returns. This finding mirrors
the results from Table 3 which finds no evidence of skill across all sell DD reports.

4. Retail Investor Trading following DD Reports
4.1. DD Reports and the Intensity of Retail Trading
 In this section, we examine whether DD reports result in increased retail trading. An important
caveat to this analysis is that the timing of DD reports is not random. In particular, DD reports are
almost certainly more likely to be written when retail trading interest in the stock is greater. Thus, any
cross-sectional test between DD report frequency and retail trading is likely to uncover a significantly
positive relation even if the DD reports has no causal effect on retail trading.
 To minimize this concern, we compare the intensity of retail trading over very short windows
around the DD report. Specifically, we compare retail trading on the first trading day following the
DD report relative to retail trading on the day immediately prior to the report. For example, if a report
occurs at 6 pm on Thursday, we compare retail trading intensity on Friday (the post-period) to retail
trading intensity on Thursday (the pre-period). The identifying assumption of this analysis is that retail
trading interest in the stock is unlikely to change over this short window for any reason other than the
DD post. This assumption may not be valid, particularly if a major information event occurred after
trading hours.

19One concern is that the returns are purely attributable to the news story itself which may not be fully realizable. We note
however that we continue to find significant returns even after day 0, include the [2,21] holding period.

 13
To minimize this concern, we also emphasize two sub-samples. The first is the subset of Non-
Confounded reports, as described in Section 3.2. The second is the sub-sample of reports that are issued
intraday (Intraday reports). For Intraday reports, we can compare retail trading on the same day, both
before and after the report is released. 20 Even if an event is responsible for the DD post, the exact
timing of the event and the DD post are likely to differ since it will take some time for a WSB poster
to learn about the event, process the event, and then write a report. This timing differential should
allow us to isolate the causal impact of DD reports on retail trading over short horizons. In particular,
if retail investors are reacting to an earlier information events, we expect retail trading intensity
estimated shortly before the posting of the DD report to be similar to retail trading intensity estimated
shortly after the posting of the report. On the other hand, if retail investors are reacting to the DD
post itself, rather than the underlying information event, we should observe a sharp increase in retail
investor trading in the period immediately following the posting of the DD report.

 We explore the impact of DD reports on retail investor trading intensity using the following

regression:

 , = + 1 , + , −1 + + + , . (3)

Retail Trades is the number of retail trades, defined as log (1 + # of Retail Trades) in the half-hour
window t around the DD report i. 21 is an indicator equal to one if the trading is measured after
the release of the DD report and zero otherwise. For an intraday report that occurs within the 30-
minute window, the assigning of pre versus post is ambiguous, and thus we exclude the 30-minute
interval from the test. 22 Ret is the DGTW-adjusted return on the previous trading day. Report denotes
DD Report fixed effects. By including Report fixed effects, our identification comes exclusively from
changes in retail trading in the same stock in the short window around the release of the report. Finally,
Half Hour denotes half-hour fixed effects and controls for the fact that retail trading intensity varies
systematically within the trading day.

 ***Insert Table 5***

20 Farrell et al. (2020) adopt a similar identification strategy when estimating the impact of Seeking Alpha posts on retail
trading.
21
 We focus on retail trades, rather than retail trading volume to minimize the impact of a few very wealthy retail investors.
Nevertheless, we find very similar results using retail trading volume (untabulated).
22 For example, if a post occurs at 2:15, we would exclude the 2:00 pm -2:30 pm window.

 14
Specification 1 of Table 5 reports the results for the full sample of DD reports and limits the
event window to the [-1,0] interval. We find that the coefficient on Post is 0.12. The estimate is highly
significant (t=6.23%) based on standard errors clustered by firm and day. The magnitude indicates
that retail trading is 12% higher on the day after the DD report relative to the day before.

 As discussed above, one concern with the analysis in Specification 1 is that some underlying
information event (e.g., an overnight earnings announcement) is responsible for both the DD report
and the elevated retail trading. To minimize this concern, in Specification 2, we limit the sample to
Non-Confounded Reports. The estimate on Post falls to 0.07 but it remains reliably different from zero.

 Next, we limit the sample to DD reports issued during trading hours and focus on the [0,0]
event window. We again obtain an estimate of 0.07. In other words, holding the firm-day constant
(and controlling for half-hour fixed effects), we find that retail trading is 7% higher in the period
following the DD report then the period immediately prior to the DD report. The 7% estimate is
economically sizeable. For reference, Farrell et al. (2020) estimate that the posting of a Seeking Alpha
report increases retail trading by roughly 6-9% depending on the specification.

 To better understand the dynamics of the retail trading increase following the DD report, we
repeat Specification 3 after including retail trades in the half-hour of publication and replacing Post
with ten separate indicators variable for each half-hour period ranging from -5 to 5 (DD[-5] to
DD[+5], with period -1 being the omitted group. 23

 ***Insert Figure 3***

 Figure 3 reports the estimates from this regression as well as 90% confidence intervals based
on standard errors double-clustered by firm and day. We find that the average estimates on all of the
pre-event indicators (DD[-5] through DD[-2]) are economically small and statistically insignificant.
This finding is consistent with no unusual retail trading activity in the period immediately prior to the
DD report. We find that retail trading increase by more than 4% in the half-hour of the post (t=2.34)

23For example, if a DD report was issued at 2:15 pm then DD[+1] =2:30-3, DD[+2] = 3-3:30, DD[+3] = 3:30-4. In this
example, DD[+4] and DD[+5] would always be zero since there were not five full half hours following the event.
Similarly, DD[0] = 2:00-2:30, DD[-1] = 1:30-2, DD[-2] = 1:00-1:30, etc.

 15
and the estimates remain elevated for the remaining post-event periods. The average post-event values
are 7%, consistent with the findings in Specification 3 of Table 5.

4.2. DD Reports and the Informativeness of Retail Trading

 The results from the prior section indicate that WSB reports induce significant retail trading.
A natural question is whether this increased trading is informative (i.e., predictive of future returns).
There are at least two reasons to believe that WSB reports can induce more informed trading. First,
WSB buy reports significantly outperform WSB sell reports (see Table 3). Thus, if retail investors
simply follow the stated investment recommendation, this could increase their trade informativeness.
Second, prior work finds that retail investors are skilled at processing public information, (e.g., Kelley
and Tetlock, 2013, , and Farrell et al., 2020) which points to the possibility that retail investors may be
able to discern higher quality reports from lower quality reports. On the other hand, DD reports could
reinforce behavioral biases including confirmation bias (Cookson, Engelberg, and Mullins, 2020) and
attention-based trading (Barber and Odean, 2008; and Barber, Huang, Odean, and Zchwarz, 2020).

 We investigate these issues by testing whether, following the DD report, retail investors are
more likely to buy DD reports with buy recommendations (which tend to have higher returns) or are
more likely to buy DD reports that have large subsequent returns. Specifically, we estimate the
following regression:

 _ , = + 1 , + 2 , × + 2 , × 5 , (4)
 + , −1 + + + , .

Retail_OIB is the retail order imbalance for firm i during half-hour t, defined as the difference between
the number of retail buys less the number of retail sales scaled by total number of retail trades. Post,
Ret, Report and Half Hour are defined as in Equation (3). Buy is an indicator equal to one if the DD
report is a buy recommendation and 0 if it is a sell recommendation, and Ret5 is the five-day DGTW-
adjusted return following the report, measured over days [1,5]. We exclude Day [0] in the return
calculation to ensure that the returns are measured after retail trading is measured. Thus, our key
variables of interest are β2 which measures whether retail order imbalances (i.e., net buying) increase

 16
following a DD buy recommendation relative to immediately prior to the buy recommendation, and
β3 which measures whether retail order imbalances increase following a DD recommendation that is
associated with large ex-post returns.

 Table 6 reports the estimates from Equation (4). As in Table 5, Specification 1 reports the
results for the full sample, Specification 2 shrinks the sample to Non-Confounded reports, and
Specification 3 focuses on intraday reports and shrinks the event window to [0,0]. The estimates on
β2 are mixed across the three specifications. Thus, there is not very strong evidence that retail investors
are more likely to increase their net buying activity following a DD report with a buy recommendation.
In other words, although the direction of the DD report is informative about future returns (Table 3),
retail investors do not react strongly to this signal. The estimates on β3 are consistently positive and
statistically significant at either a 10% level (Specification 2) or 5% level (Specifications 1 and 3). The
magnitudes are also economically meaningful. For example, the estimate in Specification 3 indicates
that a 100% increase in five-day ahead returns is associated with roughly a 9.9 percentage point
increase in retail order imbalances. This pattern is consistent with retail investors being able to discern
DD report quality. It also casts doubt on regulators concerns that WSB is inducing retail investors to
make uninformed trades.

5. Conclusion

 Wallstreetbets (WSB) has become a household name after the intense media coverage
following the Gamestop short sale squeeze and subsequent Congressional hearings seeking to
determine its role in the event. Despite the conventional view that the platform primarily attracts
uninformed investors, we find no systematic evidence of this. In fact, we find that due diligence reports
– reports that are vetted by moderators as pertaining some analysis – contain investment value.
Specifically, we find average ‘buy’ recommendation are associated with over 1% two-day returns that
continue to drift upwards, exceeding 6% over the quarter. However, the abnormal returns for the
considerable smaller sample of sell recommendations, while generally negative, are not reliably
different from zero.

 Examining retail trading in short windows around DD report, we find a 7% increase in retail
trading in the period immediately following the posting of the due diligence reports. Moreover, our
results suggest that retail investors may be able to discern the quality of the reports, as we find that

 17
retail order imbalances become more correlated with future returns in the period immediately
following the DD post. Thus, in stark contrast to regulators fears that WSB is ripe for market
manipulation and harmful to retail investors, our results suggest that retail investors are likely to benefit
from the recommendations on the site. Our analysis ends in 2020, which is before the Gamestop
event in January 2021 that represented a huge shock to the site. Following our sample period, the site
has experienced even more dramatic growth in the number of retail investors visiting the site, and the
site is now attracting increased attention of commercial entities and hedge funds. How these changes
impact both the content and value of the investment advice on WSB is an interesting and fruitful area
for future research.

 18
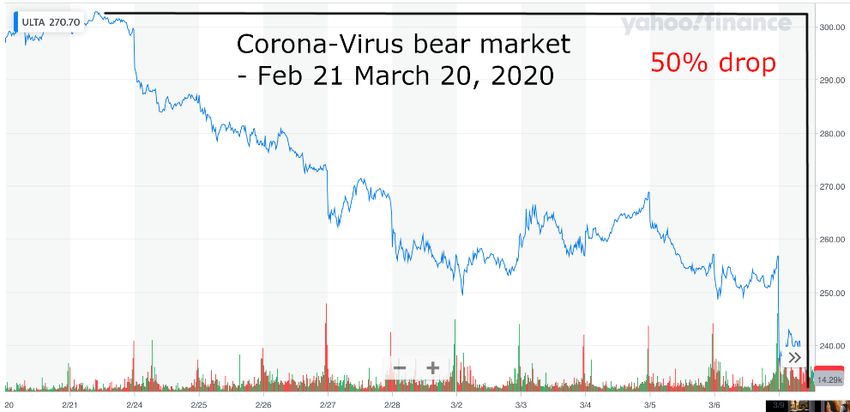
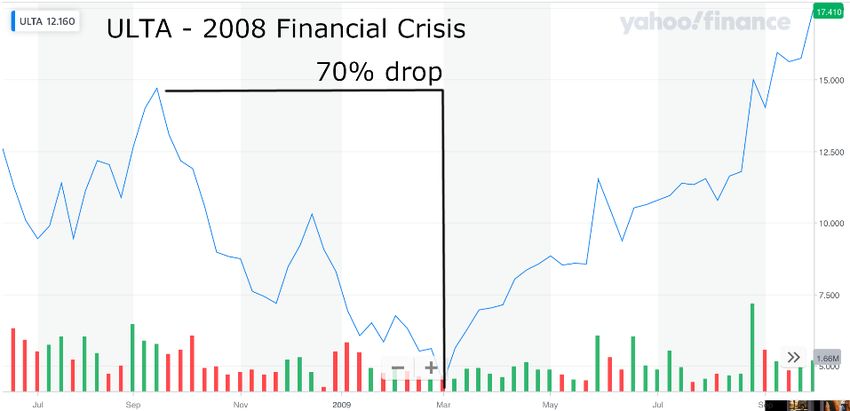
Appendix A. Sample post

Posted by u/swaggymedia Today after the bell: DP 11 months ago 2
For anybody that followed ULTA today. Here is some DD on ULTA Beauty and some info from
their conference calls/earnings reports.

DD
Yesterday someone posted on how ULTA was a good short going into a possible recession, so I decided to dig deeper.
In spring 2019 ULTA reached a 52-week high of $368.83.. going into this February 21 and the first day of the beginning
of the downtrend ULTA was sitting at $300 per share. After today's close it is now at $148. Is there more to squeeze to
the downside on this one? I'm not sure, but my opinion is yes. Let's compare ULTA now to the 2008/2009 financial
crisis. Keep in mind, ULTA has very strong brand loyalty and also has rights to the Kylie Jenner line, which they didn't
have back in 2008. From peak to trough during the financial crisis ULTA went from $15 to $4.50, a 70% drop.

ULTA during 2008/2009 crisis.

From peak to trough during the current corona virus crisis, ULTA has gone from $300 to $148 what it closed at today.
Let's say a 50% drop, already pretty hefty!

ULTA during Corona Virus Feb/Mar chart.

What makes me think there might be more to squeeze? Well I went through there financial reports and it looks like
during all of fiscal year 2019 they spent almost ALL of their profits re-purchasing stock (at all time highs). Take a look at
this, from there earnings release.

 19
ULTA outlook 2020 from financial report.
Not only that, but the board had approved a new share authorization program of up to 1.6 billion. This is including the
share re-purchase program already in place of $875 million re-purchase program initiated in 2019. ULTA's new re-purchase
program will be a total of $725 million for fiscal year 2020. To put this into perspective, in 2019 ULTA did $7.21 billion
in sales at an approximate profit margin of 10% for a total profit of $594 million.

ULTA's announcement of adjusted re-purchase program for 2020.
Now, something interesting happened to ULTA stock today March 20th. The stock opened up about +8% and remained
there for most of the day. Until the final 10 minutes of trading hours it was sitting at +10% for the day. At 3:54pm there
was a huge sell-off. Look at the volume of the sell-off compared to the volume for the entire day. Long red candles that
were held up with some big buying power just to keep it afloat. What are my thoughts on this? It is my opinion that a big
fish sold off a significant position of the stock, which was then propped up by market makers to keep the stock afloat. It
ended up closing up only 0.71% for the day. Please note this is only speculation and my opinion.

ULTA's daily chart from today Mar 20, 2020.
Disclaimer: I have a short position on the stock.
Summary
1. ULTA has fairly strong balance sheet (with not much debt) sitting at $208 million cash or roughly 2.47% of the value
of their market cap.
2. ULTA has strong brand loyalty, including Kylie Jenner's line of cosmetics.
3. However, if recession is looming cosmetics generally don't fare well during these times.

 20
4. In 2019 they spent nearly all their free cash flow after running operations and expansions on the re-purchase of stock.
5. In 2019 they did $660 million worth of share re-purchases and logged $594 million revenue for the year.
6. In 2020 they announced they've increased the buy-back program from $875 million to $1.6 billion, an increase of $725
million.
7. In their March 2020 conference call they also stated that there current numbers have NOT taken any of the
CoronaVirus factors into effect.
8. In 2008 their stock crashed nearly 70% from peak to trough.
9. Currently in 2020 during corona virus outbreak, they have had a 50% decline in stock price.

TLDR; they literally spent most of their money on share buy-backs last year when the stock was at ATH and this thing
still has room to drop.

DISCLAIMER: NOT FINANCIAL ADVICE. MODS R GAY

106 Comments
Report
95% Upvoted

 21
Appendix B: Variable Definitions
B.1 Outcome Variables
 • WSB Reports (Table 2) – the total number of Wallstreetbets (WSB) due diligence (DD) reports
 written for a firm during the calendar month. (Source: WSB).
 o Buy (Sell) Reports - the total number of WSB due diligence (DD) reports that
 recommend buying (selling) the firm during the calendar month.
 • Ret [0,X] (Tables 3 and 4) – the buy and hold abnormal return for the DD report recommendation
 starting on day [0] and ending on day [X]. . For reports issued outside of trading hours, the day 0
 return is the CRSP return for the trading day following the recommendation. For reports issued
 during trading hours, we obtain the prevailing midpoint quote from TAQ for the stock at the time
 the report is published on WSB, and we calculate the day 0 return from the quoted midpoint to
 the closing price. We measure the cumulative returns from day 0 through day x. (Source: CRSP
 and TAQ).
 o Market-Adjusted Returns – Ret [0,X] less the return on the CRSP value-weighted market
 portfolio over the same holding period.
 o DGTW-Adjusted Returns – Ret [0,X] less the equally-weighted return on a portfolio
 matched on size, book-to-market, and momentum over the same holding period. See
 Daniel, Grinblatt, Titman, and Wermers (1997) for a more detailed discussion of the
 construction of the DGTW benchmark portfolio.
 • Retail Trading (Table 5) – the total number of retail trades over a 30-minute window. Retail Trading
 is estimated using the approach outlined in Boehmer et al. (2019). (Source: TAQ).
 • Retail_OIB (Table 6) – retail buy trades less retail sell trades, scaled by total retail trades (Source:
 TAQ).

B.2 Other Variable
• Size – the market capitalization computed as share prices times total shares outstanding at the end
 of the year. (Source: CRSP).
• Book-to-Market (BM) – the book-to-market ratio computed as the book value of equity during the
 calendar year scaled by the market capitalization at the end of the calendar year. Negative values
 are deleted, and positive values are winsorized at the 1st and 99th percentile. (Source:
 CRSP/Compustat).
• Volatility – the standard deviation of daily returns during the month (Source: CRSP).
• Turnover – the average daily turnover (i.e., share volume scaled by shares outstanding) during the
 month.
• Profitability – EBITDA scaled by book value of assets. (Source: Compustat).
• Negative Prof – an indicator equal to one if Profitability is negative, and zero otherwise.
• Return (d-1) – the buy-and-hold return over the previous day. (Source: CRSP).
• Return (m-1) – the buy-and-hold return over the previous month. (Source: CRSP).
• Return (m-2, m-12) – the buy-and-hold return over the previous two to twelve months. (Source:
 CRSP).

 22
• Institutional Ownership – the percentage of the firm’s shares held by institutions at year end. (Source:
 Thomson Reuters Institutional Holdings S34).
• Breadth of Ownership – the total number of common shareholders (Source: Compustat).
• IBES Coverage – the number of unique brokerage houses issuing earnings forecast for a firm during
 the calendar year. (Source: IBES).
• Media Coverage – the total number of media articles about a firm during the calendar year. (Source:
 Bloomberg).
• Buy – an indicator equal to one if the DD report recommends a buy recommendation and zero if
 the report recommends a sell recommendation (Source: WSB).
• Ret5 - the DGTW-adjusted returns measured over the [1,5] period following the DD report.
 [Source: CRSP].
• Intraday Report – an indicator equal to one if the report is issued between 9:30 am and 4:00 pm
 during a trade day, and zero otherwise.
• Confounded Post – an indicator equal to one if the report is issued around a confounding information
 event, defined as an earnings announcement, I/B/E/S research report, abnormal media coverage,
 or a DD report by a different user, over the [-1,0] window, where day 0 is the day of the DD
 report. Details of each confounding event are below:
 o Earning Report –a quarterly or annual earnings announcement (Source: I/B/E/S).
 o I/B/E/S Report – an earnings forecast or investment recommendation by a sell-side
 analyst. (Source: I/B/E/S).
 o Abnormal Media Coverage – an indicator equal to one if Bloomberg’s daily media score is
 greater than zero. Bloomberg records the number of news articles released for a stock
 over the hour and then creates a number score each hour by comparing past 8-hour
 average count to all hourly counts over the previous 30 days for the same stock. A
 value of 0 indicates that the media coverage is in the lowest 80% of the hour counts
 relative to the previous 30 days. Similarly, Bloomberg assigns a score of 1, 2, 3, or 4 if
 the average is the value is in the 80% to 90%, 90% and 94%, 94 and 96%, or greater
 than the 96%. Bloomberg creates a daily score by taking the maximum of these hourly
 scores. (Source: Bloomberg).

 23
References
Altınkılıç, O. and Hansen, R.S., 2009. On the information role of stock recommendation
 revisions. Journal of Accounting and Economics, 48(1), 17-36.
Barber, B.M., Huang, X., Odean, T. and Schwarz, C., 2020. Attention Induced Trading and Returns:
 Evidence from Robinhood Users. Working paper.
Barber, B.M. and Odean, T., 2008. All that glitters: The effect of attention and news on the buying
 behavior of individual and institutional investors. Review of Financial Studies, 21(2), 785-818.
Boehmer, E., Jones, C.M., Zhang, X. and Zhang, X., 2020. Tracking retail investor activity. Journal of
 Finance, Forthcoming.
Bradley, D., Clarke, J., Lee, S. and Ornthanalai, C., 2014. Are analysts’ recommendations informative?
 Intraday evidence on the impact of time stamp delays. Journal of Finance, 69(2), 645-673.
Chen, H., De, P., Hu, J., and Hwang, B.H., 2014. Wisdom of the crowds: The value of stock opinions
 transmitted through social media. Review of Financial Studies 27 (5), 1367-1403.
Cookson, J.A., Engelberg, J. and Mullins, W., 2020. Echo chambers. Working paper.
Crane, A. and Crotty, K., 2020. How skilled are security analysts?. Journal of Finance, 75(3), 1629-1675.
Crawford, S., Gray, W., Johnson, B., and Price, R., 2018. What motivates buy-side analysts to share
 recommendation online? Management Science 64 (6), 2473-2972.
Daniel, K., Grinblatt, M., Titman, S. and Wermers, R., 1997. Measuring mutual fund performance
 with characteristic‐based benchmarks. The Journal of finance, 52(3), pp.1035-1058.
Eaton, G.W., Green, T.C., Roseman, B. and Wu, Y., 2021. Zero-Commission individual investors,
 high frequency traders, and stock market quality. Working paper.
Farrell, M., Green, T.C., Jame, R. and Markov, S., 2020. The democratization of investment research
 and the informativeness of retail investor trading. Working paper.
Farrell, M., Jame, R. and Qiu, T., 2020. The cross-section of non-professional analyst skill. Working
 paper.
Frazzini, A., and Lamont, O. A. (2008). Dumb money: Mutual fund flows and the cross-section of
 stock returns. Journal of Financial Economics, 88(2), 299-322.
Giannini, R., Irvine, P., and Shu, T., 2018. Nonlocal disadvantage. An examination of social media
 sentiment. Review of Asset Pricing Studies 8(2), 293-336.
Hvidkjaer, S., 2008. Small trades and the cross-section of stock returns. The Review of Financial
 Studies, 21(3), pp.1123-1151.
Jame, R., Johnston, R., Markov, S., and Wolfe, M., 2016. The value of crowdsourced earnings
 forecasts. Journal of Accounting Research 54 (4) 1077-1110.

 24
Jia, W., Redigolo, G., Shu, S. and Zhao, J., 2020. Can social media distort price discovery? Evidence
 from merger rumors. Journal of Accounting and Economics, 70(1), 101334.
Kelley, E.K. and Tetlock, P.C., 2013. How wise are crowds? Insights from retail orders and stock
 returns. Journal of Finance, 68(3), 1229-1265.
Kim, S.H., and Kim, D., 2014. Investor sentiment from internet message positives and the
 predictability of stock returns. Journal of Economic Behavior and Organization 107, 728-729.
Tumarkin, R. and Whitelaw, R.F., 2001. News or noise? Internet postings and stock price, Financial
 Analyst Journal 57, 41-51.
Womack, K., 1996. Do brokerage analysts’ recommendations have investment value? Journal of Finance
 51(1), 137-167.

 25
You can also read