Structural Analysis of the cl-Par-4 Tumor Suppressor as a Function of Ionic Environment - MDPI
←
→
Page content transcription
If your browser does not render page correctly, please read the page content below
biomolecules

Article
Structural Analysis of the cl-Par-4 Tumor Suppressor as
a Function of Ionic Environment
Krishna K. Raut, Komala Ponniah and Steven M. Pascal *

                                          Department of Chemistry and Biochemistry, Old Dominion University, Norfolk, VA 23529, USA;
                                          kraut@odu.edu (K.K.R.); kponniah@odu.edu (K.P.)
                                          * Correspondence: spascal@odu.edu; Tel.: +1-757-683-6763

                                          Abstract: Prostate apoptosis response-4 (Par-4) is a proapoptotic tumor suppressor protein that has
                                          been linked to a large number of cancers. This 38 kilodalton (kDa) protein has been shown to be
                                          predominantly intrinsically disordered in vitro. In vivo, Par-4 is cleaved by caspase-3 at Asp-131 to
                                          generate the 25 kDa functionally active cleaved Par-4 protein (cl-Par-4) that inhibits NF-κB-mediated
                                          cell survival pathways and causes selective apoptosis in tumor cells. Here, we have employed circular
                                          dichroism (CD) spectroscopy and dynamic light scattering (DLS) to assess the effects of various
                                          monovalent and divalent salts upon the conformation of cl-Par-4 in vitro. We have previously shown
                                          that high levels of sodium can induce the cl-Par-4 fragment to form highly compact, highly helical
                                          tetramers in vitro. Spectral characteristics suggest that most or at least much of the helical content in
                                          these tetramers are non-coiled coils. Here, we have shown that potassium produces a similar effect as
                                          was previously reported for sodium and that magnesium salts also produce a similar conformation
                                          effect, but at an approximately five times lower ionic concentration. We have also shown that anion
                                          identity has far less influence than does cation identity. The degree of helicity induced by each of

                                   these salts suggests that the “Selective for Apoptosis in Cancer cells” (SAC) domain—the region of
Citation: Raut, K.K.; Ponniah, K.;
                                          Par-4 that is most indispensable for its apoptotic function—is likely to be helical in cl-Par-4 under
Pascal, S.M. Structural Analysis of the   the studied high salt conditions. Furthermore, we have shown that under medium-strength ionic
cl-Par-4 Tumor Suppressor as a            conditions, a combination of high molecular weight aggregates and smaller particles form and that
Function of Ionic Environment.            the smaller particles are also highly helical, resembling at least in secondary structure, the tetramers
Biomolecules 2021, 11, 386. https://      found at high salt.
doi.org/10.3390/biom11030386
                                          Keywords: intrinsically disordered protein (IDP); prostate apoptosis response-4 (Par-4); tumor
Academic Editor: Simona                   suppressor; circular dichroism (CD) spectroscopy; dynamic light scattering (DLS); aggregation;
Maria Monti                               coiled-coil; caspase

Received: 27 January 2021
Accepted: 26 February 2021
Published: 5 March 2021
                                          1. Introduction
Publisher’s Note: MDPI stays neutral
                                                Prostate apoptosis response-4 (Par-4) is a tumor suppressor protein that is capable
with regard to jurisdictional claims in
                                          of selectively inducing apoptosis in cancer cells while leaving healthy cells unaffected [1].
published maps and institutional affil-   Par-4 was first identified through its down-regulation in therapy-resistant prostate cancer
iations.                                  cells and has since been shown to be ubiquitously expressed, localized in the cytoplasm, the
                                          nucleus and extracellularly, and linked to a variety of cancers [2–5]. The par-4 gene maps
                                          to human chromosome 12q21 and encodes an approximately 40 kilodalton (kDa) protein
                                          of 340 amino acids [6]. While Par-4 has been shown to be largely intrinsically disordered
Copyright: © 2021 by the authors.
                                          in vitro, it does contain several identifiable domains and features. The first identified
Licensee MDPI, Basel, Switzerland.
                                          domain was the C-terminal coiled-coil, which is highly conserved across humans, mice,
This article is an open access article
                                          and rats [7]. This region contains a small nuclear export signal (NES). The coiled-coil is
distributed under the terms and           responsible for Par-4 dimerization, and for most known interactions with cellular proteins.
conditions of the Creative Commons        Two nuclear localization signals are found in the N-terminal half of the protein, though
Attribution (CC BY) license (https://     only the 2nd, NLS2, has been shown to affect localization [8,9]. Par-4 also contains a unique
creativecommons.org/licenses/by/          and highly conserved “Selective for Apoptosis in Cancer cells” (SAC) domain, which is the
4.0/).                                    minimal region required to induce apoptosis [8,9].

Biomolecules 2021, 11, 386. https://doi.org/10.3390/biom11030386                                     https://www.mdpi.com/journal/biomolecules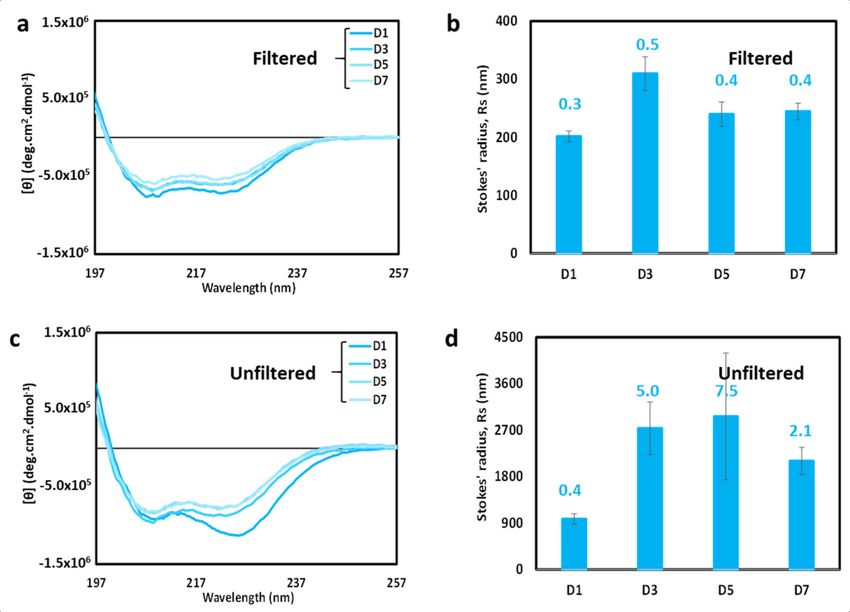
Biomolecules 2021, 11, 386                                                                                           2 of 13

                                   Although Par-4 is expressed in both normal and cancer cells, only cancer cells are
                             typically susceptible to the killing effect of this protein. The two best-documented factors
                             controlling this selectivity are (i) GRP78 levels and (ii) PKA levels. (i) Extra-cellular Par-
                             4 can enter cancer cells by binding to the surface receptor GRP78 via the Par-4 SAC
                             domain [10]. GRP78 levels in healthy cells are typically very low or even undetectable,
                             abrogating entry of extracellular Par-4 into healthy cells. (ii) Protein Kinase A (PKA) is
                             required to phosphorylate intracellular Par-4 at residue T163, which is within the SAC
                             domain [4,11,12]. This phosphorylation event leads to the inhibition of PKC-ζ by Par-4,
                             which in turn suppresses phosphorylation of FADD by PKC-ζ. Unphosphorylated FADD
                             is required for DISC (Death-Inducing Signal Complex) formation at the plasma membrane,
                             which triggers the caspase-8-mediated apoptotic pathway [9,10]. As with GRP78, the basal
                             level of PKA in healthy cells is typically low and insufficient to cause phosphorylation of
                             Par-4, thereby preventing DISC formation in healthy cells.
                                   Interestingly, one key event downstream of caspase-8 activation is the activation
                             of caspase-3, which in turn cleaves intracellular Par-4. Caspase-3 cleaves Par-4 after
                             D131, producing two fragments: a 15 kDa amino-terminal fragment (called PAF for Par-4
                             Amino terminal Fragment) and a 25 kDa carboxy-terminal fragment (called cl-Par-4 for
                             cleaved) [8,13]. Assisted by NLS2, cl-Par-4 translocates to the nucleus, where it blocks cell
                             survival pathways by inhibiting transcriptional regulators such as NF-κB [14,15].
                                   Intrinsically disordered proteins (IDPs) or intrinsically disordered protein regions
                             (IDPRs) possess specific features such as a high percentage of charged residues and a
                             low percentage of hydrophobic amino acids [16–18]. These exceptional characteristics
                             lead to a disordered conformation under typical physiological conditions [19]. A number
                             of environmental factors can, however, influence the folding of these proteins including
                             temperature, pH, ionic strength, post-translational modification including both phosphory-
                             lation and targeted cleavage by proteases, and interaction with natural ligands or protein
                             partners [16,20,21]. Significant evidence has arisen showing enhanced folding of IDPs
                             with increased ion concentration and ionic charge density, though unfolding can also be
                             triggered by the same factors [22].
                                   We have previously shown that high levels of sodium chloride or acidic pH can induce
                             the cl-Par-4 fragment to form highly compact, highly helical structures in vitro, at high
                             micromolar protein concentrations [23,24]. The ionic conditions required to favor these
                             small, well-folded particles are outside of the range of conditions normally found in cells.
                             This led to the hypothesis that multiple factors, including multiple ion types, may combine
                             forces to influence Par-4 conformation. To begin to test this hypothesis, we here have
                             examined and compared the structural characteristics of cl-Par-4 as a function of sodium
                             chloride, potassium chloride, magnesium chloride, and magnesium sulfate concentration.
                             The results shed light on the role of cations versus anions, their charge densities, and also
                             on the role of the caspase-induced cleavage event that produces cl-Par-4, in influencing
                             Par-4 structure, and subsequently, Par-4 localization and function.

                             2. Materials and Methods
                             2.1. Expression and Purification of cl-Par-4
                                  BL21 (DE3) Escherichia coli cells transfected with a codon-optimized construct of cl-
                             Par-4 in the modified expression vector H-MBP-3C [25] were grown in Luria-Bertani (LB)
                             media with 100 µg/mL ampicillin at 37 ◦ C until an OD600 of 0.8–0.9 was reached. The cells
                             were then induced for protein expression with the addition of 0.5 mM isopropyl thio-β-D-
                             galactoside (IPTG) and grown at 15 ◦ C until OD600 reached 1.5–1.6. The harvested cells were
                             lysed by a combination of mechanical (sonication) and enzymatic (lysozyme) methods and
                             extracted protein was purified with immobilized metal affinity chromatography (IMAC)
                             using a HisTrap HP 5 mL column (GE Healthcare, Uppsala, Sweden). The His-MBP tag
                             was cleaved from cl-Par-4 by treating the protein with the His-tagged 3C-protease enzyme.
                             The purified protein was then further dialyzed against the storage buffer (10 mM Tris,
                             1 M NaCl, 1 mM TCEP, pH 7.0) and concentrated by centrifugation using a 10 kDa MWCO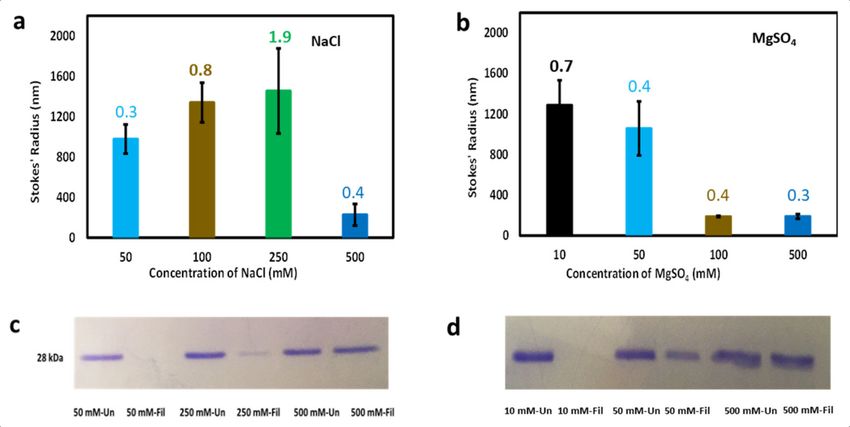
Biomolecules 2021, 11, 386                                                                                         3 of 13

                             Vivaspin Turbo 15 (Sartorius, Epsom, UK). The protein concentration was determined by
                             taking absorbance readings at 280 nm using a BioDrop DUO (BioDrop Ltd., Cambridge,
                             UK) and the theoretical extinction coefficient of 6400 M−1 cm−1 . The protein was finally
                             lyophilized using a FreeZone Freeze Dryer (LABCONCO Corporation, Kansas City, MO,
                             USA), stored at −80 ◦ C, and re-solubilized in sterile distilled water when required. In our
                             experience, in vitro CD and DLS data obtained with cl-Par-4 samples prepared, lyophilized,
                             and redissolved as described above were indistinguishable from data obtained with fresh
                             (never lyophilized) samples.

                             2.2. Circular Dichroism Spectroscopy
                                   Circular dichroism (CD) spectra of the protein were obtained on a J-815 CD spectrome-
                             ter (Jasco, Easton, MD, USA). The cl-Par-4 samples were at a concentration of 0.2 mg/mL in
                             Tris-HCl buffer (10 mM Tris, 1 mM DTT, pH 7.0) with varying concentrations of monovalent
                             and divalent cations present (10–1000 mM). Each cl-Par-4 sample used for CD spectroscopy
                             contained 40 mM NaCl as a residual due to the dilution from the storage buffer (10 mM
                             Tris, 1 mM TCEP, and 1 M NaCl, pH 7.0). For the filtered samples, sample preparation
                             was identical except for the filtration of the sample through a 0.45-micron Nalgene SFCA
                             membrane syringe filter (Thermo Fisher Scientific, Rochester, NY, USA) immediately prior
                             to CD spectroscopy. For the centrifuged samples, sample preparation was identical except
                             that samples were centrifuged for 5 min at 10,000 RPM (9615× g) using a Sorvall Legend
                             Micro 21R Centrifuge (Thermo Fisher Scientific, Germany), and the supernatant was used
                             for the CD spectroscopy. CD data were recorded over a 400–190 nm wavelength range at a
                             scan speed of 20 nm/min using a 1 mm pathlength quartz cuvettes at 25 ◦ C. A buffer blank
                             was subtracted from the spectra, which were then smoothed using a means-movement
                             function of 25 nm and converted to molar ellipticity The deconvolution of CD spectra for
                             estimation of secondary structure content was done using the SELCON3 algorithm through
                             the DichroWeb server [26].

                             2.3. Dynamic Light Scattering
                                  Dynamic light scattering (DLS) data were recorded using a NanoBrook Omni particle
                             sizer and zeta potential analyzer (Brookhaven Instruments Corporation, Holtsville, NY,
                             USA). Protein samples were at a concentration of 0.2 mg/mL in Tris buffer (10 mM Tris,
                             1 mM DTT, pH 7.0) with varying concentrations of monovalent and divalent cations
                             (10–1000 mM). Filtered and centrifuged samples were prepared as described above. The
                             data were recorded at 25 ◦ C using a standard diode laser at 640 nm wavelength, scattering
                             angle of 173◦ , and plastic cuvettes of 1 cm pathlength. Five scans were recorded for each
                             sample and hydrodynamic radii (Stokes’ radii) were calculated from the mean effective
                             diameter obtained from the summary statistical report of the NanoBrook software.

                             2.4. SDS-PAGE
                                   Sodium dodecyl sulfate-polyacrylamide gel electrophoresis (SDS-PAGE) gels of 4–12%
                             were prepared using a gel casting system (Bio-Rad Laboratories, Inc., Irvine, CA, USA).
                             Filtered samples were prepared as mentioned above. The samples, each containing initially
                             0.2 mg/mL of the protein (filtered samples contained less protein), were prepared for
                             loading by combining 16 µL of each sample with 4 µL of 5× sample loading dye, mixed
                             well, and heated at 90 ◦ C for 2 min. Next, 20 µL of each sample was loaded into separate
                             wells in the gel. The gels were run in 1× SDS-PAGE buffer (Tris base, glycine, SDS, and
                             water) using the PowerPac Basic device (Bio-Rad Laboratories, Inc., Irvine, CA, USA) for
                             20 min with a low voltage of 50 V and then 60 min with a high voltage of 150 V. The gels
                             were then stained for 5 h in Coomassie stain (0.2% R-250, 7.5% acetic acid, 50% ethanol and
                             water) and de-stained overnight in de-staining solution (7.5% acetic acid, 50% ethanol, and
                             water). Visualization of the gel was done on a white lightbox.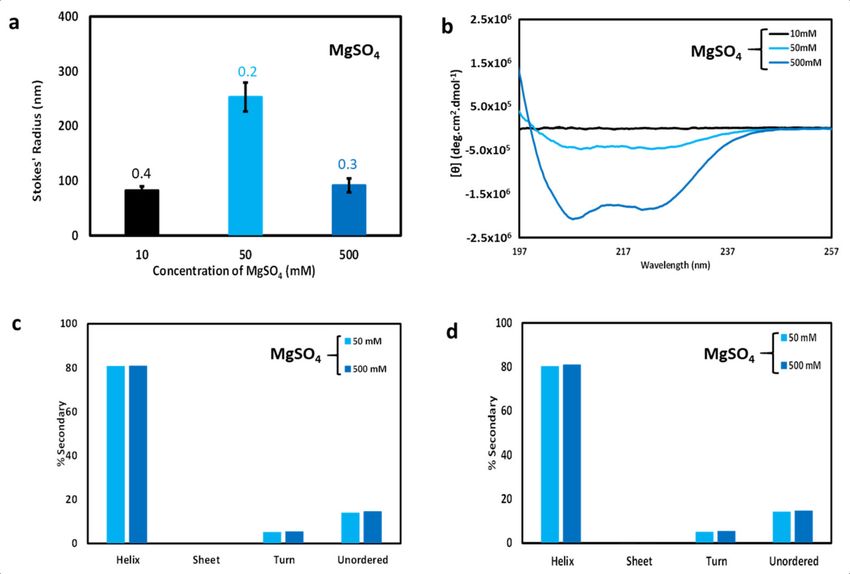
Biomolecules 2021, 11, 386                                                                                                 4 of 13

                             3. Results
                             3.1. Disorder Prediction in cl-Par-4
                                  The cl-Par-4 fragment is the functionally active fragment of the Par-4 protein that enters
                             the nucleus. This region of the protein can be further subdivided as follows: (Figure 1a):
                             the SAC (Selective for Apoptosis induction in Cancer cells) domain, the CC (Coiled-Coil)
                             domain, and the Linker between these two domains. In addition, the SAC domain contains
                             an NLS (Nuclear Localization Signal) near its N-terminus, and the CC domain contains an
                             LZ (Leucine Zipper) domain which comprises its C-terminal half [23]. Prediction of disorder
                             in these domains was done by using DISOPRED3, which utilizes X-ray diffraction databases
                             (Figure 1b) [27,28]. Considering a probability of 0.5 (dashed line) as the demarcation line,
                             the analysis clearly predicts order in the CC domain and disorder in the Linker, while the
                             SAC domain has intermediate character, approaching the order/disorder line. Previous
                             sequence analysis also showed mixed order/disorder propensity and some helical character
                             in the SAC domain, and so order in the SAC domain would not be surprising, under the
                             right conditions [23].

                             Figure 1. (a) Schematic diagram showing domains of cleaved Par-4 protein (cl-Par-4) and (b) Disorder
                             prediction in cl-Par-4 using DISOPRED3.

                             3.2. Differential Effect of Monovalent & Divalent Ions on the Structure of cl-Par-4
                                  We have previously shown that at a high NaCl concentration, cl-Par-4 forms a highly
                             helical tetramer with mostly non-coiled coil helices [24]. Here, we investigated the effects
                             of high levels of a different monovalent cation (potassium), with a different size and charge
                             density. The relative effects of NaCl and KCl on CD spectra of cl-Par-4 are shown in
                             Figure 2a. All cl-Par-4 samples were at a concentration of 0.2 mg/mL in Tris-buffer of
                             pH 7.0 containing various concentrations of either NaCl or KCl.
                                  At a 500 mM salt concentration, CD spectra were characteristic of α-helical content
                             with intense dichroism minima at 222 nm and 208 nm [29,30]. At lower salt concentrations,
                             the intensity of the CD spectra was reduced, which will be discussed further in Section 3.4.
                             At all concentrations, the effect of Na vs. K cations appeared to be similar.
                                  For isolated alpha-helices, an intensity ratio of greater than 1 for the two minima at
                             θ222 and θ208 indicates coiled-coil formation [24,29,31]. By these criteria, it appears that the
                             500 mM salt sample did not form a significant coiled-coil, but that the lower salt samples
                             may. An alternative interpretation of conformation at low and medium salt concentrations
                             is presented in the discussion section.
                                  The effects of the divalent cation magnesium on the structural conformation of cl-Par-4
                             were also investigated via CD spectroscopy. Sample preparation was similar to above,
                             but with various concentrations of MgSO4 instead of NaCl or KCl. CD spectra (Figure 2b)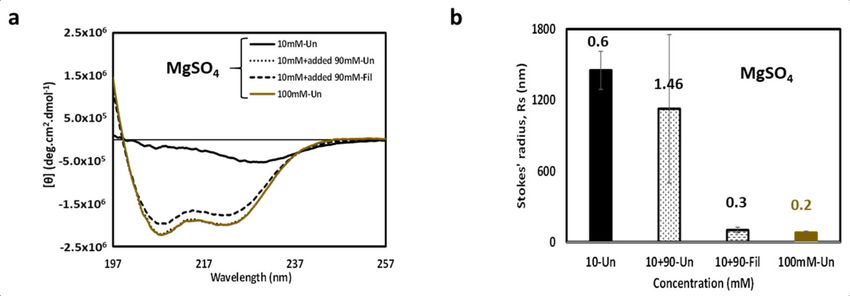
Biomolecules 2021, 11, 386                                                                                                   5 of 13

                             showed a similar trend as obtained with monovalent cations, with higher intensity at
                             higher salt concentration. Again, the θ222 : θ208 ratio suggests little coiled-coil formation at
                             high salt concentration and the possibility of coiled-coil at low salt concentration.
                                   However, the most striking difference between monovalent and divalent cation salt
                             samples was in the concentrations of demarcation: all samples with 75 mM and higher
                             MgSO4 showed similar, intense, highly helical but non-coiled coil CD spectra, whereas
                             only the 500 mM monovalent salt samples produced such a result. Intermediate spectra
                             occurred for 50 mM MgSO4 , while analogous intermediate spectra occurred at a much
                             higher monovalent salt concentration of 250 mM NaCl or KCl. The effects of MgSO4 and
                             KCl are directly compared in Figure 2c. These results suggest that the divalent magnesium
                             cation is five or more times as effective as monovalent cations in influencing the structure
                             of cl-Par-4.
                                   Next, the effect of monovalent versus divalent anions on the structure of cl-Par-4
                             was investigated by comparing samples prepared with MgSO4 versus MgCl2 . The results
                             showed little difference between like concentrations of MgSO4 and MgCl2 (Figure 2d),
                             suggesting that cation identity exerts a far greater influence on cl-Par-4 structure than does
                             anion identity.

                             Figure 2. Overlay of circular dichroism (CD) spectra of cl-Par-4 at various concentrations of the
                             following salts: (a) NaCl (solid lines) and KCl (dashed lines); (b) MgSO4 ; (c) MgSO4 (solid lines) and
                             KCl (dashed lines); (d) MgSO4 (solid lines) and MgCl2 (dashed lines). The salt concentrations are
                             indicated by the color legend within each panel. All spectra were recorded at pH 7.0.

                             3.3. Effect of Monovalent & Divalent Ions on Hydrodynamic Size of cl-Par-4
                                  The size of protein molecules in solution (hydrodynamic size) provides information
                             about conformation. Small size indicates a compact and well-folded conformation whereas
                             large size indicates a highly self-associated, or aggregated conformation, that may or may
                             not also be significantly disordered. The hydrodynamic size distribution of cl-Par-4 was
                             investigated using dynamic light scattering (DLS). Sample preparation was similar to above,
                             but with the following concentrations of NaCl: 50, 100, 250, and 500 mM or MgSO4 : 10, 50,
                             100, and 500 mM. The result showed relatively small particles (Stokes’ radius, Rs ≈ 200 nm)
                             in the sample with 500 mM of NaCl (Figure 3a). The observed hydrodynamic sizes were
                             significantly larger (Rs ≈ 1000 nm) at the three lower NaCl concentrations (50, 100, and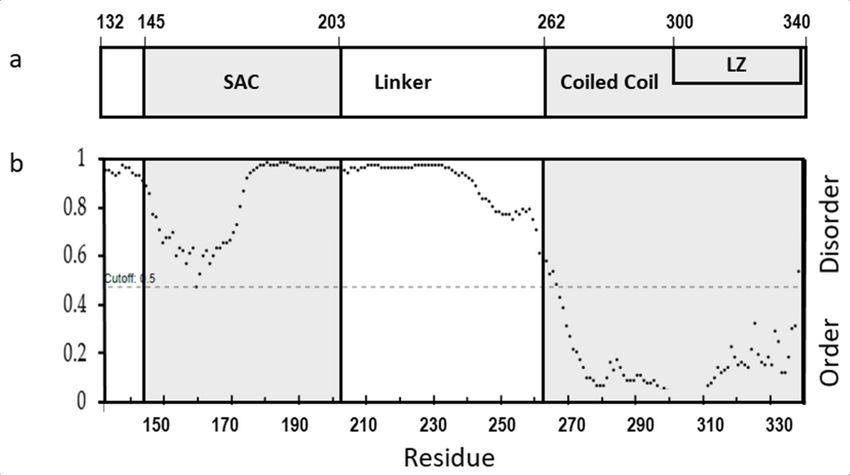
Biomolecules 2021, 11, 386                                                                                                 6 of 13

                             250 mM), indicating the presence of large aggregates. The polydispersity values associated
                             with DLS measurements (see numbers above bars in Figure 3a) correlate strongly with
                             Stokes’ radii, indicating that in general, samples with larger particles also contain a broader
                             range of particle sizes.
                                    A similar trend of smaller particle size at higher salt was observed in the presence
                             of MgSO4 (Figure 3b). However, the transition between small (Rs ≈ 200 nm) and large
                             (Rs ≈ 1000 nm) particles apparently occurs somewhere between MgSO4 concentrations of
                             50 mM and 100 mM, suggesting that the divalent magnesium ion is approximately five
                             times more potent than the monovalent cation in influencing cl-Par-4 particle size. Again,
                             the largest Stokes’ radii (at 10 mM MgSO4 ) were associated with the broadest range of
                             particle sizes, as shown by polydispersity measurements in Figure 3b. However, in general,
                             less polydispersity was seen in the MgSO4 samples than in the NaCl samples, indicating
                             that even when large particles were present, magnesium induced a more uniform particle
                             size than did sodium.
                                    Note that large particle size as detected by DLS (Figure 3a,b) corresponded closely
                             with reduced CD intensity (Figure 2a,b). However, the correspondence was not perfect.
                             In particular, note that DLS detected similar particle sizes at 50, 100, and 250 mM NaCl
                             (Figure 3a), but that 250 mM monovalent salt produced a significantly higher dichroism
                             intensity than 50 or 100 mM had (Figure 2a). The MgSO4 data was more self-consistent, but
                             still not perfectly so, particularly at 50 mM (see Figures 2b and 3b). This inconsistency with
                             the intermediate concentrations of both monovalent and divalent cations could be due to
                             the fact that scattering is highly sensitive to the largest particles in solution. The result was
                             consistent with the concept that the largest particles were as shown in Figure 3a,b, but that
                             more of these large particles form at lower salt concentrations, which resulted in more CD
                             signal loss, possibly due at least in part to a smaller effective cross-section being available
                             for CD measurements [32].

                             Figure 3. Particle size analysis of cl-Par-4 as a function of salt concentration. (a) dynamic light
                             scattering (DLS)-derived Stokes’ radii vs. NaCl concentration. (b) DLS-derived Stokes’ radii vs.
                             MgSO4 concentration. (c) SDS-PAGE analysis of samples from panel (a), before and after filtration.
                             (d) SDS-PAGE analysis of samples from panel (b), before and after filtration. In panels (a) and (b),
                             error bars represent the standard deviation in Stokes’ radii from multiple runs, and the number above
                             each bar represents the average polydispersity value for these runs.

                                  Sample filtration was next used to further analyze the relationship between CD
                             spectroscopy and particle size. The fraction of protein removed by filtration was analyzed
                             via SDS-PAGE. For this analysis, 0.2 mg/mL cl-Par-4 samples with low salt (50 mM NaCl or
                             10 mM MgSO4 ), intermediate salt (250 mM NaCl or 50 mM MgSO4 ), and high salt (500 mM
                             NaCl or 500 mM MgSO4 ) were used. Corresponding filtered samples were prepared by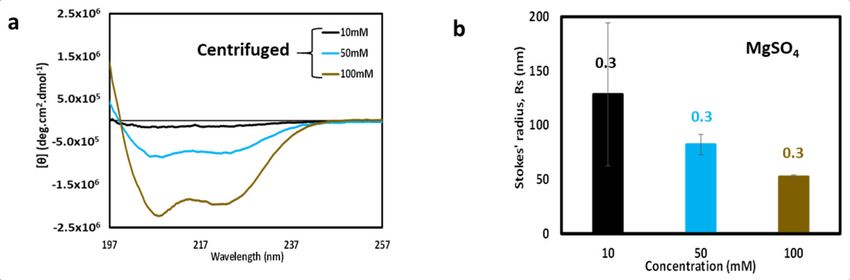
Biomolecules 2021, 11, 386 7 of 13
passing the samples through 0.45-micron filters. The results for NaCl and MgSO4 samples
are shown in Figure 3c,d, respectively. Each of the unfiltered samples showed similar gel
band intensity. After filtration, the bands for low salt samples essentially disappeared,
the bands for medium salt samplers were reduced, and the bands for high salt samples
remained nearly as intense as before filtration. These results are consistent with the concept
that high salt prevents large particle sizes, low salt samples consist almost entirely of large
particles, and intermediate salt produces a mixture of large and small particles. In fact,
Figure 3a seems to indicate that intermediate NaCl concentration produces a small number
of very large particles, that are larger than the largest particles formed at low salt. One
possible explanation for this observation is a sort of slow growth model: in low salt, the
protein may quickly coalesce principally into 1000 nm aggregates that do not aggregate
further, while the aggregates that form at medium salt are surrounded by additional smaller
particles that can continue to be adsorbed by the aggregated particles, ultimately producing
larger particles than seen at low salt. This continuous process would be consistent with the
very high polydispersity observed for the 250 mM NaCl sample.
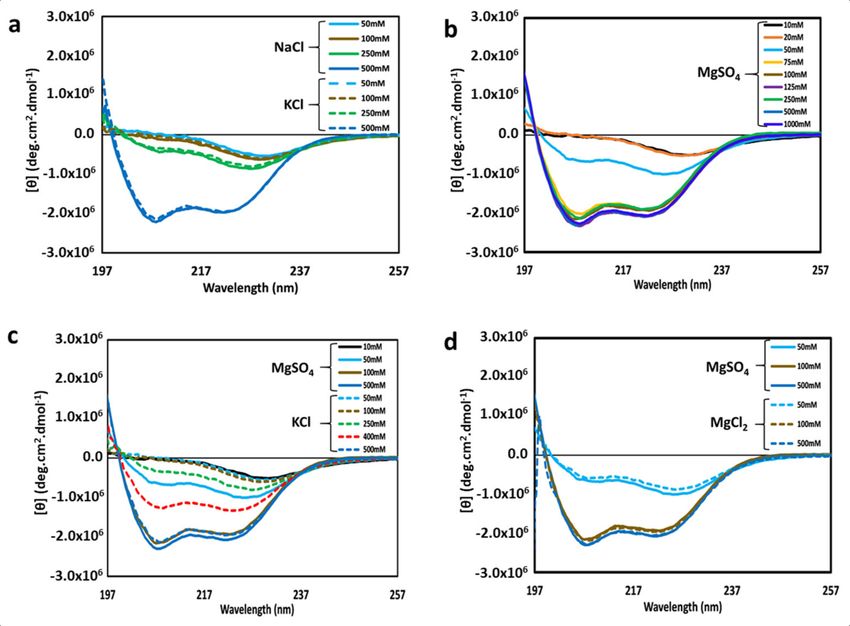
3.4. Effect of Filtration on DLS Measurements, CD Spectroscopy, and Secondary Structure Analysis
To further explore the relationship between particle size and CD spectroscopy, filtered
samples with low, medium, and high divalent cation concentrations (10, 50, and 500 mM
MgSO4 ) were analyzed via DLS and CD spectroscopy. As expected, the hydrodynamic
sizes derived from DLS measurements (Figure 4a) indicated smaller particle sizes relative
to unfiltered samples (Figure 3b), except for the high salt 500 mM sample which predictably
showed little change in particle size upon filtration. However, the filtered intermediate
sample (50 mM MgSO4 ) produced the largest Stokes’ radius. This pattern for the filtered
MgSO4 samples (Figure 4a) now resembles the pattern observed for the unfiltered NaCl
samples (Figure 3a), with intermediate salt producing the largest particles, possibly due to
a similar slow growth mechanism as was discussed in the previous section. Bear in mind,
however, that very few particles of any sort survive filtration at low salt concentration.
CD spectra of the filtered samples are shown in Figure 4b. The filtered low MgSO4
sample predictably produced almost no dichroism, since the sample concentration after
filtration was extremely low. As expected, the high MgSO4 sample produced a CD spectrum
nearly matching the pre-filtered CD spectrum of Figure 2b. The most interesting result was
that for medium MgSO4 (50 mM). Though the intensity was low relative to the filtered
high salt sample, the shape nearly matches that of the high salt sample. This suggests
that, although fewer particles were present in the filtered medium MgSO4 sample (see
Figure 3d), and these particles were of relatively large size (see Figure 4a), the secondary
structure was very similar to that of the particles present in high salt conditions. Thus, the
difference in particle size found in the filtered medium and high salt samples does not
correspond to a significant change in secondary structure. Apparently, cl-Par-4 particles
can self-associate without a large change in secondary structure. However, this analysis
only applies to particles small enough to survive filtration. Unfiltered samples with very
large particles do produce differently shaped CD spectra (Figure 2b, low and medium salt
samples).
Secondary structure analysis was performed via deconvolution of the CD spectra using
the SELCON3 algorithm [26]. Deconvolution of unfiltered and filtered 50 mM and 500 mM
MgSO4 spectra are shown in Figure 4c,d, respectively. The deconvolution program was
unable to distinguish secondary structure differences between high and medium MgSO4
samples, before and after filtration: in each of these four cases, deconvolution suggests
approximately 80% helix, 15% disorder, and 5% beta turn. Deconvolution of the unfiltered
10 mM salt CD spectrum suggested approximately 55% helix, and corresponding increases
in the percentage of beta sheet, beta turn, and disorder. However, scattering by the large
particles present in this sample would be expected to interfere with CD spectroscopy and
hence with spectral deconvolution, and therefore the 10 mM MgSO4 secondary structure
deconvolution is not presented in Figure 4c [33]. Deconvolution of the filtered low salt CDBiomolecules 2021, 11, 386 8 of 13
data was not possible due to lack of sufficient sample surviving filtration (see Figure 4b)
and thus filtered low salt secondary structure is not presented in Figure 4d.
Both the filtered medium and high salt samples produce CD spectra with a θ222 : θ208
ratio less than one. This was consistent with the presence of mostly non-coiled coil helices
in both cases. Note that before filtration, the medium salt sample produced CD spectra with
a θ222 : θ208 ratio greater than one. This result suggests that the large aggregates present in
the mixed-size environment of the unfiltered medium salt sample are responsible for the
shifting of the θ222 : θ208 ratio, and that particles small enough to survive filtration contain
mostly non-coiled coil helices.
Figure 4. Effect of filtration on cl-Par-4 samples as a function of MgSO4 concentration. (a) DLS-
derived Stokes’ radii after filtering. Error bars represent the standard deviation in Stokes’ radii from
multiple runs, and the number above each bar represents the average polydispersity value for these
runs. (b) CD spectra after filtration. (c) Secondary structure analysis via deconvolution of CD spectra
from Figure 2b [unfiltered samples]. (d) Secondary structure analysis via deconvolution of CD spectra
from Figure 4b [filtered samples]. Secondary structure analysis of unfiltered and filtered 10 mM
MgSO4 samples was not possible due to the presence of large particles and low protein concentration,
respectively.
3.5. Effect of Centrifugation and Reintroduction of Salt
To corroborate the results obtained from filtration, parallel experiments were per-
formed by centrifuging the unfiltered samples and collecting the supernatant for CD
analysis. CD spectra obtained from centrifuge supernatant samples are shown in Figure 5a.
By comparison to the data of Figure 4b, it can be seen that filtration and centrifugation
produced a similar effect of removing large aggregates, leaving smaller, highly helical par-
ticles in solution, although fewer particles survived filtration in the case of centrifugation.
DLS analysis of the centrifuged samples used for the CD spectra in Figure 5a is shown in
Figure 5b. The Stokes’ radii of each of the centrifuged samples confirm that only relatively
small particles survive centrifugation.
Also, to investigate the reversibility of large particle formation by cl-Par-4, 90 MgSO4
was added to low salt (10 mM MgSO4 ) samples. CD analysis showed that the resulting
100 mM MgSO4 spectrum becomes nearly identical to the original 100 mM MgSO4 sample
which had never been at low salt (Figure 6a). Filtering of the resulting sample caused aBiomolecules 2021, 11, 386 9 of 13
small reduction in CD intensity, indicating the presence of a small number of large particles
before filtration.
Figure 5. CD spectra and DLS analysis after centrifugation. (a) Overlay of CD spectra of supernatant
after centrifugation of cl-Par-4 at various concentrations of MgSO4 . The salt concentrations are
indicated by the color legend within the panel. (b) Corresponding DLS of samples from panel (a).
Error bars represent the standard deviation in Stokes’ radii from multiple runs, and the number
above each bar represents the average polydispersity value for these runs.
Figure 6. CD spectra and DLS analysis after reintroduction of salt. (a) 10 mM MgSO4 sample (solid
black line) shows signs of large species formation (loss of signal); This signal loss can be eliminated by
increasing the MgSO4 concentration to 100 mM (dotted black line); the resulting spectrum overlaps
nearly perfectly with that of the original 100 mM sample (solid brown line). The dashed black line
represents the slightly reduced CD spectrum of the added MgSO4 sample after filtration to remove
any remaining large particles. (b) Corresponding DLS of samples from panel (a). Error bars represent
the standard deviation in Stokes’ radii from multiple runs, and the number above each bar represents
the average polydispersity value for these runs.
DLS analysis of the samples from Figure 6a is shown in Figure 6b. From left to right,
the large detected Stokes’ radius at 10 mM MgSO4 appeared to become slightly smaller once
90 mM MgSO4 was added, but the large error bar and high polydispersity indicated a wide
range of particle size. After filtration, the Stokes’ radius was much smaller, approaching
that of the sample that had never been at low salt. The fact that filtration had a much larger
effect on the DLS result than on the CD result indicates that the reconstituted 100 mM
MgSO4 sample contained a small number of large particles that dominate the scattering.
Removal of the large particles by filtration revealed that most particles were small under
these conditions.
3.6. Time-Dependent Characteristics of cl-Par-4 Samples
To further explore the possibility of dynamic equilibrium, time course CD spectroscopy
experiments (Figure 7) were performed with samples at an intermediate salt concentration
(50 mM MgSO4 ). The spectra in Figure 7a,b were performed with a sample that had been
filtered on day 1. The shape of the CD spectra of the filtered sample changed relatively
little over a seven-day period (see Figure 7a), suggesting that the sample does not rapidlyBiomolecules 2021, 11, 386 10 of 13
aggregate over time. However, there is some loss of intensity, suggesting either sample
loss or the formation of a small number of aggregates. DLS results showed that particle
sizes remained relatively small over the time course (Figure 7b), thus indicating that loss of
CD intensity was most likely due primarily to sample loss.
The change in the unfiltered 50 mM MgSO4 sample with time was more pronounced.
The CD spectrum (Figure 7c) changed shape to resemble the filtered sample by day 3.
This suggests that large particles may be lost from the unfiltered sample relatively quickly,
either due to dispersion into smaller particles or via settling or adhering to the sample
container. Since the intensity did not increase with time, the latter mechanism of removal
by settling/adherence appeared dominant, but both mechanisms may be in play. DLS
results (Figure 7d) showed a significant increase in measured Stokes’ radius and dispersity
until day 5, and then a reduction in size and dispersity on day 7. The maximum particle
size, to which DLS is sensitive, remained relatively large throughout the time course,
indicating that aggregates were present throughout. However, since the CD spectra
(Figure 7c) converted over time to a shape consistent with that displayed by smaller
helical particles, the combined results seems to indicate that a small number of large
particles remain over time, sufficient to influence the DLS results, but not sufficient to
affect the CD spectra. The overarching result is that unfiltered, filtered, and centrifuged
samples converge overtime to produce similarly shaped CD spectra indicative of highly
helical particles. Taken together, these data are consistent with the presence of a dynamic
equilibrium between small and large particles, which readjusts the following filtration, and
is affected by settling/adherence.
Figure 7. Time-dependence of cl-Par-4 in the presence of 50 mM MgSO4 . (a) Overlay of CD spectra
obtained over a seven-day time course. Sample was filtered on day 1 prior to the first spectrum.
(b) DLS analysis of sample from panel (a). (c) Overlay of CD spectra obtained over a seven-day
time course. Sample was NOT filtered. (d) DLS analysis of sample from panel (c). In panels (b) and
(d), error bars represent the standard deviation in Stokes’ radii from multiple runs, and the number
above each bar represents the average polydispersity value for these runs.
4. Discussion
Full-length Par-4 (FL-Par-4) has been shown to be a largely intrinsically disordered
protein (IDP) in vitro: CD spectroscopy and other techniques have previously been used toBiomolecules 2021, 11, 386 11 of 13
show that the C-terminal coiled-coil folds in FL-Par-4, while a large majority of the remain-
der of the protein maintains a disordered state under neutral conditions [34]. Caspase-3-
induced cleavage of FL-Par-4 to form the N-terminal 15 kilodalton PAF fragment and the
C-terminal 25 kilodalton cl-Par-4 fragment is necessary for the migration of cl-Par-4 to the
nucleus, where it inhibits NF-κB-mediated cell survival pathways [13,14]. The PAF frag-
ment has been shown to function as a decoy that protects FL-Par-4 from ubiquitin-mediated
degradation [35].
We have previously shown that cl-Par-4 forms small, well-folded particles with ap-
proximately 80% helical content under either high sodium or low pH conditions [23,24].
There are differences, however. High sodium results in a tetramer conformation with a
Stokes’ radius of approximately 100 nm, in which a significant portion of the helical content
is not coiled coil. In contrast, acidic pH results in particles of a smaller size (approximately
50 nm Stokes’ radius), suggestive of a dimer, which does display coiled-coil character. Here
we have shown that potassium and sodium have similar effects on cl-Par-4 structure (see
Figure 2a). Thus, we can state that highly helical, significantly non-coiled particles, consis-
tent with the Stokes’ radius of a tetramer, are also formed at high potassium concentration.
This is a potentially meaningful finding, since potassium levels are higher inside of cells
(of the order of 100 mM vs. 10 mM inside vs. outside cells), and sodium levels are higher
extracellularly (of the order of 10mM and 100 mM inside vs. outside cells) [36,37]. This
result suggests that cl-Par-4, which is found both intra- and extra-cellularly, may behave
conformationally similarly inside and outside of the cell.
The amount of sodium or potassium necessary to induce the formation of these
small helical particles appears to be higher than is typically encountered within either
mammalian cellular or extra-cellular environments. In part for this reason, we investigated
whether divalent cations could more efficiently induce this conformation. The results
herein show that this is indeed the case, with 100 mM MgSO4 inducing the formation
of relatively small, highly helical particles, at concentrations approximately five times
lower than the required concentrations of sodium or potassium (see Figures 2c and 3a,b).
Together with previously published data identifying the conformation at high sodium
concentration as a tetramer [24], this strongly suggests that tetramer is formed at the
100 mM MgSO4 concentration. The nearly identical results between MgSO4 and MgCl2
(see Figure 2d) also show that anion identity is far less important than cation identity
for affecting cl-Par-4 conformation. The required magnesium concentration is still high
relative to typical intra-cellular magnesium levels [36]. However, it has been reported
that apoptosis is accompanied by alteration of cellular ionic conditions, including sodium,
potassium, magnesium, chloride, calcium, and zinc, and changes in pH [36,38–41]. Thus,
the combined effect of a number of factors should be considered, as they may conspire to
affect the conformation of cl-Par-4 and other cellular proteins under less extreme conditions
than are required of any one of these factors. Furthermore, the techniques employed in
these studies require high micromolar protein concentration. Since in vivo cl-Par-4 levels
will not reach high micromolar concentrations, cl-Par-4 should be less prone to aggregate
and may not require as high ionic strength in order to form small, well-folded particles
in vivo.
In support of this view, the present analysis of CD data, DLS data including poly-
dispersity values, sample filtration, and gel electrophoresis, has shown that a mixture of
particle sizes are present under various conditions. For intermediate conditions, large par-
ticles can be removed by filtration or centrifugation, and sufficient small particles remain
for secondary structure analysis. These particles, which are sufficiently small to survive
filtration, apparently have a secondary structure that resembles that of the small particles
found at high salt (see Figure 4b). Thus, cl-Par-4 clearly can form highly helical structures
under both low and medium salt conditions. This is at least true for particles that are not
highly aggregated. Secondary structure analysis of the larger aggregates is complicated by
the effects of scattering and will be discussed in more detail elsewhere.Biomolecules 2021, 11, 386 12 of 13
As mentioned, approximately 80% helicity is observed in the small cl-Par-4 particles
induced by sodium, potassium, or magnesium. The coiled-coil domain comprises only 38%
of the cl-Par-4 sequence (see Figure 1a), thus additional helical regions are clearly present.
Sequence analysis shows that the SAC domain, which comprises 28% of cl-Par-4, has the
next highest order propensity (see Figure 1b). The linker domain has the highest disorder
propensity. This strongly suggests that both the CC domain and at least a significant fraction
of the SAC domain are helical in cl-Par-4 under these conditions. Previous biophysical
analysis of FL-Par-4 provided no such evidence of folding of the SAC domain in the full-
length protein [34] and suggested that the helical content in FL-Par-4 is largely coiled-coil
in nature. Thus, cleavage of Par-4 by caspase-3 may be important both for altering the SAC
domain conformation, and for influencing the self-association characteristics, including
helical coiling, of the cl-Par-4 fragment in comparison to FL-Par-4. These two effects may in
fact be correlated. It remains to be seen how conformational and self-association changes
upon caspase-induced cleavage may be related to controlling the role of Par-4 in apoptotic
processes.
Author Contributions: Conceptualization, S.M.P.; methodology, K.K.R. and S.M.P.; formal analysis,
K.K.R. and S.M.P.; investigation, K.K.R., K.P. and S.M.P.; resources, S.M.P.; writing—original draft
preparation, K.K.R.; writing—review and editing, S.M.P. and K.K.R.; visualization, K.K.R. and S.M.P.;
supervision, S.M.P.; project administration, S.M.P.; funding acquisition, S.M.P. All authors have read
and agreed to the published version of the manuscript.
Funding: This research was supported by internal funds from Old Dominion University.
Institutional Review Board Statement: Not applicable.
Informed Consent Statement: Not applicable.
Acknowledgments: We wish to acknowledge Vivek Rangnekar for useful discussions regarding
Par-4 function.
Conflicts of Interest: The authors declare no conflict of interest.
References
1. El-Guendy, N.; Zhao, Y.; Gurumurthy, S.; Burikhanov, R.; Rangnekar, V.M. Identification of a Unique Core Domain of Par-4
Sufficient for Selective Apoptosis Induction in Cancer Cells. Mol. Cell Biol. 2003, 23, 5516–5525. [CrossRef]
2. Rangnekar, V.M. Apoptosis by par-4 protein. In Advances in Cell Aging and Gerontology; Elsevier: Amsterdam, The Netherlands,
2001; pp. 215–236.
3. Boghaert, E.R.; Sells, S.F.; Walid, A.J.; Malone, P.; Williams, N.M.; Weinstein, M.H.; Strange, R.; Rangnekar, V.M. Immunohisto-
chemical analysis of the proapoptotic protein Par-4 in normal rat tissues. Cell Growth Differ. 1997, 8, 881–890.
4. Gurumurthy, S.; Goswami, A.; Vasudevan, K.M.; Rangnekar, V.M. Phosphorylation of Par-4 by protein kinase A is critical for
apoptosis. Mol. Cell Biol. 2005, 25, 1146–1161.
5. Rasool, R.U.; Nayak, D.; Chakraborty, S.; Katoch, A.; Faheem, M.M.; Amin, H.; Goswami, A. A journey beyond apoptosis: New
enigma of controlling metastasis by pro-apoptotic Par-4. Clin. Exp. Metastasis 2016, 33, 757–764. [CrossRef] [PubMed]
6. Johnstone, R.W.; Tommerup, N.; Hansen, C.; Vissing, H.; Shi, Y. Mapping of the human PAWR (par-4) gene to chromosome 12q21.
Genomics 1998, 53, 241–243. [CrossRef] [PubMed]
7. Treude, F.; Kappes, F.; Fahrenkamp, D.; Muller-Newen, G.; Dajas-Bailador, F.; Kramer, O.H.; Luscher, B.; Hartkamp, J. Caspase-8-
mediated PAR-4 cleavage is required for TNFalpha-induced apoptosis. Oncotarget 2014, 5, 2988–2998. [CrossRef] [PubMed]
8. Thayyullathil, F.; Pallichankandy, S.; Rahman, A.; Kizhakkayil, J.; Chathoth, S.; Patel, M.; Galadari, S. Caspase-3 mediated release
of SAC domain containing fragment from Par-4 is necessary for the sphingosine-induced apoptosis in Jurkat cells. J. Mol. Signal.
2013, 8, 2. [CrossRef] [PubMed]
9. El-Guendy, N.; Rangnekar, V.M. Apoptosis by Par-4 in cancer and neurodegenerative diseases. Exp. Cell Res. 2003, 283, 51–66.
[CrossRef]
10. Burikhanov, R.; Zhao, Y.; Goswami, A.; Qiu, S.; Schwarze, S.R.; Rangnekar, V.M. The tumor suppressor Par-4 activates an extrinsic
pathway for apoptosis. Cell 2009, 138, 377–388. [CrossRef] [PubMed]
11. Hebbar, N.; Wang, C.; Rangnekar, V.M. Mechanisms of apoptosis by the tumor suppressor Par-4. J. Cell Physiol. 2012, 227,
3715–3721. [CrossRef]
12. de Thonel, A.; Hazoumé, A.; Kochin, V.; Isoniemi, K.; Jego, G.; Fourmaux, E.; Hammann, A.; Mjahed, H.; Filhol, O.; Micheau, O.;
et al. Regulation of the proapoptotic functions of prostate apoptosis response-4 (Par-4) by casein kinase 2 in prostate cancer cells.
Cell Death Dis. 2014, 5, e1016. [CrossRef]Biomolecules 2021, 11, 386 13 of 13
13. Chaudhry, P.; Singh, M.; Parent, S.; Asselin, E. Prostate apoptosis response 4 (Par-4), a novel substrate of caspase-3 during
apoptosis activation. Mol. Cell Biol. 2012, 32, 826–839. [CrossRef] [PubMed]
14. Diaz-Meco, M.T.; Lallena, M.J.; Monjas, A.; Frutos, S.; Moscat, J. Inactivation of the inhibitory kappaB protein kinase/nuclear
factor kappaB pathway by Par-4 expression potentiates tumor necrosis factor alpha-induced apoptosis. J. Biol. Chem. 1999, 274,
19606–19612. [CrossRef] [PubMed]
15. Shrestha-Bhattarai, T.; Rangnekar, V.M. Cancer-selective apoptotic effects of extracellular and intracellular Par-4. Oncogene 2010,
29, 3873–3880. [CrossRef] [PubMed]
16. Uversky, V.N. Intrinsically Disordered Proteins and Their “Mysterious” (Meta)Physics. Front. Phys. 2019, 7, 10. [CrossRef]
17. Wright, P.E.; Dyson, H.J. Intrinsically disordered proteins in cellular signalling and regulation. Nat. Rev. Mol. Cell Biol. 2015, 16,
18–29. [CrossRef]
18. Dyson, H.J.; Wright, P.E. Intrinsically unstructured proteins and their functions. Nat. Rev. Mol. Cell Biol. 2005, 6, 197–208.
[CrossRef]
19. Uversky, V.N.; Gillespie, J.R.; Fink, A.L. Why are “natively unfolded” proteins unstructured under physiologic conditions?
Proteins 2000, 41, 415–427. [CrossRef]
20. Uversky, V.N. What does it mean to be natively unfolded? Eur. J. Biochem. 2002, 269, 2–12. [CrossRef]
21. Uversky, V.N. Intrinsically disordered proteins and their environment: Effects of strong denaturants, temperature, pH, counter
ions, membranes, binding partners, osmolytes, and macromolecular crowding. Protein J. 2009, 28, 305–325. [CrossRef]
22. Wicky, B.I.M.; Shammas, S.L.; Clarke, J. Affinity of IDPs to their targets is modulated by ion-specific changes in kinetics and
residual structure. Proc. Natl. Acad. Sci. USA. 2017, 114, 9882–9887. [CrossRef] [PubMed]
23. Clark, A.M.; Ponniah, K.; Warden, M.S.; Raitt, E.M.; Yawn, A.C.; Pascal, S.M. pH-Induced Folding of the Caspase-Cleaved
Par-4 Tumor Suppressor: Evidence of Structure Outside of the Coiled Coil Domain. Biomolecules 2018, 8, 4060–4073. [CrossRef]
[PubMed]
24. Clark, A.M.; Ponniah, K.; Warden, M.S.; Raitt, E.M.; Smith, B.G.; Pascal, S.M. Tetramer formation by the caspase-activated
fragment of the Par-4 tumor suppressor. FEBS J. 2019, 286, 4060–4073. [CrossRef]
25. Alexandrov, A.; Dutta, K.; Pascal, S.M. MBP fusion protein with a viral protease cleavage site: One-step cleavage/purification of
insoluble proteins. Biotechniques 2001, 30, 1194–1198. [CrossRef]
26. Whitmore, L.; Wallace, B.A. DICHROWEB, an online server for protein secondary structure analyses from circular dichroism
spectroscopic data. Nucleic Acids Res. 2004, 32, W668–W673. [CrossRef] [PubMed]
27. Ward, J.J.; McGuffin, L.J.; Bryson, K.; Buxton, B.F.; Jones, D.T. The DISOPRED server for the prediction of protein disorder.
Bioinformatics 2004, 20, 2138–2139. [CrossRef]
28. Jones, D.T.; Cozzetto, D. DISOPRED3: Precise disordered region predictions with annotated protein-binding activity. Bioinformatics
2014, 31, 857–863. [CrossRef]
29. Wuo, M.G.; Mahon, A.B.; Arora, P.S. An Effective Strategy for Stabilizing Minimal Coiled Coil Mimetics. J. Am. Chem. Soc. 2015,
137, 11618–11621. [CrossRef]
30. Kallenbach, N.R.; Lyu, P.; Zhou, H. CD Spectroscopy and the Helix-Coil Transition in Peptides and Polypeptides. In Circular
Dichroism and the Conformational Analysis of Biomolecules; Fasman, G.D., Ed.; Springer: Boston, MA, USA, 1996; pp. 201–259.
31. Cooper, T.M.; Woody, R.W. The effect of conformation on the CD of interacting helices: A theoretical study of tropomyosin.
Biopolymers 1990, 30, 657–676. [CrossRef]
32. Wallace, B.A.; Mao, D. Circular dichroism analyses of membrane proteins: An examination of differential light scattering and
absorption flattening effects in large membrane vesicles and membrane sheets. Anal. Biochem. 1984, 142, 317–328. [CrossRef]
33. Kelly, S.M.; Jess, T.J.; Price, N.C. How to study proteins by circular dichroism. Biochim. Biophys. Acta Proteins Proteom. 2005, 1751,
119–139. [CrossRef] [PubMed]
34. Libich, D.S.; Schwalbe, M.; Kate, S.; Venugopal, H.; Claridge, J.K.; Edwards, P.J.B.; Dutta, K.; Pascal, S.M. Intrinsic disorder and
coiled-coil formation in prostate apoptosis response factor 4. FEBS J. 2009, 276, 3710–3728. [CrossRef] [PubMed]
35. Hebbar, N.; Burikhanov, R.; Shukla, N.; Qiu, S.; Zhao, Y.; Elenitoba-Johnson, K.S.J.; Rangnekar, V.M. A Naturally Generated
Decoy of the Prostate Apoptosis Response-4 Protein Overcomes Therapy Resistance in Tumors. Cancer Res. 2017, 77, 4039–4050.
[CrossRef]
36. Ishaque, A.; Al-Rubeai, M. Role of Ca2+, Mg2+ and K+ ions in determining apoptosis and extent of suppression afforded by bcl-2
during hybridoma cell culture. Apoptosis 1999, 4, 335–355. [CrossRef] [PubMed]
37. Melkikh, A.V.; Sutormina, M.I. Model of active transport of ions in cardiac cell. J. Theor. Biol. 2008, 252, 247–254. [CrossRef]
38. Pilchova, I.; Klacanova, K.; Tatarkova, Z.; Kaplan, P.; Racay, P. The Involvement of Mg(2+) in Regulation of Cellular and
Mitochondrial Functions. Oxid. Med. Cell Longev. 2017, 2017, 6797460. [CrossRef]
39. Franklin, R.B.; Costello, L.C. The important role of the apoptotic effects of zinc in the development of cancers. J. Cell Biochem.
2009, 106, 750–757. [CrossRef]
40. Bortner, C.D.; Cidlowski, J.A. Ion channels and apoptosis in cancer. Philos. Trans. R Soc. B 2014, 369, 20130104. [CrossRef]
41. Lang, F.; Föller, M.; Lang, K.S.; Lang, P.A.; Ritter, M.; Gulbins, E.; Vereninov, A.; Huber, S.M. Ion Channels in Cell Proliferation
and Apoptotic Cell Death. J. Membr. Biol. 2005, 205, 147–157. [CrossRef]You can also read