Premature Vascular Aging with Features of Plaque Vulnerability in an Atheroprone Mouse Model of Hutchinson-Gilford Progeria Syndrome with Ldlr ...
←
→
Page content transcription
If your browser does not render page correctly, please read the page content below
cells
Article
Premature Vascular Aging with Features of Plaque
Vulnerability in an Atheroprone Mouse Model of
Hutchinson–Gilford Progeria Syndrome with
Ldlr Deficiency
Rosa M. Nevado 1,2,† , Magda R. Hamczyk 1,2,3,† , Pilar Gonzalo 1,2 ,
María Jesús Andrés-Manzano 1,2 and Vicente Andrés 1,2, *
 1    Centro Nacional de Investigaciones Cardiovasculares Carlos III (CNIC), 28029 Madrid, Spain;
      rosamaria.nevado@cnic.es (R.M.N.); pgonzalo@cnic.es (P.G.); mjandres@cnic.es (M.J.A.-M.)
 2    Centro de Investigación Biomédica en Red de Enfermedades Cardiovasculares (CIBERCV),
      28029 Madrid, Spain
 3    Departamento de Bioquímica y Biología Molecular, Instituto Universitario de Oncología (IUOPA),
      Universidad de Oviedo, 33006 Oviedo, Spain; hamczykmagda.uo@uniovi.es
 *    Correspondence: vandres@cnic.es; Tel.: +34-91-453-1200
 †    These authors contributed equally to this work.

 Received: 12 August 2020; Accepted: 4 October 2020; Published: 8 October 2020

 Abstract: Hutchinson–Gilford progeria syndrome (HGPS) is among the most devastating of the
 laminopathies, rare genetic diseases caused by mutations in genes encoding nuclear lamina proteins.
 HGPS patients age prematurely and die in adolescence, typically of atherosclerosis-associated
 complications. The mechanisms of HGPS-related atherosclerosis are not fully understood due to
 the scarcity of patient-derived samples and the availability of only one atheroprone mouse model
 of the disease. Here, we generated a new atherosusceptible model of HGPS by crossing progeroid
 LmnaG609G/G609G mice, which carry a disease-causing mutation in the Lmna gene, with Ldlr−/− mice,
 a commonly used preclinical atherosclerosis model. Ldlr−/− LmnaG609G/G609G mice aged prematurely
 and had reduced body weight and survival. Compared with control mice, Ldlr−/− LmnaG609G/G609G
 mouse aortas showed a higher atherosclerosis burden and structural abnormalities typical of HGPS
 patients, including vascular smooth muscle cell depletion in the media, adventitial thickening,
 and elastin structure alterations. Atheromas of Ldlr−/− LmnaG609G/G609G mice had features of unstable
 plaques, including the presence of erythrocytes and iron deposits and reduced smooth muscle cell
 and collagen content. Ldlr−/− LmnaG609G/G609G mice faithfully recapitulate vascular features found in
 patients and thus provide a new tool for studying the mechanisms of HGPS-related atherosclerosis
 and for testing therapies.

 Keywords: aging; atherosclerosis; lamin A; progeria; vulnerable plaque

1. Introduction
     Lamins are key components of the nuclear envelope that play pivotal roles in maintaining a
proper nuclear structure and function. Mutations in genes encoding lamins lead to a variety of diseases
collectively termed laminopathies, which affect one or multiple tissues, including muscular, cardiac,
adipose, and osseous tissue. One of the more severe laminopathies is Hutchinson–Gilford progeria
syndrome (HGPS), which is caused by progerin, an anomalous variant of lamin A. Progerin arises
via aberrant splicing of LMNA mRNA, typically due to a de novo c.1824C>T;p.G608G mutation [1,2].
Very early in life, HGPS patients begin to show symptoms characteristic of advanced age, including

Cells 2020, 9, 2252; doi:10.3390/cells9102252                                      www.mdpi.com/journal/cells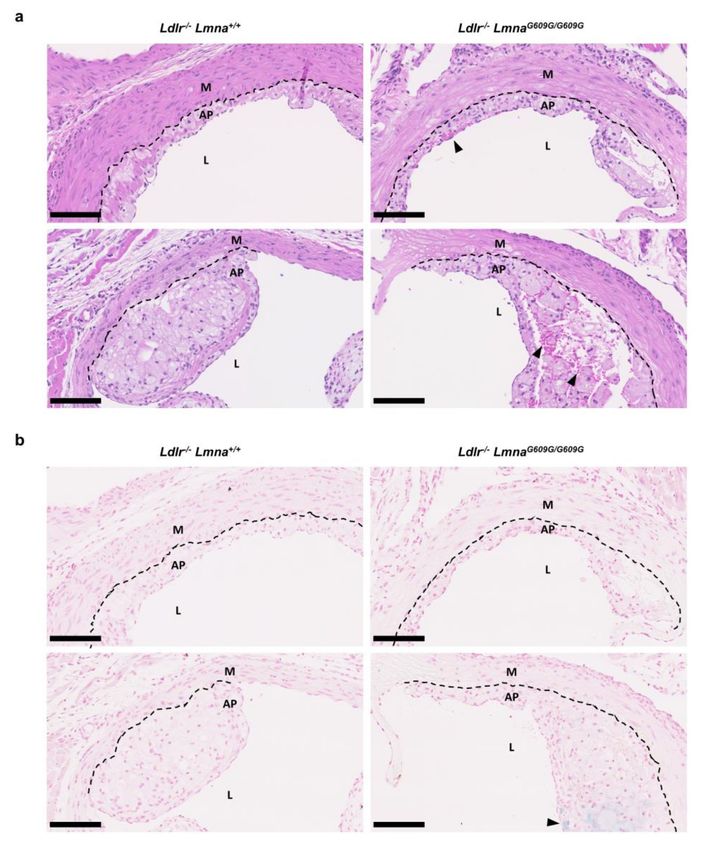
Cells 2020, 9, 2252                                                                                  2 of 19

alopecia, loss of subcutaneous fat, skin wrinkling, bone and joint problems, and cardiovascular
disease [3,4]. Most HGPS patients die from atherosclerosis-related causes, mainly myocardial infarction
or stroke, at an average age of 14.6 years [5,6]. Autopsies reveal that apart from atherosclerotic lesions,
HGPS arteries have severe structural abnormalities, including excessive calcification, adventitial
thickening, smooth muscle cell loss and extracellular matrix accumulation in the media, and elastin
structure alterations [5,7,8].
      HGPS is an extremely rare disorder (prevalence about 1 in 18 million) [9], and therefore, human
cardiovascular tissue samples are scarce and limited to post-mortem specimens. There is therefore
a need for animal models for the study of disease mechanisms, especially disease initiation and
progression, in order to pave the way for effective treatments. Several progerin-expressing mouse
models have been generated [10]; however, they do not develop atherosclerosis, the cause of death
in HGPS. This is because mice, unlike humans, are resistant to atherosclerotic disease due to an
atheroprotective lipid profile featuring high circulating levels of high-density lipoprotein (HDL)
and low levels of low-density lipoprotein (LDL) [11]. Conducting atherosclerosis research with
mice therefore requires genetic alteration of their lipid profile, often in combination with high-fat,
high-cholesterol feeding. The most-widely used atherosclerosis mouse models are Apoe−/− and Ldlr−/−
mice, which lack apolipoprotein E and the LDL receptor, respectively. However, studies with these
models do not always lead to the same conclusions, mainly because the Apoe and Ldlr genes have
different expression patterns in tissues and their deficiency yields different lipid profiles, resulting in
atherosclerotic lesions with slightly different features and topology [12]. Thus, atherosclerotic plaques
in Apoe−/− mice are more similar to those observed in humans, but the circulating lipid profile of
Ldlr−/− mice is more similar to that of hypercholesterolemic humans. It is therefore preferable to use
both models in order to avoid the reporting of effects specific only to Apoe or Ldlr deficiency and thus
identify effects genuinely caused by progerin expression.
      We recently generated an Apoe−/− LmnaG609G/G609G mouse model that resembles most features
of vascular disease found in HGPS patients, including accelerated atherosclerosis [13]. To validate
and extend the results obtained with the Apoe−/− LmnaG609G/G609G model, we have now generated
and characterized atherosclerosis development in progerin-expressing Ldlr−/− LmnaG609G/G609G mice.
This new mouse model displays accelerated organismal and vascular aging and has a phenotype similar
but not identical to that of Apoe−/− LmnaG609G/G609G mice. Comparison of the two models allowed us to
identify key features of atherosclerosis associated with HGPS.

2. Materials and Methods

2.1. Study Approval
     Animal experimental procedures followed EU Directive 2010/63EU and Recommendation
2007/526/EC, enforced in Spanish law under Real Decreto 53/2013. Animal protocols were approved by
the local ethics committees and the Animal Protection Area of the Comunidad Autónoma de Madrid
(PROEX 149.0/20).

2.2. Mice
     The Ldlr−/− LmnaG609G/G609G mouse line was generated by crossing Ldlr−/− mice
(B6.129S7-Ldlrtm1Her /J, stock no. 002207, The Jackson Laboratory, Bar Harbor, ME, USA) with LmnaG609G/+
mice [14]. We used male and female Ldlr−/− LmnaG609G/G609G , Ldlr−/− LmnaG609G/+ , and Ldlr−/− Lmna+/+
mice on a C57BL/6J genetic background.
     Mice were housed in a specific pathogen-free facility in individually ventilated cages with 12 h
light/12 h dark cycle at a temperature of 22 ± 2 ◦ C, 50% relative humidity (range 45–60%). Mice had
ad libitum access to water and food (normal chow diet: D184, SAFE, Augy, France, and Rod18-A,
LASQCdiet, Soest, Germany). When indicated, eight-week-old mice were placed for eight weeks
on a high-fat diet (HFD) containing 10.7% total fat and 0.75% cholesterol (S9167-E011, Ssniff, Soest,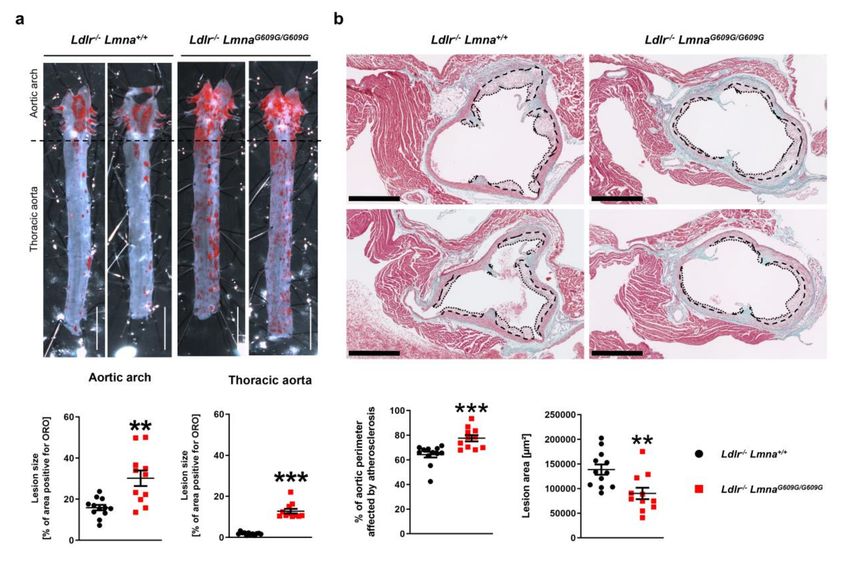
Cells 2020, 9, 2252                                                                               3 of 19

Germany). Except for longevity studies, animals were sacrificed by CO2 inhalation at 16 weeks of age
after overnight fasting.

2.3. Longevity Studies
      Beginning at four weeks of age, mice were weighed and inspected for health and survival at
least once a week. Animals that met humane end-point criteria were euthanized and the deaths
recorded. We excluded from the analysis mice euthanized due to causes unrelated to phenotype,
e.g., intermale aggression.

2.4. Hematology and Serum Biochemical Analysis
     Mice were fasted overnight for all blood analyses. For hematology, blood samples were collected
in Microvette 100 EDTA tubes (20.1278, Sarstedt, Nümbrech, Germany) and analyzed with a PENTRA
80 hematology analyzer (Horiba, Kyoto, Japan). For lipid profile analysis, blood samples were collected
in plastic tubes, incubated at room temperature (RT) to allow clotting, and centrifuged at 1900× g
for 10 min (4 ◦ C). Collected serum was centrifuged for 10 min at maximum speed (4 ◦ C), harvested,
and stored at −80 ◦ C. When the serum sample volume was insufficient for the analysis, specimens
from 2–3 mice of the same genotype were pooled. Hemolyzed specimens were excluded from testing.
The serum content of total cholesterol, free cholesterol, HDL, and LDL was measured using a Dimension
RxL Max Integrated Chemistry System (Siemens Healthineers, Erlangen, Germany). All analyses were
performed by specialized staff at the CNIC Animal Facility.

2.5. Oil Red O Staining and Quantification of Atherosclerosis Burden
     Aortic atherosclerosis burden was quantified as previously described [13]. Briefly, mouse aortas
were fixed with 4% formaldehyde in phosphate-buffered saline (PBS), cleaned of fatty tissue, and stained
with 0.2% Oil Red O (ORO, O0625, Sigma, St. Louis, MO, USA). The aorta was opened longitudinally
and pinned flat for planimetric analysis. Images were acquired with a digital camera (UC30, OLYMPUS,
Tokyo, Japan) mounted on a stereo microscope (SZX3, OLYMPUS). Lesion area was quantified as the
percentage of ORO-stained aortic surface by a researcher blinded to genotype using SigmaScan Pro 5
software (Systat Software Inc., San Jose, CA, USA).

2.6. Histology
     The mouse aortic arch and aortic root were fixed with 4% formaldehyde in PBS, dehydrated to
xylene, and embedded in paraffin. Tissue was cut in 4 µm sections using a microtome (RM2245, Leica,
Wetzlar, Germany), and specimens were stained with hematoxylin–eosin, Masson trichrome, Van Gieson,
or Perls Prussian blue. Stained sections were scanned with a NanoZoomer-RS scanner (Hamamatsu
Photonics K.K., Hamamatsu, Japan). Plaque area and the aortic perimeter affected by atherosclerosis
were analyzed with NDP.view2 (Hamamatsu Photonics K.K.) using Freehand Region and Freehand
Line annotation tools. Atheroma collagen content, adventitia thickness, and media thickness were
quantified using ImageJ Fiji software [15]. Collagen content in atheroma was assessed in Masson
trichrome-stained aortic root sections by image color deconvolution and quantification of the percentage
of blue area in plaque regions that were drawn manually. Adventitia and media thickness were
assessed in Van Gieson-stained aortic arch sections by drawing two circular band regions (one for the
media and one for the adventitia). These regions of interest were linearized, and the mean thickness of
each aortic layer was measured using a specific macro. Then the adventitia-to-media thickness ratio
was calculated. Aorta and atheroma plaque features were analyzed by a researcher blinded to genotype
in approximately three sections per animal, and mean values were used for statistical analysis.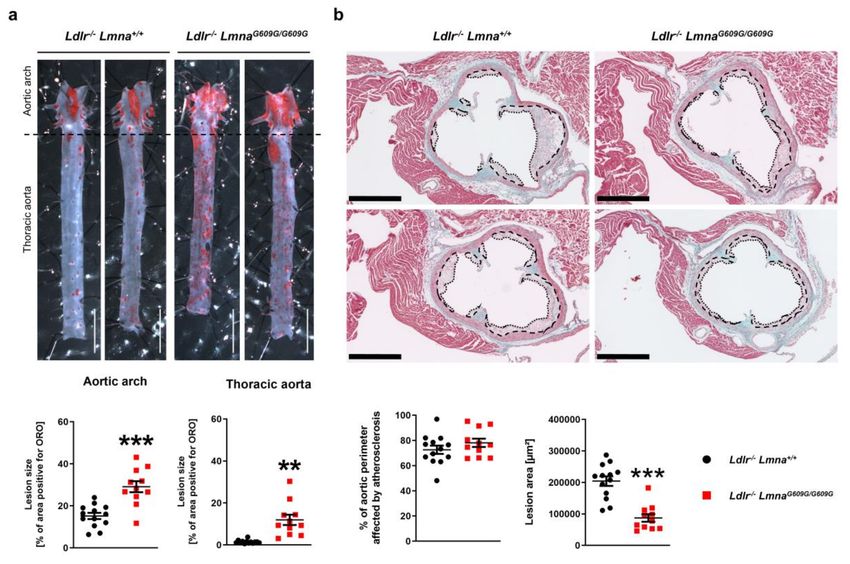
Cells 2020, 9, 2252                                                                              4 of 19

2.7. Fluorescent Immunohistochemistry
      The mouse aortic arch and aortic root were fixed with 4% formaldehyde in PBS, dehydrated
to xylene, embedded in paraffin, and cut into 4 µm sections using a microtome (RM2245, Leica).
Antigens were retrieved with 10 mM sodium citrate buffer (pH 6), and samples were blocked for
1 h at room temperature (RT) with 5% bovine serum albumin (BSA) and 5% normal goat serum in
PBS. Sections were incubated for 2 h at RT with an anti-α-smooth muscle actin (SMA)-Cy3 antibody
(C6198, Sigma, 1:200) and Hoechst 33342 stain (B2261, Sigma) diluted in 2.5% normal goat serum in
PBS. Sections were mounted in Fluoromount G imaging medium (00-4958-02, Affymetrix eBioscience,
Santa Clara, CA, USA). Fluorescence images were acquired with a LSM 700 confocal microscope
(Zeiss, Oberkochen, Germany) and analyzed using ImageJ Fiji software [15] by a researcher blinded to
genotype. SMA content was quantified in the red channel by measuring the percentage of red area
in the region of interest. Nuclei count was assessed in the blue channel by quantifying the number
of nuclei per area in the region of interest. Regions of interests were drawn manually and included:
aortic media for aortic arch sections, and atheroma, atheroma without necrotic core, and fibrous cap
in the atheroma (6 µm band below the endothelium) for aortic root sections. Aorta and atheroma
plaque features were analyzed in approximately three sections per animal and mean values used for
statistical analysis.

2.8. Statistical Analysis
     Data distribution was assessed with Kolmogorov–Smirnov and D’Agostino–Pearson normality
tests. For parametric data, a two-tailed t-test was used, and Welch’s correction was applied if
the groups had unequal variances. A two-tailed Mann–Whitney test was used for nonparametric
data. Repeated measures data (body weight curves) were analyzed by fitting a mixed effects model
with the Geisser–Greenhouse correction. Kaplan–Meier survival curves were compared by log-rank
(Mantel–Cox) test. Experimental data are presented as the mean for parametric data (error bars indicate
SEM) or the median for nonparametric data. Statistical analysis was performed with Prism 5 and 8
(GraphPad, San Diego, CA, USA). Differences were considered significant at p < 0.05.

3. Results
     To generate a new mouse model to study atherosclerosis in HGPS, we crossed atheroprone
Ldlr−/− mice with progeroid LmnaG609G mice, which carry a c.1827C>T; p.G609G mutation in the Lmna
gene and, like HGPS patients, produce progerin through aberrant splicing [14,16]. Homozygous
Ldlr−/− LmnaG609G/G609G and heterozygous Ldlr−/− LmnaG609G/+ mice both had a shorter lifespan and
lower body weight than control Ldlr−/− Lmna+/+ mice with normal lamin A expression (Figure 1a,b for
males; Figure A1a,b for females) and showed an aging phenotype with progressive fat loss closely
resembling that of progeric mice without Ldlr deficiency. HGPS patients are heterozygous for the
LMNA mutation; however, LmnaG609G mice seem to be more resistant to progerin-induced damage [14],
and all further studies were performed with homozygous Ldlr−/− LmnaG609G/G609G mice because their
phenotype is more severe and more similar to that seen in human patients.
     To induce atherosclerosis, mice were fed a HFD for eight weeks and sacrificed at 16 weeks
of age. Ldlr−/− Lmna+/+ and Ldlr−/− LmnaG609G/G609G mice had similar post-HFD serum levels of
total cholesterol, free cholesterol, LDL, and HDL (Figure S1). Nevertheless, planimetric analysis
of ORO-stained aortas revealed a higher atherosclerosis burden in the aortic arch and thoracic
aorta of Ldlr−/− LmnaG609G/G609G mice (Figure 2a for males; Figure A2a for females). Although
Ldlr−/− mice typically do not develop substantial atherosclerosis on a low-fat diet [12], we observed
modestly but significantly elevated lesion formation in the thoracic aorta of 16-week-old normal
chow-fed Ldlr−/− LmnaG609G/G609G mice (Figure S2a), and this was independent of serum cholesterol
level (Figure S2b). We next characterized the extent of atherosclerosis in transverse aortic root
sections from HFD-fed animals. Although Ldlr−/− LmnaG609G/G609G mice had a lower plaque area than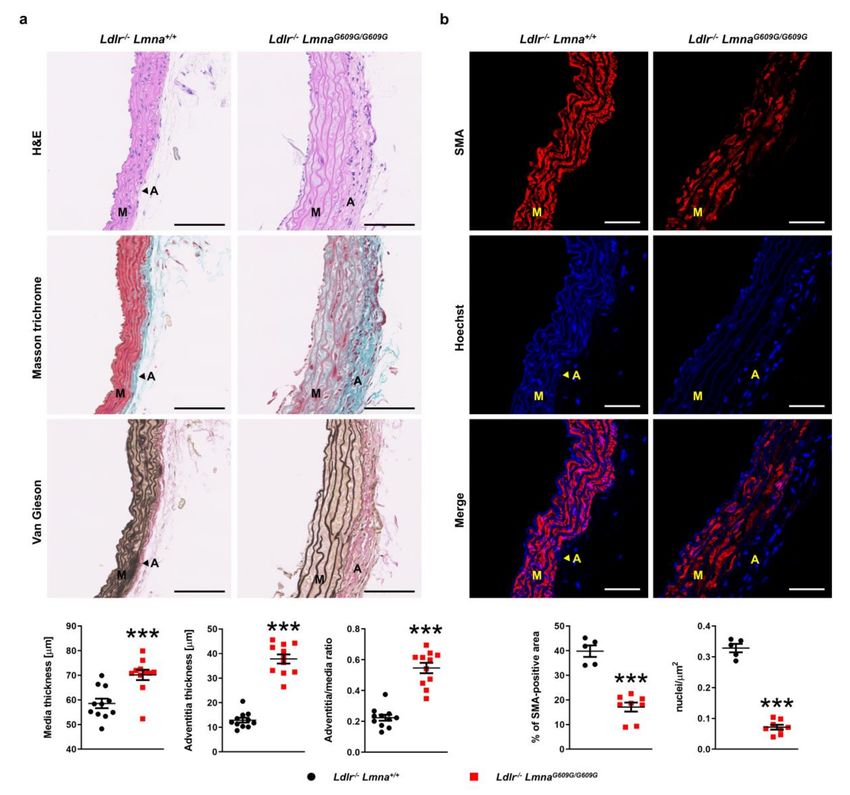
Cells 2020, 9, 2252                                                                                              5 of 19

Ldlr−/− Lmna+/+ controls, they had a higher percentage of the aortic perimeter affected by atherosclerosis,
an effect that was more pronounced in males and in aortic root sections more distal from the heart
(Figure 2b for males; Figure A2b for females and Figure S3). Most Ldlr−/− LmnaG609G/G609G animals
showed only modest inflammation and fibrosis in the cardiac tissue adjacent to the aortic root (Figure 2b
for males; Figure A2b for females).

      Figure 1. Shortened survival and reduced body weight in male Ldlr−/− LmnaG609G/G609G and
      Ldlr−/− LmnaG609G/+ mice. (a) Kaplan–Meier survival curves of Ldlr−/− Lmna+/+ mice (n = 9),
      Ldlr−/− LmnaG609G/+ mice (n = 8), and Ldlr−/− LmnaG609G/G609G mice (n = 7) fed normal chow. (b) Body
      weight curves of Ldlr−/− Lmna+/+ mice (n = 9), Ldlr−/− LmnaG609G/+ mice (n = 8), and Ldlr−/− LmnaG609G/G609G
      mice (n = 7) fed normal chow. Body weight is shown until death for Ldlr−/− LmnaG609G/+ and
      Ldlr−/− LmnaG609G/G609G mice and until 80 weeks of age for Ldlr−/− Lmna+/+ mice. Data are presented
      as mean ± SEM in (b). Statistical analysis was performed by log-rank test in (a) and by mixed effects
      model with the Geisser–Greenhouse correction in (b). ***, p < 0.001.

      Figure 2. Male fat-fed Ldlr−/− LmnaG609G/G609G mice have an elevated atherosclerosis burden in the
      aortic arch and thoracic aorta and a higher percentage of the aortic perimeter affected by atherosclerosis
      in the aortic root. Male mice were fed a high-fat diet from eight weeks of age and were sacrificed at
      16 weeks of age. (a) Representative images of aortas stained with Oil Red O (ORO) and quantification
      of atherosclerosis burden (the percentage of the aortic surface positive for ORO) in the aortic arch and
      thoracic aorta of Ldlr−/− Lmna+/+ mice (n = 12) and Ldlr−/− LmnaG609G/G609G mice (n = 11). Scale bar, 5 mm.
      (b) Representative images of aortic root sections stained with Masson trichrome and quantification of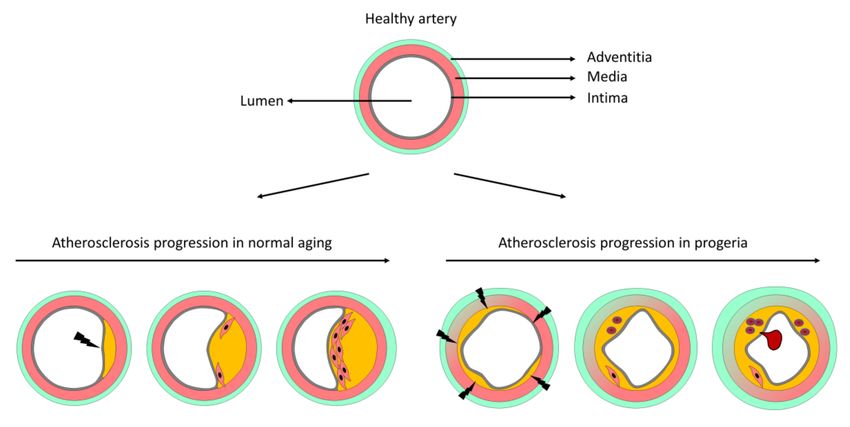
Cells 2020, 9, 2252 6 of 19
plaque area and percentage of the aortic perimeter affected by atherosclerosis in Ldlr−/− Lmna+/+ mice
(n = 12) and Ldlr−/− LmnaG609G/G609G mice (n = 11). Each point represents the mean for three aortic root
regions per mouse (see Figure S3 for data analyzed for each region separately). Dashed lines indicate the
medial perimeter (the last layer of elastin), and dotted lines indicate the luminal surface of the atheroma
plaque. Scale bar, 500 µm. Data are presented as mean ± SEM. Statistical analysis was performed by
two-tailed t-test with Welch’s correction in (a) and by two-tailed t-test in (b). **, p < 0.01; ***, p < 0.001.
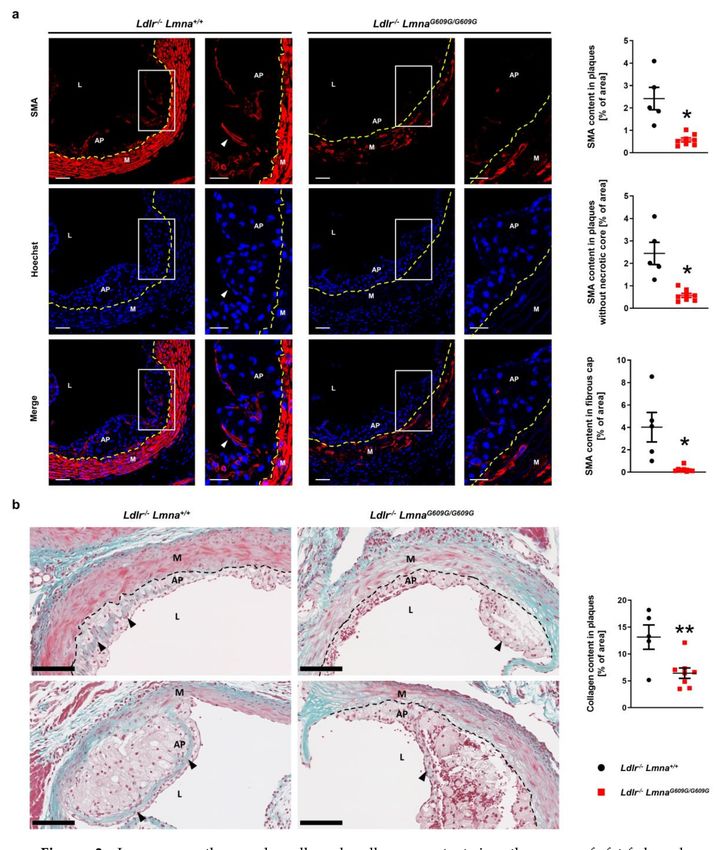
Disease severity is defined not only by atherosclerosis burden but also by lesion composition,
which also predicts adverse outcomes. We therefore analyzed lesion characteristics, especially those
associated with a vulnerable plaque phenotype. Fluorescence immunohistochemistry against SMA
showed a lower atheroma content of smooth muscle cells in HFD-fed Ldlr−/− LmnaG609G/G609G mice
than in Ldlr−/− Lmna+/+ controls (Figure 3a for males; Figure A3a for females). Smooth muscle content
was also lower in the fibrous cap of Ldlr−/− LmnaG609G/G609G mouse atheromas (Figure 3a for males;
Figure A3a for females), and this was accompanied by a lower collagen content in lesions, revealed by
Masson trichrome staining (Figure 3b for males; Figure A3b for females).
Figure 3. Lower smooth muscle cell and collagen content in atheromas of fat-fed male
Ldlr−/− LmnaG609G/G609G mice. Male mice were fed a high-fat diet from eight weeks of age and were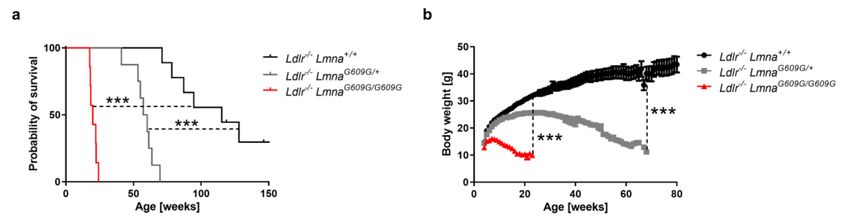
Cells 2020, 9, 2252                                                                                               7 of 19

      sacrificed at 16 weeks of age. (a) Representative fluorescence images of aortic root sections stained with an
      anti-α-smooth muscle actin (SMA) antibody (red) and Hoechst 33342 nuclear dye (blue). Discontinuous
      yellow lines indicate the separation between the media and atheroma plaques. White arrowheads
      indicate smooth muscle cells in the fibrous cap. Scale bar, 50 µm (non-magnified images) and 25 µm
      (magnified images). Graphs show smooth muscle content in atheromas (% of area positive for SMA)
      (top graph), in the cellular part of atheromas (without necrotic cores; middle graph), and in the
      fibrous cap (6 µm band below the endothelium; bottom graph) of Ldlr−/− Lmna+/+ mice (n = 5) and
      Ldlr−/− LmnaG609G/G609G mice (n = 8). (b) Representative images of aortic root sections stained with
      Masson trichrome. Discontinuous black lines indicate the separation between the media and atheroma
      plaques. Black arrowheads indicate collagen. Scale bar, 100 µm. The graph shows collagen content
      (% of blue area) in atheroma plaques of Ldlr−/− Lmna+/+ mice (n = 5) and Ldlr−/− LmnaG609G/G609G mice
      (n = 8). Data are presented as mean ± SEM. Each point represents the mean for three aortic root sections
      per mouse. Statistical analysis was performed by two-tailed t-test with Welch’s correction in (a) and by
      two-tailed t-test in (b). *, p < 0.05; **, p < 0.01. AP, atheroma plaque; M, media; L, lumen.

      Histological analysis showed a substantial presence of erythrocytes even in small plaques in
fat-fed Ldlr−/− LmnaG609G/G609G mice but not in control mice, suggesting plaque disruption (Figure 4a
for males; Figure A4a for females). Accordingly, Perls Prussian blue staining revealed iron deposits
in atheromas of some mutant mice (Figure 4b for males; Figure A4b for females), an indication of
hemorrhage and erythrocyte phagocytosis by macrophages. We also found evidence of thrombus
formation in Ldlr−/− LmnaG609G/G609G mice (Figure S4).
      Because autopsies of HGPS patients demonstrated pathological changes in the arterial wall [5,7,8],
we next analyzed the structure of the aorta and coronary arteries in HFD-fed animals. Compared with
Ldlr−/− Lmna+/+ controls, aortas of Ldlr−/− LmnaG609G/G609G mice displayed medial and adventitial
thickening (Figure 5a for males; Figure A5a for females). The adventitia-to-media ratio was higher
in Ldlr−/− LmnaG609G/G609G males, but the difference did not reach statistical significance in females
(Figure 5a for males; Figure A5a for females). The aortas of mutant mice showed severe depletion of
smooth muscle cells in the medial layer, as assessed by both SMA content and nuclei count (Figure 5b for
males; Figure A5b for females). Loss of smooth muscle cells was accompanied by decreased waviness
of the elastin layers and increased extracellular matrix deposition (Figure 5 for males; Figure A5 for
females). We also found adventitial fibrosis and smooth muscle cell loss in the coronary arteries of
Ldlr−/− LmnaG609G/G609G mice (Figure S5). Similar to HGPS patients, progerin-expressing mice showed
aortic valve defects, including increased fibrosis and reduced cellularity in the valve leaflets (Figure S6).
In addition, HFD-fed Ldlr−/− LmnaG609G/G609G mice showed some hematological alterations that varied
slightly between males and females (Figure S7).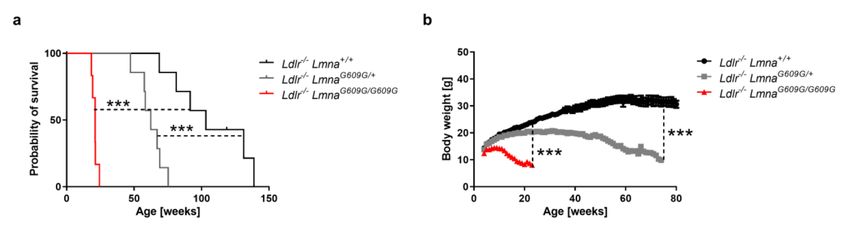
Cells 2020, 9, 2252                                                                                           8 of 19

      Figure 4. Presence of erythrocytes and iron deposits in atheromas of fat-fed male Ldlr−/− LmnaG609G/G609G
      mice. Male mice were fed a high-fat diet from eight weeks of age and sacrificed at 16 weeks of
      age. (a) Representative images of aortic root sections of Ldlr−/− Lmna+/+ and Ldlr−/− LmnaG609G/G609G
      mice stained with hematoxylin–eosin. Black arrowheads indicate erythrocytes. Scale bar, 100 µm.
      (b) Representative images of aortic root sections of Ldlr−/− Lmna+/+ and Ldlr−/− LmnaG609G/G609G mice
      stained with Perls Prussian blue. Black arrowheads indicate iron deposits. Scale bar, 100 µm.
      Discontinuous black lines mark the separation between the media and atheroma plaques. AP, atheroma
      plaque; M, media; L, lumen.
Cells 2020, 9, 2252 9 of 19
Figure 5. Pathological changes in the aortic wall of fat-fed male Ldlr−/− LmnaG609G/G609G mice. Male mice
were fed a high-fat diet from eight weeks of age and sacrificed at 16 weeks of age. (a) Representative
images of aortic arch sections stained with hematoxylin–eosin (H&E), Masson trichrome, and Van Gieson
stain. Scale bar, 100 µm. Graphs show medial and adventitial thickness and the adventitia-to-media ratio
in Ldlr−/− Lmna+/+ mice (n = 11) and Ldlr−/− LmnaG609G/G609G mice (n = 11). (b) Representative fluorescence
images of aortic arch sections stained with an anti-α-smooth muscle actin (SMA) antibody (red) and
Hoechst 33342 nuclear dye (blue). Scale bar, 50 µm. Graphs show the percentage of SMA-positive
area and nuclei count/area in the media of Ldlr−/− Lmna+/+ mice (n = 5) and Ldlr−/− LmnaG609G/G609G
mice (n = 8). Data are presented as mean ± SEM. Each point represents the mean for three aortic arch
sections per mouse. Statistical analysis was performed by two-tailed t-test with Welch’s correction in
(a) and by two-tailed t-test in (b). ***, p < 0.001. M, media; A, adventitia.
4. Discussion
In this study, we describe a new atheroprone model of HGPS, a very rare premature aging
syndrome resulting in death from atherosclerosis complications. Post-mortem analysis of very low
numbers of patients has identified end-stage cardiovascular pathologies; however, the study of disease
mechanisms requires in vitro and in vivo models of HGPS. Several animal models of HGPS have been
reported, including mice with systemic and tissue-restricted progerin expression [13,14,17–21] and a
pig HGPS model [22]. Most models, at least to some extent, exhibit structural abnormalities in the
arterial wall; however, progeriod animal models without additional genetic modifications to alterCells 2020, 9, 2252 10 of 19
lipid metabolism lacked atherosclerotic disease, indicating that progerin expression in the absence of
pro-atherogenic conditions is not sufficient to induce atheroma plaque formation.
We recently generated Apoe−/− LmnaG609G/G609G mice, the first animal model to show
progerin-induced acceleration of atherosclerosis [13,23,24]. Investigation of HGPS disease mechanisms
with this model revealed endoplasmic reticulum stress and the unfolded protein response as possible
pathways underlying increased atherosclerosis and smooth muscle cell death in the aortic wall [25].
Since some of the observed alterations might be caused, at least in part, by the lack of apolipoprotein E,
we sought to generate an alternative mouse model of progerin-dependent atherosclerosis development
to validate and extend the findings in Apoe−/− LmnaG609G/G609G mice. We report here the generation
and characterization of Ldlr−/− LmnaG609G/G609G mice, the second atherosusceptible model for the
study of HGPS-related atherosclerosis and for the assessment of novel therapies. The Ldlr- and
Apoe-deficient HGPS models had postnatal growth defects and lifespan shortening similar to
atheroresistant LmnaG609G/G609G mice (median survival in males, 19.9 weeks for Ldlr−/− LmnaG609G/G609G
mice and 18.15 weeks for Apoe−/− LmnaG609G/G609G mice; survival in female Apoe−/− LmnaG609G/G609G
mice was not reported). Moreover, both Ldlr−/− LmnaG609G/G609G and Apoe−/− LmnaG609G/G609G models
showed key hallmarks of HGPS-associated vascular disease, including augmented atherosclerosis,
smooth muscle cell loss in the media, and adventitial thickening. A more detailed comparison
of vascular features in both models revealed similar but not identical phenotypes (Table A1,
only male data are compared because data on female Apoe−/− LmnaG609G/G609G mice are unavailable).
For instance, Ldlr−/− LmnaG609G/G609G mice had less pronounced adventitial thickening and less fibrosis
and inflammation in tissue neighboring the aortic root than Apoe−/− LmnaG609G/G609G mice. Furthermore,
plaque area did not increase in the aortic root of Ldlr−/− LmnaG609G/G609G mice, which may be explained
by the fact that Ldlr-deficiency yields lower cholesterol levels than Apoe-deficiency [12]. On the
other hand, Ldlr−/− LmnaG609G/G609G mice showed higher atherosclerosis burden in the thoracic aorta
and a greater reduction in smooth muscle content in plaques than Apoe−/− LmnaG609G/G609G mice.
The atherosclerosis assessment in different aortic regions of both atheroprone progeria models indicates
that the key features of progerin-induced atherosclerosis are its ubiquity (a very high fraction of
the aortic surface affected) and its highly unstable phenotype (Table A1). Based on these findings,
we conclude that exacerbated atherosclerosis and its complications in Apoe−/− LmnaG609G/G609G and
Ldlr−/− LmnaG609G/G609G mice are bona fide effects of progerin expression, independent of the genetic
manipulation required to establish an atherosusceptible environment in preclinical mouse models.
We consider both atheroprone homozygous progeria models adequate for studying mechanisms of
progerin-induced vascular aging, especially atherosclerosis. As reported before [26–28], calcification is
the only aspect of vascular aging that is better approached by using heterozygous LmnaG609G/+ mice,
which live longer and therefore exhibit substantial calcium-phosphate deposition in their arteries
and valves.
Integration of the data from Ldlr−/− LmnaG609G/G609G and Apoe−/− LmnaG609G/G609G mouse models
and comparison with progerin-independent atherosclerosis suggest a model of progerin-triggered
atherosclerosis progression (Figure 6). During progerin-independent atherosclerosis, lesions form at
arterial sites with disturbed blood flow, which activates endothelial cells and triggers uptake of LDL
particles and the recruitment of blood-borne immune cells to the inflamed vessel wall. As the plaque
grows, smooth muscle cells move from the media to the intima, where they proliferate and produce
collagen to form a fibrous cap that protects from plaque rupture (Figure 6). During progerin-driven
atherosclerosis, the pro-atherogenic stimulus originates within the artery wall (direct or indirect effects
of progerin-induced smooth muscle cell death [13,23,25]) and affects almost the entire vessel surface.
Atherosclerotic lesions therefore form throughout the intima, unlike plaques in normal atherosclerosis,
which typically grow eccentrically. Nevertheless, plaque growth in the presence of progerin, at least
in large vessels, may be limited by plaque vulnerability, since the fibrous cap is absent or thin and
disorganized in HGPS atheromas, making plaques more prone to rupture and the formation of a
life-threatening thrombus (Figure 6).Cells 2020, 9, 2252 11 of 19
Figure 6. Proposed model of atherosclerosis progression in normal versus progerin-induced mouse
aging. A healthy artery is composed of three layers, the intima (containing the endothelial cell monolayer
and an internal elastic lamina), the media (mainly composed of several layers of smooth muscle cells
and elastic fibers), and the adventitia (containing mostly immune cells and fibroblasts). During normal
aging, atheroma plaques form predominantly at arterial sites susceptible to atherogenesis due to
disturbed blood flow and typically grow eccentrically. As the lesion grows, smooth muscle cells
from the media migrate into the intima, proliferate, and produce collagen to form a fibrous cap that
protects the plaque from disruption. During progerin-induced aging, smooth muscle cells in the
arterial media die, triggering plaque formation over almost the entire intimal surface. These lesions
typically contain few smooth muscle cells and display signs of instability, including the presence of
erythrocytes and a thin or absent fibrous cap. Vulnerable plaques in HGPS are prone to disruption,
thus facilitating thrombus formation and myocardial infarction or stroke. Atherosclerosis in progeric
mice is also accompanied by extracellular matrix accumulation in the media, elastin structure alterations,
and prominent adventitial thickening.
Atherosclerosis is a major contributor to adverse events and deaths from cardiovascular disease,
and its onset and clinical manifestation are highly variable between normally-aging individuals [29].
Studying diseases that drastically accelerate atherogenesis in the absence of traditional cardiovascular
risk factors, such as HGPS, may therefore help to identify unknown factors that speed up this process [30].
Moreover, low amounts of progerin have been detected in cells and arteries of elderly individuals [5,31],
suggesting that progerin may also play a role in physiological aging and HGPS-unrelated atherosclerosis
and its life-threatening complications [10,30].
Supplementary Materials: The following are available online at http://www.mdpi.com/2073-4409/9/10/2252/s1,
Figure S1: Fat-fed Ldlr−/− LmnaG609G/G609G and Ldlr−/− Lmna+/+ mice have similar serum cholesterol levels, Figure S2:
Elevated spontaneous atherosclerosis burden in the thoracic aorta of Ldlr−/− LmnaG609G/G609G mice, Figure S3:
Characterization of atheromas in different aortic root regions of male and female fat-fed Ldlr−/− Lmna+/+ and
Ldlr−/− LmnaG609G/G609G mice, Figure S4: Signs of thrombosis in fat-fed Ldlr−/− LmnaG609G/G609G mice, Figure S5:
Medial smooth muscle cell loss and adventitial thickening in the coronary arteries of Ldlr−/− LmnaG609G/G609G mice,
Figure S6: Fibrosis and reduced cellularity in the aortic valve in fat-fed Ldlr−/− LmnaG609G/G609G mice, Figure S7:
Hematological parameters in Ldlr−/− Lmna+/+ and Ldlr−/− LmnaG609G/G609G mice.
Author Contributions: Conceptualization, M.R.H., R.M.N. and V.A.; methodology, P.G., M.R.H. and R.M.N.;
validation, R.M.N., M.R.H. and P.G.; investigation, R.M.N., M.R.H., P.G. and M.J.A.-M.; resources, V.A.; data
curation, R.M.N., M.R.H. and P.G.; writing—original draft preparation, M.R.H., R.M.N. and V.A.; writing—review
and editing, M.R.H., R.M.N., P.G. and V.A.; visualization, R.M.N., M.R.H. and P.G.; supervision, V.A.;
project administration, M.R.H. and V.A.; funding acquisition, V.A. All authors have read and agreed to the
published version of the manuscript.Cells 2020, 9, 2252 12 of 19
Funding: Work in Andrés’ laboratory is supported by the Spanish Ministerio de Ciencia e Innovación (MCIN)
(SAF2016-79490-R, and PID2019-108489RB-I00) and the Instituto de Salud Carlos III (ISCIII) (AC17/00067,
and CB16/11/00405) with cofunding from the European Regional Development Fund (ERDF/FEDER, “Una manera
de hacer Europa”), and the Progeria Research Foundation. R.M.N. is supported by the Ministerio de Educación,
Cultura y Deporte (pre-doctoral contract FPU16/05027). M.R.H. is supported by the MCIN (post-doctoral contract
FJCI-2017-33299). The CNIC is supported by the MCIN, the ISCIII, and the Pro CNIC Foundation and is a Severo
Ochoa Center of Excellence (SEV-2015-0505).
Acknowledgments: We thank Carlos López-Otín for providing LmnaG609G mice, Simon Bartlett for English editing,
Yaazan Blanco for technical support, Eva Santos and the CNIC Animal Facility for animal care, and Antonio de
Molina and Roisin Doohan for support with histology.
Conflicts of Interest: The authors declare no conflict of interest. The funders had no role in the design of the
study; the collection, analysis, or interpretation of data; the writing of the manuscript, or the decision to publish
the results.
Appendix A
Figure A1. Shortened survival and reduced body weight in female Ldlr−/− LmnaG609G/G609G
and Ldlr−/− LmnaG609G/+ mice. (a) Kaplan–Meier survival curves of Ldlr−/− Lmna+/+ mice (n = 7),
Ldlr−/− LmnaG609G/+ mice (n = 7), and Ldlr−/− LmnaG609G/G609G mice (n = 6) fed normal chow.
(b) Body weight curves for Ldlr−/− Lmna+/+ mice (n = 7), Ldlr−/− LmnaG609G/+ mice (n = 7),
and Ldlr−/− LmnaG609G/G609G mice (n = 6) fed normal chow. Body weight is shown until death for
Ldlr−/− LmnaG609G/+ and Ldlr−/− LmnaG609G/G609G mice, and until 80 weeks of age for Ldlr−/− Lmna+/+ mice.
Data are presented as mean ± SEM in (b). Statistical analysis was performed by log-rank test in (a) and
by mixed effects model with the Geisser–Greenhouse correction in (b). ***, p < 0.001.Cells 2020, 9, 2252 13 of 19
Figure A2. Female fat-fed Ldlr−/− LmnaG609G/G609G mice have an elevated atherosclerosis burden in the
aortic arch and thoracic aorta and a higher percentage of the aortic perimeter affected by atherosclerosis
in the aortic root. Female mice were fed a high-fat diet from eight weeks of age and were sacrificed at
16 weeks of age. (a) Representative images of aortas stained with Oil Red O (ORO) and quantification
of atherosclerosis burden (the percentage of the aortic surface positive for ORO) in the aortic arch and
thoracic aorta of Ldlr−/− Lmna+/+ mice (n = 13) and Ldlr−/− LmnaG609G/G609G mice (n = 11). Scale bar, 5 mm.
(b) Representative images of aortic root sections stained with Masson trichrome and quantification
of plaque area and percentage of aortic perimeter affected by atherosclerosis in Ldlr−/− Lmna+/+ mice
(n = 13) and Ldlr−/− LmnaG609G/G609G mice (n = 11). Each point represents the mean for three aortic root
regions per mouse (see Figure S3 for data analyzed for each region separately). Dashed lines indicate
medial perimeter (the last layer of elastin), and dotted lines indicate the luminal surface of atheroma
plaques. Scale bar, 500 µm. Data are presented as mean ± SEM. Statistical analysis was performed by
two-tailed t-test with Welch´s correction in (a) and by two-tailed t-test in (b). **, p < 0.01; ***, p < 0.001.Cells 2020, 9, 2252 14 of 19
Figure A3. Lower smooth muscle cell and collagen content in atheromas of fat-fed female
Ldlr−/− LmnaG609G/G609G mice. Female mice were fed a high-fat diet from eight weeks of age and
were sacrificed at 16 weeks of age. (a) Representative fluorescence images of aortic root sections
stained with an anti-α-smooth muscle actin (SMA) antibody (red) and Hoechst 33342 nuclear dye
(blue). Discontinuous yellow lines indicate the separation between the media and atheroma plaques.
White arrowheads indicate smooth muscle cells in the fibrous cap. Scale bar, 50 µm. Graphs show
smooth muscle content in atherosclerotic plaques (% of area positive for SMA) (top graph), in the
cellular parts of plaques (without necrotic cores; middle graph), and in the fibrous cap (6 µm band
below the endothelium; bottom graph) of Ldlr−/− Lmna+/+ mice (n = 6) and Ldlr−/− LmnaG609G/G609G mice
(n = 4). (b) Representative images of aortic root sections stained with Masson trichrome. Discontinuous
black lines indicate the separation between the media and atheroma plaques. Black arrowheads indicate
collagen. Scale bar, 100 µm. The graph shows collagen content (% of blue area) in atheroma plaques
of Ldlr−/− Lmna+/+ mice (n = 6) and Ldlr−/− LmnaG609G/G609G mice (n = 4) mice. Data are presented
as mean ± SEM. Each point represents the mean for three aortic root sections per mouse. Statistical
analysis was performed by two-tailed t-test with Welch´s correction in (a) and by two-tailed t-test in (b).
*, p < 0.05; **, p < 0.01. AP, atheroma plaque; M, media; L, lumen.Cells 2020, 9, 2252 15 of 19
Figure A4. Presence of erythrocytes and iron deposits in atheromas of fat-fed female
Ldlr−/− LmnaG609G/G609G mice. Female mice were fed a high-fat diet from eight weeks of age and
sacrificed at 16 weeks of age. (a) Representative images of aortic root sections of Ldlr−/− Lmna+/+
and Ldlr−/− LmnaG609G/G609G mice stained with hematoxylin–eosin. Black arrowheads indicate
erythrocytes. Scale bar, 100 µm. (b) Representative images of aortic root sections of Ldlr−/− Lmna+/+ and
Ldlr−/− LmnaG609G/G609G mice stained with Perls Prussian blue. Black arrowheads indicate iron deposits.
Scale bar, 100 µm. Discontinuous black lines mark the separation between the media and atheroma
plaques. AP, atheroma plaque; M, media; L, lumen.Cells 2020, 9, 2252 16 of 19
Figure A5. Pathological changes in the aortic wall of fat-fed female Ldlr−/− LmnaG609G/G609G mice.
Female mice were fed a high-fat diet from eight weeks of age and sacrificed at 16 weeks of
age. (a) Representative images of aortic arch sections stained with hematoxylin–eosin (H&E),
Masson trichrome, and Van Gieson stain. Scale bar, 100 µm. Graphs show medial and adventitial
thickness and the adventitia-to-media ratio in Ldlr−/− Lmna+/+ mice (n = 13) and Ldlr−/− LmnaG609G/G609G
mice (n = 11). (b) Representative fluorescence images of aortic arch sections stained with an
anti-α-smooth muscle actin (SMA) antibody (red) and Hoechst 33342 nuclear dye (blue). Scale bar, 50 µm.
Graphs show the percentage of SMA-positive area and nuclei count/area in the media of Ldlr−/− Lmna+/+
mice (n = 6) and Ldlr−/− LmnaG609G/G609G mice (n = 4). Data are presented as mean ± SEM. Each point
represents the mean for three aortic arch sections per mouse. Statistical analysis was performed by
two-tailed t-test with Welch´s correction in (a) and by two-tailed t-test in (b). *, p < 0.05; ***, p < 0.001.
M, media; A, adventitia.Cells 2020, 9, 2252 17 of 19
Appendix B
Table A1. Comparison of vascular phenotype between fat-fed male Apoe−/− LmnaG609G/G609G and
Ldlr−/− LmnaG609G/G609G mice at 16 weeks of age.
Feature (Zone) Apoe−/− LmnaG609G/G609G Ldlr−/− LmnaG609G/G609G
Atherosclerosis
↑ ORO-stained lesion area (FC: 1.77) 1 ↑ ORO-stained lesion area (FC: 1.9) 2
(aortic arch)
Atherosclerosis
↑ ORO-stained lesion area (FC: 3.07) 1 ↑ ORO-stained lesion area (FC: 6.9) 2
(thoracic aorta)
↑ plaque area (FC: 2.18) 1 ↓ plaque area (FC: 0.65) 2
Atherosclerosis
↑ aortic perimeter with atherosclerosis ↑ aortic perimeter with atherosclerosis
(aortic root)
(FC: 1.77) 1 (FC: 1.21) 2
↓ SMC content (FC: 0.47 *) 1 ↓ SMC content (FC: 0.24) 2
Vulnerable plaque features ↓ SMC in cap (FC: 0.47 *) 1 ↓ SMC in cap (FC: 0.06) 2
(aortic root) iron deposits iron deposits
presence of erythrocytes presence of erythrocytes
Alterations in tissue
Prominent inflammation and fibrosis Little inflammation and fibrosis
neighboring aortic root
↓ SMC content (FC: 0.11 for SMA; FC: ↓ SMC content (FC: 0.43 for SMA;
Alterations in aortic wall
0.22 for nuclei) 1 FC: 0.22 for nuclei) 2
structure (aortic arch)
↑ adventitia/media ratio (FC: 3.76) 1 ↑ adventitia/media ratio (FC: 2.44) 2
1 compared with control Apoe−/− Lmna+/+ mice [13]; 2 compared with control Ldlr−/− Lmna+/+ mice; * did not reach
statistical significance; FC, fold change (ratio between the mean value for progeric mice and the mean value for
control mice; to simplify, mean values were used for both parametric and nonparametric data); ORO, Oil Red O;
SMA, α- smooth muscle actin; SMC, smooth muscle cell.
References
1. Eriksson, M.; Brown, W.T.; Gordon, L.B.; Glynn, M.W.; Singer, J.; Scott, L.; Erdos, M.R.; Robbins, C.M.;
Moses, T.Y.; Berglund, P.; et al. Recurrent de novo point mutations in lamin A cause Hutchinson-Gilford
progeria syndrome. Nature 2003, 423, 293–298. [CrossRef] [PubMed]
2. De Sandre-Giovannoli, A.; Bernard, R.; Cau, P.; Navarro, C.; Amiel, J.; Boccaccio, I.; Lyonnet, S.; Stewart, C.L.;
Munnich, A.; Le Merrer, M.; et al. Lamin a truncation in Hutchinson-Gilford progeria. Science 2003, 300,
2055. [CrossRef] [PubMed]
3. Hennekam, R.C. Hutchinson-Gilford progeria syndrome: Review of the phenotype. Am. J. Med. Genet. A
2006, 140, 2603–2624. [CrossRef] [PubMed]
4. Merideth, M.A.; Gordon, L.B.; Clauss, S.; Sachdev, V.; Smith, A.C.; Perry, M.B.; Brewer, C.C.; Zalewski, C.;
Kim, H.J.; Solomon, B.; et al. Phenotype and course of Hutchinson-Gilford progeria syndrome. N. Engl.
J. Med. 2008, 358, 592–604. [CrossRef]
5. Olive, M.; Harten, I.; Mitchell, R.; Beers, J.K.; Djabali, K.; Cao, K.; Erdos, M.R.; Blair, C.; Funke, B.;
Smoot, L.; et al. Cardiovascular pathology in Hutchinson-Gilford progeria: Correlation with the vascular
pathology of aging. Arterioscler. Thromb. Vasc. Biol. 2010, 30, 2301–2309. [CrossRef]
6. Ullrich, N.J.; Gordon, L.B. Hutchinson-Gilford progeria syndrome. Handb. Clin. Neurol. 2015, 132, 249–264.
[CrossRef]
7. Stehbens, W.E.; Wakefield, S.J.; Gilbert-Barness, E.; Olson, R.E.; Ackerman, J. Histological and ultrastructural
features of atherosclerosis in progeria. Cardiovasc. Pathol. 1999, 8, 29–39. [CrossRef]
8. Stehbens, W.E.; Delahunt, B.; Shozawa, T.; Gilbert-Barness, E. Smooth muscle cell depletion and collagen
types in progeric arteries. Cardiovasc. Pathol. 2001, 10, 133–136. [CrossRef]
9. PRF by the Numbers. Available online: https://www.progeriaresearch.org/prf-by-the-numbers/ (accessed on
8 August 2020).
10. Hamczyk, M.R.; del Campo, L.; Andres, V. Aging in the Cardiovascular System: Lessons from
Hutchinson-Gilford Progeria Syndrome. Annu. Rev. Physiol 2018, 80, 27–48. [CrossRef]
11. Yin, W.; Carballo-Jane, E.; McLaren, D.G.; Mendoza, V.H.; Gagen, K.; Geoghagen, N.S.; McNamara, L.A.;
Gorski, J.N.; Eiermann, G.J.; Petrov, A.; et al. Plasma lipid profiling across species for the identification of
optimal animal models of human dyslipidemia. J. Lipid Res. 2012, 53, 51–65. [CrossRef]Cells 2020, 9, 2252 18 of 19
12. Getz, G.S.; Reardon, C.A. Do the Apoe-/- and Ldlr-/- Mice Yield the Same Insight on Atherogenesis?
Arterioscler. Thromb. Vasc. Biol. 2016, 36, 1734–1741. [CrossRef] [PubMed]
13. Hamczyk, M.R.; Villa-Bellosta, R.; Gonzalo, P.; Andres-Manzano, M.J.; Nogales, P.; Bentzon, J.F.;
Lopez-Otin, C.; Andres, V. Vascular Smooth Muscle-Specific Progerin Expression Accelerates Atherosclerosis
and Death in a Mouse Model of Hutchinson-Gilford Progeria Syndrome. Circulation 2018, 138, 266–282.
[CrossRef] [PubMed]
14. Osorio, F.G.; Navarro, C.L.; Cadinanos, J.; Lopez-Mejia, I.C.; Quiros, P.M.; Bartoli, C.; Rivera, J.; Tazi, J.;
Guzman, G.; Varela, I.; et al. Splicing-directed therapy in a new mouse model of human accelerated aging.
Sci. Transl. Med. 2011, 3, 106ra107. [CrossRef]
15. Schindelin, J.; Arganda-Carreras, I.; Frise, E.; Kaynig, V.; Longair, M.; Pietzsch, T.; Preibisch, S.; Rueden, C.;
Saalfeld, S.; Schmid, B.; et al. Fiji: An open-source platform for biological-image analysis. Nat. Methods 2012,
9, 676–682. [CrossRef]
16. Zaghini, A.; Sarli, G.; Barboni, C.; Sanapo, M.; Pellegrino, V.; Diana, A.; Linta, N.; Rambaldi, J.; D’Apice, M.R.;
Murdocca, M.; et al. Long term breeding of the Lmna G609G progeric mouse: Characterization of homozygous
and heterozygous models. Exp. Gerontol. 2020, 130, 110784. [CrossRef]
17. Varga, R.; Eriksson, M.; Erdos, M.R.; Olive, M.; Harten, I.; Kolodgie, F.; Capell, B.C.; Cheng, J.; Faddah, D.;
Perkins, S.; et al. Progressive vascular smooth muscle cell defects in a mouse model of Hutchinson-Gilford
progeria syndrome. Proc. Natl. Acad. Sci. USA 2006, 103, 3250–3255. [CrossRef] [PubMed]
18. Lee, J.M.; Nobumori, C.; Tu, Y.; Choi, C.; Yang, S.H.; Jung, H.J.; Vickers, T.A.; Rigo, F.; Bennett, C.F.;
Young, S.G.; et al. Modulation of LMNA splicing as a strategy to treat prelamin A diseases. J. Clin. Investig.
2016, 126, 1592–1602. [CrossRef] [PubMed]
19. Osmanagic-Myers, S.; Kiss, A.; Manakanatas, C.; Hamza, O.; Sedlmayer, F.; Szabo, P.L.; Fischer, I.; Fichtinger, P.;
Podesser, B.K.; Eriksson, M.; et al. Endothelial progerin expression causes cardiovascular pathology through
an impaired mechanoresponse. J. Clin. Investig. 2019, 129, 531–545. [CrossRef]
20. Del Campo, L.; Sanchez-Lopez, A.; Salaices, M.; von Kleeck, R.A.; Exposito, E.; Gonzalez-Gomez, C.;
Cusso, L.; Guzman-Martinez, G.; Ruiz-Cabello, J.; Desco, M.; et al. Vascular smooth muscle cell-specific
progerin expression in a mouse model of Hutchinson-Gilford progeria syndrome promotes arterial stiffness:
Therapeutic effect of dietary nitrite. Aging Cell 2019, 18, e12936. [CrossRef] [PubMed]
21. Sun, S.; Qin, W.; Tang, X.; Meng, Y.; Hu, W.; Zhang, S.; Qian, M.; Liu, Z.; Cao, X.; Pang, Q.; et al.
Vascular endothelium-targeted Sirt7 gene therapy rejuvenates blood vessels and extends life span in a
Hutchinson-Gilford progeria model. Sci. Adv. 2020, 6, eaay5556. [CrossRef] [PubMed]
22. Dorado, B.; Ploen, G.G.; Barettino, A.; Macias, A.; Gonzalo, P.; Andres-Manzano, M.J.; Gonzalez-Gomez, C.;
Galan-Arriola, C.; Alfonso, J.M.; Lobo, M.; et al. Generation and characterization of a novel knockin minipig
model of Hutchinson-Gilford progeria syndrome. Cell Discov. 2019, 5, 16. [CrossRef] [PubMed]
23. Hamczyk, M.R.; Andres, V. Vascular smooth muscle cell loss underpins the accelerated atherosclerosis in
Hutchinson-Gilford progeria syndrome. Nucleus 2019, 10, 28–34. [CrossRef] [PubMed]
24. Hamczyk, M.R.; Andres, V. Accelerated atherosclerosis in HGPS. Aging (Albany N. Y.) 2018, 10, 2555–2556.
[CrossRef] [PubMed]
25. Hamczyk, M.R.; Villa-Bellosta, R.; Quesada, V.; Gonzalo, P.; Vidak, S.; Nevado, R.M.; Andres-Manzano, M.J.;
Misteli, T.; Lopez-Otin, C.; Andres, V. Progerin accelerates atherosclerosis by inducing endoplasmic reticulum
stress in vascular smooth muscle cells. EMBO Mol. Med. 2019, 11, e9736. [CrossRef] [PubMed]
26. Villa-Bellosta, R.; Rivera-Torres, J.; Osorio, F.G.; Acin-Perez, R.; Enriquez, J.A.; Lopez-Otin, C.; Andres, V.
Defective extracellular pyrophosphate metabolism promotes vascular calcification in a mouse model of
Hutchinson-Gilford progeria syndrome that is ameliorated on pyrophosphate treatment. Circulation 2013,
127, 2442–2451. [CrossRef] [PubMed]
27. Villa-Bellosta, R. ATP-based therapy prevents vascular calcification and extends longevity in a mouse model
of Hutchinson-Gilford progeria syndrome. Proc. Natl. Acad. Sci. USA 2019, 116, 23698–23704. [CrossRef]
28. Villa-Bellosta, R. Dietary magnesium supplementation improves lifespan in a mouse model of progeria.
EMBO Mol. Med. 2020, e12423. [CrossRef]
29. Hamczyk, M.R.; Nevado, R.M.; Barettino, A.; Fuster, V.; Andres, V. Biological Versus Chronological Aging:
JACC Focus Seminar. J. Am. Coll. Cardiol. 2020, 75, 919–930. [CrossRef]Cells 2020, 9, 2252 19 of 19
30. Gordon, L.B.; Rothman, F.G.; Lopez-Otin, C.; Misteli, T. Progeria: A paradigm for translational medicine.
Cell 2014, 156, 400–407. [CrossRef]
31. Scaffidi, P.; Misteli, T. Lamin A-dependent nuclear defects in human aging. Science 2006, 312, 1059–1063.
[CrossRef]
© 2020 by the authors. Licensee MDPI, Basel, Switzerland. This article is an open access
article distributed under the terms and conditions of the Creative Commons Attribution
(CC BY) license (http://creativecommons.org/licenses/by/4.0/).You can also read