Distinct Chemical Changes in Abdominal but Not in Thoracic Aorta upon Atherosclerosis Studied Using Fiber Optic Raman Spectroscopy - MDPI
←
→
Page content transcription
If your browser does not render page correctly, please read the page content below
International Journal of
            Molecular Sciences

Article
Distinct Chemical Changes in Abdominal but Not in
Thoracic Aorta upon Atherosclerosis Studied Using
Fiber Optic Raman Spectroscopy
Krzysztof Czamara 1, *,† , Zuzanna Majka 1,† , Magdalena Sternak 1 , Mateusz Koziol 2 ,
Renata B. Kostogrys 3 , Stefan Chlopicki 1,4 and Agnieszka Kaczor 1,2, *
 1    Jagiellonian Centre for Experimental Therapeutics (JCET), Jagiellonian University, 14 Bobrzynskiego Str.,
      30-348 Krakow, Poland; zuzanna.majka@student.uj.edu.pl (Z.M.); magdalena.sternak@jcet.eu (M.S.);
      stefan.chlopicki@jcet.eu (S.C.)
 2    Faculty of Chemistry, Jagiellonian University, 2 Gronostajowa Str., 30-387 Krakow, Poland;
      mateusz.mk.koziol@gmail.com
 3    Department of Human Nutrition and Dietetics, Faculty of Food Technology, University of Agriculture H.
      Kollataja in Krakow, 122 Balicka Str., 30-149 Krakow, Poland; renata.kostogrys@urk.edu.pl
 4    Chair of Pharmacology, Jagiellonian University, 16 Grzegorzecka Str., 31-531 Krakow, Poland
 *    Correspondence: krzysztof.czamara@uj.edu.pl (K.C.); agnieszka.kaczor@uj.edu.pl (A.K.)
 †    These authors contributed equally to this work.

 Received: 4 June 2020; Accepted: 3 July 2020; Published: 8 July 2020

 Abstract: Fiber optic Raman spectroscopy and Raman microscopy were used to investigate alterations
 in the aorta wall and the surrounding perivascular adipose tissue (PVAT) in the murine model of
 atherosclerosis (Apoe-/- /Ldlr-/- mice). Both abdominal and thoracic parts of the aorta were studied to
 account for the heterogenic chemical composition of aorta and its localization-dependent response
 in progression of atherosclerosis. The average Raman spectra obtained for both parts of aorta cross
 sections revealed that the chemical composition of intima-media layers along aorta remains relatively
 homogeneous while the lipid content in the adventitia layer markedly increases with decreasing
 distance to PVAT. Moreover, our results demonstrate that the increase of the lipid to protein ratio in the
 aorta wall correlates directly with the increased unsaturation level of lipids in PVAT and these changes
 occur only in the abdominal, but not in thoracic, aorta. In summary, distinct pathophysiological
 response in the aortic vascular wall could be uncovered by fiber optic Raman spectroscopy based on
 simple parameters detecting chemical contents of lipids in PVAT.

 Keywords: perivascular adipose tissue; Raman spectroscopy; fiber optic probe; atherosclerosis;
 thoracic and abdominal aorta; vascular inflammation

1. Introduction
      Atherosclerosis is a main vascular pathology being an origin, among others, of coronary
artery disease and stroke underlying primary causes of death worldwide [1]. Atherosclerosis is
a progressive chronic metabolic disorder characterized by accumulation of lipids, inflammation,
and endothelial dysfunction leading to fibrosis and plaque formation within arteries [2]. The condition
of the cardiovascular system is regulated by the endothelium, the monolayer of highly-specialized
cells lining the blood and lymphatic vessels, which triggers atherosclerosis and other lifestyle diseases
when dysfunctional [3,4]. In general, all blood vessels in the circulation, except for cerebral arteries and
microvessels [5], are surrounded or embedded in perivascular adipose tissue (PVAT). Recent studies
have demonstrated that PVAT [6] is also substantially involved in the control of the circulatory system
and progression of atherosclerosis [6] suggesting that its occurrence is associated with the disease

Int. J. Mol. Sci. 2020, 21, 4838; doi:10.3390/ijms21144838                            www.mdpi.com/journal/ijms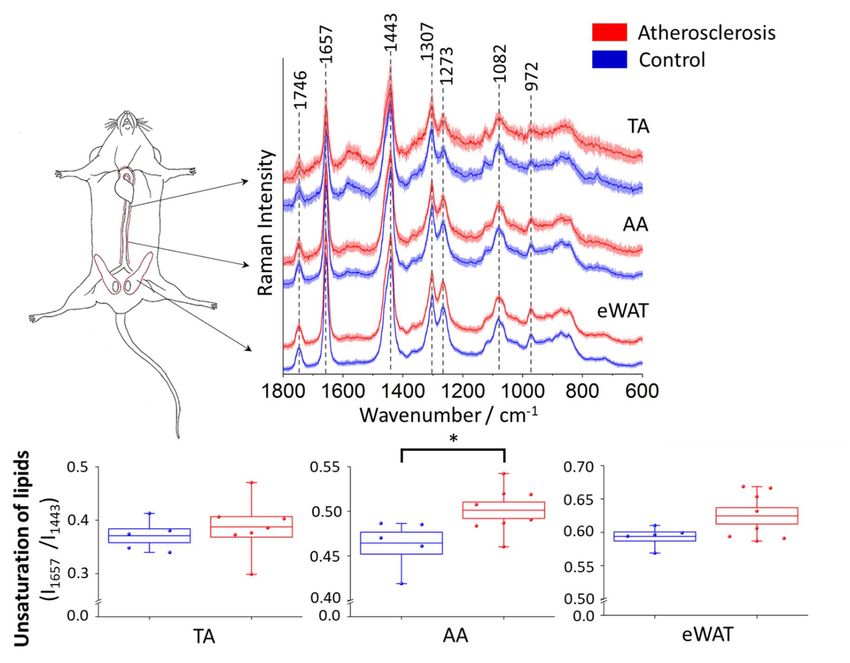
Int. J. Mol. Sci. 2020, 21, 4838                                                                      2 of 14

development [7]. The role of PVAT in atherosclerosis is like a double-edged sword. In healthy organisms
under physiological conditions, PVAT exhibits an anti-atherogenic properties by, i.e., the secretion of
adiponectin and the contribution to vascular NO production [8,9]. On the other hand, in dysfunctional
PVAT, the production of adiponectin is reduced in favor of leptin that is involved in macrophage
infiltration and release of pro-inflammatory cytokines [10]. Moreover, the phenotypic and functional
differences in PVAT, i.e., brown adipose tissue (BAT)-like characteristic of thoracic aorta (TA) PVAT
and white adipose tissue (WAT)-like of abdominal aorta (AA) PVAT, have an impact on susceptibility
to atherosclerosis [11]. In pathological conditions—i.e., in obesity—the higher level of fatty acids in
arterial circulation leads to excessive accumulation of triacylglycerols in AA PVAT and transformation
of TA PVAT into more white phenotype in a process called ‘whitening’ manifested by reduced
thermogenesis [12,13].
      The key risk factors of atherosclerosis, i.e., obesity [13–17] and hypercholesterolemia (independently
to obesity) [18–20] result in PVAT inflammation. Due to direct location of PVAT in close vicinity to
adventitia, facilitating the flow of adipokines, chemokines, and cytokines [16,21–23], inflammation in
PVAT undergoes a different mechanism compared to observed in the visceral fat [24] and may easily
propagate to the inner layers of the vessel wall triggering dysfunction of the smooth muscle cells and
endothelium that give momentum to atherosclerosis development [11]. The apparent influence of
PVAT on the vessel wall and direct cross-talk between these tissues [25–27] demonstrate that PVAT is a
new target of yet unexplored therapeutic potential.
      Raman spectroscopy is a label-free and unbiased method that simultaneously measures all
components of the sample and provides rich information not only about the sample composition,
but also the molecular structure of sample components. It can be used without any sample preparation,
for example for analysis of unfixed tissues as PVAT. This makes Raman spectroscopy a unique technique
to study tissues; particularly, it is well suited to investigate lipid alterations within. In addition to
the detection of lipids, Raman spectroscopy enables to specify the type and structure of lipids—i.e.,
fatty acids, triacylglycerols, cholesterol and its derivatives, phospholipids, etc. [28]—and can provide
quantitative information about the number of double bonds i.e., the degree of lipid unsaturation. It was
proven that unsaturation of lipid correlates to the iodine value, an analytical value often used as a
measure of unsaturation of lipids [29]. In other work, the lipid unsaturation of lipid droplets obtained
from Raman measurements was verified by Oil Red O staining (a ‘gold standard’ method to record the
total lipid content) [30]. Moreover, Maslak and colleagues presented an example in which they directly
correlated the results obtained from Raman spectra with GC/FID [31]. Hence, spectroscopic techniques
have been already validated and present a large potential in terms of possible applications for both:
diagnostics as well as routine screening of tissue sections. In our previous works, concentrated on
the endothelium, we have demonstrated in various murine models of lifestyle diseases that Raman
spectroscopy showed a diagnostic potential via studying effects of chemical changes, i.e., alterations in
concentration of biomolecules, induced in tissues under development of studied pathologies, translated
into the increase of the specific Raman markers of these diseases [32–38]. To approach applications
of the Raman-based methodology in intraoperative diagnostics, Raman spectroscopy with optical
fiber probes has been increasingly used, although at the moment mostly in the context of tumor
margin delineation [39–42]. However, in the proof-of-concept study by Matthäus et al. [43] fiber optic
Raman spectroscopy was applied for characterization of atherosclerotic plaque depositions in rabbits
in vivo. Moreover, we have also recently used fiber optic probe Raman spectroscopy as an efficient
tool for diagnostic of non-alcoholic fatty liver disease, a contraindication in a liver transplant [44].
We have also shown that due to significant Raman cross section for lipids, this methodology is very
suitable for studying PVAT [45]. Our results demonstrated that the lipid unsaturation degree was
clearly distinct in various types of the adipose tissue (WAT, BAT, TA, AA, and the mesenteric PVAT)
and was influenced by the age of animals clearly indicating that aging has a considerable impact
on the PVAT’s chemical composition [45]. To prove applicability of Raman-based methodology to
study PVAT of internal mammary artery (IMA) or other grafted vessels for purposes of intraoperative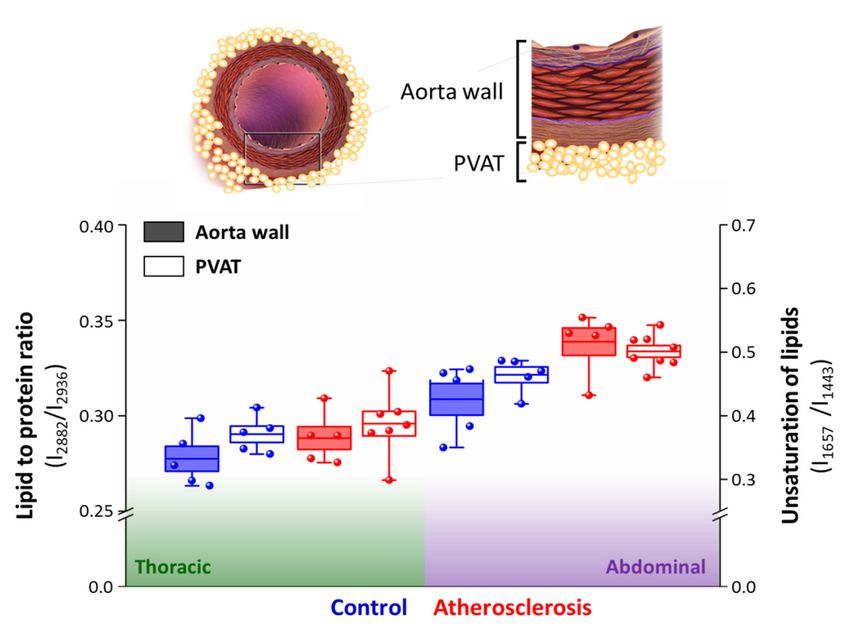
Int. J. Mol. Sci. 2020, 21, 4838 3 of 14
Int. J. Mol. Sci. 2020, 21, x FOR PEER REVIEW 3 of 14
diagnostics, fiber optic Raman spectroscopy was used to characterize lipid unsaturation and carotenoid
content
Gradingin PVAT
Scale,ofCCS
IMA II of or
patients (n = 10) withthe
III) undergoing advanced atherosclerosis
coronary artery bypass andsurgery
coronary[46]. artery disease
This study
(Canadian Cardiovascular
demonstrated that IMA Society
PVAT Angina
exhibited Grading
varyingScale, CCS of
degrees II or
theIII) undergoing
lipid unsaturationthe coronary artery
and carotenoid
bypass surgery
content. Most [46]. This study
importantly, demonstrated
a high that IMA
degree of lipid PVAT exhibited
unsaturation and lowvarying
carotenoiddegrees of the
content in lipid
PVAT
unsaturation
of IMA was found in patients with more advanced coronary artery disease, with CCS class low
and carotenoid content. Most importantly, a high degree of lipid unsaturation and III as
carotenoid
comparedcontent
to CCS in class
PVATIIofshowing
IMA wasthatfound in patients
these markerswithmaymore advanced
reflect the PVAT coronary artery status
functional disease,for
with CCS class III as compared to CCS class II showing that these
patients with advanced coronary atherosclerosis ongoing coronary bypass surgery. markers may reflect the PVAT
functional status
Here, we for patients
have used with
fiberadvanced
optic Ramancoronary atherosclerosis
spectroscopy ongoing coronary
to investigate bypass
the effects of surgery.
chemical
Here, we
alterations in have usedwall
the vessel fiberand
optic Raman
PVAT spectroscopy
due to to investigate
atherosclerosis in mice (Apoe the-/-/Ldlr
effects of chemical
-/- mice). We have
alterations in the vessel wall and PVAT due to atherosclerosis in mice (Apoe -/- /Ldlr-/- mice). We have
confirmed heterogeneity of the chemical composition of murine aorta vessel wall and aortic PVAT
confirmed heterogeneity
and demonstrated of the of
resistance chemical
thoraciccomposition of murine
but not abdominal aorta
aorta vessel
wall andwall and aorticPVAT
surrounding PVATto
and demonstrated resistance of thoracic but not abdominal aorta wall and
atherosclerosis-induced changes in lipids profile. Above all, we have proven that pathological surrounding PVAT to
atherosclerosis-induced changes in lipids profile. Above all, we have proven that
changes in lipid content in the vessel wall in abdominal aorta coexist with changes in lipid pathological changes
inunsaturation
lipid content in the vessel wall in abdominal aorta coexist with changes in lipid unsaturation in PVAT.
PVAT.
2. 2.
Results and
Results Discussion
and Discussion
Apoe/Ldlr
2.1. Spectral Characteristics of of
Aorta Layers inin
Apoe-/- -/- Mice
2.1. Spectral Characteristics Aorta Layers -/-/Ldlr-/- Mice
ToToinvestigate
investigatechemical
chemicalchanges
changesininthetheaorta
aortaupon
upondevelopment
developmentofofatherosclerosis
atherosclerosiswewefirstfirst
performed a comprehensive evaluation of the composition of both thoracic
performed a comprehensive evaluation of the composition of both thoracic and and abdominal
abdominalregions of
regions
the
ofaorta of a control
the aorta animals.animals.
of a control To investigate the composition
To investigate of the aortaofradially
the composition fromradially
the aorta the endothelial
from the
layer
endothelial layer to PVAT, Raman line mapping of aorta cross sections were done using theRaman
to PVAT, Raman line mapping of aorta cross sections were done using the confocal confocal
microscope (Figure 1A).
Raman microscope To analyze
(Figure 1A). To the chemical
analyze composition
the chemical along the
composition aorta
along thefrom the
aorta aortic
from thearch
aortic
toarch
common iliac artery Raman spectra of the split-open aorta wall (the intima/media
to common iliac artery Raman spectra of the split-open aorta wall (the intima/media layer) and layer) and
surrounding
surrounding PVAT
PVAT were
werecollected using
collected using thethe
fiber-optic
fiber-opticRaman
Ramansetup (Figure
setup 1B).1B).
(Figure
Figure 1. Scheme of the experiment design. An illustrative drawing of the experimental procedure of
Figure 1. Scheme of the experiment design. An illustrative drawing of the experimental procedure of
acquiring Raman spectra using confocal microscope for vessel cross sections (A) and Raman fiber optic
acquiring Raman spectra using confocal microscope for vessel cross sections (A) and Raman fiber
probe for split-open aorta (B). The distance between measured points for the aorta en face was 250 µm,
optic probe for split-open aorta (B). The distance between measured points for the aorta en face was
while for the vessel wall and PVAT was 5 and 10 µm, respectively.
250 µm, while for the vessel wall and PVAT was 5 and 10 µm, respectively.
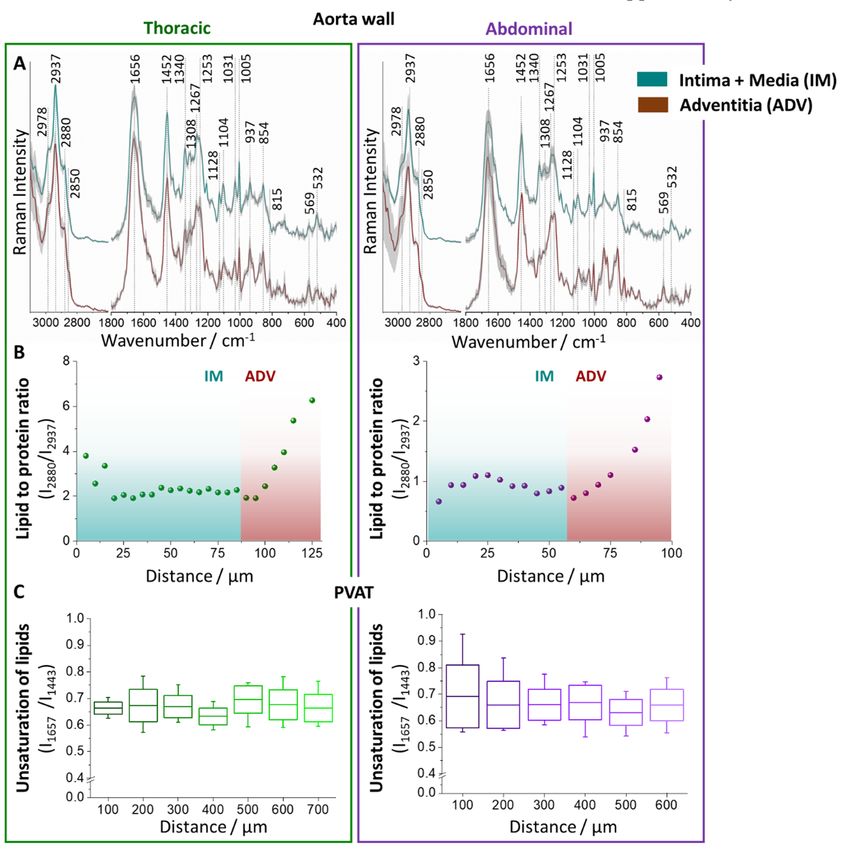
Due to their considerably different spectral characteristics, Raman spectra obtained from aorta
Due to their considerably different spectral characteristics, Raman spectra obtained from aorta
cross sections were classified as spectra of the PVAT and vessel wall than vessel wall spectra were
cross sections were classified as spectra of the PVAT and vessel wall than vessel wall spectra were
divided into two subgroups defined as spectra of the ‘inner’ part: intima and media layers (IM),
divided into two subgroups defined as spectra of the ‘inner’ part: intima and media layers (IM), and
and ‘outer’ part, i.e., adventitia layer (ADV, Figure 2A). In the IM layer, due to considerably smaller
‘outer’ part, i.e., adventitia layer (ADV, Figure 2A). In the IM layer, due to considerably smaller
thickness of the intima layer, the signal is derived predominantly from the media layer.
thickness of the intima layer, the signal is derived predominantly from the media layer.
Both IM and ADV possess distinct Raman spectral profiles and marker bands, enabling their
unambiguous classification that stays in accordance to the microarchitecture of the aorta wall [47].
IM is characterized by higher intensity of the bands at 1128, 1104, and 532 cm−1 arising from vibrations
of elastin fibers [48], while ADV can be identified by bands at 937, 854, 815, and 569 cm−1 originating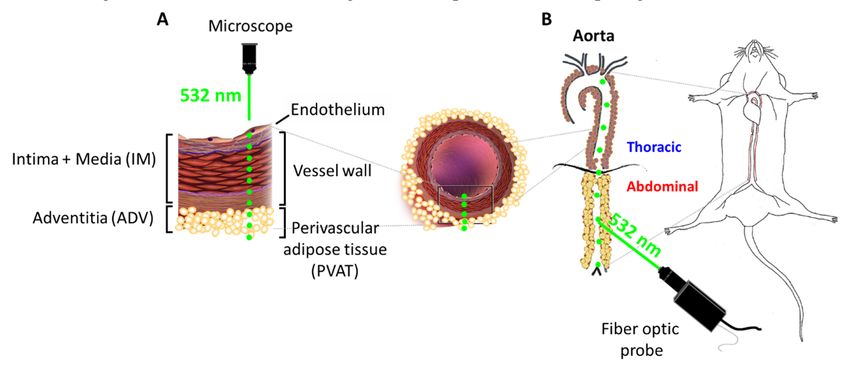
Int. J. Mol. Sci. 2020, 21, x FOR PEER REVIEW                                                                          4 of 14

form collagen [49] with the most distinctive band at 815 cm−1 absent in the Raman spectrum of IM.
  Int. J. Mol. Sci. 2020, 21, 4838                                                              4 of 14
The lipid content in the tissue increases in the (intuitive) order: IM < ADV < PVAT. Assignments of
Raman bands of the aorta wall tissue and PVAT are collected in Table S1 (Supplementary Materials).

        Figure
     Figure     2. Aorta
            2. Aorta   wallwall
                             andand
                                 PVATPVAT  chemical
                                        chemical     characteristics.
                                                  characteristics. TheThe  average
                                                                        average     Raman
                                                                                 Raman        spectra
                                                                                           spectra  (A)(A) and
                                                                                                         and  thethe  lipid
                                                                                                                  lipid
        and protein  alterations  along the aorta cross section (B) in intima  and media    (IM), and
     and protein alterations along the aorta cross section (B) in intima and media (IM), and adventitiaadventitia   (ADV)
        layers
     (ADV)     of theofvessel
             layers           wall of
                         the vessel   thoracic
                                    wall        and abdominal
                                         of thoracic             aorta. aorta.
                                                     and abdominal      The analysis  of lipidofunsaturation
                                                                               The analysis                     degree of
                                                                                                  lipid unsaturation
        PVAT
     degree  of(C).
                PVATValues   given as
                        (C). Values    mean
                                     given as ±mean
                                                SEM±are
                                                      SEM shown   in boxinplots:
                                                            are shown            mean
                                                                           box plots:   (horizontal
                                                                                      mean             line),
                                                                                              (horizontal     SEM
                                                                                                           line), SEM(box),
        minimal,   and  maximal   values  (whiskers).
     (box), minimal, and maximal values (whiskers).

         Both Composition
2.2. Distinct   IM and ADV       possess
                              of the       distinct
                                     Adventitia  andRaman
                                                      PVAT in spectral  profiles
                                                                 Abdominal       and marker
                                                                             and Thoracic Aortabands,
                                                                                                  in Apoeenabling
                                                                                                           -/-/Ldlr-/- their
   unambiguous
Mice                  classification  that  stays  in accordance    to the microarchitecture    of  the  aorta   wall [47].
                                                                                            −1
   IM is characterized by higher intensity of the bands at 1128, 1104, and 532 cm arising from vibrations
   of The   comparison
      elastin  fibers [48],of  average
                            while   ADVRaman        spectra obtained
                                          can be identified    by bands for
                                                                          at TA
                                                                             937,and
                                                                                  854,AA
                                                                                       815,revealed
                                                                                            and 569 cm  that
                                                                                                          −1 chemical
                                                                                                               originating
composition
   form collagen of IM  along
                     [49] withaorta    remains
                                 the most        relatively
                                            distinctive      homogeneous
                                                          band   at 815 cm as
                                                                           −1    the spectra
                                                                              absent           of IM are
                                                                                      in the Raman          almost of
                                                                                                        spectrum       theIM.
same    and  independent      on  the  distance   from   the endothelium     whilst the  chemical
   The lipid content in the tissue increases in the (intuitive) order: IM < ADV < PVAT. Assignments   composition       of of
ADV    is considerably    different  depending     on  the distance  from  PVAT.   The  analysis   of
   Raman bands of the aorta wall tissue and PVAT are collected in Table S1 (Supplementary Materials). lipid   to protein
ratio (I2880/I2937) obtained by calculations of the integral intensities of bands at 2880 and 2937 cm−1 is
presented     in Figure
   2.2. Distinct          2B. Itofshows
                   Composition             that theand
                                   the Adventitia     lipid content
                                                         PVAT         in the and
                                                               in Abdominal   ADV   markedly
                                                                                  Thoracic         in Apoe-/- /Ldlr
                                                                                           Aortaincreases      with-/- the
                                                                                                                        Mice
decrease of the distance to PVAT both for TA and AA, demonstrating possible infiltration of PVAT
         The comparison of average Raman spectra obtained for TA and AA revealed that chemical
lipids to the adventitia layer. Moreover, the clear discrimination of IM and ADV can be done based
   composition of IM along aorta remains relatively homogeneous as the spectra of IM are almost the
on the lipid to protein ratio in the tissue.
   same and independent on the distance from the endothelium whilst the chemical composition of
   ADV is considerably different depending on the distance from PVAT. The analysis of lipid to protein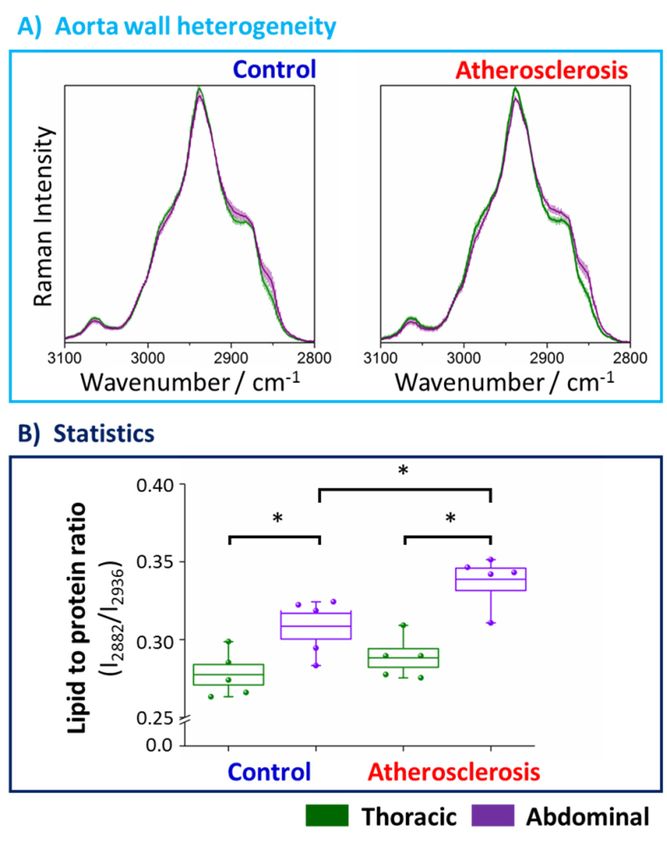
Int. J. Mol. Sci. 2020, 21, 4838                                                                      5 of 14

ratio (I2880 /I2937 ) obtained by calculations of the integral intensities of bands at 2880 and 2937 cm−1 is
presented in Figure 2B. It shows that the lipid content in the ADV markedly increases with the decrease
of the distance to PVAT both for TA and AA, demonstrating possible infiltration of PVAT lipids to the
adventitia layer. Moreover, the clear discrimination of IM and ADV can be done based on the lipid to
protein ratio in the tissue.
      The chemical characterization of PVAT was also performed. Due to a substantial number of PVAT
Raman spectra obtained from each measurement series, we averaged 10 consecutive spectra (measured
with a sampling density of 10 µm) and used the averaged spectra for the calculations of the intensity of
bands at 1657 and 1443 cm−1 to determine lipid unsaturation (Figure 2C). The lipid to protein marker
in this case is not valid as the protein content in PVAT is very low. In general, Figure 2C shows that the
chemical composition of PVAT is quite uniform and homogenous in the studied scale.
      This important part of the study demonstrates that IM and PVAT, but not ADV, are chemically rather
homogenous. Therefore, IM and PVAT were investigated using the fiber optic Raman spectroscopy to
analyze the impact of atherosclerosis on local changes in the aorta in the abdominal and thoracic parts.

2.3. Media Layer in Abdominal, but not Thoracic, Aorta Display Alterations in Lipid Content in
Apoe-/- /Ldlr-/- Mice
      To define the chemical changes due to the progression of the atherosclerosis, fiber optic Raman
spectroscopy was applied for point by point measurement of the vessel wall along the long axis from
the endothelial side (the en face aorta). The Raman spectra in the high-wavenumber range averaged
over 5 animals (24 spectra per animal) of the thoracic (denoted green) and abdominal (denoted violet)
parts of the aorta wall are presented in Figure 3 (Figure S1, Supplementary Materials, shows also the
fingerprint range).
      Values of integral intensities of bands at 2882 and 2936 cm−1 , assigned mostly to lipids and
proteins, respectively, were used in the statistical analysis as the markers of the chemical composition
of the tissue. Standard deviations of the spectra between animals from the same group are relatively
small which reflect small spectral intravariability per group. However, differences between spectra per
animal are relatively high (Figure S2, Supplementary Materials), therefore we averaged several (24)
spectra per animal. Figure 3A shows the comparison of Raman signatures of the averaged thoracic
and abdominal fragments of the aorta wall indicating clearly that the chemical composition of the
thoracic and abdominal aorta both for the control group and, particularly for the mice with developed
atherosclerosis, is different.
      The influence of the atherosclerosis on the chemical composition of thoracic and abdominal parts
of the aorta wall was studied. Clearly, there are no considerable alterations in the Raman signatures
and, therefore, in the composition of the TA, whilst in the AA subtle changes in the averaged Raman
spectrum are observed (Figure S2A, Supplementary Materials). To explore semi-quantitatively this
effect, integral intensities of the components of the bands at positions 2882 cm−1 (mostly due to
lipids) and 2936 cm−1 (mostly due to proteins) were calculated and presented as the ratio in Figure 3B.
The lipid to protein ratio is significantly bigger for the abdominal aorta compared to the thoracic
part demonstrating clearly heterogeneity of the aorta composition and showing that the wall of the
abdominal aorta contains more lipids compared to the thoracic aorta (Figure 3A) and this effect is
more accentuated for subjects with developed atherosclerosis (17.7%) relatively to the control group
(11.6%). Moreover, the lipid to protein ratio significantly changes (9.7%) in the abdominal (but not
thoracic) part of the aorta wall showing that progression of the disease affects the AA, whilst the TA is
resistant to atherosclerosis-induced changes in lipid content, even at the late stage of the atherosclerosis
development (22 weeks). The increased lipid content in the abdominal part is also reflected in the
fingerprint spectral region where the signal at 704 cm−1 arising from cholesterols is clearly visible
for the atherosclerotic group (Figure S1B, Supplementary Materials). Therefore, the accumulation
of lipids (among others, cholesterol) occurs in the abdominal part of the aorta, but this effect is not
2.3. Media Layer in Abdominal, but not Thoracic, Aorta Display Alterations in Lipid Content in Apoe-/-/Ldlr-
/- Mice
To define the chemical changes due to the progression of the atherosclerosis, fiber optic Raman
spectroscopy
Int. J. Mol. Sci.was
2020,applied
21, 4838 for point by point measurement of the vessel wall along the long axis from 6 of 14
the endothelial side (the en face aorta). The Raman spectra in the high-wavenumber range averaged
over 5 animals (24 spectra per animal) of the thoracic (denoted green) and abdominal (denoted violet)
observed
parts for thewall
of the aorta thoracic part that seems
are presented to be
in Figure resistantS1,
3 (Figure forSupplementary
lipid accumulation even atshows
Materials, this late
alsolevel
the of
atherosclerosis
fingerprint range). progression as evidenced by fiber optic Raman spectroscopy.
Figure 3. Averaged Raman spectra and the statistical analysis of the lipid to protein ratio of the thoracic
Figure 3. Averaged Raman spectra and the statistical analysis of the lipid to protein ratio of the
and abdominal fragments of the aorta wall upon atherosclerosis development. Averaged Raman
thoracic and abdominal fragments of the aorta wall upon atherosclerosis development. Averaged
spectra of the thoracic (green) and abdominal (violet) aorta wall obtained from the control group
Raman spectra of the thoracic (green) and abdominal (violet) aorta wall obtained from the control
(blue) and animals with developed atherosclerosis (red) (A). Spectra were normalized and presented
group (blue) and animals with developed atherosclerosis (red) (A). Spectra were normalized and
with the standard deviation on each data point (accordingly lighter color). The analysis of the lipid to
presented with the standard deviation on each data point (accordingly lighter color). The analysis of −1
protein ratio (B) was calculated using the integral intensities of bands at positions 2882 and 2936 cm .
the lipid to protein ratio (B) was calculated using the integral intensities of bands at positions 2882
Values were shown in the box plots: mean (horizontal line), SEM (box), minimal and maximal values
and 2936 cm−1. Values were shown in the box plots: mean (horizontal line), SEM (box), minimal and
(whiskers). The level of statistical significance: * pInt. J. Mol. Sci. 2020, 21, 4838 7 of 14
In order to investigate the impact of atherosclerosis on perivascular adipose tissue, in particular
TA and AA parts of PVAT, the averaged Raman spectra (5 animals in each group, at least 7 spectra
per animal) of TA and AA PVAT were analyzed (Figure 4). Additionally, the white adipose tissue
Int. J. Mol. Sci. 2020, 21, x FOR PEER REVIEW 7 of 14
surrounding epididymis (eWAT) was studied for comparison.
A
B
Figure 4. Averaged
Figure Raman spectra
4. Averaged Raman of the thoracic
spectra and abdominal
of the thoracic PVAT and
and abdominal epididymal
PVAT adipose tissue
and epididymal adipose
and statistical analysis of unsaturation of lipids. Averaged Raman spectra (A) in the fingerprint
tissue and statistical analysis of unsaturation of lipids. Averaged Raman spectra (A) in the fingerprint region
region of(TA)
of the thoracic the thoracic (TA) and (AA)
and abdominal abdominal
PVAT(AA)andPVAT and the epididymal
the epididymal adipose adipose tissue (eWAT)
tissue (eWAT) for thefor
control the control group (blue) and animal with developed atherosclerosis (red) presented with the standard
group (blue) and animal with developed atherosclerosis (red) presented with the standard
deviationdeviation
on eachon each
data data point.
point. The analysis
The analysis of theoflipid
the lipid unsaturation
unsaturation levellevel (B) calculated
(B) calculated as the
as the ratio
ratio of of
integralintegral −1
intensities
intensities of bands of at
bands
1657atand
1657 andcm
1443 1443.cm −1. Values
Values werewere
shownshown in box
in box plots:
plots: meanmean (horizontal
(horizontal
line),
line), SEM SEMminimal
(box), (box), minimal and maximal
and maximal valuesvalues (whiskers).
(whiskers). The level
The level of statistical
of statistical * p TA. A semi-quantitative > AA > TA. A semi-
quantitative
estimation estimation
of the ratio of 1657 of the1443
and ratiocm of−11657 andreflecting
bands, 1443 cm−1the bands,
lipidreflecting the lipid
unsaturation unsaturation
degree [28,45],
degree [28,45], is shown in Figure 4B. The results exhibit that the change of the lipid unsaturation
is shown in Figure 4B. The results exhibit that the change of the lipid unsaturation ratio is the most
ratio is the most prominent (and statistically significant) for the abdominal PVAT (8.0%). For eWAT,
prominent (and statistically significant) for the abdominal PVAT (8.0%). For eWAT, a slight (5.2%
a slight (5.2% and statistically insignificant) increase in the lipid unsaturation is observed, whilst for
and statistically insignificant) increase in the lipid unsaturation is observed, whilst for the thoracic
the thoracic PVAT there is practically no change in this parameter. Therefore, although the basal level
PVAT there is practically no change in this parameter. Therefore, although the basal level of lipid
of lipid unsaturation is lower in the abdominal PVAT than in eWAT, the phenotype of the abdominal
unsaturation is lower in the abdominal PVAT than in eWAT, the phenotype of the abdominal PVAT
PVAT (reflected in this case in lipid unsaturation) converts readily into WAT-like phenotype, i.e.,
considerable whitening of the abdominal (but not thoracic) PVAT occurs due to atherosclerosis
progression. A direct comparison between atherosclerosis-induced alterations in the inner layers
(intima and media) and surrounding PVAT is made below.Int. J. Mol. Sci. 2020, 21, x FOR PEER REVIEW 8 of 14
2.5. Alterations in PVAT and Vessel Wall Coexist in Abdominal Aorta in Apoe-/-/Ldlr-/- Mice
Int. J. Mol. Sci. 2020, 21, 4838 8 of 14
Overall, the impact of atherosclerosis both on the aorta wall and surrounding PVAT is
significantly manifested only in the abdominal part of the aorta (Figure 5). Contrarily, the thoracic
(reflected
part of theinaorta
this case
and in lipidisunsaturation)
PVAT converts readily into WAT-like
resistant to atherosclerosis-induced phenotype,
changes i.e., considerable
in lipid content, as shown
whitening of the abdominal (but not thoracic) PVAT occurs due to atherosclerosis progression.
by lack of chemical changes in the Raman spectra of these tissues. WAT-like (i.e., more prone A direct
to
comparison
inflammation, between atherosclerosis-induced
antiatherogenic) and BAT-like alterations in the inner
(i.e., resistant layers (intima and
to inflammation, media) and
proatherogenic)
surrounding
phenotypes of PVAT is madeand
the adipose below.
thoracic parts of PVAT [11], respectively, are reflected in the different
basal levels of lipid unsaturation in these tissues. The increase of the unsaturated lipid content is
2.5. Alterations
associated with in increased
PVAT and Vessel
lipid Wall
acid Coexist in Abdominal
desaturase activityAorta
and in Apoe-/- /Ldlr
indicates
-/- Mice
inflammation as shown
previously
Overall,studying non-alcoholic
the impact fatty liver
of atherosclerosis bothdisease progression
on the aorta wall and[55]. Analogically,
surrounding PVATthe augmented
is significantly
level of the lipid unsaturation ratio is a hallmark of inflammation in endothelial
manifested only in the abdominal part of the aorta (Figure 5). Contrarily, the thoracic part of the cells [56].
aortaStrikingly,
and PVAT the increasetoofatherosclerosis-induced
is resistant the unsaturation level of lipids in
changes in PVAT correlates
lipid content, directlybywith
as shown lackthe
of
increase of
chemical the lipid-to-protein
changes in the Ramanratio in the
spectra of aorta
thesewall, comparing
tissues. WAT-like both
(i.e.,the basal
more levels
prone toand changes in
inflammation,
the respective values
antiatherogenic) (Figure 5).
and BAT-like It was
(i.e., demonstrated
resistant previously
to inflammation, on big cohorts
proatherogenic) of patientsofwith
phenotypes the
atherosclerosis and diabetes that although adiponectin serum levels in these
adipose and thoracic parts of PVAT [11], respectively, are reflected in the different basal levels pathologies are inversely
of lipid
correlated with
unsaturation the vascular
in these tissues. NADHP
The increase oxidase activity
of the and superoxide
unsaturated lipid content •O2− levels, PVAT responses to
is associated with increased
the increased NADHP oxidase activity in underlying vessels via
lipid acid desaturase activity and indicates inflammation as shown previously studyingupregulation of adiponectin gene
non-alcoholic
expression
fatty [25,27].progression
liver disease Vascular upregulation of PVAT
[55]. Analogically, theadiponectin
augmented clearly
level ofdemonstrates the existence
the lipid unsaturation ratio of
is
a direct cross-talk between the vascular
a hallmark of inflammation in endothelial cells [56].arterial wall and the surrounding PVAT [25,27].
Figure 5. Correlation of atherosclerosis-induced alterations in the aorta wall and surrounding PVAT.
Figure 5. Correlation of atherosclerosis-induced alterations in the aorta wall and surrounding PVAT.
The comparison of the lipid to protein ratio of the aorta wall tissue and unsaturation of lipids of PVAT
The comparison of the lipid to protein ratio of the aorta wall tissue and unsaturation of lipids of PVAT
were calculated using the ratio of integral intensities of bands at 2882–2936 cm−1−1 and 1657–1443 cm−1 ,
were calculated using the ratio of integral intensities of bands at 2882–2936 cm and 1657–1443 cm−1,
respectively. Values were shown in box plots: mean (horizontal line), SEM (box), minimal and maximal
respectively. Values were shown in box plots: mean (horizontal line), SEM (box), minimal and
values (whiskers). Significance of pairwise analysis are presented in Figures 3 and 4.
maximal values (whiskers). Significance of pairwise analysis are presented in Figures 3 and 4.
Strikingly, the increase of the unsaturation level of lipids in PVAT correlates directly with the
Apparently, these interactions between the vessel wall and the surrounding PVAT [25,27] are
increase of the lipid-to-protein ratio in the aorta wall, comparing both the basal levels and changes
reflected also in considerable and consistent changes in the chemical composition of the intima/media
in the respective values (Figure 5). It was demonstrated previously on big cohorts of patients with
layer and PVAT, which may be important in the context of future diagnostic and therapeutic
atherosclerosis and diabetes that although adiponectin serum levels in these pathologies are inversely
strategies.
correlated with the vascular NADHP oxidase activity and superoxide • O2 − levels, PVAT responses to
the increased NADHP oxidase activity in underlying vessels via upregulation of adiponectin gene
expression [25,27]. Vascular upregulation of PVAT adiponectin clearly demonstrates the existence of a
direct cross-talk between the vascular arterial wall and the surrounding PVAT [25,27].Int. J. Mol. Sci. 2020, 21, 4838 9 of 14
Apparently, these interactions between the vessel wall and the surrounding PVAT [25,27] are
reflected also in considerable and consistent changes in the chemical composition of the intima/media
layer and PVAT, which may be important in the context of future diagnostic and therapeutic strategies.
3. Materials and Methods
3.1. Preparation of Samples
The samples of the aorta with perivascular adipose tissue (PVAT) and epididymal white adipose
tissue (eWAT) were isolated from male mice with developed atherosclerosis (murine model Apoe-/- /Ldlr-/- )
at the age of 22 weeks (n = 5). Male C57Bl/6 age matched animals (n = 5) were taken as a control.
In order to exclude additional factors that could disturb the results, and because the male mice model
is more stable, we used only males. The Apoe-/- /Ldlr-/- murine model developed initially by Ishibashi
and coworkers [57] represents a validated model of murine atherosclerosis as shown in numerous
previous studies from our group using various methodologies [51,58–60] including also Raman and IR
spectroscopy [32,61,62].
After the resection, the aorta was rinsed from the blood residue inside the vessel and cleansed
from the surrounding adipose tissue. Then, the aorta was split open along the axis of blood (the aorta
en face patches). The expanded blood vessel was placed on a Cell-Tak® -coated CaF2 slide so that the
endothelial layer faced up. Placed on the plate, the tissue fragment was rinsed with physiological
saline and then fixed with a 4% formaldehyde solution for 10 min. The final step was to rinse the
tissues twice with distilled water and leave to dry. PVAT from the thoracic part of the aorta and the
abdominal cavity were identified as the thoracic and abdominal PVAT, respectively [63]. The fresh
fragments of the PVAT adipose tissue were rinsed in NaCl isotonic solution and placed on a CaF2
slide. The same procedure as for PVAT was applied to the epididymal white adipose tissue (eWAT)
which was taken from depots surrounding epididymis and testicles [63]. Such prepared (unfixed)
fragments were measured by fiber optic Raman spectroscopy. All experimental procedures involving
animals were conducted according to the Guidelines for Animal Care and Treatment of the European
Communities and the Guide for the Care and Use of Laboratory Animals published by the US National
Institutes of Health (NIH Publication No. 85–23, revised 1996). All procedures were approved by the
Local Ethical Committee on Animal Experiments (permit 212/2105).
To establish the chemical alterations in the aorta wall and surrounding perivascular adipose tissue
freshly isolated aortas with PVAT from control C57BL/6 mice (n = 3) were studied. Fragments of the
thoracic and abdominal aorta were rinsed with PBS, cut into ca. 2 mm cross section slices, placed onto
Cell-Tak® -coated CaF2 slides, and maintained in PBS until Raman measurements.
3.2. Instrumentation
Samples of the aorta wall and PVAT were measured using a prototype of a portable WITec Alpha
Cart system. The system is equipped with a low-noise CCD detector (Andor, Oxfordshire, England),
spectrograph (600 lines per mm grating), air-cooled solid state laser with an excitation wavelength of
532 nm. Laser light was provided via a photonic fiber (3.5 µm) and focused onto a sample with a fiber
optic Raman probe tipped with an air objective (Zeiss, 10× magnification, NA = 0.23). Spectra were
obtained by averaging 30 accumulations with 1 s integration time, using the maximum laser power
of ca. 28 mW. For PVAT at least seven good quality spectra for each animal were taken for analysis.
Raman spectra of the aorta wall were recorded along the tissue, i.e., from the thoracic section to the
abdominal section with the step of 250 µm. The first 24 spectra were identified as the thoracic section
and last 24 as the abdominal section. The 24 spectra of each section were averaged.
The Raman measurements of fresh cross sections of the aorta wall with PVAT were performed
with confocal Raman system WITec Alpha300 equipped with a CCD detector (DU 401-BV, Andor,
Oxfordshire, England), a 600 mm−1 grating and a 63× water immersive objective (Zeiss, NA = 1.0).
Spectra were collected point-by-point from the artery lumen to the edge of PVAT every 5 and 10 µm forInt. J. Mol. Sci. 2020, 21, 4838 10 of 14
aorta wall and PVAT, respectively. Samples were illuminated with air-cooled solid-state laser with an
excitation of 532 nm using ca. 28 mW power. For acquisition of each Raman spectra 10 accumulations
and 1 s integration time were used.
3.3. Data Analysis
Preprocessing was done using the WITec Project Plus software and included baseline-correction
using autopolynomial of degree 3 and cosmic ray removal procedure. In the second stage, Raman spectra
were normalized using vector normalization in the 3100–2800 cm−1 or 1800–400 cm−1 spectral ranges
using the OPUS 7.2 program (Billerica, MA, USA). Furthermore, in the averaged spectra of various tissue
fragments, the integral intensity of the bands in the ranges of 3030–2900 cm−1 , 2900–2840 cm−1 ; and at
1660, 1445, and 1519 cm−1 were calculated. The following ratios of bands: 2900–2840/3030–2900 cm−1
and 1660/1445 cm−1 were used to determine the lipid to protein ratio and unsaturation of lipids,
respectively. The data were compared in the Origin Pro 9.1 program (Northampton, ma, USA) using
the ANOVA variance analysis with the Tukey post hoc test. If the p parameter was at most 0.05,
differences were identified as statistically significant.
4. Conclusions
Susceptibility to atherosclerosis of the abdominal aorta was previously demonstrated using other
methods—i.e., MRI, AFM, and EPR—presenting multifactorial response involving inter alia endothelial
stiffness and diminished glycocalyx coverage at the early stage of disease before the development of
atherosclerotic plaques [51]. Our work taking advantage of fiber-optic Raman spectroscopy underlines
that the abdominal and thoracic parts of the aorta respond differently for the atherosclerosis-induced
changes in lipid content. Although in control mice the thoracic part of the vessel wall (both IM and
ADV) has a higher basal lipid content than the abdominal part, in studied Apoe-/- /Ldlr-/- mice with
atherosclerosis only the abdominal aorta displays changes in lipids that were surprisingly present
in PVAT (the increase of unsaturation ratio) as well as in the vascular wall (the increase in the
lipid-to-protein ratio). These results underscore a possible primary role of PVAT in the alterations of
the lipid contents of the vessel wall. Accordingly, fiber optic Raman spectroscopy based on simple
parameters detecting chemical contents of lipids in PVAT may provide a quick test to exclude or suggest
a possible alterations in lipid composition in the media layer of the vascular wall. This hypothesis will
be further studied in a clinically-relevant context.
Supplementary Materials: Supplementary materials can be found at http://www.mdpi.com/1422-0067/21/14/4838/s1.
Author Contributions: Conceptualization, A.K. and K.C.; Methodology, A.K., K.C., Z.M., and S.C.; Investigation,
Z.M., K.C., and M.K.; Resources, R.B.K.; Preparation of murine aorta en face patches, M.S.; Preparation of aorta
cross sections and adipose tissue samples, K.C.; Data analysis, K.C., Z.M., M.K., S.C., and A.K.; Writing—original
draft preparation, K.C. and A.K.; Writing—review and editing, A.K., R.B.K., and S.C.; Visualization, K.C.;
Supervision, A.K. and S.C.; Funding acquisition, A.K. All authors have read and agreed to the published version
of the manuscript.
Funding: This research was funded by the National Science Center Poland (NCN), OPUS9 no. 2015/17/B/ST4/03894
and OPUS17 no. 2019/33/B/ST4/00878 to A.K. K.C. thanks to National Science Centre, Poland MINIATURA2
no. DEC-2018/02/X/ST4/02745. K.C. was supported by Foundation for Polish Science (FNP, START2020 program).
Conflicts of Interest: The authors declare no conflicts of interest.Int. J. Mol. Sci. 2020, 21, 4838 11 of 14
Abbreviations
AA Abdominal aorta
ADV Adventitia layer of aorta wall
Apoe-/- /Ldlr-/ ApoE and LDL receptor double knockout mice
BAT Brown adipose tissue
CCS II/III Canadian Cardiovascular Society Angina Grading Scale II or III
eWAT Epididymal white adipose tissue
IM Intima and media layers of aorta wall
IMA Internal mammary artery
NO Nitric oxide
PVAT Perivascular adipose tissue
TA Thoracic aorta
WAT White adipose tissue
References
1. Finegold, J.A.; Asaria, P.; Francis, D.P. Mortality from ischaemic heart disease by country, region, and age:
Statistics from World Health Organisation and United Nations. Int. J. Cardiol. 2013, 168, 934–945. [CrossRef]
[PubMed]
2. Lusis, A.J. Atherosclerosis—Insight Review Articles. Nature 2000, 407, 233–241. [CrossRef] [PubMed]
3. Davignon, J.; Ganz, P. Role of endothelial dysfunction in atherosclerosis. Circulation 2004, 109, 27–32.
[CrossRef] [PubMed]
4. Rajendran, P.; Rengarajan, T.; Thangavel, J.; Nishigaki, Y.; Sakthisekaran, D.; Sethi, G.; Nishigaki, I.
The vascular endothelium and human diseases. Int. J. Biol. Sci. 2013, 9, 1057–1069. [CrossRef]
5. Tanaka, K.; Sata, M. Roles of perivascular adipose tissue in the pathogenesis of atherosclerosis. Front. Physiol.
2018, 9, 1–9. [CrossRef]
6. Qi, X.Y.; Qu, S.L.; Xiong, W.H.; Rom, O.; Chang, L.; Jiang, Z.S. Perivascular adipose tissue (PVAT) in
atherosclerosis: A double-edged sword. Cardiovasc. Diabetol. 2018, 17, 1–20. [CrossRef]
7. Getz, G.S.; Reardon, C.A. Animal Models of atherosclerosis. Arterioscler. Thromb. Vasc. Biol. 2012, 32, 1104–1115.
[CrossRef]
8. Virdis, A.; Duranti, E.; Rossi, C.; Dell’ Agnello, U.; Santini, E.; Anselmino, M.; Chiarugi, M.; Taddei, S.;
Solini, A. Tumour necrosis factor-alpha participates on the endothelin-1/nitric oxide imbalance in small
arteries from obese patients: Role of perivascular adipose tissue. Eur. Heart J. 2015, 36, 784–794. [CrossRef]
9. Sena, C.M.; Pereira, A.; Fernandes, R.; Letra, L.; Seiça, R.M. Adiponectin improves endothelial function in
mesenteric arteries of rats fed a high-fat diet: Role of perivascular adipose tissue. Br. J. Pharmacol. 2017,
174, 3514–3526. [CrossRef]
10. La Cava, A. Leptin in inflammation and autoimmunity. Cytokine 2017, 98, 51–58. [CrossRef]
11. Van Dam, A.D.; Boon, M.R.; Berbée, J.F.P.; Rensen, P.C.N.; van Harmelen, V. Targeting white, brown and
perivascular adipose tissue in atherosclerosis development. Eur. J. Pharmacol. 2017, 816, 82–92. [CrossRef]
[PubMed]
12. Shimizu, I.; Aprahamian, T.; Kikuchi, R.; Shimizu, A.; Papanicolaou, K.N.; MacLauchlan, S.; Maruyama, S.;
Walsh, K. Vascular rarefaction mediates whitening of brown fat in obesity. J. Clin. Investig. 2014, 124, 2099–2112.
[CrossRef] [PubMed]
13. Fernández-Alfonso, M.S.; Gil-Ortega, M.; García-Prieto, C.F.; Aranguez, I.; Ruiz-Gayo, M.; Somoza, B.
Mechanisms of perivascular adipose tissue dysfunction in obesity. Int. J. Endocrinol. 2013, 2013, 10–13.
[CrossRef]
14. Police, S.B.; Thatcher, S.E.; Charnigo, R.; Daugherty, A.; Cassis, L.A. Obesity promotes inflammation in periaortic
adipose tissue and angiotensin ii-induced abdominal aortic aneurysm formation. Arterioscler. Thromb. Vasc. Biol.
2009, 29, 1458–1464. [CrossRef] [PubMed]
15. Fitzgibbons, T.P.; Czech, M.P. Epicardial and perivascular adipose tissues and their influence on cardiovascular
disease: Basic mechanisms and clinical associations. J. Am. Heart Assoc. 2014, 3, 1–16. [CrossRef]Int. J. Mol. Sci. 2020, 21, 4838 12 of 14
16. Chatterjee, T.K.; Stoll, L.L.; Denning, G.M.; Harrelson, A.; Blomkalns, A.L.; Idelman, G.; Rothenberg, F.G.;
Neltner, B.; Romig-Martin, S.A.; Dickson, E.W.; et al. Proinflammatory phenotype of perivascular adipocytes:
Influence of high-fat feeding. Circ. Res. 2009, 104, 541–549. [CrossRef]
17. Szasz, T.; Webb, C. Perivascular adipose tissue: More than just structural support. Clin. Sci. 2012, 122, 1–12.
[CrossRef]
18. Lohmann, C.; Schäfer, N.; von Lukowicz, T.; Sokrates Stein, M.A.; Borén, J.; Rütti, S.; Wahli, W.; Donath, M.Y.;
Lüscher, T.F.; Matter, C.M. Atherosclerotic mice exhibit systemic inflammation in periadventitial and visceral
adipose tissue, liver, and pancreatic islets. Atherosclerosis 2009, 207, 360–367. [CrossRef]
19. Hoeke, G.; Kooijman, S.; Boon, M.R.; Rensen, P.C.N.; Berbeé, J.F.P. Role of Brown Fat in Lipoprotein
Metabolism and Atherosclerosis. Circ. Res. 2016, 118, 173–182. [CrossRef]
20. Berbeé, J.F.P.; Boon, M.R.; Khedoe, P.P.S.J.; Bartelt, A.; Schlein, C.; Worthmann, A.; Kooijman, S.; Hoeke, G.;
Mol, I.M.; John, C.; et al. Brown fat activation reduces hypercholesterolaemia and protects from atherosclerosis
development. Nat. Commun. 2015, 6, 1–11. [CrossRef]
21. Verhagen, S.N.; Visseren, F.L.J. Perivascular adipose tissue as a cause of atherosclerosis. Atherosclerosis 2011,
214, 3–10. [CrossRef] [PubMed]
22. Britton, K.A.; Fox, C.S. Perivascular adipose tissue and vascular disease. Clin. Lipidol. 2011, 6, 79–91.
[CrossRef] [PubMed]
23. Huang Cao, Z.F.; Stoffel, E.; Cohen, P. Role of Perivascular Adipose Tissue in Vascular Physiology and
Pathology. Hypertension 2017, 69, 770–777. [CrossRef] [PubMed]
24. Mikolajczyk, T.P.; Nosalski, R.; Szczepaniak, P.; Budzyn, K.; Osmenda, G.; Skiba, D.; Sagan, A.; Wu, J.;
Vinh, A.; Marvar, P.J.; et al. Role of chemokine RANTES in the regulation of perivascular inflammation,
T-cell accumulation, and vascular dysfunction in hypertension. FASEB J. 2016, 30, 1987–1999. [CrossRef]
25. Antonopoulos, A.S.; Margaritis, M.; Coutinho, P.; Shirodaria, C.; Psarros, C.; Herdman, L.; Sanna, F.;
De Silva, R.; Petrou, M.; Sayeed, R.; et al. Adiponectin as a link between type 2 diabetes and vascular NADPH
oxidase activity in the human arterial wall: The regulatory role of perivascular adipose tissue. Diabetes 2015,
64, 2207–2219. [CrossRef]
26. Antonopoulos, A.S.; Sanna, F.; Sabharwal, N.; Thomas, S.; Oikonomou, E.K.; Herdman, L.; Margaritis, M.;
Shirodaria, C.; Kampoli, A.M.; Akoumianakis, I.; et al. Detecting human coronary inflammation by imaging
perivascular fat. Sci. Transl. Med. 2017, 9, 1–12. [CrossRef]
27. Margaritis, M.; Antonopoulos, A.S.; Digby, J.; Lee, R.; Reilly, S.; Coutinho, P.; Shirodaria, C.; Sayeed, R.;
Petrou, M.; De Silva, R.; et al. Interactions between vascular wall and perivascular adipose tissue reveal
novel roles for adiponectin in the regulation of endothelial nitric oxide synthase function in human vessels.
Circulation 2013, 127, 2209–2221. [CrossRef]
28. Czamara, K.; Majzner, K.; Pacia, M.Z.; Kochan, K.; Kaczor, A.; Baranska, M. Raman spectroscopy of lipids:
A review. J. Raman Spectrosc. 2015, 46, 4–20. [CrossRef]
29. Reitzenstein, S.; Rosch, P.; Strehle, M.A.; Berg, D.; Baranska, M.; Schulz, H.; Rudloff, E.; Popp, J. Nondestructive
analysis of single rapeseeds by means of Raman spectroscopy. J. Raman Spectrosc. 2007, 38, 301–308. [CrossRef]
30. Kochan, K.; Maslak, E.; Krafft, C.; Kostogrys, R.; Chlopicki, S.; Baranska, M. Raman spectroscopy analysis
of lipid droplets content, distribution and saturation level in Non-Alcoholic Fatty Liver Disease in mice.
J. Biophotonics 2015, 8, 597–609. [CrossRef]
31. Maslak, E.; Zabielski, P.; Kochan, K.; Kus, K.; Jasztal, A.; Sitek, B.; Proniewski, B.; Wojcik, T.; Gula, K.; Kij, A.;
et al. The liver-selective NO donor, V-PYRRO/NO, protects against liver steatosis and improves postprandial
glucose tolerance in mice fed high fat diet. Biochem. Pharmacol. 2015, 93, 389–400. [CrossRef]
32. Maase, M.; Rygula, A.; Pacia, M.Z.; Proniewski, B.; Mateuszuk, L.; Sternak, M.; Kaczor, A.; Chlopicki, S.;
Kusche-Vihrog, K. Combined Raman- and AFM-based detection of biochemical and nanomechanical features
of endothelial dysfunction in aorta isolated from ApoE/LDLR-/- mice. Nanomed. Nanotechnol. Biol. Med.
2019, 16, 97–105. [CrossRef]
33. Pacia, M.Z.; Mateuszuk, L.; Chlopicki, S.; Baranska, M.; Kaczor, A. Biochemical changes of the endothelium
in the murine model of NO-deficient hypertension. Analyst 2015, 140, 2178–2184. [CrossRef]
34. Pacia, M.Z.; Buczek, E.; Blazejczyk, A.; Gregorius, A.; Wietrzyk, J.; Chlopicki, S.; Baranska, M.; Kaczor, A.
3D Raman imaging of systemic endothelial dysfunction in the murine model of metastatic breast cancer.
Anal. Bioanal. Chem. 2016, 408, 3381–3387. [CrossRef]Int. J. Mol. Sci. 2020, 21, 4838 13 of 14
35. Pacia, M.Z.; Mateuszuk, L.; Buczek, E.; Chlopicki, S.; Blazejczyk, A.; Wietrzyk, J.; Baranska, M.; Kaczor, A.
Rapid biochemical profiling of endothelial dysfunction in diabetes, hypertension and cancer metastasis by
hierarchical cluster analysis of Raman spectra. J. Raman Spectrosc. 2016, 47, 1310–1317. [CrossRef]
36. Pilarczyk, M.; Mateuszuk, L.; Rygula, A.; Kepczynski, M.; Chlopicki, S.; Baranska, M.; Kaczor, A. Endothelium
in Spots-High-Content Imaging of Lipid Rafts Clusters in db/db Mice. PLoS ONE 2014, 9, e106065. [CrossRef]
[PubMed]
37. Rygula, A.; Pacia, M.Z.; Mateuszuk, L.; Kaczor, A.; Kostogrys, R.B.; Chlopicki, S.; Baranska, M. Identification
of a biochemical marker for endothelial dysfunction using Raman spectroscopy. Analyst 2015, 140, 2185–2189.
[CrossRef] [PubMed]
38. Kaczor, A.; Marzec, K.M.; Majzner, K.; Kochan, K.; Pacia, M.Z.; Baranska, M. Raman Imaging of Biomedical
Samples. In Confocal Raman Microscopy; Toporski, J., Dieing, T., Hollricher, O., Eds.; Springer: Berlin, Germany,
2018; pp. 307–346.
39. Latka, I.; Dochow, S.; Krafft, C.; Dietzek, B.; Popp, J. Fiber optic probes for linear and nonlinear Raman
applications—Current trends and future development. Laser Photonics Rev. 2013, 7, 698–731. [CrossRef]
40. Schleusener, J.; Reble, C.; Helfmann, J.; Gersonde, I.; Cappius, H.J.; Glanert, M.; Fluhr, J.W.; Meinke, M.C.
Design and technical evaluation of fibre-coupled Raman probes for the image-guided discrimination of
cancerous skin. Meas. Sci. Technol. 2014, 25, 035701. [CrossRef]
41. Desroches, J.; Jermyn, M.; Pinto, M.; Picot, F.; Tremblay, M.A.; Obaid, S.; Marple, E.; Urmey, K.; Trudel, D.;
Soulez, G.; et al. A new method using Raman spectroscopy for in vivo targeted brain cancer tissue biopsy.
Sci. Rep. 2018, 8, 1–10. [CrossRef]
42. Krafft, C.; Dochow, S.; Latka, I.; Dietzek, B.; Popp, J. Diagnosis and screening of cancer tissues by fiber-optic
probe Raman spectroscopy. Biomed. Spectrosc. Imaging 2012, 1, 39–55. [CrossRef]
43. Matthäus, C.; Dochow, S.; Bergner, G.; Lattermann, A.; Romeike, B.F.M.; Marple, E.T.; Krafft, C.; Dietzek, B.;
Brehm, B.R.; Popp, J. In vivo characterization of atherosclerotic plaque depositions by Raman-probe
spectroscopy and in vitro coherent anti-stokes Raman scattering microscopic imaging on a rabbit model.
Anal. Chem. 2012, 84, 7845–7851. [CrossRef] [PubMed]
44. Pacia, M.Z.; Czamara, K.; Zebala, M.; Kus, E.; Chlopicki, S.; Kaczor, A. Rapid diagnostics of liver steatosis by
Raman spectroscopy: Via fiber optic probe: A pilot study. Analyst 2018, 143, 4723–4731. [CrossRef] [PubMed]
45. Czamara, K.; Majka, Z.; Fus, A.; Matjasik, K.; Pacia, M.Z.; Sternak, M.; Chlopicki, S.; Kaczor, A.
Raman spectroscopy as a novel tool for fast characterization of the chemical composition of perivascular
adipose tissue. Analyst 2018, 143, 5999–6005. [CrossRef] [PubMed]
46. Majka, Z.; Czamara, K.; Wegrzyn, P.; Litwinowicz, R.; Janus, J.; Chlopicki, S.; Kaczor, A. Alterations in lipid
and carotenoid content in perivascular adipose tissue of human internal mammary artery upon coronary
artery disease studied with fiber optic Raman probe. 2020, unpublished.
47. Levy, B.I.; Tedgui, A. Morphologic Aspects of the Large Artery Vascular Wall. In Biology of the Arterial Wall;
Springer: Boston, MA, USA, 1999; pp. 3–12.
48. Frushour, B.G.; Koenig, J.L. Raman scattering of collagen, gelatin, and elastin. Biopolymers 1975, 14, 379–391.
[CrossRef] [PubMed]
49. Movasaghi, Z.; Rehman, S.; Rehman, I.U. Raman Spectroscopy of Biological Tissues. Appl. Spectrosc. Rev.
2007, 42, 493–541. [CrossRef]
50. Benvenuti, L.A.; Onishi, R.Y.; Gutierrez, P.S.; de Lourdes Higuchi, M. Different patterns of atherosclerotic
remodeling in the thoracic and abdominal aorta. Clinics 2005, 60, 355–360. [CrossRef]
51. Bar, A.; Targosz-Korecka, M.; Suraj, J.; Proniewski, B.; Jasztal, A.; Marczyk, B.; Sternak, M.; Przybyło, M.;
Kurpińska, A.; Walczak, M.; et al. Degradation of Glycocalyx and Multiple Manifestations of Endothelial
Dysfunction Coincide in the Early Phase of Endothelial Dysfunction Before Atherosclerotic Plaque
Development in Apolipoprotein E/Low-Density Lipoprotein Receptor-Deficient Mice. J. Am. Heart Assoc.
2019, 8, e011171. [CrossRef]
52. Gil-Ortega, M.; Somoza, B.; Huang, Y.; Gollasch, M.; Fernández-Alfonso, M.S. Regional differences in
perivascular adipose tissue impacting vascular homeostasis. Trends Endocrinol. Metab. 2015, 26, 367–375.
[CrossRef]Int. J. Mol. Sci. 2020, 21, 4838 14 of 14
53. Dybas, J.; Marzec, K.M.; Pacia, M.Z.; Kochan, K.; Czamara, K.; Chrabaszcz, K.; Staniszewska-Slezak, E.; Malek, K.;
Baranska, M.; Kaczor, A. Raman spectroscopy as a sensitive probe of soft tissue composition—Imaging of
cross-sections of various organs vs. single spectra of tissue homogenates. TrAC Trends Anal. Chem. 2016,
85, 117–127. [CrossRef]
54. Rygula, A.; Majzner, K.; Marzec, K.M.; Kaczor, A.; Pilarczyk, M.; Baranska, M. Raman spectroscopy of
proteins: A review. J. Raman Spectrosc. 2013, 44, 1061–1076. [CrossRef]
55. Kochan, K.; Kus, E.; Szafraniec, E.; Wislocka, A.; Chlopicki, S.; Baranska, M. Changes induced by non-alcoholic
fatty liver disease in liver sinusoidal endothelial cells and hepatocytes: Spectroscopic imaging of single live
cells at the subcellular level. Analyst 2017, 142, 3948–3958. [CrossRef] [PubMed]
56. Czamara, K.; Majzner, K.; Selmi, A.; Baranska, M.; Ozaki, Y.; Kaczor, A. Unsaturated lipid bodies as a
hallmark of inflammation studied by Raman 2D and 3D microscopy. Sci. Rep. 2017, 7, 40889. [CrossRef]
57. Ishibashi, S.; Herz, J.; Maeda, N.; Goldstein, J.L.; Brown, M.S. The two-receptor model of lipoprotein clearance:
Tests of the hypothesis in ‘knockout’ mice lacking the low density lipoprotein receptor, apolipoprotein E,
or both proteins. Proc. Natl. Acad. Sci. USA 1994, 91, 4431–4435. [CrossRef] [PubMed]
58. Csányi, G.; Gajda, M.; Franczyk-Zarow, M.; Kostogrys, R.; Gwoźdź, P.; Mateuszuk, L.; Sternak, M.; Wojcik, L.;
Zalewska, T.; Walski, M.; et al. Functional alterations in endothelial NO, PGI2 and EDHF pathways in aorta
in ApoE/LDLR-/- mice. Prostaglandins Other Lipid Mediat. 2012, 98, 107–115. [CrossRef] [PubMed]
59. Tyrankiewicz, U.; Skorka, T.; Orzylowska, A.; Jablonska, M.; Jasinski, K.; Jasztal, A.; Bar, A.; Kostogrys, R.;
Chlopicki, S. Comprehensive MRI for the detection of subtle alterations in diastolic cardiac function in
apoE/LDLR-/- mice with advanced atherosclerosis. NMR Biomed. 2016, 29, 833–840. [CrossRef] [PubMed]
60. Mateuszuk, L.; Jasztal, A.; Maslak, E.; Gasior-Glogowska, M.; Baranska, M.; Sitek, B.; Kostogrys, R.;
Zakrzewska, A.; Kij, A.; Walczak, M.; et al. Antiatherosclerotic effects of 1-methylnicotinamide in
apolipoprotein e/low-density lipoprotein receptor-deficient mice: A comparison with nicotinic acid.
J. Pharmacol. Exp. Ther. 2016, 356, 514–524. [CrossRef]
61. Wrobel, T.P.; Marzec, K.M.; Chlopicki, S.; Maṡlak, E.; Jasztal, A.; Franczyk-Zarów, M.; Czyzyńska-Cichoń, I.;
Moszkowski, T.; Kostogrys, R.B.; Baranska, M. Effects of Low Carbohydrate High Protein (LCHP) diet on
atherosclerotic plaque phenotype in ApoE/LDLR-/- mice: FT-IR and Raman imaging. Sci. Rep. 2015, 5, 1–9.
[CrossRef]
62. Wrobel, T.P.; Mateuszuk, L.; Chlopicki, S.; Malek, K.; Baranska, M. Imaging of lipids in atherosclerotic lesion
in aorta from ApoE/LDLR-/- mice by FT-IR spectroscopy and Hierarchical Cluster Analysis. Analyst 2011,
136, 5247–5255. [CrossRef]
63. De Jong, J.M.A.; Larsson, O.; Cannon, B.; Nedergaard, J. A stringent validation of mouse adipose tissue
identity markers. Am. J. Physiol. Endocrinol. Metab. 2015, 308, E1085–E1105. [CrossRef] [PubMed]
© 2020 by the authors. Licensee MDPI, Basel, Switzerland. This article is an open access
article distributed under the terms and conditions of the Creative Commons Attribution
(CC BY) license (http://creativecommons.org/licenses/by/4.0/).You can also read