High leaf mass per area Oryza genotypes invest more leaf mass to cell wall and show a low mesophyll conductance

Page created by Bruce Newman
 
CONTINUE READING
High leaf mass per area Oryza genotypes invest more leaf mass to cell wall and show a low mesophyll conductance
AoB PLANTS 2020, 1–12

                                                                                     doi:10.1093/aobpla/plaa028
                                                                                     Advance Access Publication June 19, 2020
                                                                                     Studies

studies
High leaf mass per area Oryza genotypes invest more

                                                                                                                                                   Downloaded from https://academic.oup.com/aobpla/article/12/4/plaa028/5860164 by guest on 26 September 2020
leaf mass to cell wall and show a low mesophyll
conductance
Miao Ye1, Zhengcan Zhang1, Guanjun Huang1, Zhuang Xiong1, Shaobing Peng1,2 and
Yong Li*,1
1
 Ministry of Agriculture Key Laboratory of Crop Ecophysiology and Farming System in the Middle Reaches of the Yangtze
River, College of Plant Science and Technology, Huazhong Agricultural University, Wuhan, Hubei 430070, China, 2National
Key Laboratory of Crop Genetic Improvement, Huazhong Agricultural University, Wuhan, Hubei 430070, China
*Corresponding author’s e-mail address: liyong@mail.hzau.edu.cn

Associate Editor: Tom Buckley

Form & Function. Chief Editor: Kate McCulloh

Abstract
The intraspecific variations of leaf structure and anatomy in rice leaves and their impacts on gas diffusion are still
unknown. Researches about the tradeoff between structural compositions and intracellular chemical components within
rice leaves are still lacking. The objectives of the present study were to investigate the varietal differences in leaf structure
and leaf chemical compositions, and the tradeoff between leaf structural tissues and intracellular chemical components
in rice leaves. Leaf structure, leaf anatomy, leaf chemical composition concentrations and gas exchange parameters were
measured on eight Oryza sativa L. genotypes to investigate the intraspecific variations in leaf structure and leaf anatomy
and their impacts on gas exchange parameters, and to study the tradeoff between leaf structural compositions (cell wall
compounds) and intracellular chemical components (non-structural carbohydrates, nitrogen, chlorophyll). Leaf thickness
increased with leaf mass per area (LMA), while leaf density did not correlate with LMA. Mesophyll cell surface area exposed
to intercellular airspace (IAS) per leaf area, the surface area of chloroplasts exposed to IAS and cell wall thickness increased
with LMA. Cell wall compounds accounted for 71.5 % of leaf dry mass, while mass-based nitrogen and chlorophyll
concentrations decreased with LMA. Mesophyll conductance was negatively correlated with LMA and cell wall thickness.
High LMA rice genotypes invest more leaf mass to cell wall and possess a low mesophyll conductance.

Keywords: Cell wall; leaf anatomy; leaf chemical compositions; leaf mass per area; Oryza sativa L.; tradeoff.


Introduction                                                                   the substomatal cavities to the carboxylation sites is called
Under current ambient conditions (around 400 μmol CO2 mol-                     mesophyll resistance (rm), and the reciprocal of rm is mesophyll
1
  air), CO2 diffusion conductance from the air to the sites of                 conductance (gm). gm is determined by both anatomical and
carboxylation is regarded as one of the most important limiting                biochemical components (e.g. aquaporins and carbonic
factors for photosynthesis in C3 plants (Evans et al. 2009; Li et al.          anhydrase etc.) (Nakhoul et al. 1998; Uehlein 2003, Evans
2009; Yamori et al. 2011; Flexas et al. 2012; Adachi et al. 2013).             et al. 2009). There are many anatomical properties relating to
    After reaching substomatal cavities, CO2 needs to further                  mesophyll conductance, including the fraction of intercellular
diffuse through the mesophyll cell to reach the carboxylation                  airspace (fias), the mesophyll cell wall surface area exposed
sites (Terashima et al. 2011). The CO2 diffusion resistance from               to intercellular airspace per leaf area (Sm), the surface area of

Received: 4 February 2020; Editorial decision: 27 May 2020; Accepted: 12 June 2020
© The Author(s) 2020. Published by Oxford University Press on behalf of the Annals of Botany Company.
This is an Open Access article distributed under the terms of the Creative Commons Attribution License (http://creativecommons.
org/licenses/by/4.0/), which permits unrestricted reuse, distribution, and reproduction in any medium, provided the original work is       1
properly cited.
High leaf mass per area Oryza genotypes invest more leaf mass to cell wall and show a low mesophyll conductance
2   |   AoB PLANTS, 2020, Vol. 12, No. 4

chloroplasts exposed to intercellular airspace (Sc) and cell                 Eight rice genotypes including Sab Ini, Nucleoryza, Champa,
wall thickness (Evans et al. 2009; Scafaro et al. 2011; Terashima            Kirmizi Celtik, Huayou 675, Huanghuazhan, Teqing and
et al. 2011; Peguero-Pina et al. 2012; Tosens et al. 2012; Muir              Yongyou 12 were used. Rice plants were grown from April
et al. 2014). Cell wall thickness is particularly important as cell          to August in 2015. After germination on moist filters, seeds
wall resistance accounts for about half of the total mesophyll               were transferred to nursery plates. When the seedlings had
resistance (Terashima et al. 2011). Studies also showed that                 developed an average of three leaves, they were transplanted
leaves with thicker cell wall usually have higher leaf mass per              to 11 L pots with a density of three hills per pot and two
area (LMA; Terashima et al. 2006; Tosens et al. 2012; Onoda et al.           seedlings per hill. There were 10 pots per genotype, and each
2017). LMA is found to be negatively correlated with gm in some              pot filled with 10 kg of soil. Phosphorus (P) and potassium (K)
studies (Hassiotou et al. 2009, 2010; Muir et al. 2014) which is             were applied as basal fertilizers at an amount of 1.5 g pot-1. N
suggested to be related to cell wall thickness and intercellular             was applied at the amount of 2 g N pot-1, 40 % of which was
airspace (Terashima et al. 2006; Tosens et al. 2012; Onoda et al.            applied as a basal fertilizer and another two topdressings of 30
2017). However, no correlation between LMA and gm is also found              % each were applied at mid-tillering and the heading stages.

                                                                                                                                                Downloaded from https://academic.oup.com/aobpla/article/12/4/plaa028/5860164 by guest on 26 September 2020
in some studies (Hanba et al. 2002; Terashima et al. 2006; Tomás             Plants were watered daily, and a minimum 2 cm water layer
et al. 2013; Fini et al. 2016; Peguero-Pina et al. 2017; Ren et al. 2019),   was maintained to avoid drought stress. Pests were intensively
which may relate to different physiological and biochemical                  controlled using chemical pesticides. Rice plants were grown
features.                                                                    outdoor and the gas exchange measurements were conducted
    According to its definition, LMA is the product of leaf                  in a growth chamber (photosynthetic photon flux density
thickness (LT) with leaf density (LD). Therefore, the variation of           (PPFD) 1000 µmol m-2 s-1 at the leaf level; temperature 28 °C;
LMA can result from variation in LD, in LT or both. By compiling             relative humidity 65 %; CO2 concentration 400 µmol mol-1) to
data on 6100 LMA values from 3800 species, Poorter et al. (2010)             avoid the influence of changing environment on gas exchange
illustrated that LD can explain 80 % and LT explain 20 % of the              parameters. All measurements were conducted on the
differences in LMA. For Oryza sativa, Xiong et al. (2016b) showed            newly expanded flag leaves from three different pots of each
that LMA are positively related to both LD and LT in 14 genotypes,           genotype.
but the correlation with LD was stronger. However, two nitrogen
levels were set in their research, and nitrogen levels also                  Gas exchange measurements
impacted LT, LD and LMA, making the cause for variations in rice             A portable photosynthesis system (LI-6400XT, LI-CORInc.,
LMA still unknown. LT and LD can both impact gm, for example,                Lincoln, NE, USA) with an integrated fluorescence leaf chamber
Ren et al. (2019) found that gm was negatively related to LT by              (Li-6400–40; Li-Cor) was used to measure gas exchange and
analysing data from previous 44 publications. The influences of              chlorophyll fluorescence on flag leaves between 08:00 and
LT and LD on gm are mainly driven by the changes in leaf internal            12:00. Measurements began after the plants had acclimatized to
anatomy, including Sm, Sc and fias.                                          the chamber for approximately 2 h. In the LI-6400XT cuvette,
    Leaf chemical composition is also an important component                 ambient CO2 concentration was controlled and set to 400 μmol
of variation in LMA and has been used to explore the tradeoff                mol-1, leaf temperature was maintained at 28 °C, PPFD was 1500 μ
between structural tissues, mainly including cell wall compounds,            mol m-2 s-1 and the flow rate was 500 μmol s-1. After reaching a
and intracellular chemical components, including non-structural              steady state, usually takes 25 min, gas exchange parameters,
carbohydrates and especially some components like nitrogen                   steady-state fluorescence (Fs) and the maximum fluorescence
and chlorophyll which are associated with photosynthesis. For                (F’ m) were recorded with a light saturating pulse of 8000 μmol
example, high LMA leaves tended to contain more structural                   m-2 s-1. The actual photochemical efficiency of photosystem II
tissues while less inclusions (minerals, organic acids, soluble              (Φ PSII) was calculated as follows:
proteins) (Poorter et al. 2010). And high LMA species had
lower concentrations of cytoplasmic compounds and higher                             F m − Fs
                                                                             (1)
                                                                             ΦPSII =
                                                                                        F m
concentrations of cell wall compounds than low-LMA species
(Mediavilla et al. 2008; Poorter et al. 2010). A higher sclerenchymatic
tissue fraction (van Arendonk and Poorter 1994), rather than                 The electron transport rate (J) was calculated as follows:
smaller cell sizes in high-LMA species (Castro-Díez et al. 2000),            (2)
                                                                             J = PPFD ∗ αβ ∗ ΦPSII
was supposed to be the reason. However, relevant studies in rice
                                                                             where α is the leaf absorptance and β is the partitioning of
plants are rare. Therefore, the second objective of the present
                                                                             absorbed quanta between photosystem II and photosystem
study is to investigate the tradeoff between structural tissues and
                                                                             I. The product αβ was determined from the slope of the
intracellular chemical components among rice genotypes.
                                                                             relationship between Φ PSII and the quantum efficiency of CO2
    In the present study, eight rice genotypes with different
                                                                             uptake (Φ CO2), obtained by varying light intensity under non-
LMAs were grown in pot experiment to investigate: (i) varietal
                                                                             photorespiratory conditions at
Ye et al. — Thinner cell wall promotes mesophyll CO2 diffusion      |   3

using the Laisk method (Brooks and Farquhar 1985). Briefly, A/Ci
curves were measured over the linear portion of the response            (9)                                 lm
                                                                                                    Sm = F ×
curve (at 100, 80, 50 and 25 μmol CO2 mol-1 air) over three PPFDs                                             L
(150, 300 and 600 μmol m-2 s-1) with an LI 6400-02B chamber             where F is the curvature correction factor, taken to be 1.42
(Li-Cor), and then linear regressions to the responses for each         according to previous studies (Scafaro et al. 2011; Giuliani et al.
PPFD were fitted for individual leaves. The intersection point of       2013; Xiong et al. 2015, 2016a). The proportion of mesophyll cell
three A/Ci curves was considered as C∗i (x-axis) and Rd (y-axis)        periphery covered by chloroplasts (Sc/Sm) was analysed in ×1700
(von Caemmerer et al. 1994). Γ* was calculated as follows:              TEM pictures (I to P in Fig. 1) using ImageJ software. In total,
                                                                        5–7 pictures per genotype were analysed. Sc was calculated as
          R
Γ∗ = C∗i + d
(5)                                                                    follows:
          gm
                                                                                                              Sc
                                                                                                  Sc = Sm ×                            (10)
Leaf anatomy                                                                                                  Sm

                                                                                                                                              Downloaded from https://academic.oup.com/aobpla/article/12/4/plaa028/5860164 by guest on 26 September 2020
Three leaves were detached immediately after the gas exchange           cell wall thickness (CWT) were measured in ×3500 TEM pictures
measurements to determine leaf anatomy, leaf area was                   (Q to X in Fig. 1) using ImageJ software. A total of 5–13 pictures
measured using a LI-Cor 3000C (LI-COR Inc., Lincoln, NE, USA)           (at least 5–13 cells) were measured in each genotype.
leaf area analyzer. Leaves were then oven-dried at 80 °C until
they achieved a constant weight (3 days). Afterwards, leaf dry          Leaf chemical compositions
mass was weighed, and LMA was calculated as the ratio of leaf           Leaves for measuring LMA were used to determine leaf
dry mass to leaf area.                                                  N content. Leaf N content based on leaf mass (Nmass, %)
    Paraffin sections were made for three leaves per genotype           was measured with an Elementar Vario MAX CN analyzer
to observe leaf anatomy using light microscope (LM). After gas          (Elementar Analysesysteme GmbH, Hanau, Germany), and Narea
exchange measurements, leaf sections of about 10.0 mm length            was calculated by multiplying Nmass with LMA. Photosynthetic
were cut from the middle of flag leaves and fixed in FAA buffer         nitrogen use efficiency (PNUE) was calculated as follows:
(38 % formaldehyde, glacial acetic acid and 70 % alcohol) at 4 °C
                                                                               Aarea
for 24 h, and then were vacuumed in a vacuum chamber (DZF-              (11)
                                                                        PNUE =
                                                                               Narea
6050, Shanghai Hasuc Co., Ltd, Shanghai, China). The samples
were embedded in paraffins and the leaf cross-sections were             After gas exchange measurements, the middle part of the
made by professionals from Wuhan Google Biotechnology Co.               flag leaves (0.05–0.1 g) was detached and was put into a 25 mL
Ltd. The paraffin sections were examined at ×200 magnification          cuvette to determine the chlorophyll content. About 25 mL 95 %
with an Olympus IX71 light microscope (Olympus Optical,                 (v/v) ethanol was added into the cuvette. Then the cuvette was
Tokyo, Japan).                                                          covered up and placed in darkness for about 20 h to decolorize
    For transmission electron microscope images (TEM), small            the leaves until the background was colorless. Then the extract
leaf sections of 4.0 × 1.2 mm were cut from the middle of flag          was transferred to a 50 mL brown volume bottle, the leaves and
leaves (avoiding midribs) after gas exchange measurements.              cuvette were washed with 95 % (v/v) ethanol and the ethanol was
The leaf sections were infiltrated with fixative 2.5 % (v/v) glutaric   poured into the volume bottle, which was finally filled to 50 mL
aldehyde in 0.1 M phosphate buffer (pH = 7.6) in a vacuum               with 95 % (v/v) ethanol. Spectrophotometry was determined
chamber (DZF-6050, Shanghai Hasuc Co., Ltd, Shanghai, China)            with a UV–Vis spectrophotometer (UV-2102C, UNICO., USA)
for 2 h. Ultrathin sections were made by professionals from             under 665, 649, 470 nm wavelength. All measurements were
Core Facility Center and Technical Support, Wuhan Institute of          conducted in dark to avoid chlorophyll’s decomposition. The
Virology, Chinese Academy of Sciences. Images were acquired             content of chlorophyll a (Ca), chlorophyll b (Cb) and carotenoid
using a Tecnai G2 20 TWIN (FEI Co., USA).                               (Cx·c) were calculated as follows:
    LM pictures (×200) were used to measure the area of leaf            (12)
                                                                        Ca = 13.95A665 − 6.88A649
cross-section and the width of leaf cross-section using ImageJ
software (Schneider et al. 2012). Three leaves per genotype were        (13)
                                                                        Cb = 24.96A649 − 7.32A665
measured. LT and LD were calculated as follows:
                                                                        (14)  1000A470 − 2.05Ca − 114.8Cb
                                                                        Cx·c =
(6) Area of leaf cross-section                                                            245
LT =
     Width of leaf cross-section                                        Contents of soluble sugars and starch were determined
                                   LMA                                  according to Yoshida et al. (1976). Approximately 100 mg
(7)                         LD =                                       sample was extracted with 80 % (v/v) aqueous ethanol at
                                    LT
                                                                        80 ℃ for 30 min. The extract was centrifugated and the
LM and TEM pictures were used to measure Sm, Sc and fias. The
                                                                        supernatant was transferred to a 100 mL volumetric flask.
total length of mesophyll cell wall exposed to intercellular
                                                                        The extraction process was repeated three times; all the three
airspace (lm), the total area of intercellular airspace (Sias), the
                                                                        supernatants were pooled into the flask, followed by addition
width of the analysed leaf cross-section (L, from the middle of
                                                                        of distilled water to 100 mL. Aliquot of the extract was used
two minor veins to the next one) and the area of the analysed
                                                                        for determination of soluble sugars with anthrone reagent. For
leaf cross-section (S) were measured in ×200 LM pictures using
                                                                        the starch determination, the residue after centrifugation in
ImageJ software. Three leaves per genotype were measured. The
                                                                        the tube was added 2 mL distilled water, and put in a boiling
fraction of intercellular air space (fias) was calculated as:
                                                                        water bath for 15 min. Two millilitres of 9.2 mol L-1 HClO4 was
                                 S                                      added to the tube and put into ice bath for 15 min for complete
(8)                       fias = ias
                                  S                                     digestion of starch into glucose. Supernatant of the extract was
Sm was calculated as follows:                                           collected into a 100 mL volumetric flask after centrifugation.
4    |   AoB PLANTS, 2020, Vol. 12, No. 4

                                                                                                                                                                                       Downloaded from https://academic.oup.com/aobpla/article/12/4/plaa028/5860164 by guest on 26 September 2020

Fig. 1. Light (A, B, C, D, E, F, G, H) and transmission electron (1700× (I, J, K, L, M, N, O, P), 3500× (Q, R, S, T, U, V, W, X)) microscope images of leaves detached from Sab Ini,
Nucleoryza, Champa, Kirmizi Celtik, Huayou 675, Huanghuazhan, Teqing and Yongyou 12, respectively. IAS, intercellular air space; CW, cell wall; C, chloroplast.

The extraction was repeated by putting the residue in 2 mL of                                water to 100 mL. For the colorimetric assay, optical density
4.6 mol L-1 HClO4 for 15 min for a second time. The supernatants                             was measured at 620 nm on a microplate reader (Nano Quant,
were pooled together in the flask, and then added distilled                                  infinite M200, Tecan, Switzerland). Glucose released in the
Ye et al. — Thinner cell wall promotes mesophyll CO2 diffusion                                                                                                                                                                                                               |   5

extraction was estimated with anthrone reagent and converted

                                                                       Table 1. Leaf net photosynthetic rate, photosynthetic nitrogen use efficiency, mesophyll CO2 diffusion conductance and anatomical traits of the eight rice genotypes. Aarea, area-based net
                                                                       photosynthetic rate; Amass, mass-based net photosynthetic rate; PNUE, photosynthetic nitrogen use efficiency; gm, mesophyll conductance to CO2; LMA, leaf mass per area; Sm, the surface area
                                                                       of mesophyll cells exposed to intercellular airspace per leaf area; Sc, the surface area of chloroplasts exposed to intercellular airspaces per leaf area; CWT, cell wall thickness; fias, the fraction of

                                                                                                                                                                                                                                                                                                                   18.2 + 4.7
                                                                                                                                                                                                                                                                                                                   24.8 + 1.8
                                                                                                                                                                                                                                                                                                                   17.3 + 1.7
                                                                                                                                                                                                                                                                                                                   15.1 + 0.5
                                                                                                                                                                                                                                                                                                                   17.7 + 2.3
                                                                                                                                                                                                                                                                                                                   18.3 + 3.0
                                                                                                                                                                                                                                                                                                                   18.8 + 1.5
                                                                                                                                                                                                                                                                                                                   20.3 + 1.5
to starch value by multiplying by 0.9 (Pucher et al. 1932). The

                                                                                                                                                                                                                                                                                           fias (%)

                                                                                                                                                                                                                                                                                                                                 18.8
concentrations of soluble sugars and starch expressed as mg

                                                                                                                                                                                                                                                                                                                                 **
glucose g-1 dry weight were calculated by comparing with
glucose standard. The non-structural carbohydrates (NSC)

                                                                                                                                                                                                                                                                                           CWT (nm)

                                                                                                                                                                                                                                                                                                                   285 ± 43
                                                                                                                                                                                                                                                                                                                   198 ± 14
                                                                                                                                                                                                                                                                                                                   243 ± 26
                                                                                                                                                                                                                                                                                                                   231 ± 29
                                                                                                                                                                                                                                                                                                                   287 ± 26
                                                                                                                                                                                                                                                                                                                   262 ± 20
                                                                                                                                                                                                                                                                                                                   205 ± 21
                                                                                                                                                                                                                                                                                                                   330 ± 22
concentration of a given plant part refers to the sum of the
concentrations of soluble sugars and starch (mg glucose g-1 dry

                                                                                                                                                                                                                                                                                                                                 257
                                                                                                                                                                                                                                                                                                                                 ***
weight).
    Leaf cell wall fractionation procedure was described by

                                                                                                                                                                                                                                                                                          Sc (μm2 μm-2)
Peng et al. (2000) with minor modification (Wu et al. 2013).

                                                                                                                                                                                                                                                                                                                   18.8 ± 2.5
                                                                                                                                                                                                                                                                                                                   14.1 ± 3.6
                                                                                                                                                                                                                                                                                                                   18.7 ± 1.5
                                                                                                                                                                                                                                                                                                                    8.6 ± 0.5
                                                                                                                                                                                                                                                                                                                    9.8 ± 1.2
                                                                                                                                                                                                                                                                                                                    9.2 ± 1.3
                                                                                                                                                                                                                                                                                                                    9.1 ± 1.0
                                                                                                                                                                                                                                                                                                                    7.8 ± 1.6
The soluble sugar, lipids and starch of the samples were
successively removed with the potassium phosphate buffer

                                                                                                                                                                                                                                                                                                                                 12.0
(pH = 7.0), chloroform–methanol (1:1, v/v), dimethyl sulphoxide

                                                                                                                                                                                                                                                                                                                                 ***

                                                                                                                                                                                                                                                                                                                                                Downloaded from https://academic.oup.com/aobpla/article/12/4/plaa028/5860164 by guest on 26 September 2020
(DMSO)–water (9:1, v/v). The remaining pellet was extracted
with 0.5 % (v/v) Oxalic acid for 1 h at 100 °C and washed with

                                                                                                                                                                                                                                                                                          Sm (μm2 μm-2)
0.5 % (v/v) Oxalic acid and distilled water, all extracts were

                                                                                                                                                                                                                                                                                                                   10.0 ± 1.3
                                                                                                                                                                                                                                                                                                                   10.5 ± 1.5

                                                                                                                                                                                                                                                                                                                   19.2 ± 2.5
                                                                                                                                                                                                                                                                                                                   14.6 ± 3.8
                                                                                                                                                                                                                                                                                                                   19.3 ± 1.6
                                                                                                                                                                                                                                                                                                                    9.4 ± 0.6

                                                                                                                                                                                                                                                                                                                    9.7 ± 1.1
                                                                                                                                                                                                                                                                                                                    8.6 ± 1.7
collected to do colorimetric analysis for determining pectic
substance. The remaining pellet was extracted with 4 M KOH

                                                                                                                                                                                                                                                                                                                                 12.7
                                                                                                                                                                                                                                                                                                                                 ***
containing 1.0 mg/mL sodium borohydride for 1 h at 25 °C
and washed with distilled water until the soluble sugars were

                                                                                                                                                                                                                                                                                                                   0.28 ± 0.01
                                                                                                                                                                                                                                                                                                                   0.25 ± 0.01
                                                                                                                                                                                                                                                                                                                   0.23 ± 0.01
                                                                                                                                                                                                                                                                                                                   0.25 ± 0.00
                                                                                                                                                                                                                                                                                                                   0.29 ± 0.04
                                                                                                                                                                                                                                                                                                                   0.17 ± 0.02
                                                                                                                                                                                                                                                                                                                   0.16 ± 0.01
                                                                                                                                                                                                                                                                                                                   0.21 ± 0.01
                                                                                                                                                                                                                                                                                    (mg mm-3)
undetectable. The combined supernatant was neutralized,
dialysed and lyophilized as KOH-extractable hemicelluloses.

                                                                                                                                                                                                                                                                                                                                 0.23
The remaining residues were then extracted with 2 M

                                                                                                                                                                                                                                                                                    LD

                                                                                                                                                                                                                                                                                                                                 ***
trifluoroacetic acid at 120 °C in an autoclave for 1 h, and

                                                                                                                                                                                                                                                                                                                   0.19 ± 0.01
                                                                                                                                                                                                                                                                                                                   0.19 ± 0.01
                                                                                                                                                                                                                                                                                                                   0.20 ± 0.01
                                                                                                                                                                                                                                                                                                                   0.20 ± 0.00
                                                                                                                                                                                                                                                                                                                   0.17 ± 0.02
                                                                                                                                                                                                                                                                                                                   0.35 ± 0.03
                                                                                                                                                                                                                                                                                                                   0.29 ± 0.02
                                                                                                                                                                                                                                                                                                                   0.33 ± 0.02
were washed by distilled water. The combined supernatants

                                                                                                                                                                                                                                                                                           LT (mm)
were collected as the non-KOH-extractable hemicelluloses,
and they were combined with the KOH-extractable as total

                                                                                                                                                                                                                                                                                                                                 0.24
                                                                                                                                                                                                                                                                                                                                 ***
hemicelluloses. The remaining residues were sequentially
extracted with acetic acid–nitric acids–water (8:1:2, v/v/v)

                                                                                                                                                                                                                                                                                                                   53.0 ± 3.1
                                                                                                                                                                                                                                                                                                                   49.2 ± 2.1
                                                                                                                                                                                                                                                                                                                   45.0 ± 1.1
                                                                                                                                                                                                                                                                                                                   49.8 ± 2.1
                                                                                                                                                                                                                                                                                                                   48.8 ± 3.0
                                                                                                                                                                                                                                                                                                                   57.3 ± 0.3
                                                                                                                                                                                                                                                                                                                   46.9 ± 0.9
                                                                                                                                                                                                                                                                                                                   71.7 ± 1.1
for 1 h in a boiling water bath and the remaining pellet was
                                                                                                                                                                                                                                                                                    (g m-2)
                                                                                                                                                                                                                                                                                    LMA
defined as cellulose. All samples were conducted in biological

                                                                                                                                                                                                                                                                                                                                 52.7
                                                                                                                                                                                                                                                                                                                                 ***
triplicate. A UV/VIS Spectrometer (V-1100D, MAPADA
Instruments Co., Ltd, Shanghai, China) was applied for total
                                                                                                                                                                                                                                                                                    (mol m-2 s-1)

                                                                                                                                                                                                                                                                                                                   0.21 ± 0.04
                                                                                                                                                                                                                                                                                                                   0.31 ± 0.05
                                                                                                                                                                                                                                                                                                                   0.27 ± 0.02
                                                                                                                                                                                                                                                                                                                   0.27 ± 0.04
                                                                                                                                                                                                                                                                                                                   0.34 ± 0.01
                                                                                                                                                                                                                                                                                                                   0.23 ± 0.02
                                                                                                                                                                                                                                                                                                                   0.28 ± 0.05
                                                                                                                                                                                                                                                                                                                   0.18 ± 0.04
hexoses and pentoses assay as described by Wu et al. (2013)
and Li et al. (2014). The anthrone/H2SO4 method was used for

                                                                                                                                                                                                                                                                                                                                 0.26
determination of total hexoses (Fry 1988), and the orcinol/

                                                                                                                                                                                                                                                                                                                                 ns
                                                                                                                                                                                                                                                                                    gm

HCl assay was for total pentoses (Dische 1962). The standard
curves for hexoses and pentoses were drawn using D-glucose
                                                                                                                                                                                                                                                                                           PNUE (μmol g-1 N s-1)

and D-xylose as standard, respectively. Both anthrone/
H2SO4 and orcinol/HCl methods were used to measure total
hemicelluloses levels and were also employed for total sugars
                                                                                                                                                                                                                                                                                                                   15.3 ± 2.1
                                                                                                                                                                                                                                                                                                                   18.4 ± 0.5
                                                                                                                                                                                                                                                                                                                   20.1 ± 2.3
                                                                                                                                                                                                                                                                                                                   12.7 ± 0.7
                                                                                                                                                                                                                                                                                                                   20.1 ± 0.7
                                                                                                                                                                                                                                                                                                                   19.1 ± 2.5
                                                                                                                                                                                                                                                                                                                   21.9 ± 1.9
                                                                                                                                                                                                                                                                                                                   15.3 ± 1.6

released from pretreatment and enzymatic hydrolysis of
biomass samples. Regarding the high pentoses level effect on
                                                                                                                                                                                                                                                                                                                                 17.9

the absorbance reading at 620 nm for hexoses account, the
                                                                                                                                                                                                                                                                                                                                 ***

deduction from pentoses reading at 660 nm was conducted for
                                                                                                                                                                                                                                                                                           Amass (mmol g-1 s-1)

final calculation of hexoses level, verified by GC–MS analysis.
All of the samples resulted from biological triplicates.
                                                                       intercellular airspaces. *P < 0.05; **P < 0.01; ***P < 0.001.

    Total lignin contents of the raw samples and the residues
obtained from pretreatment were determined by two-step acid
                                                                                                                                                                                                                                                                                                                   528 ± 74
                                                                                                                                                                                                                                                                                                                   572 ± 15
                                                                                                                                                                                                                                                                                                                   572 ± 65
                                                                                                                                                                                                                                                                                                                   362 ± 19
                                                                                                                                                                                                                                                                                                                   611 ± 22
                                                                                                                                                                                                                                                                                                                   512 ± 67
                                                                                                                                                                                                                                                                                                                   656 ± 56
                                                                                                                                                                                                                                                                                                                   311 ± 33

hydrolysis method according to Laboratory Analytical Procedure
                                                                                                                                                                                                                                                                                                                                 516

of the National Renewable Energy Laboratory (NREL; Sluiter et al.
                                                                                                                                                                                                                                                                                                                                 ***

2008). The acid-insoluble lignin was accounted gravimetrically
after correction for ash. The acid-soluble lignin was measured
                                                                                                                                                                                                                                                                                           Aarea (μmol m-2 s-1)

by UV spectroscopy. The details of the two-type of lignin assay
were previously described by Xu et al. (2012). All samples were
                                                                                                                                                                                                                                                                                                                   28.0 ± 3.9
                                                                                                                                                                                                                                                                                                                   28.1 ± 0.7
                                                                                                                                                                                                                                                                                                                   25.7 ± 2.9
                                                                                                                                                                                                                                                                                                                   18.1 ± 0.9
                                                                                                                                                                                                                                                                                                                   29.8 ± 1.1
                                                                                                                                                                                                                                                                                                                   29.3 ± 3.8
                                                                                                                                                                                                                                                                                                                   30.8 ± 2.6
                                                                                                                                                                                                                                                                                                                   22.3 ± 2.4

performed in biological triplicate.
                                                                                                                                                                                                                                                                                                                                 26.5

Statistical analysis
                                                                                                                                                                                                                                                                                                                                 ***

One-way analysis of variance (ANOVA) was used to assess
                                                                                                                                                                                                                                                                                                                   Huanghuazhan

varietal differences in each parameter using Statistix 9
                                                                                                                                                                                                                                                                                                                   Kirmizi Celtik
                                                                                                                                                                                                                                                                                                                   Huayou 675

                                                                                                                                                                                                                                                                                                                     Genotype
                                                                                                                                                                                                                                                                                                                   Yongyou 12
                                                                                                                                                                                                                                                                                                                   Nucleoryza

software (Analytical Software, Tallahassee, FL, USA). Linear
                                                                                                                                                                                                                                                                                                                     Average
                                                                                                                                                                                                                                                                                           Genotype

                                                                                                                                                                                                                                                                                                                     ANOVA
                                                                                                                                                                                                                                                                                                                   Champa

regression analysis was performed to test the correlations
                                                                                                                                                                                                                                                                                                                   Sab Ini

                                                                                                                                                                                                                                                                                                                   Teqing

between parameters using SigmaPlot 10 (Systat Software Inc.,
CA, USA).
6   |   AoB PLANTS, 2020, Vol. 12, No. 4

Results                                                                                   with CWT (Fig. 4B). Sm, Sc and fias showed no effects on gm (Fig. 5)
                                                                                          and Aarea (data not show).
Varietal differences of leaf structural traits and their
impacts on mesophyll CO2 diffusion conductance in                                         Leaf chemical compositions in eight rice genotypes
rice plants                                                                               Leaf chemical compositions including pectic substance,
Leaf structural traits showed significant varietal differences                            hemicellulose, cellulose, NSC (soluble sugar and starch) showed
among eight rice genotypes (Table 1 and Fig. 1). Aarea, Amass, PNUE,                      significant varietal differences on both a leaf-area and mass
LMA, LT, LD, Sm, Sc, CWT and fias all showed significant varietal                         basis, except for lignin which was only significant on a mass
differences, while gm showed no varietal difference (Table 1).                            basis [see Supporting Information—Tables S1 and S2].
    For the relationships between leaf structure and anatomical
                                                                                          The tradeoff between structural tissues and
traits, LT was marginally correlated with LMA (Fig. 2A, P = 0.0688).
                                                                                          intracellular chemical components as well as its
Sm, Sc and CWT all increased as LMA increased (Fig. 2C–E). As LT
                                                                                          impact on leaf photosynthetic rate

                                                                                                                                                                                 Downloaded from https://academic.oup.com/aobpla/article/12/4/plaa028/5860164 by guest on 26 September 2020
increased, LD decreased, while Sm and Sc significantly increased
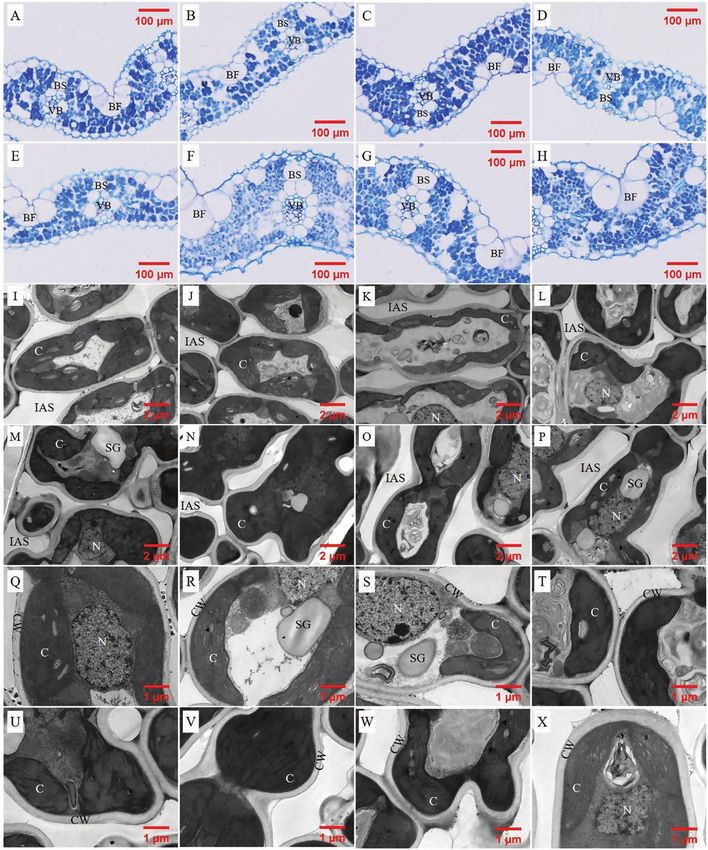
(Fig. 3).                                                                                 Figure 6A showed that the contents of NSC, and leaf cell
    For the impacts of leaf structure and anatomy on CO2                                  wall compounds including pectic substance, hemicellulose,
diffusion conductance, gm decreased as LMA increased (Fig. 4A).                           cellulose and lignin expressed on a leaf-area all increased as
gm was not correlated with CWT (P = 0.1453), when excluding                               LMA increased. The relative increasing ratios of leaf chemical
the outlier of Huayou 675, however, gm was negatively correlated                          compositions to LMA were shown in Fig. 6B. Except for lignin,

Fig. 2. The relationships between leaf mass per area (LMA) and leaf thickness (LT, A), leaf density (LD, B), the surface area of mesophyll cells exposed to intercellular
airspaces per leaf area (Sm, C), the surface area of chloroplasts exposed to intercellular airspaces per leaf area (Sc, D), cell wall thickness (CWT, E) and the fraction of
intercellular airspaces (fias, F) across the eight rice genotypes. Data are means ± SD of three replicates for LMA, LT, LD, Sm, Sc and fias. CWT of each genotype was measured
with 5–13 pictures, and one mesophyll cell was measured in each image. *P < 0.05; **P < 0.01; ***P < 0.001.
Ye et al. — Thinner cell wall promotes mesophyll CO2 diffusion          |   7

                                                                                      for 25.1 %, cellulose accounted for 26.5 %, lignin accounted
                                                                                      for 18.1 % and total cell wall compounds accounted for 71.5
                                                                                      % [see Supporting Information—Fig. S2]. In addition, leaf NSC
                                                                                      accounted for 10.0 % of leaf dry mass, as soluble sugar accounted
                                                                                      for 8.4 % and starch accounted for 1.6 %.

                                                                                      Discussion
                                                                                      Mesophyll conductance (gm) is an important CO2 diffusion
                                                                                      conductance and limits photosynthesis in the same magnitude
                                                                                      as stomatal conductance (Evans and von Caemmerer 1996;
                                                                                      Evans and Loreto 2000; Flexas et al. 2008; Terashima et al. 2011).

                                                                                                                                                               Downloaded from https://academic.oup.com/aobpla/article/12/4/plaa028/5860164 by guest on 26 September 2020
                                                                                      In the last decades, leaf anatomical traits including Sm, Sc, the
                                                                                      fraction of intercellular airspace (fias) and leaf cell wall thickness
                                                                                      were proved to have an impact on gm (Evans et al. 2009; Scafaro
                                                                                      et al. 2011; Terashima et al. 2011; Peguero-Pina et al. 2012; Tosens
                                                                                      et al. 2012; Muir et al. 2014; Ren et al. 2019). LMA is an integrated
                                                                                      leaf anatomical trait, and the influence of LMA on area-based
                                                                                      gas exchange parameters is inconsistent in previous studies
                                                                                      (Hikosaka et al. 2009; Liu and Li 2016; Onoda et al. 2017; Ye et al.
                                                                                      2019; Ren et al. 2019). Moreover, there is no concensus as to
                                                                                      which factor drives the most variation in LMA (Choong et al.
                                                                                      1992; Castro-Díez et al. 2000; Villar et al. 2013). Poorter et al.
                                                                                      (2010) showed that high LMA species have more structural
                                                                                      compositions and less inclusions such as organic acids,
                                                                                      minerals and protein. Further, using data of dry mass fraction
                                                                                      in cell walls, nitrogen allocation, mesophyll CO2 diffusion and
                                                                                      associated anatomical traits from hundreds of species, Onoda
                                                                                      et al. (2017) concluded that high LMA species have more cell wall
                                                                                      constituents, and thicker cell wall showed lower gm.
                                                                                           The variation of LMA in the cultivated rice genotypes is
                                                                                      relatively small, although wild rice may potentially show a large
                                                                                      variation in LMA (Xiong et al. 2016b). In the present study, LT
                                                                                      increased with LMA across eight rice genotypes, while LD and
                                                                                      fias did not respond to LMA. This indicates that in this case the
                                                                                      increase in LMA is more closely related to an increase in LT,
                                                                                      rather than LD. This is contrary to results in Xiong et al. (2016b),
                                                                                      which showed that LD rather than LT is the main driving factor
                                                                                      for the variation in LMA in rice leaves. The inconsistent results
                                                                                      may relate to different materials and treatments. In the study
                                                                                      by Xiong et al. (2016b), 11 rice genotypes were supplied with
Fig. 3. The relationships between leaf thickness (LT) and leaf density (LD, A), the
                                                                                      sufficient nitrogen and four were supplied with low nitrogen;
surface area of mesophyll cells exposed to intercellular airspaces per leaf area
(Sm, B), the surface area of chloroplasts exposed to intercellular airspaces per      moreover, five wild rice genotypes, which possess a broad range
leaf area (Sc, C) across the eight rice genotypes. Data are means ± SD of three       of leaf traits values, were also studied. For example, LD showed
replicates. *P < 0.05; **P < 0.01; ***P < 0.001.                                      4.4-fold difference in Xiong et al. (2016b), while it varied from
                                                                                      0.17 to 0.29 mg mm-3 in the present study.
the relative increasing ratios of other three cell wall compounds                          In the present study, Sm, Sc and CWT all increased with
and NSC to LMA were all above one, meaning that the changes                           LMA (Fig. 2). However, these positive relationships were mainly
in these chemical compositions were larger than the change in                         driven by the cultivar of Yongyou 12 (Fig. 2), which possessed
LMA, the concentrations of most cell wall compounds and NCS                           different anatomical traits. More genotypes should be included
based on leaf mass increased as LMA increased. On the other                           in future to support these relationships in rice. It was reported
hand, leaf N content based on leaf mass (Nmass) decreased as LMA                      that cell wall resistance is responsible for about half of the total
increased, and leaf chlorophyll content based on leaf mass (mg                        mesophyll resistance (Terashima et al. 2011). Cell wall thickness
FW g-1) showed a downtrend as LMA increased (Fig. 7). gm was                          ranged from 198 to 330 nm in the present study (Table 1), and
not correlated with either mass-based or area-based cell wall                         gm was significantly and negatively correlated to CWT (Fig. 4).
content (Fig. 8). Amass decreased as LMA increased, while Aarea and                   This suggested that the correlation between gm and LMA is more
PNUE showed no relationships with LMA (Fig. 9). In addition,                          driven by the CWT (Niinemets et al. 2009; Veromann-Jurgenson
Aarea showed positive relationship with stomatal conductance to                       et al. 2017) in comparison with Sm and Sc. In addition to CWT,
H2O (gs), but no relationships with Narea and gm [see Supporting                      cell wall porosity may have an important role in regulating gm
Information—Fig. S1].                                                                 (Ellsworth et al. 2018), although cell wall porosity cannot be
    Moreover, it was observed that leaf mesophyll cell wall                           directly measured and its variation among different genotypes
compounds accounted for more than half of the leaf dry mass,                          is not known. gm of Huayou 675 can reach as high as 0.34 mol
pectic substance accounted for 1.8 %, hemicellulose accounted                         m-2 s-1, although the CWT was 287 nm. The reason for Huayou
8   |   AoB PLANTS, 2020, Vol. 12, No. 4

                                                                                                                                                                                   Downloaded from https://academic.oup.com/aobpla/article/12/4/plaa028/5860164 by guest on 26 September 2020
Fig. 4. The relationships between mesophyll conductance (gm) and leaf mass per area (LMA, A), cell wall thickness (B) across the eight rice genotypes. Data are means
± SD of three replicates for gm and LMA. Cell wall thickness of each genotype was measured with 5-13 pictures, and one mesophyll cell was measured in each picture.
*P < 0.05; **P < 0.01; ***P < 0.001.

Fig. 5. The relationships between mesophyll conductance (gm) and the mesophyll cells surface area exposed to intercellular airspaces per leaf area (Sm, A), the surface
area of chloroplasts exposed to intercellular airspaces per leaf area (Sc, B), the fraction of intercellular airspaces (fias, C) across the eight rice genotypes. Data are means
± SD of three replicates. *P < 0.05; **P < 0.01; ***P < 0.001.

675 to possess a high gm with a thick cell wall is unknown, this                           compositions content should keep constant, if the increments
cultivar may possess a high cell wall porosity in comparison                               of the chemical compositions are proportional to the increment
with other genotypes or a relative higher aquaporin function.                              of LMA. However, it is seldom the case (Poorter et al. 2010). In the
The genotype of Yongyou 12 had a thick cell wall, a low gm and                             present study, the concentrations of most cell wall compounds
a low Amass (Table 1). Even though Yongyou 12 cannot reach a                               based on leaf mass did not change with LMA, but the relative
high photosynthetic rate, it does not imply that it cannot reach                           increasing ratios of leaf chemical compositions to LMA were
a high yield. Thick cell wall can improve the toughness of                                 above 1 for cell wall compounds (except for lignin) and NSC,
leaves, the tolerance to physical disturbance, can protect plants                          while Fig. 7 showed that leaf nitrogen and leaf chlorophyll
from herbivores and pathogens and finally leads to a long life                             contents based on mass decreased with LMA. This suggested
span (Coley 1983; Reich et al. 1991; Wright and Cannon 2001;                               that rice genotypes with a high LMA would possess more
Onoda et al. 2008, 2017; Hikosaka et al. 2009). It was reported                            structural material and less nitrogen and chlorophyll. These
that photosynthesis in rice plants during the grain-filling                                results were consistent with the previous studies showing that
period contributes 60–100 % of the final grain carbon content                              high LMA leaves tended to have more cell wall components
(Yoshida 1981). So, if the leaves can keep photosynthesis for a                            (Mommer et al. 2005; Mediavilla et al. 2008). However, gm was
longer duration, it can produce more rice grain yield. Therefore,                          not correlated with area-based cell wall content in the present
though Yongyou 12 has thick cell wall (330 nm) and a relative                              study (Fig. 8). Not only determined by leaf anatomical traits, gm
low photosynthetic rate (22.3 μmol m-2 s-1), it still shows high                           is also affected by biochemical components such as aquaporins,
grain yield in previous studies (Wang et al. 2014; Wei et al. 2014).                       carbonic anhydrase, etc. (Nakhoul et al. 1998; Uehlein 2003;
   For leaf chemical compositions, they can be expressed as                                Evans et al. 2009). Thus, the non-significant correlation between
mass-based content or area-based content. The mass-based                                   gm and cell wall content may be caused by the compensating
Ye et al. — Thinner cell wall promotes mesophyll CO2 diffusion                 |   9

                                                                                                                                                                      Downloaded from https://academic.oup.com/aobpla/article/12/4/plaa028/5860164 by guest on 26 September 2020
                                                                                     Fig. 7. The relationships between leaf mass per area (LMA) and leaf N content
                                                                                     based on leaf mass (Nmass, A), leaf chlorophyll content based on leaf mass (B)
                                                                                     across the eight rice genotypes. Data are means ± SD of three replicates. *P <
                                                                                     0.05; **P < 0.01; ***P < 0.001.

                                                                                     Onoda et al. (2017), which illustrated that cell wall constituents
                                                                                     are major components of leaf dry mass (18–70 %). LMA not only
                                                                                     has an effect on the fraction of dry mass between structural
                                                                                     tissues and inclusions, it can also have an effect on nitrogen
Fig. 6. Relationships between leaf chemical compositions (based on leaf area)
                                                                                     allocation and photosynthesis. Onoda et al. (2017) reported that
and leaf mass per area (LMA) across the eight rice genotypes (A), and the ratio of
Δleaf chemical composition to ΔLMA (B). ΔLMA was calculated as the ratio of the      high fraction of leaf mass in cell wall is typically associated with
maximum to the minimum LMA across the tested rice genotypes. The obtained            a lower fraction of leaf N invested in photosynthetic proteins,
regression equations in (A) were used to calculate leaf chemical compositions        and lower within-leaf CO2 diffusion rates. Takashima et al. (2004)
with the maximum and the minimum LMA, respectively, and Δ leaf chemical              also showed that species with a longer leaf life span have a
composition was calculated as the ratio of the maximum to the minimum leaf
                                                                                     greater LMA, lower photosynthetic capacity and lower PNUE.
chemical compositions. Data are means of three replicates in (A). *P < 0.05; **P
                                                                                     Nitrogen allocation into each chemical composition have not
< 0.01; ***P < 0.001.
                                                                                     been estimated in the present study and should be explored in
                                                                                     future for rice to assess the impacts of nitrogen allocation on
effects of aquaporins or other biochemical components yet to
                                                                                     PNUE, among others.
be investigated.
    Moreover, LD decreased as LT increased (Fig. 3A). gm and
photosynthetic rate would be low with thick cell walls, low leaf
                                                                                     Conclusions
nitrogen and chlorophyll concentrations. As shown in Fig. 4,
gm significantly decreased with increasing LMA and cell wall                         This study reports evidence that high LMA rice plants invest
thickness. LMA has no effect on Aarea and PNUE, though Amass                         more leaf mass to cell wall and possess a low mesophyll
decreased with LMA (Fig. 9), these results are in agreement with                     conductance. There were significant intraspecific variations of
previous studies (Wright et al. 2004; Ren et al. 2019). The reason                   leaf anatomy in rice plants. LT but not LD was the main driving
why gm was not correlated with Aarea may be that gs was the                          factor for different LMA in the present study. Sm, Sc and cell
main determinant for Aarea in the present study [see Supporting                      wall thickness all increased as LT increased. Thick cell wall
Information—Fig. S1].                                                                as a result of more mass was investing to cell wall but less to
    For the percentages of different leaf chemical compositions                      leaf nitrogen and chlorophyll has led to lower gm and Amass. Cell
to leaf dry mass, cell wall compounds accounted for 71.5 % of                        wall compounds accounted for most of the leaf dry mass in
leaf dry mass, NSC accounted for 10.0 % of leaf dry mass in                          rice leaves. The mechanism of high gm with thick cell wall (like
the present study. This result was consistent with the study of                      Huayou 675) should be explored in future.
10    |   AoB PLANTS, 2020, Vol. 12, No. 4

                                                                                                                                                                          Downloaded from https://academic.oup.com/aobpla/article/12/4/plaa028/5860164 by guest on 26 September 2020
Fig. 8. The relationships between mesophyll conductance (gm) and mass-based cell wall content (A) and area-based cell wall content (B) across the eight rice genotypes.
Data are means ± SD of three replicates.

                                                                                      Supporting Information
                                                                                      The following supporting information is available in the online
                                                                                      version of this article—
                                                                                          Figure S1. The relationships between area-based leaf
                                                                                      photosynthetic rate (Aarea) and area- based leaf nitrogen content
                                                                                      (Narea, A), stomatal conductance to H2O (gs, B) and mesophyll
                                                                                      conductance (gm, C) across the eight rice genotypes.
                                                                                          Figure S2. Percentages of leaf chemical compositions to leaf
                                                                                      dry mass in the eight rice genotypes.
                                                                                          Table S1. Leaf chemical composition per unit leaf mass in
                                                                                      eight rice genotypes.
                                                                                          Table S2. Leaf chemical composition per unit leaf area in
                                                                                      eight rice genotypes.

                                                                                      Sources of Funding
                                                                                      This research was supported by the National Natural Science
                                                                                      Foundation of China (31871532), the National Key Research
                                                                                      and Development Program of China (2016YFD0300102), and
                                                                                      the Fundamental Research Funds for the Central Universities
                                                                                      (2662017JC002).

                                                                                      Contributions by the Authors
                                                                                      Y.L. conceived the idea and designed the study, M.Y. conducted
                                                                                      the gas exchange measurements, M.Y. and G.J.H. determined
                                                                                      the leaf chemical composition, M.Y., Z.C.Z. and Z.X. prepared
                                                                                      samples for the leaf anatomy measurements and took pictures
                                                                                      for the TEM sections. M.Y. wrote the manuscript, S.B.P. and
                                                                                      Y.L. revised it.

                                                                                      Conflict of Interest
                                                                                      None declared.

                                                                                      Acknowledgements
                                                                                      We thank Pei Zhang and An-Na Du from The Core Facility and
                                                                                      Technical Support, Wuhan Institute of Virology, for their help
                                                                                      with producing TEM micrographs. We also thank Guillaume
Fig. 9. The relationships between leaf mass per area (LMA) and mass-based net
photosynthetic rate (Amass, A), area-based net photosynthetic rate (Aarea, B) and     Théroux-Rancourt (University of Natural Resources and Life
photosynthetic nitrogen use efficiency (PNUE, C) across the eight rice genotypes.     Sciences, Vienna, Austria) for revising and commenting on a
Data are means ± SD of three replicates. *P < 0.05; **P < 0.01; ***P < 0.001.         previous version of this paper.
Ye et al. — Thinner cell wall promotes mesophyll CO2 diffusion |                    11

Literature Cited                                                                 Li M, SL S, Hao B, Zha Y, Wan C, Hong S, Kang YB, Jia J, Zhang J, LI M, Zhao CQ,
                                                                                     Tu YY, Zhou SG, Peng LC. 2014. Mild alkali-pretreatment effectively
Adachi S, Nakae T, Uchida M, Soda K, Takai T, Oi T, Yamamoto T, Ookawa T,            extracts guaiacyl-rich lignin for high lignocellulose digestibility
    Miyake H, Yano M, Hirasawa T. 2013. The mesophyll anatomy enhancing              coupled with largely diminishing yeast fermentation inhibitors in
    CO2 diffusion is a key trait for improving rice photosynthesis. Journal of       Miscanthus. Bioresource Technology 169: 447–454.
    Experimental Botany 64:1061–1072.                                            Liu X, Li Y. 2016. Varietal difference in the correlation between leaf nitrogen
Brooks A, Farquhar GD. 1985. Effect of temperature on the CO2/O2 specificity         content and photosynthesis in rice (Oryza sativa L.) plants is related to
    of ribulose-1,5-bisphosphate carboxylase/oxygenase and the rate of               specific leaf weight. Journal of Integrative Agriculture 15:2002–2011.
    respiration in the light: estimates from gas-exchange measurements           Mediavilla S, Garcia‐Ciudad A, Garcia‐Criado B, Escudero A. 2008.
    on spinach. Planta 165:397–406.                                                  Testing the correlations between leaf life span and leaf structural
Castro-Díez P, Puyravaud JP, Cornelissen JH. 2000. Leaf structure and                reinforcement in 13 species of European Mediterranean woody plants.
    anatomy as related to leaf mass per area variation in seedlings of a             Functional Ecology 22:787–793.
    wide range of woody plant species and types. Oecologia 124:476–486.          Mommer L, de Kroon H, Pierik R, Bögemann GM, Visser EJ. 2005. A
Choong MF, Lucas PW, Ong JSY, Pereira B, Tan HTW, Turner IM. 1992. Leaf              functional comparison of acclimation to shade and submergence in

                                                                                                                                                                    Downloaded from https://academic.oup.com/aobpla/article/12/4/plaa028/5860164 by guest on 26 September 2020
    fracture toughness and sclerophylly: their correlations and ecological           two terrestrial plant species. The New Phytologist 167:197–206.
    implications. New Phytologist 121:597–610.                                   Muir CD, Hangarter RP, Moyle LC, Davis PA. 2014. Morphological and
Coley PD. 1983. Herbivory and defensive characteristics of tree species in a         anatomical determinants of mesophyll conductance in wild relatives
    low land tropical forest. Ecological Monographs 53:209–233.                      of tomato (Solanum sect. Lycopersicon, sect. Lycopersicoides; solanaceae).
Dische Z. 1962. Color reactions of carbohydrates. Methods in Carbohydrate            Plant, Cell & Environment 37:1415–1426.
    Chemistry 1:475–514.                                                         Nakhoul NL, Davis BA, Romero MF, Boron WF. 1998. Effect of expressing the
Ellsworth PV, Ellsworth PZ, Koteyeva NK, Cousins AB. 2018. Cell wall                 water channel aquaporin-1 on the CO2 permeability of Xenopus oocytes.
    properties in Oryza sativa influence mesophyll CO2 conductance. The              American Journal of Physiology-Cell Physiology 274:543–548.
    New Phytologist 219:66–76.                                                   Niinemets U, Wright IJ, Evans JR. 2009. Leaf mesophyll diffusion
Evans JR, Kaldenhoff R, Genty B, Terashima I. 2009. Resistances along the            conductance in 35 Australian sclerophylls covering a broad range of
    CO2 diffusion pathway inside leaves. Journal of Experimental Botany              foliage structural and physiological variation. Journal of Experimental
    60:2235–2248.                                                                    Botany 60:2433–2449.
Evans JR, Loreto F. 2000. Acquisition and diffusion of CO2 in higher             Onoda Y, Schieving F, Anten NP. 2008. Effects of light and nutrient
    plant leaves. In: Leegood RC, Sharkey TD, von Caemmerer S., eds.                 availability on leaf mechanical properties of Plantago major: a
    Photosynthesis: physiology and metabolism. Dordrecht, The Netherlands:           conceptual approach. Annals of Botany 101:727–736.
    Kluwer Academic Publishers, 321–351.                                         Onoda Y, Wright IJ, Evans JR, Hikosaka K, Kitajima K, Niinemets Ü,
Evans JR, von Caemmerer S. 1996. Carbon dioxide diffusion inside leaves.             Poorter H, Tosens T, Westoby M. 2017. Physiological and structural
    Plant Physiology 110:339–346.                                                    tradeoffs underlying the leaf economics spectrum. The New Phytologist
Fini A, Loreto F, Tattini M, Giordano C, Ferrini F, Brunetti C, Centritto M.         214:1447–1463.
    2016. Mesophyll conductance plays a central role in leaf functioning         Peguero-Pina JJ, Flexas J, Galmés J, Niinemets U, Sanchoknapik D, Barredo G,
    of Oleaceae species exposed to contrasting sunlight irradiance.                  Villarroya D, Gill-Pelegrin E. 2012. Leaf anatomical properties in relation
    Physiologia Plantarum 157:54–68.                                                 to differences in mesophyll conductance to CO2, and photosynthesis
Flexas J, Barbour MM, Brendel O, Cabrera HM, Carriquí M, Díaz-Espejo A,              in two related mediterranean abies species. Plant Cell & Environment
    Douthe C, Dreyer E, Ferrio JP, Gago J, Gallé A, Galmés J, Kodama N,              35:2121–2129.
    Medrano H, Niinemets Ü, Peguero-Pina JJ, Pou A, Ribas-Carbó M,               Peguero-Pina JJ, Sisó S, Flexas J, Galmés J, García-Nogales A, Niinemets Ü,
    Tomás M, Tosens T, Warren CR. 2012. Mesophyll diffusion conductance              Sancho-Knapik D, Saz MÁ, Gil-Pelegrín E. 2017. Cell-level anatomical
    to CO2: an unappreciated central player in photosynthesis. Plant Science:        characteristics      explain    high     mesophyll      conductance     and
    An International Journal of Experimental Plant Biology 193–194:70–84.            photosynthetic capacity in sclerophyllous Mediterranean oaks. The
Flexas J, Ribas-Carbó M, Diaz-Espejo A, Galmés J, Medrano H. 2008.                   New Phytologist 214:585–596.
    Mesophyll conductance to CO2: current knowledge and future                   Peng L, Hocart CH, Redmond JW, Williamson RE. 2000. Fractionation of
    prospects. Plant, Cell & Environment 31:602–621.                                 carbohydrates in Arabidopsis root cell walls shows that three radial
Fry SC. 1988. The growing plant cell wall: chemical and metabolic analysis.          swelling loci are specifically involved in cellulose production. Planta
    Harlow, UK: Longman Group Limited.                                               211:406–414.
Giuliani R, Koteyeva N, Voznesenskaya E, Evans MA, Cousins AB,                   Poorter H, Niinemets Ü, Poorter L, Wright IJ, Villar R. 2010. Causes and
    Edwards GE. 2013. Coordination of leaf photosynthesis, transpiration,            consequences of variation in leaf mass per area (LMA): a meta‐analysis.
    and structural traits in rice and wild relatives (Genus Oryza). Plant            New Phytologist 182:565–588.
    Physiology 162:1632–1651.                                                    Pucher GW, Leavenworth CS, Vickery HB. 1932. Determination of starch in
Hanba YT, Kogami H, Terashima I. 2002. The effect of growth irradiance               plant tissues. Plant Physiology 20:850–853.
    on leaf anatomy and photosynthesis in Acer species differing in light        Reich PB, Uhl C, Walters MB, Ellsworth DS. 1991. Leaf lifespan as a
    demand. Plant Cell & Environment 25:1021–1030.                                   determinant of leaf structure and function among 23 amazonian tree
Harley PC, Loreto F, Di Marco G, Sharkey TD. 1992. Theoretical                       species. Oecologia 86:16–24.
    considerations when estimating the mesophyll conductance to CO(2)            Ren T, Weraduwage SM, Sharkey TD. 2019. Prospects for enhancing leaf
    flux by analysis of the response of Photosynthesis to CO(2). Plant               photosynthetic capacity by manipulating mesophyll cell morphology.
    Physiology 98:1429–1436.                                                         Journal of Experimental Botany 70:1153–1165.
Hassiotou F, Ludwig M, Renton M, Veneklaas EJ, Evans JR. 2009. Influence of      Scafaro AP, von Caemmerer S, Evans JR, Atwell BJ. 2011. Temperature
    leaf dry mass per area, CO2, and irradiance on mesophyll conductance             response of mesophyll conductance in cultivated and wild Oryza
    in sclerophylls. Journal of Experimental Botany 60:2303–2314.                    species with contrasting mesophyll cell wall thickness. Plant, Cell &
Hassiotou F, Renton M, Ludwig M, Evans JR, Veneklaas EJ. 2010.                       Environment 34:1999–2008.
    Photosynthesis at an extreme end of the leaf trait spectrum: how             Schneider CA, Rasband WS, Eliceiri KW. 2012. NIH Image to ImageJ:
    does it relate to high leaf dry mass per area and associated structural          25 years of image analysis. Nature Methods 9:671–675.
    parameters? Journal of Experimental Botany 61:3015–3028.                     Sluiter A, Hames B, Ruiz R, Scarlata C, Sluiter J, Templeton D, Crocker D.
Hikosaka K, Shigeno A. 2009. The role of Rubisco and cell walls in the               2008. Determination of structural carbohydrates and lignin in biomass.
    interspecific variation in photosynthetic capacity. Oecologia 160:443–451.       Laboratory Analytical Procedure 1617:1–16.
Li Y, Gao Y, Xu X, Shen Q, Guo S. 2009. Light-saturated photosynthetic rate      Takashima T, Hikosaka K, Hirose T. 2004. Photosynthesis or persistence:
    in high-nitrogen rice (Oryza sativa L.) leaves is related to chloroplastic       nitrogen allocation in leaves of evergreen and deciduous Quercus
    CO2 concentration. Journal of Experimental Botany 60:2351–2360.                  species. Plant, Cell & Environment 27:1047–1054.
12    |   AoB PLANTS, 2020, Vol. 12, No. 4

Terashima I, Hanba YT, Tazoe Y, Vyas P, Yano S. 2006. Irradiance and             Wei HH, Li C, Zhang HC, Sun YH, Ma RR, Wang XY, Yang JW, Dai QG, Huo ZY,
    phenotype: comparative eco-development of sun and shade leaves in               Xu K, Wei HY, Guo BW. 2014. Plant-type characteristics in populations
    relation to photosynthetic CO2 diffusion. Journal of Experimental Botany        with different yield of Yongyou 12. Acta Agronomica Sinica 40: 2160–2168.
    57:343–354.                                                                  Wright IJ, Cannon K. 2001. Relationships between leaf lifespan and
Terashima I, Hanba YT, Tholen D, Niinemets Ü. 2011. Leaf functional                 structural defences in a low-nutrient, sclerophyll Xora. Functional
    anatomy in relation to photosynthesis. Plant Physiology 155:108–116.            Ecology 15:351–359.
Tomás M, Flexas J, Copolovici L, Galmés J, Hallik L, Medrano H, Ribas-           Wright IJ, Reich PB, Westoby M, Ackerly DD, Baruch Z, Bongers F, Flexas J.
    Carbó M, Tosens T, Vislap V, Niinemets Ü. 2013. Importance of leaf              2004. The worldwide leaf economics spectrum. Nature 428:821–827.
    anatomy in determining mesophyll diffusion conductance to CO2                Wu Z, Zhou H, Zhang S, Liu Y. 2013. Using 222Rn to estimate submarine
    across species: quantitative limitations and scaling up by models.              groundwater discharge (SGD) and the associated nutrient fluxes into
    Journal of Experimental Botany 64:2269–2281.                                    Xiangshan Bay, East China Sea. Marine Pollution Bulletin 73:183–191.
Tosens T, Niinemets Ü, Westoby M, Wright IJ. 2012. Anatomical basis of           Xiong D, Flexas J, Yu T, Peng S, Huang J. 2016a. Leaf anatomy mediates
    variation in mesophyll resistance in eastern Australian sclerophylls:           coordination of leaf hydraulic conductance and mesophyll
    news of a long and winding path. Journal of Experimental Botany                 conductance to CO2 in Oryza. The New Phytologist 213:572–583.

                                                                                                                                                                   Downloaded from https://academic.oup.com/aobpla/article/12/4/plaa028/5860164 by guest on 26 September 2020
    63:5105–5119.                                                                Xiong D, Wang D, Liu X, Peng S, Huang J, Li Y. 2016b. Leaf density explains
Uehlein N, Lovisolo C, Siefritz F, Kaldenhoff R. 2003. The tobacco aquaporin        variation in leaf mass per area in rice between cultivars and nitrogen
    NtAQP1 is a membrane CO2 pore with physiological functions. Nature              treatments. Annals of Botany 117:963–971.
    425:734–737.                                                                 Xiong DL, Yu TT, Ling XX, Fahad S, Peng SB, Li Y, Huang JL. 2015. Sufficient
Valentini R, Epron D, De Angelis P, Matteucci G, Dreyer E. 1995. In situ            leaf transpiration and nonstructural carbohydrates are beneficial for
    estimation of net CO2 assimilation, photosynthetic electron flow and            high-temperature tolerance in three rice (Oryza sativa) cultivars and
    photorespiration in Turkey oak (Q. cerris L.) leaves: diurnal cycles under      two nitrogen treatments. Functional Plant Biology 42:347–356.
    different levels of water supply. Plant, Cell & Environment 18:631–640.      Xu N, Zhang W, Ren S, Liu F, Zhao C, Liao H, Xu Z, Huang J, Li Q, Tu Y,
van Arendonk JJCM, Poorter H. 1994. The chemical composition and                    Yu B, Wang Y, Jiang J, Qin J, Peng L. 2012. Hemicelluloses negatively
    anatomical structure of leaves of grass species differing in relative           affect lignocellulose crystallinity for high biomass digestibility
    growth rate. Plant, Cell & Environment 17:963–970.                              under NaOH and H2SO4 pretreatments in Miscanthus. Biotechnology
Veromann-Jürgenson LL, Tosens T, Laanisto L, Niinemets Ü. 2017. Extremely           for Biofuels 5:58.
    thick cell walls and low mesophyll conductance: welcome to the world         Yamori W, Nagai T, Makino A. 2011. The rate‐limiting step for CO2
    of ancient living! Journal of Experimental Botany 68:1639–1653.                 assimilation at different temperatures is influenced by the leaf
Villar R, Ruiz-Robleto J, Ubera JL, Poorter H. 2013. Exploring variation in         nitrogen content in several C3 crop species. Plant Cell & Environment
    leaf mass per area (LMA) from leaf to cell: an anatomical analysis of 26        34:764–777.
    woody species. American Journal of Botany 100:1969–1980.                     Ye M, Peng SB, Li Y. 2019. Intraspecific variation in photosynthetic nitrogen-
von Caemmerer S, Evans JR, Hudson GS, Andrews TJ. 1994. The kinetics                use efficiency is positively related to photosynthetic rate in rice (Oryza
    of ribulose-1, 5-bisphosphate carboxylase/oxygenase in vivo inferred            sativa L.) plants. Photosynthetica 57:311–319.
    from measurements of photosynthesis in leaves of transgenic tobacco.         Yoshida S. 1981. Physiological analysis of rice yield. Fundamentals of Rice
    Planta 195:88–97.                                                               Crop Science. Manila, Philippines: The International Rice Research
Wang XY, Wei HH, Zhang HC, Sun J, Zhang JM, Li C, Lu HB, Yang JW, Ma RR,            Institute, 231–268.
    Xu JF, Wang J, Xu YJ, Sun YH. 2014. Population characteristics for super-    Yoshida S, Forno DA, Cock JH, Gomez KA. 1976. Laboratory Manual for
    high yielding hybrid rice Yongyou 12 (> 13.5 t ha-1). Acta Agronomica           Physiological Studies of Rice. Manila: International Rice Research Institute
    Sinica 40:2149–2159.                                                            Press.
You can also read