Low cost calcium fluorometry for long term nanoparticle studies in living cells - Nature
←
→
Page content transcription
If your browser does not render page correctly, please read the page content below
www.nature.com/scientificreports
OPEN Low‑cost calcium fluorometry
for long‑term nanoparticle studies
in living cells
Connor L. Beck1, Clark J. Hickman1,2 & Anja Kunze 1*
Calcium fluorometry is critical to determine cell homeostasis or to reveal communication patterns
in neuronal networks. Recently, characterizing calcium signalling in neurons related to interactions
with nanomaterials has become of interest due to its therapeutic potential. However, imaging of
neuronal cell activity under stable physiological conditions can be either very expensive or limited in
its long-term capability. Here, we present a low-cost, portable imaging system for long-term, fast-
scale calcium fluorometry in neurons. Using the imaging system, we revealed temperature-dependent
changes in long-term calcium signalling in kidney cells and primary cortical neurons. Furthermore,
we introduce fast-scale monitoring of synchronous calcium activity in neuronal cultures in response
to nanomaterials. Through graph network analysis, we found that calcium dynamics in neurons are
temperature-dependent when exposed to chitosan-coated nanoparticles. These results give new
insights into nanomaterial-interaction in living cultures and tissues based on calcium fluorometry and
graph network analysis.
Imaging calcium dynamics in and between neurons is essential to analyse neural signalling and to better under-
stand how drugs, metabolites, and neural treatments impact the plasticity of signalling in neural networks.
Commercially available techniques to record calcium activity rely on the induction of a calcium-dependent
fluorescent sensor and fluorescent-based high-resolution microscopy for both in vivo and in vitro a pplications1.
High-resolution optical microscopy, e.g., two-photon or confocal microscopy, has revealed valuable knowledge
about subcellular calcium signalling2. These imaging modalities, however, usually require expensive optical
setups, integrated laser systems, and high computing power for fast image processing, which is often limited in
remote, low-resource capacity regions. Furthermore, adverse photo tissue interactions3 still bind optical micros-
copy techniques to in vitro operations using cultured brain slices or neural networks grown from dissociated
brain tissues. These tissues and neuronal networks grown from cultures require an incubator environment that
mimics the physiological concentration of oxygen, carbon dioxide, humidity, and temperature. Some of the
weaknesses of traditional optical microscope systems may limit point-of-care systems in low-cost healthcare
environments. These weaknesses, however, can be overcome through small-size digital microscopy integrated
into customized incubation systems.
Over the last decade, digital microscopy has seen growth in the form of lens-free imaging platforms and
small-scale single-lens digital imaging platforms4. Both imaging platforms offer low-cost, high-speed fluorescent
imaging capabilities for a large field of view that permits imaging of time-resolved cell dynamics or point-of-
care disease s creenings5,6. Furthermore, both imaging platforms are small enough to fit into portable incubator
systems allowing for long-term imaging of cell dynamics over several hours, days, or weeks. Using a three-
dimensional printed lens-free video microscopy platform, Kesavan et al. were able to monitor cell growth kinetics,
cell motility continuously, and cell death of mesenchymal stem cells, bone, and skin cancer cells for up to 90 h at
high-content (> 100,000 measurements per experimental condition)7. Reconstruction of cell features, however,
required computationally intensive holographic image processing methods and access to high-resource setting
cell incubation methods. A combination of a long-term, low-cost, live-cell imaging and incubation system has
been introduced by Walzik et al.8. The authors used webcam-based digital microscopy in an in-house designed
incubator to capture cell proliferation of kidney cancer cells (HEK293) for up to 48 h8. Rajan et al. built a portable
upright digital imaging platform with additional capabilities for extracellular electrophysiological recording9.
1
Department of Electrical and Computer Engineering, Montana State University, Bozeman, Montana 59717,
USA. 2Present address: Department of Physics, North Carolina State University, Raleigh, NC 27695, USA. *email:
anja.kunze@montana.edu
Scientific Reports | (2020) 10:12568 | https://doi.org/10.1038/s41598-020-69412-1 1
Vol.:(0123456789)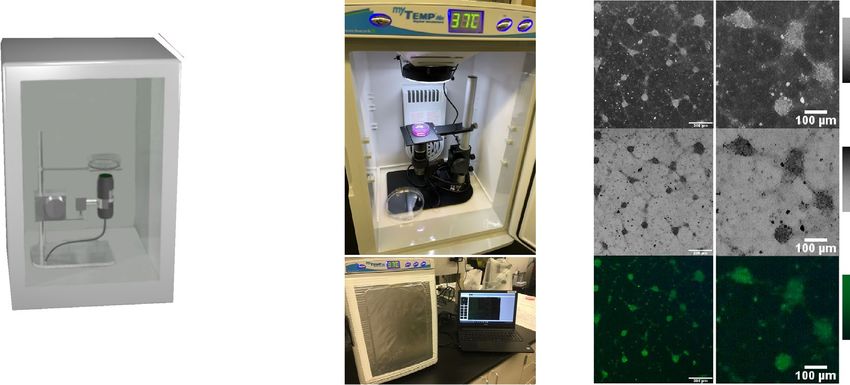
www.nature.com/scientificreports/
A B1 C1 high
0.4 m 0.
35
m
low
Temperature
control
0.5 m
C2 high
White-light
system
Culture dish low
Petri-dish
holder B2 C3 high
Adjustable Digital fluorescent low
focus microscope
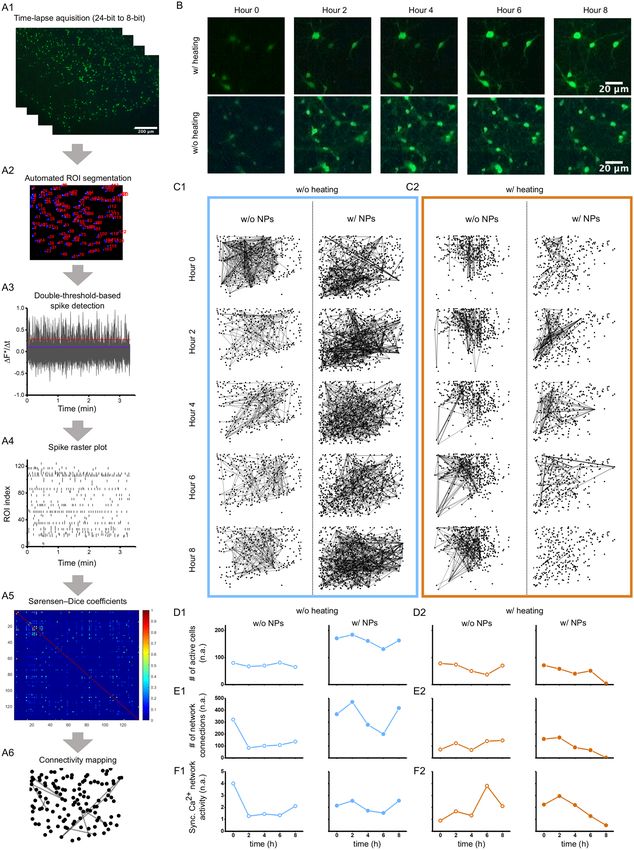
Figure 1. The portable integrated live-cell fluorescent imaging system to study calcium dynamics in
mammalian cells. (A) Conceptual design of a low-cost, a light-weighted imaging system for continuous
monitoring of live-cell activity using fluorescent probes. (B1) Incubator set up with an adjustable biological
sample holder, digital fluorescent microscopy, and white-light system. (B2) Bench-top setup of the imaging
system for multi-lab usage. (C1) Acquired bright field grey-scaled image shows neuronal cell clusters grown
from dissociated primary neurons during week two. (C2) Corresponding inverted grey-scaled image. (C3)
Green-fluorescent image of Fluo4 AM loaded neurons. Scale bar = 300 µm.
Both systems, the webcam-based and upright digital microscopy, allow for bright and darkfield illumination,
but not for fluorescent-probe-based sensing.
Here, we demonstrate the capability of using off-the-shelf fluorescent digital microscopy10 in combination
with coloured light-emitting-diode illumination and white-light illumination to capture calcium dynamics in
several hundreds of neurons simultaneously in a low-cost and portable incubation system. We validated the
robustness and portability of our system through two experimental sets. The first set demonstrates the capabil-
ity of long-term image acquisition through monitoring temperature-dependent calcium dynamics in HEK293
cells in a lab-extern cell culture facility and primary cortical neurons grown in our lab. The second set validates
fast-scale, short-term image acquisition through monitoring temperature-dependent calcium influx, and efflux
events under reduced carbon-dioxide conditions. Precisely, we were able to characterize slow, long-term calcium
dynamics in primary cortical neuron cultures based on (a) temperature-dependent temporal changes in calcium
signalling, (b) calcium events associated with cell death, and (c) fast-scale spatiotemporal changes in synchro-
nous calcium dynamics associated with the uptake of chitosan-coated nanoparticles. This low-cost, portable,
and easy to assemble long-term imaging platform can expand fluorescent imaging of neuronal cell dynamics to
low-resource environments, field settings, and even classrooms. Hence it has the potential to expand knowledge-
gaining and next-generation neuro-tool development to a broader academic spectrum.
Results and discussion
Portable live‑cell imaging system for low‑cost fluorometry. Our live-cell fluorescent imaging sys-
tem consists of four parts: a portable, compact bench-top incubator, a digital microscope with connection to a
portable computational station, a white-light LED ring, and an adjustable petri dish holder (Fig. 1A). All four
parts are off-the-shelf components and were chosen for a fast and easy assembly that required only a few modifi-
cations to the incubator system. Hence the resultant, low-cost imaging system allows for high reproducibility in a
training/classroom setting or a low-resource environment. The bench-top assembly of the incubator is shown in
Fig. 1B1 and B2. The incubator has integrated temperature control and the possibility to be upgraded to regulate
carbon dioxide (CO2) levels. The digital microscope provides software-controlled switchable blue and yellow
light-emitting diodes (LEDs) for 480 nm and 575 nm excitation with an integrated emission filter between 510
and 610 nm. A white-light LED ring was installed at the top of the incubator to add bright field imaging. A
representative white-light cell culture image taken with primary cortical neurons is shown in Fig. 1C1, with its
inverted version shown in Fig. 1C2. Figure 1C3 shows the corresponding green-fluorescent signal with 480 nm
excitation of the Fluo-4 AM loaded neurons. Image contrast of these images can be assessed through histogram
plots, which are shown in supplementary data (Fig. S6, Fig. S7, see supplementary files).
The complete live-cell imaging system weighs 8.1 kg, has dimensions of 35 cm × 40 cm × 50 cm, and costs
below US$ 2000. Our imaging solution is an improvement of existing long-term imaging s ystems5,8–10, as it com-
bines portability with temperature control and digital calcium fluorometry for low-cost live-cell studies without
the need for 3D printing, expertise in computer-automated-design, and skills in assembling. The small footprint
and lightweight characteristics of our imaging system make live-cell fluorometry and portability between research
and classroom space possible and accessible.
Scientific Reports | (2020) 10:12568 | https://doi.org/10.1038/s41598-020-69412-1 2
Vol:.(1234567890)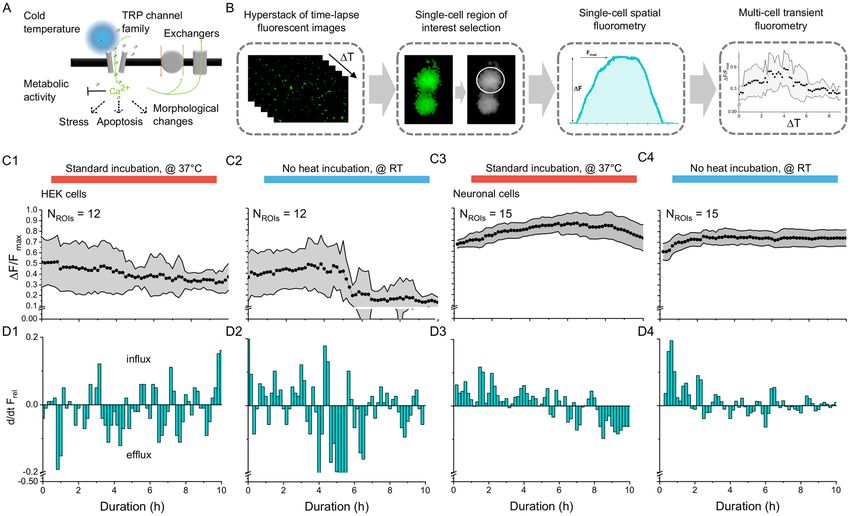
www.nature.com/scientificreports/
Digital fluorescent imaging characteristics. To assess the optical characteristics and limitations of our
digital fluorescent imaging system, we used Dragon green fluorescent beads with a diameter of 15.65 µm and
compared their optical appearance between the digital fluorescent microscope against a commercially avail-
able high-end, fluorescent optical microscope. Figure 2A1 shows the green fluorescent beads in a 24-bit, RGB
image taken with a green-emission filter (mercury lamp excitation) under the high-end optical microscope
(40×, 2.0 megapixel). In contrast, Fig. 2A2 shows the same beads imaged with the digital microscope in a 24-bit
RGB image (220×, 1.3 megapixels). The fluorescent digital microscope provides two-dimensional images from
a CMOS camera in a field-of-view with 1280 × 1024 pixel array (1574 µm × 1180 µm), resulting in an imaging
resolution of 1.352 pixels per micrometre at highest magnification (220×). The high-end optical microscope
provides 1.25 pixels per micrometre (with 10× objective) and 3 pixels per micrometre (with 20× objective). The
higher optical zoom, however, reduces the field-of-view for the optical system down to 668 µm × 668 µm. Hence,
the imaging resolution of the digital fluorescent microscope is comparable to the high-end optical microscope
and, therefore, suitable for fluorometry at the cellular level and similar to image resolutions reported in Yang
et al.11. The large field-of-view of the digital system furthermore provides an advantage for cell network studies.
Next, we characterized the spatial homogeneity of the optical appearance of the beads within the field of view.
For this comparison, 24-bit images were downsampled to 8-bit grey-scale images (Fig. 2B) and single bead images
extracted (43 × 43 pixels) for signal-to-noise ratio (SNR), mean-absolute-error (MAE), peak signal-to-noise
(PSNR), and root-mean-standard error (RMSE) analysis. The first test compares the spatial bead appearance
within the high-end optical microscope image (Fig. 2C1), showing an averaged SNR of 8 dB and an averaged
PSNR of 11.5 dB. In contrast, the second test compared images taken with the digital fluorescent microscope.
These images have a slightly higher averaged SNR and PSNR of 17 dB and 20 dB (Fig. 2C2), in which a rand-
omized comparison test between the two microscopes also confirms (Fig. 2C3). However, the PSNR and RMSE
show lower values for images captured with the digital than with the high-end optical microscope, indicating
higher signal uniformity within the digital image acquisition (Fig. 2D1–D3). Furthermore, the high-end micro-
scope showed a more substantial variance in both the SNR and PSNR. This characteristic can be explained
through higher sensitivity and imaging artefacts from multiple optical lenses and a longer light path. While
high-end optical microscopes have the advantage of picking up signal differences at the subcellular scale, digital
fluorometry provides more uniformity and lower noise sensitivity.
Validation of long‑term live‑cell fluorometry through analyzing temperature‑dependent cal-
cium events. Human embryonic kidney cells are known to express endogenous calcium channels12. One
class of ion channels is called transient receptor potential (TRP) channels and mainly known to regulate the
intake of cations under changes in t emperature13. Within the class of TRP channels, some specific channels are
more selective to regulate calcium influx (TRPV5, TRPV6) than others14, which is, however, beyond the focus of
our study, here. TRP channels sit in the cell membrane pointing towards the extracellular space where they can
sense changes in temperature, graphically sketched as a cold blue ball in Fig. 3A. Depending on the type, TRP
channels can be either cold-sensitive channel (< 21 °C, TRPM8), or heat-sensitive (> 43 °C, TRPV1) to gate cal-
cium into the cytosol15–19. Once activated, TRP channels allow calcium ions to enter the cytosol, which can lead
to further downstream processes causing cell apoptosis, changes in metabolic activity, or cell morphology20–25.
Hence, we used HEK cells to demonstrate the ability of our imaging system to monitor temperature-effects in
long-term calcium fluorometry. To capture temperature sensation in HEK cells, we performed a 10-h, live-cell
fluorescent imaging experiment using Fluo4 AM as a calcium probe in our portable incubator systems either
under 37 °C with temperature control, or under room temperature (~ 20 °C, RT). Images were taken every
10 min with 1 s exposure time. From the time-lapse images, we extracted single-cell fluorescent profiles and
plotted averaged changes in fluorescent activity from multiple cells over time (Fig. 3B).
HEK cells incubated with 37 °C temperature control maintained regular calcium activity, as represented by
an almost constant average intensity profile over the 10 h (Fig. 3C1). Analyzing calcium efflux and influx events,
as shown in Fig. 3D1, confirms physiological healthy cell behaviour. We then imaged HEK cells incubated
under RT (temperature control was switched off, and the system was cooled to RT) and observed a 67% decay
in fluorescence intensity between 5 and 6 h incubation (Fig. 3C2). Between 5 and 6 h, all calcium events can
be attributed to calcium efflux, indicating induced cell death to prolonged exposure to temperatures below the
physiological temperature level of 37 °C.
Next, we extended our cold-sensation study to primary cortical neurons, which were dissociated from embry-
onic brain tissues (rat, E18) and grown for 2 weeks. Based on the same calcium fluorometry used in HEK
cells, cortical neurons express a higher baseline in normalize calcium signal intensity (ΔF/Fmax, Fig. 3C1, C2
vs. Fig. 3C3, and 3C4) in their cell bodies with fewer oscillations between calcium influx and efflux events, and
lower influx and efflux amplitudes (Fig. 3D1, D2 vs. Fig. 3D3, and D4). Visually comparing the period of oscil-
latory calcium events between neurons and HEK cells showed lower values for neurons (Fig. 3D1–D4) than for
HEK cells. More stunningly, incubating neurons under room temperature for 10 h resulted in a uniform calcium
profile. Calcium efflux events were present but not as significant in amplitude as in the HEK-cell experiment
(Fig. 3D2, D4). This contrasting behaviour between primary cortical neurons and HEK cells may link to the dif-
ferent members of TRP channels. It may be likely that neurons endogenously express more heat-sensitive TRPV1
than cold-sensitive TRPM8. Variation in calcium activity due to inhomogeneity in cultured neuronal networks or
the sample size is shown in Fig. S1 and Fig. S2 and can be excluded as a course of effect (see supplementary file).
Slow, long‑term changes in calcium dynamics associated with cell death. One aspect of temper-
eath20–22,24,26,27. Although
ature-mediated processes in neurons is related to calcium signalling and its link to cell d
our experiments suggest that neurons, when imaged at RT, show almost no decrease in average calcium fluores-
Scientific Reports | (2020) 10:12568 | https://doi.org/10.1038/s41598-020-69412-1 3
Vol.:(0123456789)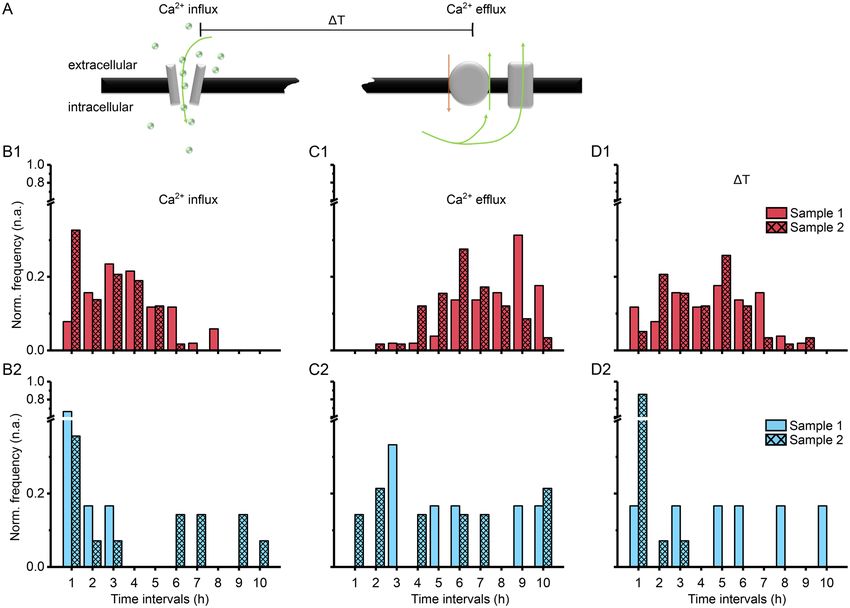
www.nature.com/scientificreports/

                      A1                                                        A2                                   B   24-bit RGB color                          8-bit gray

                                                               100 µm                                100 µm
                                                  low                   high                low             high         low                 high            low                 high

                     C1                                                               C2                                        C3
                                              Reference          Test                        Reference        Test                          Reference               Test

                                               16 µm

                                         50
                                         40                                                                                                             10
                                         30
                       SNR & PSNR [dB]

                                                                                                                                                         1
                                         20

                                                                                                                                                      0.1

                                         10
                                                                                                                                                     0.01

                                                    SNR                        PSNR                SNR                   PSNR                       SNR                         PSNR
                     D1                                                                D2                                             D3
                                         80
                    RMSE & MAE [pixel]

                                         60

                                         40

                                                                                                                                               25%~75%
                                         20                                                                                                    Range within 1.5IQR
                                                                                                                                               Median Line
                                                                                                                                               Mean
                                          0
                                                   RMSE                         MAE               RMSE                   MAE                        RMSE                        MAE

                                                               Figure 2.  Digital fluorescent imaging is comparable to high-end fluorescent microscopy at the single-cell
                                                               level. (A1) Magnified fluorescent images of green-fluorescent beads (15.65 µm) imaged with a high-end
                                                               fluorescent optical microscope (40x) and (A2) the digital microscope (220x). (B) Large-scale comparison of
                                                               fluorescent image uniformity and signal-to-noise ratio was performed on grey-scale, 8-bit images, which were
                                                               down-sampled from multi-colour 24-bit RGB colour images. (C1–D3) Comparison tests were performed
                                                               on individual green-fluorescent beads in relation to near-distance (< 1 mm) neighbouring beads based on a
                                                               signal-to-noise ratio (SNR), a peak signal-to-noise ratio (PSNR), a mean absolute error (MAE), and a root-
                                                               mean-square error (RMSE). (C1–C2) Boxplots show distribution of image quality based on SNR and PSNR for
                                                               (C1) the high-end fluorescent optical microscope (n = 10), and for (C2) the low-cost digital microscope (n = 10).
                                                               (C3) Randomized inter-comparison of SNR and of PSNR of fluorescent bead appearance between high-end
                                                               optical and low-cost digital microscopy (n = 10). (D1–D2) Boxplots show distribution of image quality based on
                                                               MAE and RMSE for (D1) the high-end fluorescent optical microscope (n = 10), and for (D2) the low-cost digital
                                                               microscope (n = 10). (D3) Randomized inter-comparison of SNR and PSNR of fluorescent bead appearance
                                                               between high-end optical and low-cost digital microscopy.

                                                               cent signalling, we carefully analysed our data regarding calcium signals that shown only one spike (a one-time
                                                               calcium influx followed by calcium efflux) in a cell body over the whole time course. The single spike event may
                                                               indicate the occurrence of cell death. For calcium spike events that occurred only once, we measured the time
                                                               delay (ΔT) until the calcium efflux occurred (Fig. 4A). In Fig. 4B1 and C1, we show the distribution of neu-

          Scientific Reports |                            (2020) 10:12568 |                 https://doi.org/10.1038/s41598-020-69412-1                                                  4

Vol:.(1234567890)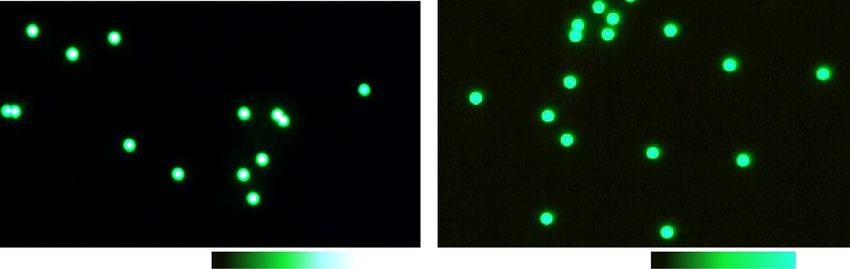
www.nature.com/scientificreports/
Figure 3. Temperature dependence on long-term fluorescent calcium imaging in mammalian cells. (A)
HEK cells are known to express temperature-dependent calcium channels, which may trigger calcium in- or
efflux through so-called TRP channel families. (B) Image processing workflow shows how we continuously
captured fluorescent images using the digital microscope in our incubator setting for single- and multi-
cell spatiotemporal calcium fluorometry and metabolic studies. (C1-4) Temperature-dependent changes in
intracellular calcium levels in (C1–C2) HEK cells and (C3–C4) primary cortical neurons (E18, rat). (D1–D4)
Calcium influx and efflux characteristics show higher temperature sensitivity of HEK cells versus neuronal cells.
ronal cell bodies where only one spike event was detected, and when influx and efflux events occurred. Under
physiological temperature and across 10 h, most of the selected cell bodies seem to die around 5 h (Fig. 4D1).
In contrast to RT, 70% of the calcium influx events occurred within 1 h (Fig. 4B2), and 83% of cells also seem to
die with ΔT of 1 h (Fig. 4C2, D2). These differences in ΔT between RT and 37 °C point towards a temperature-
related cell death mechanism.
Validation of fast‑scale, low‑cost calcium fluorometry to capture spatiotemporal differences
in neuronal calcium signalling during nanoparticle interaction. Our fluorescent imaging system
has shown the ability to capture long-term changes in calcium signalling based on a 1.7 mHz acquisition rate.
The high-speed modalities of the digital microscope, however, can capture images up to 30 Hz, making it an ideal
tool to study fast-scale communication patterns in cultured neuronal networks. To validate our system, we chose
a commercial suspension of chitosan-coated fluorescent nanoparticles and monitored changes in fluorescent
calcium signalling due to nanoparticle endocytosis. The uptake mechanism and behaviour of these nanoparticles
with primary cortical neuron cultures have been extensively studied in previous work28–30, and therefore were
chosen as a first validation experiment for our low-cost imaging system. To assess calcium-mediated commu-
nication patterns in neuronal networks, we grew dissociated cortical neurons up to 2 weeks and imaged their
calcium activity based on Fluo-4 AM. Over an 8h time span, metabolic calcium activity was captured in inter-
vals of 2h for 150 s with a 1 Hz acquisition rate. Representative images of Fluo-4 loaded neurons are shown in
Fig. S8 and Fig. S9 (see supplementary file). Using a fully automated cell body segmentation in combination with
double-threshold based calcium spike detection gave us spike raster plots for each sample set (Fig. 5A1–A4).
From the spike raster plots, the cross-correlation between spike trains was computed using the Sørensen-Dice
coefficient and visualized in a neuronal communication graph called connectivity map that shows synchronous
calcium firing (Fig. 5A5–5A6)31.
Trending in neurobiology is the development of nanotools that can pass the blood–brain barrier, target
drugs to specific brain cell types, or act as a local actuator for brain cell stimulation32–34. Previous studies have
specifically explored the effectiveness of magnetic nanoparticle surface coatings on the uptake of the particles
into neurons30,33,35–37. Understanding the temporal aspect of nanoparticle endocytosis, however, remains elusive
as most uptake studies are endpoint measurements. To investigate temporal variations in nanoparticle endo-
cytosis on the synchronicity of calcium firing, we exposed chitosan-coated magnetic nanoparticles to primary
cortical neurons grown up to 9 days and imaged changes in calcium activity in our portable imaging system at
Scientific Reports | (2020) 10:12568 | https://doi.org/10.1038/s41598-020-69412-1 5
Vol.:(0123456789)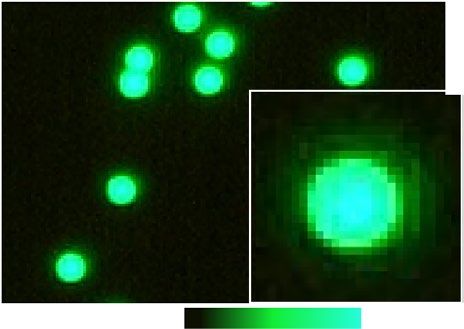
www.nature.com/scientificreports/
Figure 4. Long-term calcium fluorometry reveals temperature-dependent effects on cell death. (A) Differences
in time-delay (ΔT) between calcium influx and calcium efflux through either channels, exchangers, or a rupture
in the cell membrane may allow differentiating between cell apoptosis and cell necrosis. (B1–B2) Counts of
calcium influx under (B1) physiological (37 °C) and (B2) room temperature (RT), n cells = 20. (C1–C2) Counts of
calcium efflux under (C1) physiological and (C2) room temperature, n cells = 20. (D1–D2) Temporal differences
between calcium influx and efflux under (D1) physiological and (D2) room temperature (n = 2).
1 Hz for 150 s in 2 h time intervals over 8 h at RT and at 37 °C. Representative fluorescent images of Fluo-4 AM
loaded neurons are shown for the two temperature conditions in Fig. 5B. Figure 5C1 and C2 show the influence
of temperature and nanoparticle endocytosis on the connectivity maps. Without nanoparticle endocytosis, the
connectivity maps indicate only minor changes in the location of vertices (active cell bodies), the number of
active cell bodies show small cyclic activity remaining overall constant (Fig. 5D1), however, the number of edges
reduces about 70% within the first 2 h (lines due to synchronic activity, Fig. 5E1). In contrast, when nanoparticles
were administered, synchronic activity increased by about 43%, and a spatial shift of the active region occurred.
Between 2 and 6 h, synchronic calcium activity w/NPs reduced by over 64%, before the number of network edges
rises again about 120% (Fig. 5E1 and F1).
Comparing different temperatures, the total number of active cell bodies and edges are similar between physi-
ological and room temperature (Fig. 5D1 versus 5E1, w/o NPs) as long as no nanoparticles were administered.
The small oscillatory changes in calcium influx and efflux are mirrored in our previous temperature-sensation
experiments, where the location of randomly selected cell bodies for a small number of cell groups (< 40 cells)
does not impact calcium fluorometry (see supplementary data, Fig. S1 and Fig. S2). Imaging neurons under
physiological temperature reveals a trending increase in synchronized calcium signalling with large amplitude
oscillation, most-likely correlating with the spatial location of active vertices within the network (Fig. 5C2, D2,
E2, F2, w/o NPs). Incubating chitosan-coated nanoparticles with neurons under 37 °C impacted the spatial
location of active vertices and the number of edges with an overall decreasing trend between 2 and 8 h. While
neurons growing under physiological temperatures showed less synchronous calcium spiking over time (> 2 h)
when incubated with chitosan-coated nanoparticles, individual cell spiking activity may still be high or increased
as shown in previous studies (see also spike raster plots at 6 h in supplementary data, Fig. S3 and Fig. S4)29.
Furthermore, we noted that the incubation of chitosan-coated nanoparticles within the first 2 h increased syn-
chronicity independent on the temperature.
The demonstrated capability of our system to assess communication patterns within living neural networks
based on fast-scale low-cost calcium fluorometry goes beyond often used cell migration and cell viability
Scientific Reports | (2020) 10:12568 | https://doi.org/10.1038/s41598-020-69412-1 6
Vol:.(1234567890)www.nature.com/scientificreports/
assessments7,8,38–40. It advances small scale and portable imaging t echnology11 and provides an affordable tool to
low-resource communities to learn and study more about brain cell communication. Furthermore, it revealed
extensive details about how temperature and time interplay with calcium signalling during nanoparticle
endocytosis.
Conclusions
With an emerging need to capture time-sensitive aspects of fluorescently labelled proteins and signals in mam-
malian cells, we have designed a low-cost, portable, live-cell fluorescent imaging system from off-the-shelf-
components. The described imaging solution is capable of studying calcium dynamics in human embryonic
kidney cell lines and primary cultures of embryonic cerebral neurons and can control culture conditions and
temperature. Using fluorescent probes and p roteins41,42 in combination with nanoparticle interactions in cells,
the low-cost imaging system is suitable to make calcium fluorometry and the study of changes in the cellular
macro- (millimetre scale) and microenvironment (sub-micrometre scale) accessible for low-resource environ-
ments and provides advanced neuroscience research tools for the classroom43. The imaging setup uses digital
fluorescent microscopy to capture changes in cytosolic calcium levels across time with up to 30 Hz. The imaging
system is a low-tech version of similar live-cell imaging p latforms8–11,38,44–47. It was purposely kept at low-cost
(< 2,000 US$) and required no additional computer drawing skills or access to 3D printing. Although the spatial,
optical, and radiometric resolution of our imaging system is lower than that of a high-quality optical microscope,
the system can resolve fluorescent signals down to 1.352 pixels per micrometre. The utilized digital imaging
modality provided more uniformity and lower noise sensitivity across the imaging sample, which increases the
robustness for image signal processing. Furthermore, the imaging system has been demonstrated to provide
stable temperature control for cell biology studies. While our imaging system cannot replace super-resolution
microscopy to study subcellular transport and interaction of nanoparticles with other organelles, it brings the
capability to monitor fast-scale temporal changes within large-scale cell networks. Specifically, we have shown
the utility of our system to derive a neuronal graph called a connectivity map that shows synchronous calcium
firing. Furthermore, we demonstrated the utility of graph network analysis to derive connectivity maps and
applied them to nanoparticle uptake studies, which revealed extensive details about how temperature and time
interplay with calcium signalling during the endocytic process.
Overall, we have demonstrated here a portable, low-cost imaging system that allows us to assess communica-
tion patterns within neural network going beyond often used cell migration and cell viability assessment and
which can be used as an affordable alternative to cost-intense microscopy in low-resource communities to learn
and study more about brain cell communication.
Methods
Portable, live‑cell fluorescent imaging system. An imaging system was designed to maintain con-
stant physiological temperature and humidity control for long-term live-cell monitoring, using off the shelf
elements for high reproducibility at a low-cost. The imaging system was assembled based on a small-scale bench-
top incubator with digital temperature control (e.g., MyTemp™ mini digital incubator), a digital fluorescent
microscope with coloured illumination (LED-based, e.g., Dino-Lite AM4115T-GRFBY), a cell culture sample
holder, and a LED-based white light illumination. The digital fluorescent microscope is a glass-lens based mini
microscope and can be operated at two different excitation wavelengths of 480 nm and 575 nm to monitor green
and red fluorescent probes through a USB- connected desk laptop. The optical sensor in the digital microscope is
a CMOS camera with 1280 × 1024 pixels resolution (1.3 megapixels) that can capture up to 30 frames per second
(fps). A full comparison of our digital live-cell fluorescent imaging system against other portable, low-cost digi-
tal and low-cost traditional optical imaging systems can be found in Table S1 (see supplementary file). Further
methods describing the quantification of the digital fluorescent microscope imaging characteristics, and a 48 h
long-term live-cell validation experiment based on Normal Rattus norvegicus Kidney (NRK) epithelial cells is
also presented in the supplementary data file.
Primary cortical neuron and human embryonic kidney cell culture. To demonstrate the effect of
temperature control of the imaging system, we chose human embryonic kidney (HEK) as they are well known to
exhibit endogenous calcium channels12 and show high sensitivity to non-physiological t emperatures15,18,48. HEK
cells were cultured in mouse embryonic fibroblast (MEF, passage 18) media. When grown to 80% confluency,
cells were trypsinated and reseeded into pre-coated 35 mm Petri dishes for the temperature sensation experi-
ment and grown for 2 days. To test the robustness of our imaging system with neurons, we monitored calcium
signalling in neural cultures grown from dissociated rat cortical neurons. In neurons, calcium fluorometry is an
important imaging methodology to study neuronal cell and network signalling1,20,21,24,25,49–52. Rat cortical hemi-
spheres were dissected from whole embryonic rat brains (E18, BrainBits) and dissociated with 10% (v/v) papain
(Carica papaya, Roche) in Hibernate®-E (BrainBits) at 35 °C for 15 min. Dissociated cortical neurons were
seeded at a cell concentration of 1 million cells per ml into PEI pre-coated 35 mm Petri dishes at a cell density
of 180 cells/mm2 and were incubated (95% air, 5% CO2, 37 °C) in serum-free Neurobasal with 2% (v/v) serum-
free B-27® and 1% (v/v) PenStrep antibiotics, and grown until day 8 in vitro. For calcium fluorometry, Fluo-4
AM with probenecid acid was loaded to the cells (1:1) and incubated for 60 min in a standard incubator (37 °C,
5% CO2) following vendor protocol (ThermoFisher). Somatic calcium dynamics were monitored at 0.1 frames
per min, 1 s exposure time for 10 h with cyclic on/off LED-light 480 nm excitation. The digital microscope was
set to 160×–220× magnification. Cells were either monitored without heat at room temperature (w/o heat), or
at physiological temperature (37 °C, w/heat) in the temperature-controlled live-cell imaging system over 10 h.
Scientific Reports | (2020) 10:12568 | https://doi.org/10.1038/s41598-020-69412-1 7
Vol.:(0123456789)www.nature.com/scientificreports/
Scientific Reports | (2020) 10:12568 | https://doi.org/10.1038/s41598-020-69412-1 8
Vol:.(1234567890)www.nature.com/scientificreports/
◂Figure 5. Chitosan-coated magnetic nanoparticles (NPs) impacts synchronicity in calcium signalling. (A1–A6)
Image processing analysis to extract spatially resolved neuronal connectivity map based on primary cortical
neurons labelled with Fluo-4. (A1) Time-lapse images show pseudo-coloured calcium activity captured with
digital fluorescent microscopy. (A2) Automated image segmentation spatially selects individual regions of
interest (ROIs) based on fluorescently active cell bodies. (A3) Changes in calcium activity get recorded over time
and (A4) transferred into a calcium spike raster plot based on calcium influx. (A5) A cross-correlation matrix
presents high (blue) and low (red) probability of temporally connected calcium spiking activity, which is used
in (A6) to connect the ROIs in a connectivity map. (B) Representing fluorescent images of primary neurons
incubated for 10 h in the digital imaging system. (C1–C2) Connectivity maps present changes in synchronous
calcium spiking activity over an 8-h time span in cortical neurons grown for 9 days in vitro, independent of
room temperature (w/o heating), physiological temperature (w/heating) and of incubation with chitosan-coated
magnetic NPs (w/NPs). (D1–F2) Network analysis shows (D1–D2) number of active neurons under different
temperature conditions, with and without NPs, (E1–E2) number of connections between ROIs under different
temperature conditions, with and without NPs, and (F1–F2) active cell normalized count of connections under
different temperature conditions, with and without NPs. These four plots indicate the activity of the network and
how it changes under the different culture conditions.
Live‑cell nanomaterial fluorometry. At 9 days in vitro (DIV), Fluo-4 AM loaded cortical neurons were
exposed to chitosan-coated fluorescent magnetic nanoparticles (5 × 1 01111 NP per ml, Chemicell, core: 100 nm,
hydrodynamic radius: 190 nm, Fig. S5) and monitored for live-cell fluorescent imaging over 10 h. Extensive
characterization of the chitosan-coated NPs can be found in Tay, Kunze et al.29. Somatic calcium dynamics were
recorded with LED-light 480 nm excitation at 1 fps, 1 s exposure time for 5 min in the incubator system without
heat at room temperature (w/o heat), or at physiological temperature (37 °C, w/heat). During a 2-h interval,
neurons were left without excitation and imaged again with the same parameters. This process was repeated
three times for a total imaging time of 8 h. For control, fluorescent neurons without magnetic nanoparticles were
monitored under the same imaging parameters with and without physiological temperature settings.
Fluorometric image processing. Grey-scale time-lapse images (8-bit) were analysed by selecting multi-
ple single-cell regions of interests (ROIs). Fluorescence signal distribution was extracted, and relative fluores-
cence (Frel) was plotted based on Eq. 1, where Fmax is the maximal detected fluorescent signal in all images, F is
the averaged fluorescent intensity per ROI, and FBkg denotes the background fluorescent signal.
F F − FBkg
Frel = = (1)
Fmax Fmax
Time-varying changes of somatic fluorescence (Fpixel) were recorded and averaged fluorescent intensity F
across each cellular ROI was calculated using Eq. 2. Equation 2 shows n as the total number of pixels and Fpixel
as the intensity value of each indexed pixel per ROI.
n
Fpixel
F = i=1 (2)
n
Second, F was normalized by the average background (FBkg) for each frame resulting in F* as shown in Eq. 3:
F
F∗ = (3)
FBkg
Third, a relative fluorescence change ( F ∗ t ), where Δt is the f ramerate-1 was used for subsequent cal-
cium signalling analysis. Calcium spike events were distinguished
∗
based on calcium influx and efflux. ∗For both
a double threshold analysis was applied based on a static ( �F
�t > ±0.05 ) and a varying threshold ( �F
�t > ±5x
standard deviation). A calcium spike event was then set as a calcium influx for a positive amplitude above the
highest positive threshold, and as a calcium efflux event for a negative amplitude below the smallest negative
threshold. From these calcium events, raster plots and connectivity maps were generated (see supplementary
data for more information).
Supplementary information file available
A supplementary information file is available and provides additional information about methodology, data
analysis, data calibration, and pre-processed calcium data, including ten supplementary figures (Figure S1–S10)
and one supplementary table (Table S1).
Received: 29 April 2020; Accepted: 10 July 2020
References
1. Grienberger, C. & Konnerth, A. Imaging calcium in neurons. Neuron 73, 862–885. https://doi.org/10.1016/j.neuron.2012.02.011
(2012).
2. Simms, B. A. & Zamponi, G. W. Neuronal voltage-gated calcium channels: structure, function, and dysfunction. Neuron 82, 24–45.
https://doi.org/10.1016/j.neuron.2014.03.016 (2014).
Scientific Reports | (2020) 10:12568 | https://doi.org/10.1038/s41598-020-69412-1 9
Vol.:(0123456789)www.nature.com/scientificreports/
3. Thomsen, S. Pathologic analysis of photothermal and photomechanical effects of laser–tissue interactions. Photochem. Photobiol.
53, 825–835. https://doi.org/10.1111/j.1751-1097.1991.tb09897.x (1991).
4. Ozcan, A. & McLeod, E. Lensless imaging and sensing. Annu. Rev. Biomed. Eng. 18, 77–102. https: //doi.org/10.1146/annure v-bioen
g-092515-010849 (2016).
5. Berg, B. et al. Cellphone-based hand-held microplate reader for point-of-care testing of enzyme-linked immunosorbent assays.
ACS Nano 9, 7857–7866. https://doi.org/10.1021/acsnano.5b03203 (2015).
6. Wang, L.-J. et al. Smartphone optosensing platform using a DVD grating to detect neurotoxins. ACS Sens. 1, 366–373. https://doi.
org/10.1021/acssensors.5b00204 (2016).
7. Kesavan, S. V. et al. High-throughput monitoring of major cell functions by means of lensfree video microscopy. Sci. Rep. 4, 5942.
https://doi.org/10.1038/srep05942 (2014).
8. Walzik, M. P. et al. A portable low-cost long-term live-cell imaging platform for biomedical research and education. Biosens.
Bioelectron. 64, 639–649. https://doi.org/10.1016/j.bios.2014.09.061 (2015).
9. Rajan, D. K. et al. A portable live-cell imaging system with an invert-upright-convertible architecture and a mini-bioreactor for
long-term simultaneous cell imaging, chemical sensing, and electrophysiological recording. IEEE Access 6, 11063–11075. https://
doi.org/10.1109/ACCESS.2018.2804378 (2018).
10. Hasan, M. M., Alam, M. W., Wahid, K. A., Miah, S. & Lukong, K. E. A low-cost digital microscope with real-time fluorescent
imaging capability. PLoS ONE 11, e0167863. https://doi.org/10.1371/journal.pone.0167863 (2016).
11. Yang, K. et al. Recent development of portable imaging platforms for cell-based assays. Biosens. Bioelectron. 124–125, 150–160.
https://doi.org/10.1016/j.bios.2018.10.024 (2019).
12. Berjukow, S. et al. Endogenous calcium channels in human embryonic kidney (HEK293) cells. Br. J. Pharmacol. 118, 748–754
(1996).
13. Zagranichnaya, T. K., Wu, X. & Villereal, M. L. Endogenous TRPC1, TRPC3, and TRPC7 proteins combine to form native store-
operated channels in HEK-293 cells. J. Biol. Chem. 280, 29559–29569. https://doi.org/10.1074/jbc.M505842200 (2005).
14. Owsianik, G., Talavera, K., Voets, T. & Nilius, B. Permeation and selectivity of trp channels. Annu. Rev. Physiol. 68, 685–717. https
://doi.org/10.1146/annurev.physiol.68.040204.101406 (2006).
15. Peier, A. M. et al. A TRP channel that senses cold stimuli and menthol. Cell 108, 705–715. https://doi.org/10.1016/S0092
-8674(02)00652-9 (2002).
16. Zheng, J. Molecular mechanism of TRP channels. Compr. Physiol. 3, 221–242. https://doi.org/10.1002/cphy.c120001 (2013).
17. McKemy, D. D., Neuhausser, W. M. & Julius, D. Identification of a cold receptor reveals a general role for TRP channels in ther-
mosensation. Nature 416, 52. https://doi.org/10.1038/nature719 (2002).
18. Xu, H. et al. TRPV3 is a calcium-permeable temperature-sensitive cation channel. Nature 418, 181. https://doi.org/10.1038/natur
e00882 (2002).
19. Voets, T. et al. The principle of temperature-dependent gating in cold- and heat-sensitive TRP channels. Nature 430, 748–754.
https://doi.org/10.1038/nature02732 (2004).
20. Jayakumar, S. & Hasan, G. Neuronal calcium signalling in metabolic regulation and adaptation to nutrient stress. Front. Neural
Circuits 12, 25 (2018).
21. Bahar, E., Kim, H. & Yoon, H. ER stress-mediated signalling: action potential and Ca(2+) as key players. Int. J. Mol. Sci. 17, 1558.
https://doi.org/10.3390/ijms17091558 (2016).
22. Imamura, K. et al. Calcium dysregulation contributes to neurodegeneration in FTLD patient iPSC-derived neurons. Sci. Rep. 6,
34904. https://doi.org/10.1038/srep34904 (2016).
23. Leal, S. S. & Gomes, C. M. Calcium dysregulation links ALS defective proteins and motor neuron selective vulnerability. Front.
Cell. Neurosci. 9, 225 (2015).
24. Gleichmann, M. & Mattson, M. P. Neuronal calcium homeostasis and dysregulation. Antioxid. Redox Signal 14, 1261–1273. https
://doi.org/10.1089/ars.2010.3386 (2011).
25. Zündorf, G. & Reiser, G. Calcium dysregulation and homeostasis of neural calcium in the molecular mechanisms of neurode-
generative diseases provide multiple targets for neuroprotection. Antioxid. Redox Signal 14, 1275–1288. https://doi.org/10.1089/
ars.2010.3359 (2011).
26. Duchen, M. R. Mitochondria and calcium: from cell signalling to cell death. J. Physiol. 529, 57–68. https://doi.org/10.111
1/j.1469-7793.2000.00057.x (2000).
27. Farber, J. L. The role of calcium in cell death. Life Sci. 29, 1289–1295. https://doi.org/10.1016/0024-3205(81)90670-6 (1981).
28. Kunze, A. et al. Modulating motility of intracellular vesicles in cortical neurons with nanomagnetic forces on-chip. Lab Chip 17,
842–854. https://doi.org/10.1039/C6LC01349J (2017).
29. Tay, A., Kunze, A., Murray, C. & Di Carlo, D. Induction of calcium influx in cortical neural networks by nanomagnetic forces. ACS
Nano 10, 2331–2341. https://doi.org/10.1021/acsnano.5b07118 (2016).
30. Tay, A., Kunze, A., Jun, D., Hoek, E. & Di Carlo, D. The age of cortical neural networks affects their interactions with magnetic
nanoparticles. Small 12, 3559–3567. https://doi.org/10.1002/smll.201600673 (2016).
31. Sporns, O. Networks of the Brain (The MIT Press, Cambridge, 2011).
32. Gahl, T. J. & Kunze, A. Force-mediating magnetic nanoparticles to engineer neuronal cell function. Front. Neurosci. 12, 299 (2018).
33. Behzadi, S. et al. Cellular uptake of nanoparticles: journey inside the cell. Chem. Soc. Rev. 46, 4218–4244. https://doi.org/10.1039/
C6CS00636A (2017).
34. Alivisatos, A. P. et al. Nanotools for neuroscience and brain activity mapping. ACS Nano 7, 1850–1866. https://doi.org/10.1021/
nn4012847 (2013).
35. Foroozandeh, P. & Aziz, A. A. Insight into cellular uptake and intracellular trafficking of nanoparticles. Nanoscale Res. Lett. 13,
339–339. https://doi.org/10.1186/s11671-018-2728-6 (2018).
36. Bannunah, A. M., Vllasaliu, D., Lord, J. & Stolnik, S. Mechanisms of nanoparticle internalization and transport across an intestinal
epithelial cell model: effect of size and surface charge. Mol. Pharm. 11, 4363–4373. https://doi.org/10.1021/mp500439c (2014).
37. Lesniak, A. et al. Nanoparticle adhesion to the cell membrane and its effect on nanoparticle uptake efficiency. J. Am. Chem. Soc.
135, 1438–1444. https://doi.org/10.1021/ja309812z (2013).
38. Schneidereit, D., Kraus, L., Meier, J. C., Friedrich, O. & Gilbert, D. F. Step-by-step guide to building an inexpensive 3D printed
motorized positioning stage for automated high-content screening microscopy. Biosens. Bioelectron. 92, 472–481. https://doi.
org/10.1016/j.bios.2016.10.078 (2017).
39. Zhang, Y. S. et al. A cost-effective fluorescence mini-microscope for biomedical applications. Lab Chip 15, 3661–3669. https://doi.
org/10.1039/C5LC00666J (2015).
40. Mudraboyina, A. K., Blockstein, L., Luk, C. C., Syed, N. I. & Yadid-Pecht, O. A novel lensless miniature contact imaging system
for monitoring calcium changes in live neurons. IEEE Photon. J. 6, 1–15. https://doi.org/10.1109/JPHOT.2014.2304554 (2014).
41. Lock, J. T., Parker, I. & Smith, I. F. A comparison of fluorescent Ca2+ indicators for imaging local Ca2+ signals in cultured cells. Cell
Calcium 58, 638–648. https://doi.org/10.1016/j.ceca.2015.10.003 (2015).
42. Chen, T.-W. et al. Ultrasensitive fluorescent proteins for imaging neuronal activity. Nature 499, 295. https://doi.org/10.1038/natur
e12354 (2013).
43. Gage, G. J. The case for neuroscience research in the classroom. Neuron 102, 914–917. https: //doi.org/10.1016/j.neuron .2019.04.007
(2019).
Scientific Reports | (2020) 10:12568 | https://doi.org/10.1038/s41598-020-69412-1 10
Vol:.(1234567890)www.nature.com/scientificreports/
44. Gürkan, G. & Gürkan, K. Incu-stream 1.0: an open-hardware live-cell imaging system based on inverted bright-field microscopy
and automated mechanical scanning for real-time and long-term imaging of microplates in incubator. IEEE Access 7, 58764–58779.
https://doi.org/10.1109/ACCESS.2019.2914958 (2019).
45. Linsley, J. W. et al. Automated four-dimensional long term imaging enables single cell tracking within organotypic brain slices to
study neurodevelopment and degeneration. Commun. Biol. 2, 155. https://doi.org/10.1038/s42003-019-0411-9 (2019).
46. Ragazzini, G., Mescola, A., Corsi, L. & Alessandrini, A. Fabrication of a low-cost on-stage cell incubator with full automation. J.
Biol. Educ. 53, 165–173. https://doi.org/10.1080/00219266.2018.1451772 (2019).
47. Jin, D. et al. Compact wireless microscope for in-situ time course study of large scale cell dynamics within an incubator. Sci. Rep.
5, 18483. https://doi.org/10.1038/srep18483 (2015).
48. Iftinca, M. et al. Temperature dependence of T-type calcium channel gating. Neuroscience 142, 1031–1042. https: //doi.org/10.1016/j.
neuroscience.2006.07.010 (2006).
49. Patel, T. P., Man, K., Firestein, B. L. & Meaney, D. F. Automated quantification of neuronal networks and single-cell calcium dynam-
ics using calcium imaging. J. Neurosci. Methods 243, 26–38. https://doi.org/10.1016/j.jneumeth.2015.01.020 (2015).
50. Tibau, E., Valencia, M. & Soriano, J. Identification of neuronal network properties from the spectral analysis of calcium imaging
signals in neuronal cultures. Front. Neural Circuits 7, 199 (2013).
51. Augustine, G. J., Santamaria, F. & Tanaka, K. Local calcium signalling in neurons. Neuron 40, 331–346. https://doi.org/10.1016/
S0896-6273(03)00639-1 (2003).
52. Tank, D. W., Sugimori, M., Connor, J. A. & Llinas, R. R. Spatially resolved calcium dynamics of mammalian Purkinje cells in
cerebellar slice. Science 242, 773 (1988).
Acknowledgements
This work was supported by the National Science Foundation [CAREER award, Grant # CBET-1846271 (A.K.)].
C.B. received funding through two subsequent summer fellowships provided by INBRE, funded by the National
Institute of General Medical Sciences of the National Institutes of Health [P20GM103474]. C.H. was supported
by the National Science Foundation Research Experience for Undergraduates (REU) program [Grant # EEC-
1559632]. The authors wish to thank Benjamin Angulo from Reijo Pera’s Lab and Hunter Peterson for providing
HEK293 cells and access to culture facility, Kendra Hergett for providing dissociated neurons for this study, and
William Ratzan from the Kohout Lab at MSU for a gift of NRK cells to perform the 48 h long-term validation.
Author contributions
C.B.: Methodology, Experimental acquisition, Validation, Software, Formal analysis, Data curation and inter-
pretation, Visualization, Manuscript preparation. C.H.: Methodology, Manuscript preparation. A.K.: Concep-
tualization, Validation, Formal analysis, Resources, Data curation, Visualization, Supervision, Project adminis-
tration, Funding acquisition, Manuscript preparation. All authors revised and approved the submission of this
manuscript.
Competing interests
The authors declare no competing interests.
Additional information
Supplementary information is available for this paper at https://doi.org/10.1038/s41598-020-69412-1.
Correspondence and requests for materials should be addressed to A.K.
Reprints and permissions information is available at www.nature.com/reprints.
Publisher’s note Springer Nature remains neutral with regard to jurisdictional claims in published maps and
institutional affiliations.
Open Access This article is licensed under a Creative Commons Attribution 4.0 International
License, which permits use, sharing, adaptation, distribution and reproduction in any medium or
format, as long as you give appropriate credit to the original author(s) and the source, provide a link to the
Creative Commons license, and indicate if changes were made. The images or other third party material in this
article are included in the article’s Creative Commons license, unless indicated otherwise in a credit line to the
material. If material is not included in the article’s Creative Commons license and your intended use is not
permitted by statutory regulation or exceeds the permitted use, you will need to obtain permission directly from
the copyright holder. To view a copy of this license, visit http://creativecommons.org/licenses/by/4.0/.
© The Author(s) 2020
Scientific Reports | (2020) 10:12568 | https://doi.org/10.1038/s41598-020-69412-1 11
Vol.:(0123456789)You can also read