Complexity and plasticity in honey bee phototactic behaviour - KOPS
←
→
Page content transcription
If your browser does not render page correctly, please read the page content below
www.nature.com/scientificreports

            OPEN           Complexity and plasticity in honey
                           bee phototactic behaviour
                           Morgane Nouvian1 ✉ & C. Giovanni Galizia1,2

                           The ability to move towards or away from a light source, namely phototaxis, is essential for a number
                           of species to find the right environmental niche and may have driven the appearance of simple visual
                           systems. In this study we ask if the later evolution of more complex visual systems was accompanied
                           by a sophistication of phototactic behaviour. The honey bee is an ideal model organism to tackle this
                           question, as it has an elaborate visual system, demonstrates exquisite abilities for visual learning and
                           performs phototaxis. Our data suggest that in this insect, phototaxis has wavelength specific properties
                           and is a highly dynamical response including multiple decision steps. In addition, we show that previous
                           experience with a light (through exposure or classical aversive conditioning) modulates the phototactic
                           response. This plasticity is dependent on the wavelength used, with blue being more labile than green
                           or ultraviolet. Wavelength, intensity and past experience are integrated into an overall valence for
                           each light that determines phototactic behaviour in honey bees. Thus, our results support the idea that
                           complex visual systems allow sophisticated phototaxis. Future studies could take advantage of these
                           findings to better understand the neuronal circuits underlying this processing of the visual information.

                           Phototaxis is the movement of an organism in response to light, whether it goes towards it (positive phototaxis)
                           or away from it (negative phototaxis). It is widespread in the animal kingdom and typically understood as an
                           innate, stereotyped, relatively simple response to light. Nonetheless, this behaviour can be modified. For exam-
                           ple, whether light attracts or repels an animal can change during its lifetime, especially if the animal occupies
                           different environments as it ages: some insects switch from positive to negative phototaxis towards the end of
                           their larval stage, as they migrate to a dark refuge (e.g. the soil) to pupate1,2. Young nurse bees performing indoor
                           tasks are negatively phototactic, while older foragers are attracted to light3. At smaller time scales, phototactic
                           behaviour may follow a circadian rhythm, as shown in larval fruit flies4. Adult Drosophila also shift their prefer-
                           ence depending on their internal state: they are normally attracted to light, but will avoid it if their ability to fly is
                           compromised5.
                               Phototaxis only requires very simple eyes 6, but it did not disappear with the evolution of complex,
                           image-forming eyes such as the honey bees’. There, the architecture of the visual system could potentially support
                           more elaborate forms of phototaxis, especially when multiple photoreceptors responding to different wavelengths
                           are involved. In frogs, grasshoppers, psyllids, Daphnia, and Drosophila, preference for a particular wavelength
                           can override the intensity signal, in that a specific wavelength can be chosen over a more intense stimulus, either
                           broadband or of another wavelength7–10. Even more strikingly, different wavelengths can elicit opposite responses:
                           larval zebrafish are attracted to wavelengths above 400 nm, but avoid those below11. The whitefly Trialewodes
                           vaporariorum similarly avoids a chamber illuminated by a 400 nm light, but enters one illuminated with a 550 nm
                           light12. Mixing the different wavelengths results in an intermediate response in these two systems, suggesting that
                           the lights activated competing mechanisms to produce the output behaviour. Polarization information may also
                           influence phototaxis8.
                               The visual system of the honey bee has been extensively studied13,14. Bees have three types of photore-
                           ceptors: the short-wavelength-receptor (S-receptor) peaks in the UV (344 nm); the middle-wavelength-receptor
                           (M-receptor) peaks in the human blue (436 nm) and the long-wavelength-receptor (L-receptor) is maximally
                           sensitive in the human green (544 nm; Fig. 1B)15,16. All three photoreceptors contribute to phototaxis17,18, hence
                           this behaviour can be elicited by wavelengths throughout the full visual spectrum of the honey bee. We postulate
                           that this elaborate visual system can support finely tuned phototactic behaviour. Fine tuning could be predeter-
                           mined, such as wavelength specific behaviours linked to the ecological context in which each wavelength is pre-
                           dominantly encountered. On top of this, individual experience could be integrated to further adapt phototactic
                                                           Konstanzer Online-Publikations-System (KOPS)
                                                  URL: http://nbn-resolving.de/urn:nbn:de:bsz:352-2-1ktpgn23rg7858
                           1
                            Department of Biology, University of Konstanz, Konstanz, Germany. 2Centre for the Advanced Study of Collective
                           Behaviour, University of Konstanz, 78464, Konstanz, Germany. ✉e-mail: morgane.nouvian@uni-konstanz.de

Scientific Reports |   (2020) 10:7872 | https://doi.org/10.1038/s41598-020-64782-y                                                                 1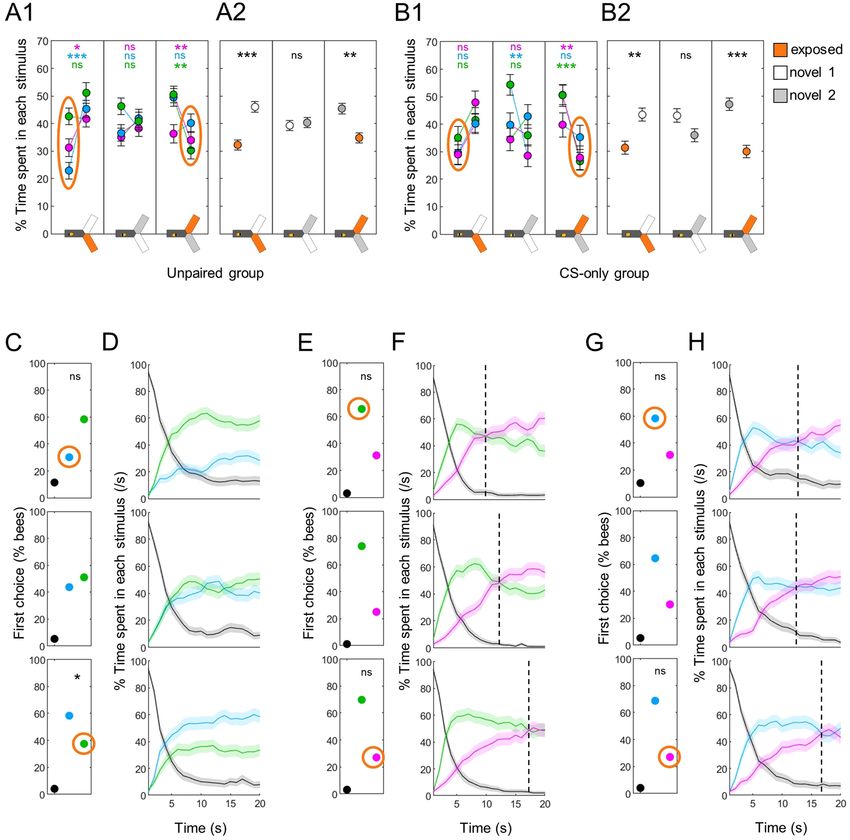
www.nature.com/scientificreports/                                                              www.nature.com/scientificreports

                           Figure 1. Light stimuli. (A) The training and testing apparatus, with the different lights on: green (520 nm)
                           in arm 1, blue (470 nm) in arm 2, UV (375 nm) in arm 3 (the intensities do not match what was used for
                           experiments). (B) Relative sensitivity of photoreceptors (after Neumeyer et al., 1980) and relative emission of
                           the different LEDs used. (C) Relative excitation of the 3 photoreceptors by each type of LED, normalized across
                           stimuli. (D) Relative excitation of the 3 photoreceptors by each type of LED, normalized for each stimulus
                           independently. (E) Lights were calibrated so that bees spent an equal amount of time in any two wavelengths
                           during the tests (n = 18 bees for each wavelength pair, each bee was tested 16 times with the same wavelength
                           pair). Wilcoxon signed rank tests corrected with FDR, ns: p > 0.05.

                           responses to the current environment. Indeed, honey bees are well-known for being able to perform a variety of
                           visual learning tasks: they can recognize patterns, shapes, colours and even concepts19–22.
                               The aim of this study was to determine if these two properties, namely wavelength-specificity and plasticity,
                           could be found in honey bee phototactic behaviour. To tackle this question, we performed a systematic study in
                           an automated y-maze (Fig. 1A) equipped with 3 types of LEDs (UV, blue and green) predominantly activating
                           each of the three photoreceptor types (Fig. 1C,D). Using these three light stimuli validated the first part of our
                           hypothesis: differences between the behavioural responses to each wavelength could be readily measured. In
                           addition, we explored how individual experience reshaped (or not) phototactic behaviour. In this instance, we
                           investigated experience-dependent tuning by looking at the modification of phototaxis after simple exposure
                           or aversive conditioning (happening within several minutes), but also by characterizing shorter-term modifi-
                           cations visible within the tests duration (20 s). We found that honey bees can indeed adapt their phototactic
                           responses depending on their previous experience with a particular wavelength, and that this modulation is again
                           wavelength-specific. Finally, we show that other information such as light intensity is also integrated into an over-
                           all valence for each light. Thus, our results support the notion that complex visual systems allow for phototactic
                           responses that go far beyond a simple reflex behaviour.

                           Results
                           Absolute phototactic behaviour depends on wavelength and past experience.                           In its simplest
                           form, phototaxis consists in making a choice between light and no light – what we called “absolute phototaxis”.
                           Does absolute phototaxis depend on wavelength? And can it be modulated by exposure or aversive training
                           against a specific wavelength? To answer these questions, we trained bees in the yAPIS (Fig. 1A)23 using a classical
                           aversive conditioning design (Fig. 2A): we paired electric shocks with a conditioned stimulus (CS, here a light)
                           for trained bees, while control bees received both shocks and CS but not in close temporal association (unpaired
                           group). We then analyzed their behaviour during tests in which the choice arms were lit with the same stimulus.
                           Depending on the training protocol, this stimulus could thus be: 1) novel (N) to the bees, meaning they had not
                           seen this wavelength before (but they had seen a different wavelength, and received unpaired electric shocks), 2)
                           they were exposed (E) to this particular wavelength and to shocks but not in close temporal association, or 3)
                           they were trained (T) by pairing this wavelength to electric shocks (see Fig. 2A for an overview of the different

Scientific Reports |   (2020) 10:7872 | https://doi.org/10.1038/s41598-020-64782-y                                                            2
www.nature.com/scientificreports/                                                              www.nature.com/scientificreports

                           Figure 2. Experimental design. (A) Main experiment. First, all bees had 1 min to habituate to the apparatus in
                           the dark. In the trained group, a wavelength (green in this example) was then paired with electric shocks (4 ×
                           10 s, spaced by 30 s in the dark). The unpaired controls also experienced both the light and the shocks, but these
                           were delivered in the middle of the 30 s inter-trial interval. After a resting period of 4 min in the dark, all bees
                           were tested 6 times for their wavelength-preference and phototactic behaviour (20 s tests separated by 30 s).
                           During each test, the bee always started in the dark arm and could choose to enter two lit arms, which could
                           be of the same wavelength (absolute tests) or of different wavelengths (differential tests). For subsequent data
                           analysis, we differentiated the behaviour of the bees towards novel wavelengths, towards a wavelength they had
                           seen but was not paired with shocks (exposed) and towards the wavelength they had been trained to. A total of 6
                           groups (trained + unpaired for all 3 wavelengths) of 96 bees each participated in the experiment. B. Experiment
                           with varying light intensities. During the first phase, trained bees received shocks paired with one wavelength
                           as before (green in this example). Naive bees spent the same time inside the apparatus but were not stimulated.
                           All bees then participated in 3 tests, during which only one of the wavelengths varied in intensity. For analysis,
                           the data was pooled such that “Trained dimmer (than novel)” included both “bright trained vs calibrated novel”
                           and “calibrated trained vs dim novel” configurations (and vice-versa for “Trained brighter (than novel)”). Half
                           of the naive bees (randomly selected) were attributed green as “trained” wavelength, the other half blue. Since
                           there were 3 different trainings possible (naive + green trained + blue trained) and 2 wavelengths varying (blue
                           varying + green varying), a total of 6 groups of 48 bees each participated in the experiment.

Scientific Reports |   (2020) 10:7872 | https://doi.org/10.1038/s41598-020-64782-y                                                           3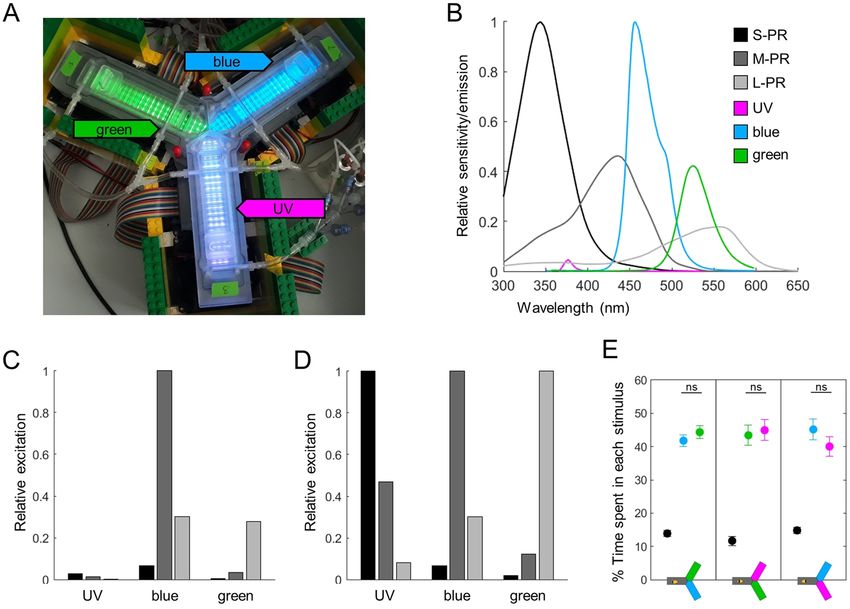
www.nature.com/scientificreports/ www.nature.com/scientificreports
groups). Importantly bees never received shocks during the tests, so they had no incentive to move towards the
lights other than phototactic drive.
We used light intensities calibrated for equal preference between wavelengths (see Fig. 1E and Methods).
Nonetheless, we first checked for wavelength-specificity by focusing on the bees’ behaviour towards novel lights
(Fig. 3A1-D1, statistics in black). To evaluate the bees’ attraction to a light, we measured the percentage of bees
entering (or not) and the delay to enter as proxys for initial attraction, and the percentage of time spent into
a light and of bees exiting the light as proxys for how this attraction persists over time. All lights were clearly
attractive as nearly all bees entered them (Fig. 3A1), but bees spent longer in the UV than in the blue or green
light, and longer in green than in blue (Fig. 3B1; Wilcoxon signed rank tests corrected with FDR, UV vs blue:
z = −7.054, p < 0.001; UV vs green: z = −5.671, p < 0.001, blue vs green: z = −2.394, p = 0.017). This could in
part be explained by a shorter delay in entering UV than blue or green (Fig. 3C1; ANOVA, F(2,573) = 13.99,
p < 0.001, followed by pairwise Tukey’s HSD, UV vs blue: p < 0.001; UV vs green: p < 0.001, blue vs green:
p = 0.282). Furthermore, about a third of the bees (36%) left the blue arms before the end of the test, against less
than 10% for UV and 23% for green (Fig. 3D1; Cochran Q test Q(2,192) = 48.32, p < 0.001, post-hoc χ2 corrected
with FDR, UV vs blue: χ2 (1,192) = 36.855, p < 0.001, UV vs green: χ2 (1,192) = 12.675, p < 0.001, blue vs green:
χ2 (1,192) = 7.186, p = 0.073). A clear overall pattern emerges from this data: when the stimulus is novel, UV has
the strongest phototactic strength whereas blue has the weakest, with green showing intermediate attractiveness.
Did past experience (exposure or training) affect absolute phototaxis? We found that it did, but again in a
wavelength-specific manner (Fig. 3A1-D1, statistics in colour). Attraction to UV was unaffected by past expe-
rience, with no significant change detected in any of the 4 measures. However, training decreased attraction to
blue, as evidenced by some bees completely refusing to enter this light (Fig. 3A1, χ2 corrected with FDR, novel
vs exposed: χ2 (1,288) = 2.363, p = 0.124, novel vs trained: χ2 (1,288) = 15.401, p < 0.001, exposed vs trained: χ2
(1,192) = 3.75, p = 0.079). Training also reduced the percentage of time spent in blue (Fig. 3B1; Wilcoxon signed
rank tests corrected with FDR, novel vs trained: z = 4.385, p < 0.001, exposed vs trained: z = 3.256, p = 0.002,
novel vs exposed: z = 0.313, p = 0.754), and the delay to enter was increased (Fig. 3C1; ANOVA, F(2,381) = 13.13,
p < 0.001, followed by pairwise Tukey’s HSD, novel vs trained: p < 0.001, exposed vs trained: p = 0.004, novel
vs exposed: p = 0.311). The trend for more bees to exit from the blue light after exposure or training was not
statistically significant (Fig. 3D1; χ2 corrected with FDR, novel vs exposed: χ2 (1,288) = 1.243, p = 0.265, novel
vs trained: χ2 (1,288) = 3.829, p = 0.151, exposed vs trained: χ2 (1,192) = 0.525, p = 0.703). Attraction to green
was only marginally affected by training, the only significant change being that more bees made excursions out
of this light (Fig. 3D1; χ2 corrected with FDR, novel vs exposed: χ2 (1,288) = 1.110, p = 0.292, novel vs trained:
χ2 (1,288) = 7.169, p = 0.022, exposed vs trained: χ2 (1,192) = 1.884, p = 0.255). This could have been an inter-
mediate state towards the more pronounced changes observed after training with blue. To test this hypothesis, we
repeated the experiment with 2 additional groups of bees (1 unpaired control + 1 trained), but this time the bees
received 12 training trials instead of 4 (Fig. 3A2-D2). Even with this increased training, there was only a trend (χ2
(1,96) = 2.274, p = 0.132) for more bees to exit the light (Fig. 3D2), the other measurements did not change to a
relevant degree. Thus the differences we observed between wavelengths likely represented intrinsic properties of
aversive conditioning with each particular wavelength.
Differential phototaxis can be temporally complex. Even after aversive training, the vast majority of
bees still entered the lights during absolute tests (except for blue), such that only quantitative differences could be
measured. We reasoned that the phototactic drive may be very strong, and that providing the bees with a second,
alternative wavelength could be a more powerful way to uncover a learned aversion (differential phototaxis).
Since our analysis of absolute tests hinted at wavelength-specific differences in response delay and persistence, we
first looked at the temporal dynamics of differential tests in the cases where the two wavelengths were novel. First,
we confirmed that the chosen stimulus intensities yielded equal preference when averaged over 20 s observation
time, as per our calibration data (Fig. 4A, Wilcoxon signed rank tests, blue vs green: z = −0.748, p = 0.454, green
vs UV: z = 1.310, p = 0.190, blue vs UV: z = 1.171, p = 0.242). For the blue vs green test, the first choice of bees was
random (Fig. 4B, top panel, χ 2 tests against no bias, χ 2(1,96) = 0.27, p = 0.604) and this balance was maintained
during the whole test (Fig. 4C, top panel). However, when UV was involved, the picture was quite different: most
bees first chose blue or green (χ2 tests against no bias, blue vs UV: χ2(1,96) = 6.19, p = 0.013, green vs UV: χ
2
(1,96) = 12.38, p < 0.001). The preference for UV then increased over time, becoming stronger than for the alter-
native wavelength after 10–12 s. Thus, the test averaged preference hid a complex temporal pattern. It is intriguing
that the UV light, which elicited the shortest response delay in absolute phototaxis tests, had slower dynamics in
differential phototaxis tests (despite being presented at the same intensity).
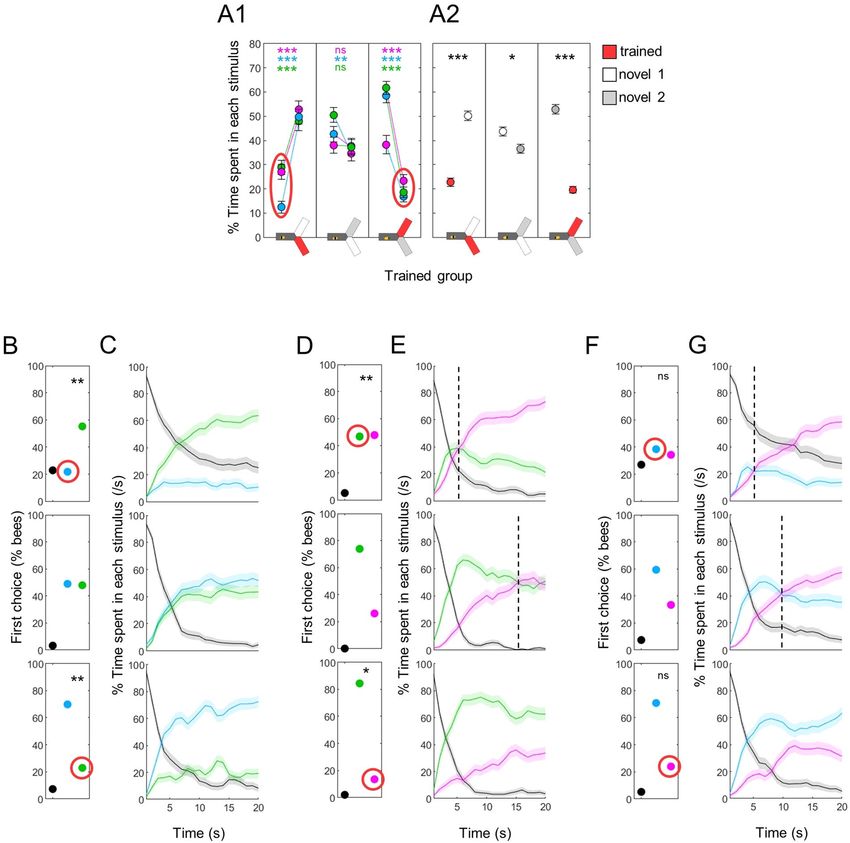
Previously experienced stimuli are less attractive than novel ones. Having characterized the base-
line behaviour of bees during differential tests allowed us to investigate how it was modified by previous experi-
ence with a wavelength. Our first question was: can simple exposure to a light modify phototaxis? To answer this
question, we analyzed the responses of bees that experienced both one wavelength and the shocks, but separated
by a delay of 10 s to prevent association between the two events24. These bees spent less time in the exposed
wavelength than when both were novel, irrespective of the wavelength (Fig. 5A1). This was easier to see when
pooling the data (Fig. 5A2, Wilcoxon signed rank tests corrected with FDR, exposed vs novel 1: z = −3.880,
p < 0.001, exposed vs novel 2: z = 2.960, p = 0.005, novel 1 vs novel 2: z = −0.303, p = 0.762). Could it be that
10 s spacing was not enough to prevent an associative memory? To check this, we repeated the experiment but
removed the shocks completely (CS-only groups, n = 48 bees for each wavelength). Again, bees preferred a novel
wavelength over the one they had been exposed to (Fig. 5B1–2, Wilcoxon signed rank tests corrected with FDR
for pooled data, exposed vs novel 1: z = −2.811, p = 0.007, exposed vs novel 2: z = 3.890, p < 0.001, novel 1 vs
Scientific Reports | (2020) 10:7872 | https://doi.org/10.1038/s41598-020-64782-y 4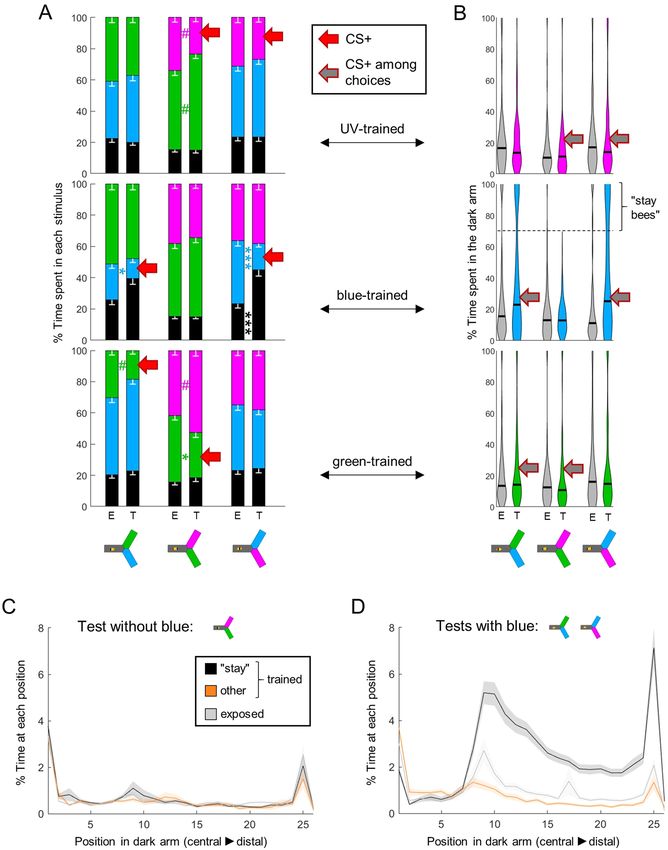
www.nature.com/scientificreports/                                                              www.nature.com/scientificreports

                           Figure 3. Absolute phototaxis depends on wavelength and previous experience. Absolute phototactic
                           behaviour was tested for all 3 wavelengths and for all possible experiences with each wavelength: novel (N),
                           exposed (E) or trained (T) – from unpaired or trained bees, see Fig. 2A. The main experiment is presented on
                           panels A1-D1. It was repeated with more exposure/training trials for green (12 instead of 4): this 2nd dataset is
                           presented in panels A2-D2. (A) Less than 5% of bees did not enter novel lights. The proportion of bees refusing
                           to enter only increased after training with blue. χ2 tests. (B) The percentage of time spent in the lit arms was
                           different for each wavelength. For the blue light only, training decreased the time spent in the lit area. Wilcoxon
                           signed rank tests, corrected with FDR. (C) Delay before entering the lit arms after light onset. Bees entered the
                           UV light faster than blue or green. An increased delay after aversive training was only observed for the blue
                           light. ANOVA followed by pairwise Tukey’s HSD. (D) Percentage of bees that exited the light at some point
                           during the test. The proportion of bees exiting was different for each wavelength. This number increased after
                           training for the green light, and a similar but non-significant trend was observed after training with blue. χ2
                           tests. nN = 192; nE = nT = 96; ntotal = 288, *p < 0.05, **p < 0.01, ***p < 0.001.

Scientific Reports |   (2020) 10:7872 | https://doi.org/10.1038/s41598-020-64782-y                                                           5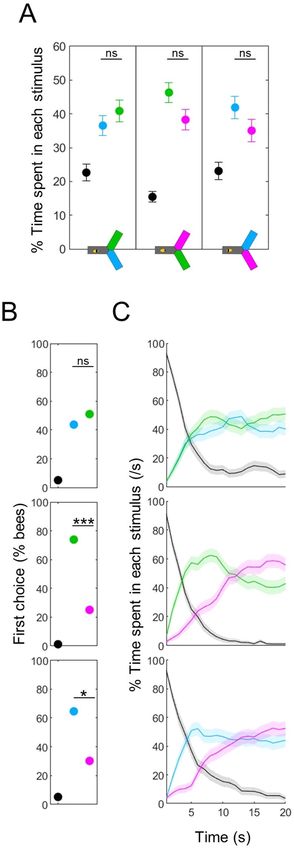
www.nature.com/scientificreports/                                                              www.nature.com/scientificreports

                           Figure 4. Differential phototaxis has a temporal complexity. (A) Percentage of time spent in each stimulus.
                           Control (unpaired) bees presented with a choice between two novel lights spent a similar amount of time in
                           both wavelengths, consistent with the calibration data. Wilcoxon signed rank tests, corrected with FDR. (B)
                           Percentage of bees first entering into each light (black = no choice made). The first choice was biased in the tests
                           including UV, such that bees initially preferred the other wavelength. χ2 tests against random choices between
                           the two wavelengths. (C) Density of bees within each stimulus over time. When the test included UV, bees
                           initially chose the other wavelength but then switched their preference. n = 288, *p < 0.05, ***p < 0.001, ns:
                           p > 0.05.

Scientific Reports |   (2020) 10:7872 | https://doi.org/10.1038/s41598-020-64782-y                                                           6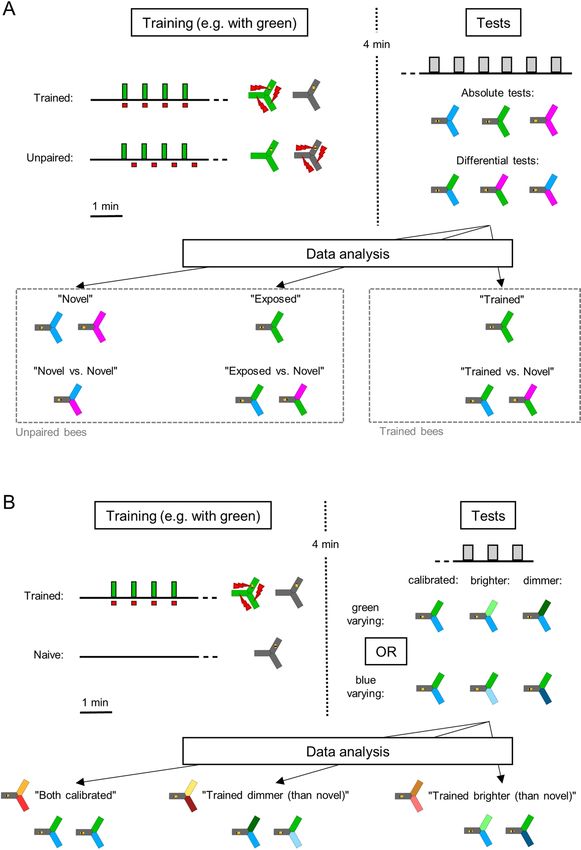
www.nature.com/scientificreports/                                                               www.nature.com/scientificreports

                           Figure 5. Differential phototaxis is modified by previous exposure. (A) Percentage of time spent in each
                           stimulus. A1 presents the data for each individual group (UV-, blue- and green-exposed bees), A2 presents the
                           pooled data. Overall, bees in the unpaired group avoided the wavelength they had seen before. Wilcoxon signed
                           rank tests with FDR correction. (B) Same as in A for the CS-only group, in which the shocks were completely
                           removed. A similar avoidance of the seen wavelength was observed. (C) First choice in blue versus green tests
                           was also modified depending on experience (seen wavelength circled in orange). χ2 tests against bees for which
                           both wavelengths were novel (middle row). (D) Time course of blue vs green tests. The bias in preference was
                           maintained throughout the test. (E,G) First choices for UV versus green/blue were not modified by exposure. χ2
                           tests against bees for which both wavelengths were novel (middle row). (F,H) Time courses of UV vs green/blue
                           tests, respectively. The time at which the switch in preference occurred (dotted lines) was modified by previous
                           exposure to one of the test wavelength. n = 144 for panel B (CS-only groups), n = 288 for all other panels
                           (unpaired groups), *p < 0.05, **p < 0.01, ***p < 0.001, ns: p > 0.05.

                           novel 2: z = 1.580, p = 0.114). Thus, visually experiencing a light was sufficient to reduce the attractiveness of that
                           particular wavelength.
                               This bias in preference was also visible in the test dynamics. For differential phototaxis between blue and
                           green, the previously exposed stimulus was already less preferred as first choice (Fig. 5C, χ2 tests against bees
                           for which these stimuli were both novel, blue seen: χ2(1,192) = 2.64, p = 0.104, green seen: χ2(1,192) = 3.98,
                           p = 0.046, the reference bees are plotted again in the middle row), and this remained throughout the 20 s obser-
                           vation time (Fig. 5D). When UV was involved the qualitative effect was different: the first choice remained biased
                           toward the alternative stimulus, with no statistically significant shift (Fig. 5E,G). However, the time of the shift in

Scientific Reports |   (2020) 10:7872 | https://doi.org/10.1038/s41598-020-64782-y                                                              7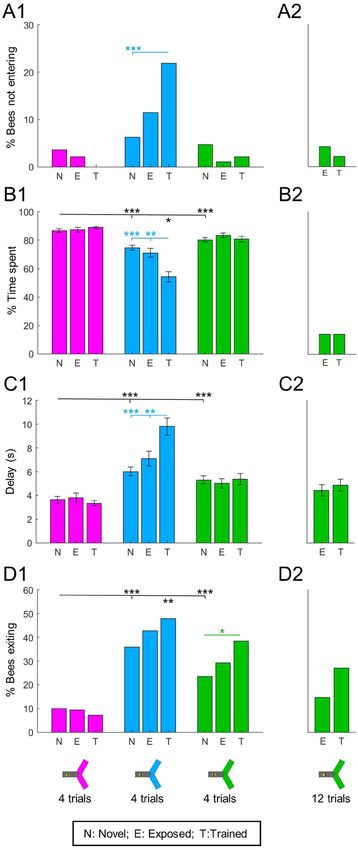
www.nature.com/scientificreports/                                                              www.nature.com/scientificreports

                           Figure 6. Phototaxis is further modified by training. (A) Percentage of time spent in each stimulus. A1 presents
                           the data for each individual group (UV-, blue- and green-trained bees), A2 presents the pooled data. Bees
                           avoided the wavelength that had been paired with shocks. Wilcoxon signed rank tests with FDR correction.
                           (B) First choice in blue versus green tests was modified after training (trained wavelength circled in red). χ2
                           tests against bees trained to UV (middle row). (C) Time course of blue vs green test. The bias in preference
                           was maintained throughout the test. (D) First choice for UV versus green was modified by training. χ2 tests
                           against bees trained to blue (middle row). (E) Time course of UV vs green test. The time at which the switch in
                           preference occurred (dotted lines) was modified when one of the test wavelength had been paired with shocks.
                           (F) First choice for UV versus blue was not significantly modified by training. χ2 tests against bees trained to
                           green (middle row). (G) The time at which the switch in preference occurred (dotted lines) was modified after
                           one of the test wavelength had been paired with shocks. n = 288, *p < 0.05, **p < 0.01, ***p < 0.001.

                           preference between UV and the alternative stimulus was delayed after exposure to UV (from ~12 s to ~17 s), and
                           advanced after exposure to blue or green (to ~10 s; Fig. 5F,H).

                           Classical aversive conditioning further decreases the attractiveness of trained stimuli. While
                           exposure was sufficient to create a mild aversion to a wavelength, we expected the aversive training to trigger a
                           more pronounced avoidance. Indeed, irrespective of the wavelength used, bees spent very little time in a trained
                           stimulus, preferring the novel ones (Fig. 6A1-2; Wilcoxon signed rank tests corrected with FDR for pooled data,
                           trained vs novel1: z = −7.412, p < 0.001, novel1 vs novel2: z = 1.580, p = 0.042, trained vs novel2: z = 9.749,
                           p < 0.001). This aversion for the trained light could be seen from the very beginning of the test in all cases: when

Scientific Reports |   (2020) 10:7872 | https://doi.org/10.1038/s41598-020-64782-y                                                           8
www.nature.com/scientificreports/ www.nature.com/scientificreports
compared to bees for which both wavelengths were novel (i.e. bees trained to the 3rd wavelength), a shift in the
first choice could be measured in blue vs green tests (Fig. 6B, χ2 tests, blue trained: χ2(1,192) = 8.38, p = 0.004,
green trained: χ2(1,192) = 11.90, p < 0.001) and in tests opposing green to UV (Fig. 6D, χ2 tests, green trained:
χ2(1,288) = 11.91, p < 0.001, UV trained: χ2(1,288) = 4.43, p = 0.035). Blue vs UV tests followed a similar but
non-significant trend (Fig. 6F, χ2 tests, blue trained: χ2(1,288) = 2.03, p = 0.154, UV trained: χ2(1,288) = 2.42,
p = 0.120). As was already the case after exposure, this bias in preference was maintained throughout the test in
the blue vs green configuration (Fig. 6C). For tests including UV, the major effect was again in the dynamics: the
shift in preference occurred only ~5 s after the start of the test when the bees were trained against UV (whereas it
took 10–15 s for control bees to reach this tipping point), and was delayed beyond the 20 s of the test after training
against blue or green (Fig. 6E,G). Direct comparisons between the trained and unpaired groups confirmed that
classical aversive conditioning further reduced the time spent in the trained wavelength during differential tests
(Fig. 7A, Suppl. Table 1).
The avoidance strategy depends on the trained wavelength. In differential tests, bees had 2 pos-
sibilities to avoid the trained wavelength: they could choose the arm with the alternative wavelength, or they
could remain in the dark arm (where they always started). Which of these options did they use? We compared
the behaviour of trained bees to the behaviour of exposed (unpaired) bees to answer this question, and found
that once more, their strategy was dependent on the wavelength. Training against UV or green only shifted the
preference of the bees to the alternative wavelength available, whereas training against blue did not affect the time
spent in the alternative wavelength (Fig. 7A, Suppl. Table 1; note that the small effect sizes are due to exposed
bees already exhibiting some aversion towards the light as was shown in Fig. 5). Instead, training against blue
increased the time spent in the dark (Fig. 7A, Suppl. Table 1, also visible in the upper panels of Fig. 6C–G). We
confirmed this observation by looking more closely at the time spent by individual bees inside the dark arm
(Fig. 7B). Strikingly, some of the bees trained to associate blue with electric shocks spent most of their time in the
dark, specifically in tests in which blue was presented. This specificity is important, because it means that positive
phototaxis was not generally decreased in those bees.
To better understand this behaviour, we separated bees that stayed in the dark arm over 70% of their time dur-
ing at least one test (any test), termed “stay bees” (n = 53), from the remainder bees (n = 43). In tests without blue,
these two subgroups behaved similarly inside the dark arm (Fig. 7C). When the blue light was present, “stay bees”
not only remained in the dark arm, they remained in the far end of that arm. A clear threshold was visible around
position 9, which corresponds to a distance of ~ 5 cm from the decision point (Fig. 7D). At this distance, the blue
light had a viewing angle of ~12.5° horizontally and ~15.9° vertically. It is interesting that this is within the range
of the viewing angle necessary for bees to evaluate chromaticity (~15°)14. However, we have to exert caution as this
also corresponds to the position of a slit through which air is extracted from the yAPIS, and we noted earlier that
bees tend to turn at this position even in the absence of any light stimulus23.
The trained aversion is superimposed on intensity-driven preferences. In all the results pre-
sented so far, light intensities were calibrated to ensure equal preference between any 2 wavelengths in naïve
bees (Fig. 1E). In this final experiment, we investigated how deviations from these settings would affect the bees’
performance. Would the intensity difference completely override learning, such that bees would always go to
the brightest light? Or, in other words, is there a hierarchy in how bees integrate information about a light? We
addressed this question by training bees with either blue or green, and then by varying the intensity of one stim-
ulus during the tests (either the trained one or the novel one; see Fig. 2B for protocol). Hence we had 4 groups of
trained bees: “blue trained & blue varied”, “blue trained & green varied”, “green trained & green varied” and “green
trained & blue varied”. We only used blue and green lights in this experiment because the bees’ behaviour was eas-
ier to interpret in these differential tests. We also included 2 groups of control (naïve) bees which did not receive
any stimulation during the training phase (to avoid the exposure effect demonstrated previously): “blue varied”
and “green varied”. Each of these control groups was randomly split in 2 to replicate the 4 groups of trained bees
(i.e. green was considered the trained wavelength for half of the bees, and blue for the other half). The aim of this
slightly complicated design was twofold: 1) cancelling wavelength-specific effects by having symetrical roles for
blue and green; and 2) checking if the bees’ behaviour was dictated by the difference in intensities independently
of the role of the varied stimulus (trained or novel). The behavioural pattern that we describe in detail below was
the same in all groups (Suppl. Fig. 2): neither which wavelength was trained nor which stimulus was varied in
the test changed the results. Therefore, we pooled the data, with the tests classified into 3 categories: “both lights
calibrated”, “trained dimmer (than novel)” and “trained brighter (than novel)”.
As expected, deviations from the calibrated settings induced biases in preference in naïve bees, such that they
always chose the brightest of the two wavelengths (Fig. 8A1–2; Wilcoxon signed rank tests corrected with FDR
for pooled data, trained dimmer: z = −2.551, p < 0.001, both calibrated: z = 1.909, p = 0.056, trained brighter:
z = 2.264, p < 0.001). This preference for the brightest light was also obvious in the bees’ first choices (Fig. 8D;
χ2 tests against calibrated lights, trained dimmer: χ2(1,96) = 16.49, p < 0.001, trained brighter: χ2(1,96) = 6.39,
p = 0.011), and was maintained throughout the tests (Fig. 8E). Trained bees, on the other hand, only showed a
preference for the brightest light when it was novel (Fig. 8B; Wilcoxon signed rank tests corrected with FDR,
trained dimmer: z = −8.868, p < 0.001, both calibrated: z = −7.120, p < 0.001, trained brighter: z = 0, p = 1).
Direct comparisons confirmed that trained bees spent less time than naïve bees in the wavelength associated
with shocks in all tests, independently of relative intensities (Fig. 8C; Suppl. Table 1). Thus, the intensity bias
did not override the learned aversion. But the aversive training by itself also did not fully account for the bees’
behaviour: the shifts in intensity modulated both the time spent in each light (Fig. 8B) and first choice (Fig. 8F; χ2
tests against calibrated lights, trained dimmer: χ2(1,192) = 4.34, p = 0.037, trained brighter: χ2(1,192) = 26.68,
p < 0.001). In particular, when the trained wavelength was brighter, trained bees still had a slight preference for
Scientific Reports | (2020) 10:7872 | https://doi.org/10.1038/s41598-020-64782-y 9www.nature.com/scientificreports/ www.nature.com/scientificreports
Figure 7. Learning strategy depends on the trained wavelength. (A) During training, shocks were paired with
one wavelength (CS+, red arrow) in trained animals (T), while exposed bees (E) received unpaired shocks. For
each group of bees, the percentages of time spent in the environments available during a given test (e.g. dark,
blue and green) were plotted and stacked into a single bar. Since we included all environments, the resulting
stack always totalize 100% (the whole test duration). Data is represented as mean – s.e.m.; Mann-Whitney U
tests comparing E to T, corrected with FDR. (B) Distribution of the percentage of time spent in the dark arm.
After training with blue, many bees remained in the dark arm rather than making a choice if blue was present.
We categorized those bees that stayed in the dark >70% of the time during at least one test as “stay bees”. (C)
Spatial density of bees within the dark arm, during the test without blue (nstay = 53; nother = 43; nexposed = 96). (D)
Same as C during tests including blue. A clear threshold is visible around position 9 that “stay bees” do not cross.
n = 576, *p < 0.05, **p < 0.01, ***p < 0.001, # 0.05 > p > corrected threshold.
it at the beginning of the test before switching to the novel (but dimmer) light (Fig. 8G). Taken together, these
results demonstrate that bees clearly integrated both intensity and experience into an overall valence when com-
paring the two stimuli.
Scientific Reports | (2020) 10:7872 | https://doi.org/10.1038/s41598-020-64782-y 10www.nature.com/scientificreports/ www.nature.com/scientificreports
Figure 8. The trained aversion is superimposed on the innate preference. During training, shocks were paired
with one wavelength for trained animals (T), while naïve bees (N) were not stimulated. Lighter colors indicate
lights brighter than the calibrated reference, darker colors indicate lights dimmer that the calibrated reference.
(A) Percentage of time spent in each stimulus, for naïve bees. A1 presents the data for each pair of trained-
varied wavelength (blue-green stats are in blue, blue-blue in dark blue, green-blue in green and green-green
in dark green), A2 presents the pooled data. Wilcoxon signed rank tests with FDR correction. (B) Same as in
A but for trained bees. (C) Percentages of time spent in the environments available during a given test (dark,
trained and novel) plotted and stacked into a single bar. Trained bees spent less time than naive bees in the light
previously associated with shocks, independently of its relative brightness. Mean – s.e.m, Mann-Whitney U tests
comparing N to T, corrected with FDR. (D) The first choice of naive bees was always biased toward the brightest
light (circled in grey). χ2 tests against calibrated intensities (top row), or against a random choice for this
reference test. (E) Time courses for naïve bees. The preference was maintained throughout the test. (F) The first
Scientific Reports | (2020) 10:7872 | https://doi.org/10.1038/s41598-020-64782-y 11www.nature.com/scientificreports/ www.nature.com/scientificreports
choice of trained bees was modulated by both training and brightness. χ2 tests against calibrated intensities (top
row), or against a random choice for this reference test. (G) Time courses for trained bees. The first choice was
corrected during the test if it contradicted the training paradigm. n = 576, *p < 0.05, **p < 0.01, ***p < 0.001,
ns: p > 0.05.
Discussion
In this study, we explored how previous experience through exposure and aversive training shaped honey bees’
response to light, while controlling the possible confounding effects of light properties (wavelength and relative
intensity). Our data suggest that phototaxis is a highly dynamical response and sensitive to all the factors listed
above, which are integrated into an overall valence for a specific light. Exposure had similar effects to a mild aver-
sive training, which is maybe best understood by considering that the bees likely go towards the lights because
they want to escape the apparatus. Since the light they have seen before has already proven disappointing (they
found no escape), the new light may appear more promising by comparison. Alternatively, they may have a gen-
eral bias towards new stimuli, as has been reported before25.
In our system, naïve bees moved towards any of the 3 wavelengths in absolute tests. However, their reac-
tion time and their persistence depended on the wavelength considered, which was the first indication of
wavelength-specificity. This was confirmed when evaluating the behavioural plasticity of this circuit: both reac-
tion time and persistence were independently and selectively modified after training against some wavelengths
but not others. Absolute phototaxis towards UV seemed to be immune to aversive training, while the same behav-
iour towards blue was especially labile. Similar selective plasticity in the blue range was obtained by other studies
using a comparable approach26,27. This could be linked to the relative efficiency of each wavelength in eliciting
positive phototaxis, which was evident in our calibration data (Fig. 1B; the absolute photon counts required to
elicit equal preference scaled 1:63:29 for UV:blue:green) and had been established before18,28. In addition, this is
not the first time that wavelength-specific learning effects have been observed in honey bees. For example, learn-
ing speed (how many trials are necessary) is fastest around 420 nm and slowest around 494 nm during appetitive
conditioning29.
Importantly, wavelength-specificity does not imply true colour vision9, and it remains unclear whether our
training paradigm relied on true colour vision or on photoreceptor-specific channels. Neurons dowstream of
photoreceptors can be classified into three groups based on their chromatic sensitivity30–32. Broad-band neurons
respond indifferently to all wavelengths, whereas narrow-band neurons only respond to a limited range of wave-
lengths. Finally, colour-opponent neurons are excited by some wavelengths but inhibited by others33,34, thus creat-
ing an intensity invariant read-out of the light spectrum supporting true colour vision9. Individual photoreceptors
hence contribute to multiple streams of information30,35–38. A wavelength-specific behaviour may be mediated
by a specialized circuit with a dedicated photoreceptor that does not contribute at all to true colour vision39. As
a consequence, at least two hypothetical circuits could explain our current results, and further experiments will
be needed to choose between them. In the simpler scenario, plastic synapses would be located directly between
photoreceptor cells and the putative pooling neurons mediating phototaxis17. In this view, the valence of a given
light would be directly related to the activity of the pooling neurons, and independent of true colour vision. In
appetitive contexts, however, visual learning does rely on colour-opponent neurons40,41. In addition, several stud-
ies suggest that different properties of a visual stimulus are processed independently in the insect brain: colour,
motion and timing of a stimulus are segregated in the lobula of a bumble bee36,37, and colour and brightness infor-
mation rely on distinct populations of neurons in the fruit fly42,43. This suggests an alternative scenario, in which
these multiple pathways would converge into a common integrator in order to attribute an overall valence to the
stimulus. Although slightly more complex, such circuitry has been reported before42,44. If true, this integration
is likely to happen centrally, in regions such as the anterior optic tubercles, the mushroom bodies or the central
complex, which have been implicated in colour learning in a variety of insects45–47. In any case, it is interesting
to note that our bees never generalized the training paradigm by avoiding all lights, suggesting that phototactic
learning is intrisically wavelength-specific.
The temporal complexity that we observed may be explained by assuming at least 3 steps in the
decision-making process: an approach phase, a first choice and a continuous re-assessment of the decision. A
puzzling element of our results is that, even though direct aversive training of the green or UV lights could not
abolish absolute phototaxis towards these lights, the adjunction of the trained blue light in another arm could.
Postulating the existence of an all-or-nothing initial step, whereby bees decide whether to approach the lights or
not, would resolve this paradigm. After the bees approached the lights, in differential tests they then had to choose
which light stimulus to enter. We found that this first choice depended on the wavelengths and relative intensities
of the two lights, and could be modified by training. Finally, we observed shifts in preference during the 20 s of the
tests. In particular, naïve bees initially chose blue or green against UV, but by the end of the test this preference
was reversed. Failure to find an exit within the first stimulus, or physiological adaptation to the light, might have
slowly decreased the attractiveness of this stimulus until it eventually became less attractive than the alternative,
originally unfavoured option. In natural settings, this constant re-evaluation is likely important to allow bees
to search multiple options in a hierarchical order, instead of getting stuck in a dead-end. Consistent with this
hypothesis, we observed that previous experience decreasing the initial valence of a light could shift the time at
which the equilibrium between the two lights was reached (Figs 5F–H and 6E–G).
The dynamics of blue/green vs UV tests may thus be explained by a combination of 3 factors: the strong and
resilient phototactic drive elicited by UV, the slow devaluation of explored stimuli and our calibration protocol
(which took equal time spent as criterion). It is likely that our settings created an initial imbalance, i.e. that UV
was dimmer from the bees’ perspective, which was required for bees to visit the alternative wavelength for some
time. From our results, we expect that calibrating the first choice instead would result in a longer time spent in
Scientific Reports | (2020) 10:7872 | https://doi.org/10.1038/s41598-020-64782-y 12www.nature.com/scientificreports/ www.nature.com/scientificreports
the UV, since its decay in valence is slower than for blue or green. Another possibility would be that UV is inte-
grated differently from the other wavelengths and that this impacts how it is compared. Recent data supports this
hypothesis: UV induces configural processing of olfactory-visual compounds (i.e. the compound is different from
the sum of its components), whereas blue and green produced elemental compounds48. A different comparison
mechanism could explain that exposure to blue/green did not impact the bees’ behaviour during blue/green vs
UV tests, but did so during blue vs green tests (Fig. 5E–H).
Overall, our results demonstrate that animals with a complex visual system, like the honey bee, can exhibit
refined phototaxis behaviour. In particular, they can adapt this behaviour based on individual experience. These
results also open new questions that should be addressed in future studies. We are especially curious about the
ecological relevance of such modulation, as well as the mechanisms supporting it.
Methods
Honey bees. Bees were taken from colonies housed on the roof of the University of Konstanz, Germany.
The bees participating in the experiments were caught as they left the colony, and were thus most likely foragers.
They were introduced inside the behavioural training and testing chamber yAPIS immediately after being caught.
To check calibrated intensities, 3 groups (one for each wavelength pair) of 18 bees were tested (total n = 54).
Conditioning experiments were done with 6 treatment groups in parallel (3 paired and 3 unpaired) of 96 bees
each, total n = 576. The 3 CS-only groups contained 48 bees each (total n = 144). The experiment in which green
was trained with 12 pairing trials included 2 groups (paired + unpaired) of 48 bees each (total n = 96). Finally, the
experiment in which light intensities were varied included 6 groups ((2 symmetrical pairing and 1 naïve control)
× 2 wavelengths varying in intensity) of 48 bees each (total n = 288).
Training and testing apparatus: yAPIS. Honey bees were trained in an automated y-maze consisting
in 3 arms of equal length (14 cm) at 120° from each other: yAPIS (Fig. 1A). This apparatus has been described
in detail before23. Briefly, the bee was tracked in real time within the y-maze so that lights placed underneath
the transparent floor could be switched on relative to its position. We used three types of LEDs, spanning differ-
ent wavelengths: human green (λ = 520 nm), human blue (λ = 465 nm) and ultraviolet (λ = 375 nm; Fig. 1A,B),
that we refer to as green, blue and UV for simplicity. Bee photoreceptors differ in quantum efficiency, with
S-photoreceptors being most sensitive, and L-photoreceptor least (Fig. 1B)49. We calibrated light intensities
behaviourally, so that bees had an equal preference in a two-choice test (Fig. 1E, Wilcoxon signed rank tests,
blue vs green: z = −1.154, p = 0.248, green vs UV: z = −0.327, p = 0.744, blue vs UV: z = 0.544, p = 0.586). This
corresponded to intensity settings of 64%, 44% and 2,4% of the maximum intensity, corresponding to a total
photon counts of 898.1012, 1964.1012 and 31.1012 quanta/cm2/s, for green, blue and UV respectively. The relative
excitation of each photoreceptor was calculated by multiplying each stimulus spectrum by the response function
of the photoreceptor and integrating the area under the resulting curve. It should be noted that these calculations
relate to single photoreceptor cells. The total sensitivity of the eye is also influenced by other factors, such as the
relative density of photoreceptor cells. It also does not account for further processing inside the optic lobe. These
calibrated intensity settings were kept for all experiments except the one in which light intensities were varied for
green or blue. In this case, we also used dimmer lights: 32% for green, 12% for blue; and brighter lights: 96% for
green, 76% for blue.
Training procedures. During training, one light was turned on throughout the apparatus, so that the bee
was passively exposed, and the shocks were delivered according to group treatment. This was a classical Pavlovian
conditioning paradigm. Overall, 4 different protocols were used for training (Fig. 2). (1) In trained animals the
light was switched on in all three arms for 10 s, and the US (electric shocks) was delivered simultaneously. The
US consisted of a train of mild electric shocks (2 Hz, 10 V, 200 ms, 20 shocks in total) delivered by the electric grid
placed on the floor and ceiling of each arm. Four training trials with an inter-trial interval of 30 s were delivered,
unless stated otherwise. (2) For unpaired animals, light was switched on in all three arms for 10 s, and electric
shocks were delivered for 10 s in the middle of the 30 s intertrial interval. (3) In CS-only bees the shocks were
completely removed, leaving only the lights. (4) Naïve animals spent the same amount of time in the apparatus
but did not receive any treatment during the training phase (i.e. they stayed in the dark until the tests).
After training, animals were left in the dark yAPIS for 4 minutes, which is sufficient to reach dark adaptation
in photoreceptors17,50. At the start of the tests the position of the bee was evaluated and lights were presented in
the other two arms of the apparatus, such that the bee always started in the dark arm. Tests (20 s) were separated
by 30 s intervals, and test order was balanced across bees. In the first conditioning experiment, all bees were tested
both for differential and for absolute phototaxis (6 tests, Fig. 2A). In the experiments in which light intensity
was varied for a wavelength (Fig. 2B), bees were tested first with 3 differential tests: “wavelength 1 calibrated vs.
wavelength 2 calibrated”, “wavelength 1 calibrated vs. wavelength 2 dimmer” and “wavelength 1 calibrated vs.
wavelength 2 brighter”. To check that bees were still positively phototactic towards the new stimuli used, they were
then also tested with 2 absolute tests, one with “wavelength 2 dimmer” and the other with “wavelength 2 brighter”
(data shown in Suppl. Fig. 1).
Data analysis. To analyse the overall results of the first conditioning experiment, we differentiated the behav-
iour of the bees towards novel wavelengths, towards a wavelength they had seen but not paired with shocks
(exposed) and towards a wavelength they had been trained to (Fig. 2A). Only control bees (from the unpaired
groups) were included for the analysis of behaviour towards novel and exposed wavelengths. In the experiment
in which light intensity was varied (Fig. 2B), the tests were pooled within 3 categories: “trained calibrated vs novel
calibrated”, “trained dimmer than novel” and “trained brighter than novel”. This was done after showing that the
Scientific Reports | (2020) 10:7872 | https://doi.org/10.1038/s41598-020-64782-y 13www.nature.com/scientificreports/ www.nature.com/scientificreports
behaviour was consistent across both trained wavelengths and irrespective of whether the wavelength varying in
intensity was the trained one or the novel one (Suppl. Fig. 1).
The yAPIS system collected the following data onto a log file: time series of the position of the bee along
the arm, the arm the bee was in, each electric shock, the current flow during the shock and the lights on/off
events with stimulus intensity. The data was analysed using custom scripts written in Python 3.7 and Matlab
R2018b. Bees that moved slower than 6 mm/s on average during the test phase were excluded, and new bees were
measured instead. Direct comparisons of the two lights in choice tests were performed using Wilcoxon signed
rank tests. Mann-Whitney U tests were performed to evaluate the change in distributions between a control
group and the trained group. To compare the proportions of bees choosing first one wavelength or the other
(first choice evaluation), Chi-square tests were performed either against the control group or against chance
level. Analysis of the delay before entering a wavelength used a one-way ANOVA followed by a post-hoc Tukey’s
Honest Significant Difference (HSD) test. When appropriate, p values were corrected for multiple comparisons
using a False Discovery Rate (FDR) procedure, which controls for both type I and type II errors51.
Received: 6 November 2019; Accepted: 21 April 2020;
Published: xx xx xxxx
References
1. Meng, Q. W. et al. Hormonal signaling cascades required for phototaxis switch in wandering Leptinotarsa decemlineata larvae. PLoS
Genet. 15, e1007423, https://doi.org/10.1371/journal.pgen.1007423 (2019).
2. Yamanaka, N. et al. Neuroendocrine control of Drosophila larval light preference. Science 341, 1113–1116, https://doi.org/10.1126/
science.1241210 (2013).
3. Ben-Shahar, Y. cGMP-dependent changes in phototaxis: a possible role for the foraging gene in honey bee division of labor. J. Exp.
Biol. 206, 2507–2515, https://doi.org/10.1242/jeb.00442 (2003).
4. Mazzoni, E. O., Desplan, C. & Blau, J. Circadian pacemaker neurons transmit and modulate visual information to control a rapid
behavioral response. Neuron 45, 293–300, https://doi.org/10.1016/j.neuron.2004.12.038 (2005).
5. Gorostiza, E. A., Colomb, J. & Brembs, B. A decision underlies phototaxis in an insect. Open Biol. 6, 160229, https://doi.org/10.1098/
rsob.160229 (2016).
6. Randel, N. & Jekely, G. Phototaxis and the origin of visual eyes. Philos. Trans. R. Soc. Lond., Ser. B: Biol. Sci. 371, 20150042, https://
doi.org/10.1098/rstb.2015.0042 (2016).
7. Kelber, A., Vorobyev, M. & Osorio, D. Animal colour vision – behavioural tests and physiological concepts. Biol. Rev. Camb. Philos.
Soc. 78, 81–118, https://doi.org/10.1017/s1464793102005985 (2003).
8. Paris, T. M., Allan, S. A., Udell, B. J. & Stansly, P. A. Wavelength and polarization affect phototaxis of the Asian Citrus Psyllid. Insects
8, 88, https://doi.org/10.3390/insects8030088 (2017).
9. Kelber, A. & Osorio, D. From spectral information to animal colour vision: experiments and concepts. Proc. R. Soc. Lond., Ser. B:
Biol. Sci. 277, 1617–1625, https://doi.org/10.1098/rspb.2009.2118 (2010).
10. Fischbach, K. F. Simultaneous and successive colour contrast expressed in “slow” phototactic behaviour of walking Drosophila
melanogaster. J. Comp. Physiol., A 130, 161–171, https://doi.org/10.1007/bf00611050 (1979).
11. Guggiana-Nilo, D. A. & Engert, F. Properties of the visible light phototaxis and UV avoidance behaviors in the larval zebrafish. Front.
Behav. Neurosci. 10, 160, https://doi.org/10.3389/fnbeh.2016.00160 (2016).
12. Coombe, P. E. Wavelength specific behaviour of the whitefly Trialewodes vaporariorum (Homoptera: Aleyrodidae). J. Comp. Physiol.,
A 144, 83–90, https://doi.org/10.1007/bf00612801 (1981).
13. Avarguès-Weber, A., Mota, T. & Giurfa, M. New vistas on honey bee vision. Apidologie 43, 244–268, https://doi.org/10.1007/s13592-
012-0124-2 (2012).
14. Hempel de Ibarra, N., Vorobyev, M. & Menzel, R. Mechanisms, functions and ecology of colour vision in the honeybee. J. Comp.
Physiol., A 200, 411–433, https://doi.org/10.1007/s00359-014-0915-1 (2014).
15. Peitsch, D. et al. The spectral input systems of hymenopteran insects and their receptor-based colour vision. J. Comp. Physiol., A 170,
23–40, https://doi.org/10.1007/bf00190398 (1992).
16. Menzel, R. & Backhaus, W. In Vision and Visual Dysfunction. The Perception of Colour. (ed P. Gouras) 262–288 (MacMillan Press,
1991).
17. Menzel, R. & Greggers, U. Natural phototaxis and its relationship to colour vision in honeybees. J. Comp. Physiol., A 157, 310–321
(1985).
18. Kaiser, W., Seidl, R. & Vollmar, J. The participation of all three colour receptors in the phototactic behaviour of fixed walking
honeybees. J. Comp. Physiol., A 122, 27–44 (1977).
19. Srinivasan, M. V. Honey bees as a model for vision, perception, and cognition. Annu. Rev. Entomol. 55, 267–284, https://doi.
org/10.1146/annurev.ento.010908.164537 (2010).
20. Giurfa, M. et al. Pattern learning by honeybees: conditioning procedure and recognition strategy. Anim. Behav. 57, 315–324 (1999).
21. Giurfa, M., Shaowu, Z., Jenett, A., Menzel, R. & Srinivasan, M. V. The concepts of “sameness” and “difference” in an insect. Nature
410, 930–933 (2001).
22. Schubert, M., Lachnit, H., Francucci, S. & Giurfa, M. Nonelemental visual learning in honeybees. Anim. Behav. 64, 175–184, https://
doi.org/10.1006/anbe.2002.3055 (2002).
23. Nouvian, M. & Galizia, C. G. Aversive training of honey bees in an automated Y-maze. Frontiers in Physiology 10(10), 678, https://
doi.org/10.3389/fphys.2019.00678 (2019).
24. Menzel, R. & Bitterman, M. E. In Neuroethology and Behavioral Physiology Ch. 15, 206–215 (1983).
25. Van De Poll, M. N., Zajaczkowski, E. L., Taylor, G. J., Srinivasan, M. V. & van Swinderen, B. Using an abstract geometry in virtual
reality to explore choice behaviour: visual flicker preferences in honeybees. J. Exp. Biol. 218, 3448–3460, https://doi.org/10.1242/
jeb.125138 (2015).
26. Kirkerud, N. H., Schlegel, U. & Giovanni Galizia, C. Aversive learning of colored lights in walking honeybees. Front. Behav. Neurosci.
11, 94, https://doi.org/10.3389/fnbeh.2017.00094 (2017).
27. Marchal, P. et al. Inhibitory learning of phototaxis by honeybees in a passive-avoidance task. Learn. Memory 26, 412–423, https://
doi.org/10.1101/lm.050120.119 (2019).
28. Hertel, H. The effect of spectral light deprivation on the spectral sensitivity of the honey bee. J. Comp. Physiol., A 147, 365–369
(1982).
29. Menzel, R. Investigations into the honey bee’s learning of spectral colours. Z. Vgl. Physiol. 56, 22–62 (1967).
30. Dyer, A. G., Paulk, A. C. & Reser, D. H. Colour processing in complex environments: insights from the visual system of bees. Proc.
R. Soc. Lond., Ser. B: Biol. Sci. 278, 952–959, https://doi.org/10.1098/rspb.2010.2412 (2011).
Scientific Reports | (2020) 10:7872 | https://doi.org/10.1038/s41598-020-64782-y 14www.nature.com/scientificreports/ www.nature.com/scientificreports
31. Kien, J. & Menzel, R. Chromatic properties of interneurons in the optic lobes of the bee. I. Broad band neurons. J. Comp. Physiol., A
113, 17–34, https://doi.org/10.1007/bf00610451 (1977).
32. Kien, J. & Menzel, R. Chromatic properties of interneurons in the optic lobes of the bee. II. Narrow band and colour opponent
neurons. J. Comp. Physiol., A 113, 35–53, https://doi.org/10.1007/bf00610452 (1977).
33. Vasas, V., Peng, F., MaBouDi, H. & Chittka, L. Randomly weighted receptor inputs can explain the large diversity of colour-coding
neurons in the bee visual system. Sci. Rep. 9, 8330, https://doi.org/10.1038/s41598-019-44375-0 (2019).
34. Yang, E. C., Lin, H. C. & Hung, Y. S. Patterns of chromatic information processing in the lobula of the honeybee, Apis mellifera L. J.
Insect Physiol. 50, 913–925, https://doi.org/10.1016/j.jinsphys.2004.06.010 (2004).
35. Paulk, A. C., Dacks, A. M. & Gronenberg, W. Color processing in the medulla of the bumblebee (Apidae: Bombus impatiens). J.
Comp. Neurol. 513, 441–456, https://doi.org/10.1002/cne.21993 (2009).
36. Paulk, A. C., Dacks, A. M., Phillips-Portillo, J., Fellous, J. M. & Gronenberg, W. Visual processing in the central bee brain. J. Neurosci.
29, 9987–9999, https://doi.org/10.1523/JNEUROSCI.1325-09.2009 (2009).
37. Paulk, A. C., Phillips-Portillo, J., Dacks, A. M., Fellous, J. M. & Gronenberg, W. The processing of color, motion, and stimulus timing are
anatomically segregated in the bumblebee brain. J. Neurosci. 28, 6319–6332, https://doi.org/10.1523/JNEUROSCI.1196-08.2008 (2008).
38. Hertel, H. Chromatic properties of identified interneurons in the optic lobes of the bee. J. Comp. Physiol., A 137, 215–231 (1980).
39. Marshall, J. & Arikawa, K. Unconventional colour vision. Curr. Biol. 24, R1150–1154, https://doi.org/10.1016/j.cub.2014.10.025 (2014).
40. Ng, L., Garcia, J. E., Dyer, A. G. & Kevan, P. G. Why colour is complex: Evidence that bees perceive neither brightness nor green
contrast in colour signal processing. Facets 3, 800–817, https://doi.org/10.1139/facets-2017-0116 (2018).
41. Reser, D. H., Wijesekara Witharanage, R., Rosa, M. G. & Dyer, A. G. Honeybees (Apis mellifera) learn color discriminations via
differential conditioning independent of long wavelength (green) photoreceptor modulation. PLoS ONE 7, e48577, https://doi.
org/10.1371/journal.pone.0048577 (2012).
42. Vogt, K. et al. Direct neural pathways convey distinct visual information to Drosophila mushroom bodies. eLife 5, e14009, https://
doi.org/10.7554/eLife.14009 (2016).
43. Gao, S. et al. The neural substrate of spectral preference in. Drosophila. Neuron 60, 328–342, https://doi.org/10.1016/j.
neuron.2008.08.010 (2008).
44. Gepner, R., Mihovilovic Skanata, M., Bernat, N. M., Kaplow, M. & Gershow, M. Computations underlying Drosophila photo-taxis,
odor-taxis, and multi-sensory integration. eLife 4, e06229, https://doi.org/10.7554/eLife.06229 (2015).
45. Yilmaz, A., Grubel, K., Spaethe, J. & Rossler, W. Distributed plasticity in ant visual pathways following colour learning. Proc. R. Soc.
Lond., Ser. B: Biol. Sci. 286, 20182813, https://doi.org/10.1098/rspb.2018.2813 (2019).
46. Plath, J. A. et al. Different roles for honey bee mushroom bodies and central complex in visual learning of colored lights in an
aversive conditioning assay. Front. Behav. Neurosci. 11, 98, https://doi.org/10.3389/fnbeh.2017.00098 (2017).
47. Vogt, K. et al. Shared mushroom body circuits underlie visual and olfactory memories in. Drosophila. eLife 3, e02395, https://doi.
org/10.7554/eLife.02395 (2014).
48. Becker, M. C., Rossler, W. & Strube-Bloss, M. F. UV light perception is modulated by the odour element of an olfactory-visual
compound in restrained honeybees. J. Exp. Biol. 222, jeb201483, https://doi.org/10.1242/jeb.201483 (2019).
49. Neumeyer, C. Simultaneous color contrast in the Honeybee. J. Comp. Physiol., A 139, 165–176 (1980).
50. Kindermann, U. & Hertel, H. The time course of dark adaptation in the bee: a phototactic and electrophysiological investigation.
Physiol. Entomol. 11, 23–28 (1986).
51. Verhoeven, K. J. F., Simonsen, K. L. & McIntyre, L. M. Implementing false discovery rate control: increasing your power. Oikos 108,
643–647 (2005).
Acknowledgements
Gabriel Michau wrote the Python scripts necessary for data analysis, and we thank him for this. We thank
the electronic and mechanical workshop of the University of Konstanz for excellent support with building
and maintaining the yAPIS, and Hubert Fink for the software controlling it. M.N. was supported by a post-
doctoral fellowship from the Fyssen Foundation during the course of this work, and by the Zukunftskolleg of the
University of Konstanz. C.G.G. is supported by the DFG Center of Excellence 2117 “Center for the Advanced
Study of Collective Behaviour” (ID: 422037984).
Author contributions
M.N. and C.G.G. conceived the study. M.N. designed, performed and analysed the experiments, and wrote the
original draft. M.N. and C.G.G. edited the manuscript.
Competing interests
The authors declare no competing interests.
Additional information
Supplementary information is available for this paper at https://doi.org/10.1038/s41598-020-64782-y.
Correspondence and requests for materials should be addressed to M.N.
Reprints and permissions information is available at www.nature.com/reprints.
Publisher’s note Springer Nature remains neutral with regard to jurisdictional claims in published maps and
institutional affiliations.
Open Access This article is licensed under a Creative Commons Attribution 4.0 International
License, which permits use, sharing, adaptation, distribution and reproduction in any medium or
format, as long as you give appropriate credit to the original author(s) and the source, provide a link to the Cre-
ative Commons license, and indicate if changes were made. The images or other third party material in this
article are included in the article’s Creative Commons license, unless indicated otherwise in a credit line to the
material. If material is not included in the article’s Creative Commons license and your intended use is not per-
mitted by statutory regulation or exceeds the permitted use, you will need to obtain permission directly from the
copyright holder. To view a copy of this license, visit http://creativecommons.org/licenses/by/4.0/.
© The Author(s) 2020
Scientific Reports | (2020) 10:7872 | https://doi.org/10.1038/s41598-020-64782-y 15You can also read