Soil organic carbon mobility in equatorial podzols: soil column experiments
←
→
Page content transcription
If your browser does not render page correctly, please read the page content below
SOIL, 7, 585–594, 2021

                                                                                                           SOIL
https://doi.org/10.5194/soil-7-585-2021
© Author(s) 2021. This work is distributed under
the Creative Commons Attribution 4.0 License.

             Soil organic carbon mobility in equatorial podzols:
                           soil column experiments
               Patricia Merdy1 , Yves Lucas1 , Bruno Coulomb2 , Adolpho J. Melfi3 , and Célia R. Montes3
              1 Université de Toulon, Aix Marseille Université, CNRS, IM2NP, 83041 Toulon CEDEX 9, France
                                  2 LCE, Aix Marseille Université, CNRS, Marseille, France
                          3 IEE, NUPEGEL, Universidade de São Paulo, São Paulo 05508-010, Brazil

                                    Correspondence: Patricia Merdy (merdy@univ-tln.fr)

                                    Received: 6 January 2021 – Discussion started: 15 March 2021
                             Revised: 1 July 2021 – Accepted: 26 July 2021 – Published: 6 September 2021

       Abstract. Transfer of organic carbon from topsoil horizons to deeper horizons and to the water table is still
       little documented, in particular in equatorial environments, despite the high primary productivity of the evergreen
       forest. Due to its complexing capacity, organic carbon also plays a key role in the transfer of metals in the soil
       profile and, therefore, in pedogenesis and for metal mobility. Here we focus on equatorial podzols, which are
       known to play an important role in carbon cycling. We carried out soil column experiments using soil material
       and percolating solution sampled in an Amazonian podzol area in order to better constrain the conditions of
       the transfer of organic carbon at depth. The dissolved organic matter (DOM) produced in the topsoil was not
       able to percolate through the clayey, kaolinitic material from the deep horizons and was retained in it. When it
       previously percolated through the Bh material, there was production of fulvic-like, protein-like compounds and
       small carboxylic acids able to percolate through the clayey material and increase the mobility of Al, Fe and Si.
       Podzolic processes in the Bh can, therefore, produce a DOM likely to be transferred to the deep water table,
       playing a role in the carbon balances at the profile scale and, owing to its complexing capacity, playing a role
       in deep horizon pedogenesis and weathering. The order of magnitude of carbon concentration in the solution
       percolating at depth was around 1.5–2.5 mg L−1 . Our findings reveal a fundamental mechanism that favors the
       formation of very thick kaolinitic saprolites.

1   Introduction                                                     points remain of interest due to a low amount of existing data.
                                                                     In recent works, deep carbon dynamics were inferred from
At the global scale, soil organic matter (SOM) constitutes           various types of studies using isotopic tracers such as 13 C or
the largest terrestrial reservoir of organic carbon (Hiederer        14 C (Mathieu et al., 2015; Stahl et al., 2016; Doupoux et al.,
and Kochy, 2012), and therefore, understanding its dynamics          2017; Balesdent et al., 2018; van der Voort et al., 2019), field
is crucial for predicting its behavior in the context of climate     measurements (Lucas et al., 2012; Wan et al., 2018; Gibson
and land use change. The soil carbon pool studies, initially         et al., 2019) and laboratory experiments using column (Guo
focused on the A horizon, or in 0–0.3 m depth, were subse-           and Chorover, 2003) or respiration experiments (Fontaine et
quently extended to the upper 2 m (Batjes, 1996) or deeper           al., 2007; Lucas et al., 2020). Despite this, little is known
levels (Montes et al., 2011; James et al., 2014; Pereira et          about the fluxes and characteristics of organic matter capable
al., 2016). These studies showed that the deep soil carbon           of migrating at depth.
– below 0.3 m – can represent a high proportion of the to-              In this context, we were interested in equatorial podzols
tal organic carbon (OC) stored in a profile (30 % to 63 %;           which are known to play an important role in carbon cy-
Batjes, 1996). Although the interest in better quantifying the       cling. In Amazonia, these soils store a large carbon pool,
deep carbon pool and understanding its dynamics was under-           estimated at around 13.6 PgC (Montes et al., 2011), and
lined 10 years ago (Rumpel and Kögel-Knabner, 2011), these

Published by Copernicus Publications on behalf of the European Geosciences Union.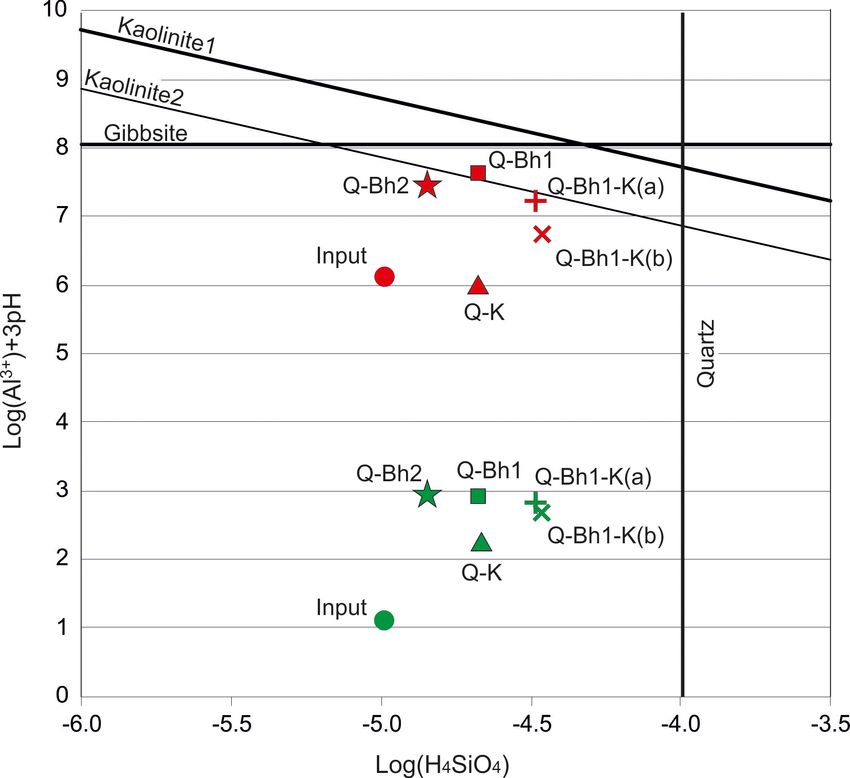
586                                                          P. Merdy et al.: Soil organic carbon mobility in equatorial podzols

Pereira et al. (2016) estimated that they contain on average        als promoted the sorption of the more hydrophobic fraction,
105.9 kgC m−2 , of which 83.2 kgC m−2 are in the deep Bh.           derived from lignin, while the clay minerals, mainly kaoli-
Doupoux et al. (2017) modeled their genesis and dynamics            nite and illite, promoted sorption of the more hydrophilic
by considering both total C fluxes and 14 C fluxes. They no-        fraction. Torn et al. (1997) also showed, through the study
ticed, however, that dissolved organic carbon (DOC) fluxes          of Hawaiian chronosequences ranging from andosols to Ox-
at depth were not known well enough to constrain the model          isols, that the organic matter retention capacity of soil materi-
unambiguously. The DOC fluxes exported and reaching the             als and the turnover of the adsorbed SOM depended on their
deep water table were generally either approximated (1) by          mineralogy. Kaolinitic clays are of special interest; they are,
the analysis of groundwater taken from boreholes or springs         at depth, the main adsorbing mineral in high rainfall tropical
situated at the outlet of an elementary watershed of known          and equatorial areas where the consequences of the high pri-
characteristics or (2) by tracer-aided modeling at the scale        mary productivity of the rainforest on the carbon cycle are
of a larger catchment (Birkel et al., 2020). Such data are          already poorly understood (Grace et al., 2001).
scarce, and Table 1 summarizes those we found relating to              In this framework, we carried out soil column experiments
soil systems from tropical or equatorial environments. They         using soil material and percolating solution from an Ama-
show that the solutions which percolate at depth in the soils       zonian podzol area in order to give some insight to the fol-
of tropical or equatorial environments have high DOC con-           lowing questions: (1) what differences exist between the dis-
tents, varying from 0.3 to 2.3 mg L−1 . Regarding podzols,          solved organic matter (DOM) that percolate at depth and
data relating to springs give information on the solutions that     the DOM produced in the topsoil, (2) does Bh impact the
flow laterally in the eluvial horizons, but there is very little    characteristics and fluxes of DOM percolating at depth, and
detailed data on solutions from horizons below the Bh.              (3) what are the properties of the deep-percolating DOM with
   In addition to total DOC, the characteristics of the organic     respect to the transport of metals involved in mineral equilib-
species help to understand its mobility and potential degrad-       ria and, therefore, pedogenesis?
ability. Data from cambisol, Acrisol or Ferralsol catchments
(Johnson et al., 2006; Osburn et al., 2017) showed that the
DOC percolating at depth was composed of smaller, less
aromatic species than DOC from topsoil horizons. Lucas et           2   Materials and methods
al. (2012) obtained similar results in solutions from podzolic
system that had percolated through, successively, Bh and a          The soil materials used to pack the columns and the
thick (2 m) clayey kaolinitic material.                             percolating solution were sampled in the area, described
   The sampling of deep solutions, often difficult to achieve       in Lucas et al. (2012) and Ishida et al. (2014), situated
in hard-to-reach areas such as the equatorial forest, can be        near the São Gabriel da Cachoeira, Amazonas, Brazil.
effectively supplemented by laboratory simulations, such as         The soil particle size distribution and mineralogical de-
column percolation, with the objective of assessing the po-         terminations were performed after SOM oxidation using
tential mobility of a given DOC through a soil material. This       H2 O2 . Particle size distribution was determined using the
approach is part of a broader theme addressed by many au-           Robinson pipette method. Soil organic carbon (SOC) was
thors who have been interested in interactions between nat-         determined using a carbon, hydrogen, nitrogen and sul-
ural organic matter and minerals, most often related to the         fur (CHNS) analyzer (FLASH 2000; Thermo Fisher Sci-
mobility of contaminants, such as Hg in Amazonian podzols           entific). Kaolinite and gibbsite determination were per-
(Miretzky et al., 2005). Clay minerals, through their sorption      formed by thermogravimetry–differential thermal analysis
properties, promote interactions which condition the trans-         (TG-DTA), using a Shimadzu simultaneous measuring in-
port of DOC in soils and sediments (Jardine et al., 1989;           strument (DTG-60H). Fe oxides were calculated as Fe2 O3
McDowell and Wood, 1984; McCarthy et al., 1993; Kaiser              after total Fe determination by inductively coupled plasma
and Guggenberger, 2000). The oxyhydroxides sensu lato (ox-          atomic emission spectroscopy (ICP-AES) on aqua regia di-
ides, oxyhydroxides sensu stricto and hydroxides) of the soil,      gestion extracts.
because of their small sizes and their surfaces with vari-             The columns used were 60 cm long with an internal di-
able charge, also have strong capacities for DOC sorption.          ameter of 3 cm. To represent the E horizon, we used a quartz
Meier et al. (1999) have shown that goethite has a higher           sand (Q; pure Fontainebleau sand – commercial; particle size
sorption capacity than kaolinite and that, for sufficiently low     < 350 µm). To represent the other horizons, we sampled soil
DOC concentrations (< 20 mgC L−1 ), the adsorption of large         material in Amazonian podzol profiles, namely two sandy Bh
molecules and aromatic groups is favored.                           material profiles (Bh1 with SOC 4.5 % and Bh2 with SOC
   Kaiser and Zech (2000) showed that 85 % to 95 % of the           1.7 %) and kaolinitic material (K) from a horizon underlying
sorption capacity of DOC by the soils they studied (alfisol         Bh (Table 2). Between the sampling time and the experiment,
and inceptisol) was due to the fine fraction (< 2 µm), and that     the Bh and the kaolinitic materials were kept at field moisture
the Fe and Al oxyhydroxides s.l. were primarily responsible         and around 4 ◦ C. All materials were passed through a 2 mm
for this sorption capacity. They also showed that these miner-      sieve and carefully packed in a column to avoid large voids.

SOIL, 7, 585–594, 2021                                                                   https://doi.org/10.5194/soil-7-585-2021
P. Merdy et al.: Soil organic carbon mobility in equatorial podzols                                                                              587

Table 1. DOC content in deep percolating solutions.

                             Soil type                     Sampling depth (cm)       DOC (mgC L−1 )      Reference
                             Amazonian rainforest
                             Ferralsol                                      450             1.4 ± 1.1    McClain et al. (1997)
                             Hydromorphic Ferralsol                         200             2.3 ± 0.9    McClain et al. (1997)
                             Podzol                                         500             2.3 ± 0.7    Lucas et al. (2012)
                             Amazonian transitional rainforest
                             Ferralsol                                  169–965              1.5 ± 2.7   Neu et al. (2016)
                             Oxisols                                     Springs          0.51 ± 0.05    Johnson et al. (2006)
                             Ultisols                                    Springs          0.47 ± 0.05    Johnson et al. (2006)
                             Oxisols                                         800             1.0 ± 0.2   Johnson et al. (2006)
                             Ultisols                                        800             1.1 ± 0.5   Johnson et al. (2006)
                             Costa Rica rainforest
                             Ultisols and inceptisols                    Spring            0.29–0.84     Osburn et al. (2017)
                             Cameroon rainforest
                             Ferralsols                                  Spring             1.0 ± 0.8    Boeglin et al. (2003)
                             Ferralsols                                    800              1.3 ± 0.6    Boeglin et al. (2003)

Table 2. Characteristics of the soil material used in the columns. Weight percent of bulk samples.

                                                        Fine fraction       Silt     Fine sand     Coarse sand                                  Fe
    Name       Munsell color                 SOC             0–2 µm     2–50 µm     0.05–2 mm       0.2–2 mm      Kaolinite      Gibbsite   oxides
    Bh 1       7.5YR2.5/1 black               4.5                2.1        8.8            60.9           23.7          ND           ND        0.2
    Bh 2       7.5YR3/2 dark brown            1.7                1.1       11.2            54.4           31.7          1.2          ND        0.1
    K          5YR8/1 white                   1.3               29.3       67.8             2.9              0         91.3          2.2       0.2

  Note: ND – non-detected.

   These materials were introduced into the columns in layers                      around 4 ◦ C until the experiment. The input solution was
of 5 cm for kaolinitic material and Bh material and of 10 cm                       injected at the top of the column by a peristaltic pump to
for sand. A 0.1 mm nylon mesh was inserted between each                            obtain a downward flow of 0.05 mL mn−1 for 3 weeks to
layer to avoid mixing of the phases, at the top of the column                      obtain around 1.3 L of percolate. In parallel, the peristaltic
to damp the fall of the drops and at the base of the column to                     pump was used in suction mode at the output to homoge-
avoid suffusion of the material.                                                   nize the speed and have the same residence time in all the
   A total of six column experiments were conducted accord-                        columns. The output solution was sampled every 5 d, giving
ing to the arranged percolating device shown in Fig. 1. In                         5 samples (fractions F1 to F5) for each column of approxi-
total, two columns were packed with a Q-Bh arrangement                             mately 250 mL each. For each column, a composite sample
(Q-Bh1 and Q-Bh2) to observe the DOM transfer through                              was formed by proportional mixing of the fractions.
and from the Bh. Then, three columns (Q-Bh1-K(a), Q-Bh1-                              The input solution and the percolates were filtered on a
K(b) and Q-Bh2-K) were packed with a Q-Bh-K arrange-                               0.45 µm cellulose nitrate filter previously washed with Milli-
ment to observe the adsorption of the DOM issued from the                          Q water and on which blanks made it possible to check the
Bh by the kaolinitic clay material. Finally, one column (Q-                        absence of contamination regarding the elements analyzed.
K) was packed with a Q-K arrangement to observe the direct                         DOC, Fe and Al concentrations were determined for each
adsorption of the DOM circulating in the E horizons by the                         fraction; Si and small organic acids (SOAs; formic, oxalic,
kaolinitic clay material.                                                          malic, etc.) were determined on composite samples.
   The input solution was a pH 4.1 black water taken from                             Input solution and percolates were analyzed according to
a spring located towards the center of a podzolic area                             the following techniques. The DOC was determined by a to-
(0◦ 60 4200 S, 66◦ 540 0900 W), corresponding to the water of the                  tal organic carbon (TOC) meter (TOC-V; Shimadzu) coupled
perched water table circulating in the E horizons. It was kept                     to an ASI-V automatic sampler. The dissolved organic mat-
in air-tight plastic bottles, protected from light and kept at                     ter (DOM) was characterized by 3D fluorescence (excitation

https://doi.org/10.5194/soil-7-585-2021                                                                                  SOIL, 7, 585–594, 2021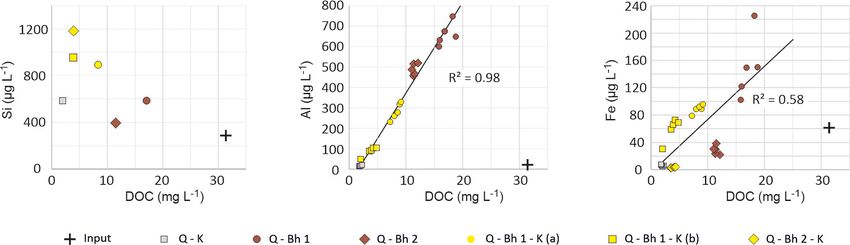
588                                                          P. Merdy et al.: Soil organic carbon mobility in equatorial podzols

Figure 1. Experimental setup. Q – quartz sand; Bh – sandy Bh ma-    Figure 2. Concentration of the DOC in the five fractions (F1 to F5)
terial; K – clayey kaolinitic material.                             of the column percolate and in the composite sample. Analytical
                                                                    errors are smaller than the point marks.

emission matrix fluorimetry – EEMF; Hitachi F-4500 spec-
trometer). This method allows a rapid characterization of flu-      changes within a given column experiment in the behavior of
orophores associated with humic matter and proteins (Chen           the columns, which allows us to discuss the results using the
et al., 2003; Nebbioso and Piccolo, 2013). Major anions and         composite sample compositions given in Table 3.
cations were determined by ion chromatography (Dionex                  In Fig. 3, we considered that the output of the Q-Bh-type
DX-120), using 9 mmol L−1 NaHCO3 for cation elution and             columns corresponded to the input into the kaolinitic mate-
10 mmol L−1 methane sulfonic acid for anion elution. Si,            rial of the Q-Bh-K-type columns. There was a relatively large
Al and Fe were quantified by ICP-AES. SOAs (formic, ox-             variation between columns of the same type; the differences
alic, malic, etc.) were determined and quantified by high-          between columns of different types, however, remained con-
performance ion chromatography (Dionex ICS-3000) cou-               sistent.
pled to a mass spectrometer (MSQ Plus, Thermo Fisher Sci-              Regarding DOC, the lowest column outlet concentration
entific) driven by Chromeleon® (version 6.80) and equipped          (1.9 mg L−1 ) was observed for the Q-K column (Table 3),
with an AG11-HC guard column (Dionex IonPac) and an                 where 94 % of the carbon introduced at the top of the column
AS11-HC guard column (4 × 250 mm; Dionex IonPac), us-               was retained; consistently, the upper part of the kaolinitic
ing a 25 µL loop injection valve. Analysis was performed in         layer acquired a light brown color. The highest DOC out-
a gradient mode (from 1 to 5 mM NaOH in helium-sparged              let concentrations (17.1 and 11.5 mg L−1 ) were observed
demineralized water in 40 min) at 30 ◦ C, with a flow rate set      for the two Q-Bh-type columns, which was expected, but
at 0.8 mL min−1 . To improve the signal-to-noise ratio of the       where, however, 46 % and 63 % of the carbon introduced
measurement, an external flow electrochemical suppressor            were retained. The DOC concentrations at the outlet of the
system (ACRS-ICE 500; 4 mm) was added to the analytic               three Q-Bh-K-type columns were intermediate (8.4, 3.9 and
system.                                                             3.9 mg L−1 ), corresponding to the retention of 81 %, 88 %
   The experience was conducted at room temperature                 and 89 % of the introduced carbon, respectively. In summary,
(24 ◦ C), close to the average temperature in the forest, which     the Bh retained part of the introduced DOC and the kaolinitic
is around 25 ◦ C (Salati and Marques, 1984).                        material retained most of the DOC of the solution which per-
                                                                    colated through. The presence of a Bh, however, increased
                                                                    the proportion of carbon which passed through the kaolinitic
3     Results and discussion
                                                                    material. The nature of the DOM released by the Bh was,
                                                                    therefore, probably different from that of the DOM of the in-
3.1    Transfers of carbon and major elements
                                                                    put, i.e., of the black water from the perched water table; this
The pH of the percolating solution was 4.1, and it was not          was likely due to a specific microbial activity within the Bh
modified by passing through the columns. For each col-              in the columns.
umn, the variations in DOC concentration between fractions             Regarding Si, the column outlet concentrations were al-
throughout the experiment remained much lower than the              ways higher (393 to 1182 µg L−1 ) than the inlet concentra-
differences between the columns and did not exhibit clear           tion (287 µg L−1 ); all columns released Si. Percolation by the
trends (Fig. 2); the same evolution was observed for Al             input solution through the Bh only (Q-Bh), or the kaolinitic
and Fe concentrations. There were, therefore, no substantial        material only (Q-K), released Si in similar proportions (outlet

SOIL, 7, 585–594, 2021                                                                   https://doi.org/10.5194/soil-7-585-2021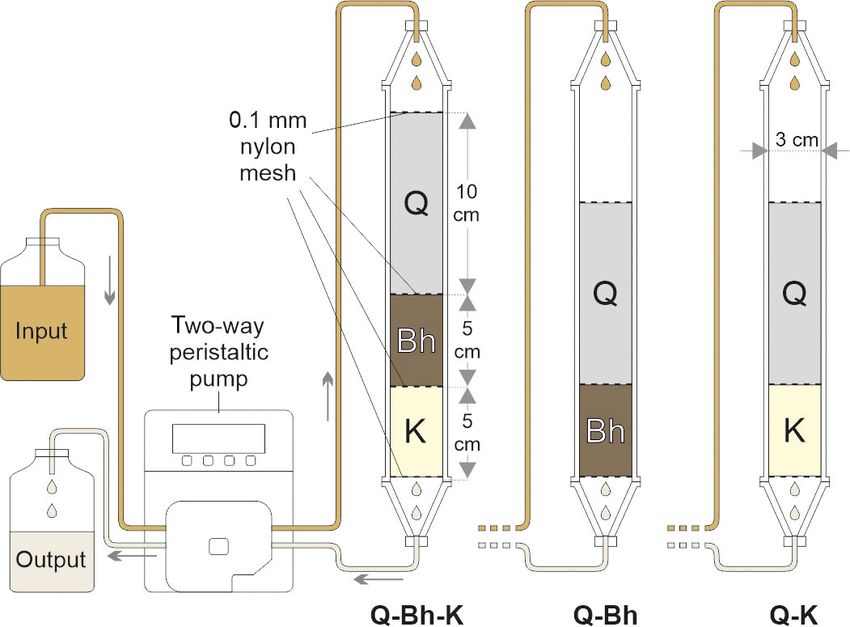
P. Merdy et al.: Soil organic carbon mobility in equatorial podzols 589
Table 3. C, Al, Fe and Si transferred in dissolved phase in the column experiments. Output values correspond to the composite samples.
Analytical percent error: C – 1.4; Al – 6.0; Fe – 4.8; Si – 1.9.
Q-K Q-Bh1 Q-Bh2 Q-Bh1-K (a) Q-Bh1-K (b) Q-Bh2-K
DOC concentration in input (mg L−1 ) 31.4 31.4 31.4 31.4 31.4 31.4
DOC concentration in output (mg L−1 ) 1.9 17.1 11.5 8.4 3.9 3.9
Al concentration in input (µg L−1 ) 22 22 22 22 22 22
Al concentration in output (µg L−1 ) 17 658 490 286 91 na
Fe concentration in input (µg L−1 ) 61 61 61 61 61 61
Fe concentration in output (µg L−1 ) 6 153 32 95 62 3
Si concentration in input (µg L−1 ) 287 287 287 287 287 287
Si concentration in output (µg L−1 ) 585 583 393 891 953 1182
Note: na – not analyzed.
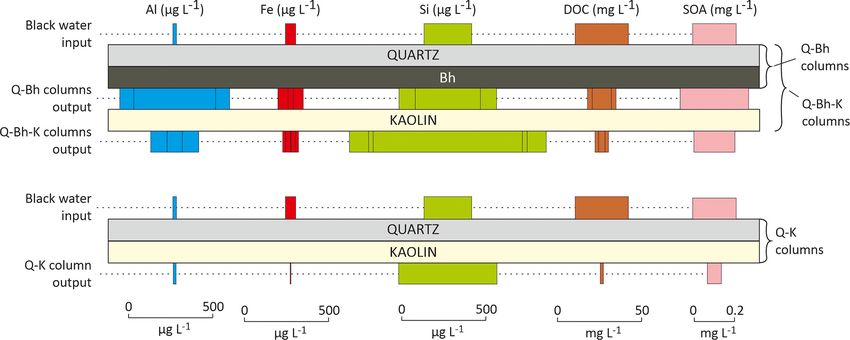
Figure 3. Representation of the concentrations measured during the column experiments. The width of the colored blocks represents the
concentration of the solute. SOA – small organic acid.
concentrations from 393 to 585 µL−1 ); the greatest releases Lucas, 2001; Patel-Sorrentino et al., 2006) or mineral col-
(891, 953 and 1182 µg L−1 ) were observed after successive loids (kaolinite, gibbsite and goethite; Cheng and Saiers,
percolation through Bh and kaolinitic material in the Q-Bh- 2015) during percolation through the Bh. These complexes
K-type columns. or colloids are subsequently partially retained during per-
Aluminum exhibited a very different behavior from that colation through the kaolinitic material. In the Bh output,
of Si. Percolation through the Bh (Q-Bh) by the input so- Si and Al were released in a stoichiometry equivalent to
lution (Al concentration 22 µg L−1 ) resulted in high release that of kaolinite, which would be compatible with a re-
of Al (490 and 658 µg L−1 ), when percolation through the lease of colloidal kaolinite. Recent studies, however, sug-
kaolinitic material only (Q-K) resulted in a partial retention gested that Si and Al can be transferred as ternary OM-Al-
of Al (Al concentration at outlet 17 µg L−1 ). As for DOC, Si complexes (Merdy et al., 2020). During the subsequent
however, the previous percolation through the Bh (Q-Bh- percolation through the kaolinitic material, the behavior of
K columns) increased the proportion of Al which passed these two elements diverged completely; the kaolinitic ma-
through the kaolinitic material. The discrepancy between Si terial retained Al, while it released Si, suggesting that Al
and Al behavior shows that these elements were not con- was released by the Bh as OM complexes. This interpreta-
trolled by a congruent dissolution of kaolinite. The iron con- tion is supported by the high correlation between DOC and
centration pattern was quite similar to Al but with lower con- Al (Fig. 4). Fe behaved similarly but with a weaker correla-
centrations at column outlets. Iron and Al release was differ- tion with DOC, which suggests that Al was only transferred
ent between Bh1 and Bh2, which may be due to the different as DOM–Al complexes when Fe could also be transferred as
crystallochemistry of Al- and Fe-bearing minerals. mineral colloids.
The behavior of Fe and Al could be explained by the re- To assess the consistency of these interpretations, we built
lease either of OM complexes (organometallic complexes; a Si–Al diagram considering the data obtained from the stud-
https://doi.org/10.5194/soil-7-585-2021 SOIL, 7, 585–594, 2021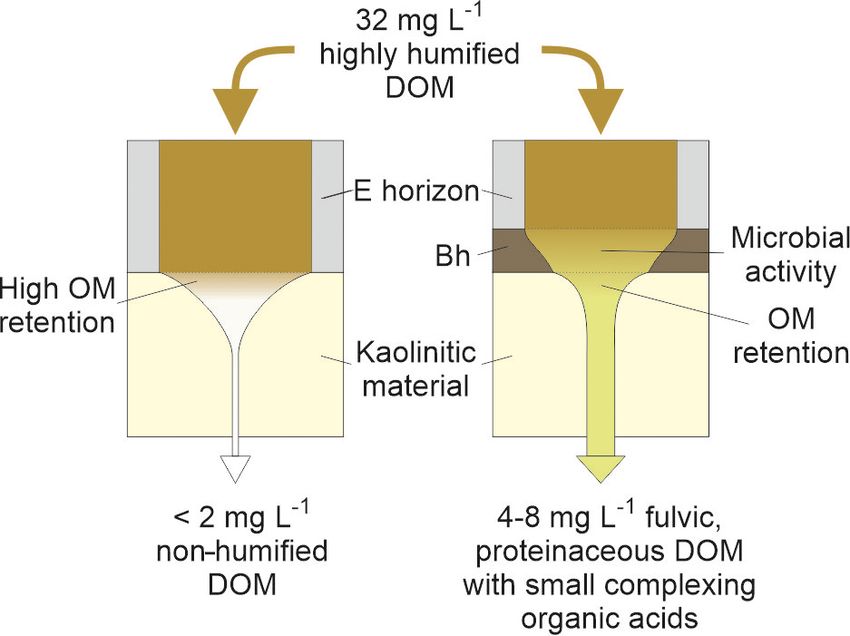
590 P. Merdy et al.: Soil organic carbon mobility in equatorial podzols
Figure 4. Relationships between DOC and dissolved Al, Fe and Si in column percolates. The cross represents the concentration in the input
solution. Values are from composite samples for Si and from individual fractions for Al and Fe.
ied solutions, taking into account the metal complexation by
the DOM on one the hand or not taking it into account on
the other hand (Fig. 5). The parameters of the dissolved or-
ganic matter necessary for the quantification of the complex-
ation were a site density equal to 27 µmol mg−1 (Lucas et
al., 2012) and a DOM–Al conditional stability constant equal
to 105 (Lee, 1985; Hagvall et al., 2015). The line labeled
“Kaolinite 1” corresponds to the stability of kaolinite calcu-
lated with the WATEQ4F database, which uses a solubility
product (Ksp) identical to that proposed by Tardy and Nahon
(1985), after a critical analysis of the literature. The “Kaoli-
nite 2” line uses the solubility product (log(Ksp)) proposed
by Grimaldi et al. (2004) to report on equatorial supergene
kaolinites substituted in iron and of variable crystallinity.
When the DOM–Al complexes are not considered, Q-Bh1,
Q-Bh2 and Q-Bh1-K(a) output solutions seem near equilib-
rium with kaolinite. However, when DOM–Al complexes are
considered, all output solutions are greatly undersaturated
with kaolinite and gibbsite. These solutions, which remain
aggressive towards the kaolinite, are therefore able to dis- Figure 5. Situation of the studied solutions in the Si–Al system.
solve the upper part of the horizons located under the Bh, Note: red symbols – without considering DOM–Al complexes;
promoting the thickening of the profile. green symbols – considering DOM–Al complexes.
3.2 Fluorescence properties of percolation solutions
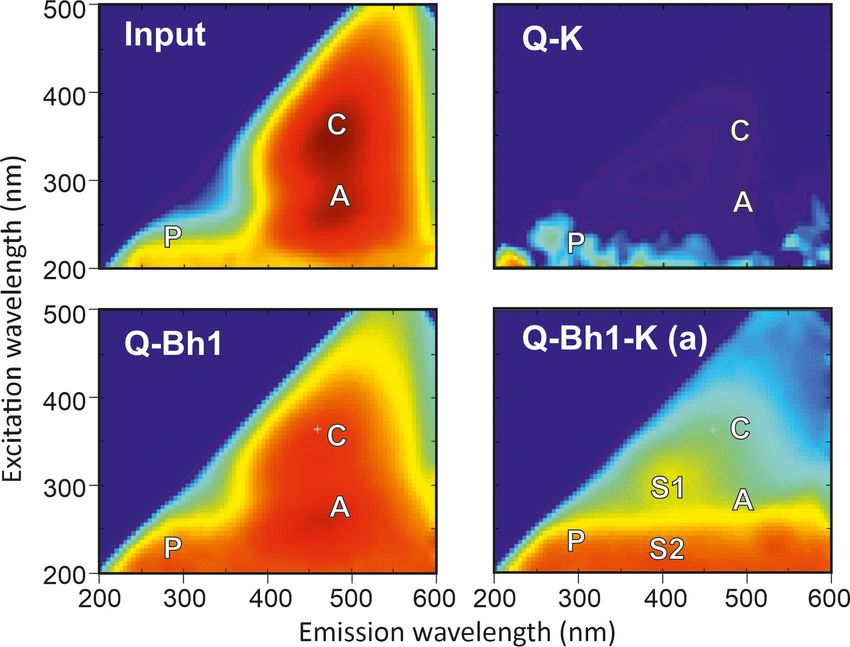
material (Q-K output), there is hardly any humified DOM
Excitation emission fluorescence matrix (EEFM) of input and a very reduced signal of the protein-like DOM; nearly
and output solutions are given in Fig. 6. The peak A cor- all fluorescent DOM was retained in the kaolinitic material.
responds to fulvic-like humic compounds, the peak C to After the input solution has passed through the Bh (Q-Bh1
humic-like humic compounds and the peak P to protein-like output), there was a reversal of the C/A intensity ratio, which
compounds that indicate an active bacterial activity (Coble, indicates a partial retention of the most condensed DOM in
1996); these peaks are characteristic of natural terrestrial the Bh, and an a higher P peak, which indicates a bacterial
DOM. The peaks S1 and S2 have been related to non-humic- activity within the Bh. After the input solution has passed
like labile matter related to microbial activity (Singh et al., through both Bh and kaolinitic material (Q-Bh1-K(a) out-
2010) or to fulvic-like compounds (Stedmon and Markager, put), the DOM exhibited a humified character, more fulvic
2005). than humic, and protein-like features.
The EEFM of the input solution was typical of humified These observations confirmed that the DOM released by
DOM with a dominant C peak, a marked A peak and a small the Bh was different from the DOM of the input solution. The
P peak. After the input solution has passed through kaolinitic Bh retained most of the humified DOM compounds and re-
SOIL, 7, 585–594, 2021 https://doi.org/10.5194/soil-7-585-2021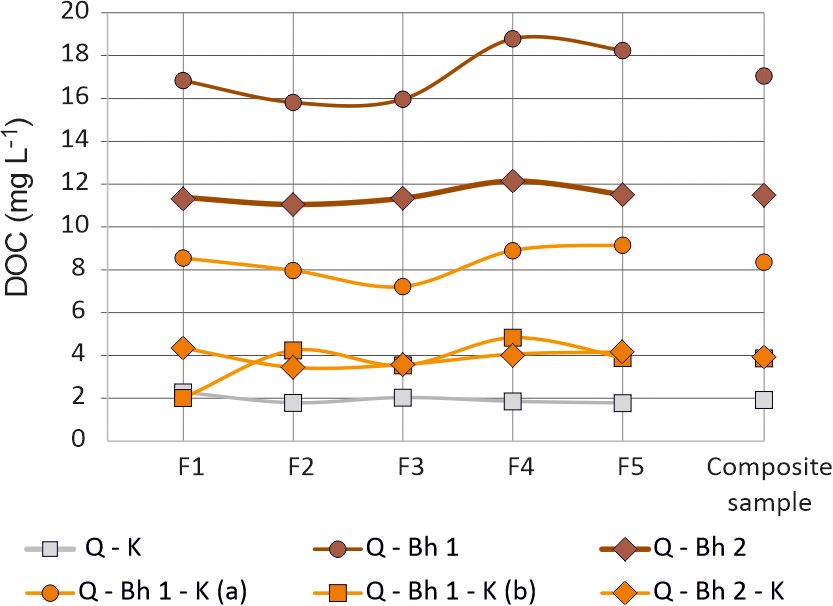
P. Merdy et al.: Soil organic carbon mobility in equatorial podzols                                                                      591

Table 4. Concentrations ± standard deviation of small carboxylic acids in the studied solutions and from the literature. Values in milligrams
of carbon per liter; < dl – lower than detection limit.

                                                        Q-Bh-K output     Q-Bh output       Q-K output     Water table beneath
                                       Input solution      (8 samples)     (3 samples)      (2 samples)   a kaolinitic horizon∗
                Formic acid                     < dl              < dl            < dl             < dl                   0.44
                Acetic acid                     < dl              < dl            < dl             < dl                   0.10
                Propionic acid                  < dl              < dl            < dl             < dl
                Lactic acid                    0.196     0.065 ± 0.020   0.164 ± 0.028    0.070 ± 0.042                   0.02
                Oxalic acid                     < dl     0.029 ± 0.025   0.110 ± 0.065             < dl                   0.09
                Valeric acid                    < dl              < dl            < dl             < dl
                Malic acid                     0.021     0.007 ± 0.005   0.030 ± 0.004             < dl
                Citric acid                     < dl     0.075 ± 0.082            < dl             < dl                   0.07
                Succinic acid                   < dl     0.028 ± 0.024   0.038 ± 0.001             < dl
                Total SOAs C                   0.217            0.204             0.341           0.07
              ∗ Lucas et al. (2012).

                                                                            in the quantities and variety of SOAs, indicating microbial
                                                                            activity during the experiment, which is consistent with our
                                                                            fluorescence observations. Comparing Q-K and Q-Bh-K out-
                                                                            puts shows that a previous percolation through the Bh in-
                                                                            creased, as for DOC, the proportion of SOA carbon which
                                                                            passed through the kaolinitic material (Fig. 3). This observa-
                                                                            tion is consistent with fluorescence data and strengthens the
                                                                            interpretation that the DOM released by the Bh was different
                                                                            from that of the input solution.

                                                                            3.4    From experiment to field

                                                                            To what extent can the above findings be extrapolated to field
                                                                            conditions? The column experiments exhibited differences
Figure 6. Excitation–emission fluorescence matrix of the solutions          with typical field conditions. It lasted only 3 weeks, when,
and arbitrary units. The letters identify the usual position of the         at fields under typical conditions, a quasi-permanent water
peaks P (protein like), C (humic like), A (fulvic like), S1 and S2          table is perched over the Bh, which has a low hydraulic con-
(non-humic or fulvic like).                                                 ductivity. The solution circulating in the E horizon likely per-
                                                                            colates very slowly in the Bh throughout the year (Ishida et
                                                                            al., 2014). In the columns, the Bh was reworked, which re-
leased compounds capable of being transferred through clay                  sulted in a higher hydraulic conductivity and most likely dif-
materials, which were more fulvic like or protein like, as is-              ferent soil solution contact conditions from that in the field. It
sued from active bacterial activity.                                        was previously dried out, which may result in a change in mi-
                                                                            crobial activity (Denef et al., 2001). Microbial activity is also
3.3   Transfer of small organic acids
                                                                            sensitive to redox conditions. Our column experiments were
                                                                            conducted without controlling the redox potential when deep
Chromatography was used to identify the composition of the                  in situ Bh exhibits reducing conditions (Lucas et al., 2012).
DOM present in the column experiments. Lactic and malic                        Nevertheless, the column experiment showed negligible
acids were the only small organic acids found in the input                  variations with time of the percolate characteristics, which
solution at detectable concentrations (Table 4). After the in-              suggests a steady state. Results are also consistent with the
put solution has passed directly through kaolinitic material                scarce field data available.
(Q-K output), 68 % of the carbon from the measured SOAs                        The ratio of input/output average DOC concentration for
was retained in the kaolinitic material, and it only remained a             the Q-Bh-K columns ranged from 0.12 to 0.27, which is
low concentration of lactic acid. Percolation of the input so-              in the range of those observed between DOC concentra-
lution through the Bh (Q-Bh output) resulted in an increase                 tion in E horizons and deep water table (0.13; Lucas et al.,

https://doi.org/10.5194/soil-7-585-2021                                                                           SOIL, 7, 585–594, 2021
592 P. Merdy et al.: Soil organic carbon mobility in equatorial podzols
horizon. Microbial activity in an in situ Bh may be different
from that observed in the columns, but the input/output C ra-
tio of our experiments was in the range of what has been ob-
served in field or predicted by modeling. A DOC concentra-
tion around 1.5–2.5 mg L−1 for solutions percolating through
deep kaolinitic horizons appeared, therefore, to be a good
order of magnitude. The higher proportion of small organic
acids in the solution able to percolate through deep kaolinitic
horizons confirmed its ability to transfer metals such as Al
or Fe as organometallic complexes, increasing, therefore, the
leaching at depth of these elements.
These conclusions strengthen the interpretation given in
Ishida et al. (2014), which is related to one of the processes
Figure 7. Main conclusions diagram.
that drive the genesis of tropical podzols. The solution that
percolates through the Bh is able to transfer metals through
a kaolinitic material, therefore promoting the downward pro-
2012) or predicted by podzol genesis modeling (0.14 to 0.35; gression of the E/Bh horizons by weathering the upper part
Doupoux et al., 2017). of the kaolinitic deep horizons. More widely, our findings re-
In the column experiments, the DOM that percolated veal a fundamental mechanism that favors the formation of
through the kaolinitic material had a higher content of small very thick kaolinitic saprolite where pedogenesis could act
carboxylic acids and of fulvic-like compounds, i.e., it was for a sufficiently long time.
less aromatic than DOM of the input solution. Such com-
pounds are therefore poorly retained by the kaolinitic ma-
Data availability. The data used in this study are available from
terial. This is consistent with the observations of Lucas et
the corresponding author.
al. (2012), who found that the DOC of the water table situ-
ated under a kaolinitic horizon in a podzolic area had a high
proportion of small organic compounds with high complex- Author contributions. PM designed the experiments that were
ing capacity. carried out by PM and YL. YL, CRM and AJM did the field sam-
Field data suggest that the lower boundary of the kaolinitic pling. BC realized the SOA analysis. PM and YL prepared the paper
horizons beneath the Bh moves downward with time (Ishida with contributions from all the co-authors. YL and CRM were the
et al., 2014). This is consistent with the transfer of DOM–Al project leaders in France and Brazil, respectively.
complexes, which can release Al at depth, promoting kaoli-
nite precipitation. Iron can be transferred in the same way
but does not accumulate due to more reducing conditions at Competing interests. The authors declare that they have no con-
depth. flict of interest.
It is, therefore, possible to conclude that percolation
through the Bh plays a key role in the geochemistry of the
system, by producing compounds able to transfer both DOC Disclaimer. Publisher’s note: Copernicus Publications remains
and metals through kaolinitic materials. neutral with regard to jurisdictional claims in published maps and
institutional affiliations.
4 Conclusions
Financial support. This research has been supported by the Fun-
The column experiments led to conclusions shown schemat- dação de Amparo à Pesquisa do Estado de São Paulo (grant nos.
ically in Fig. 7. The DOM produced in the acidic upper 2011/03250-2 and 2012/51469-6), the Agence Nationale de la
horizons and circulating in the E horizons would be highly Recherche (grant no. ANR-12-IS06-0002; “C-PROFOR”) and the
Conselho Nacional de Desenvolvimento Científico e Tecnológico
adsorbed, with a complete retention of the humified com-
(grant nos. 303478/2011-0 and 306674/2014-9).
pounds, if directly percolating through a clayey, kaolinitic
material. If this DOM previously percolated through a Bh, it
is subjected to transformation in this horizon. The humic-like
Review statement. This paper was edited by Stefan Doerr and
compounds are retained, and a more fulvic-like, proteina- reviewed by two anonymous referees.
ceous DOM containing small organic acids, which is more
likely to percolate through a kaolinitic material, is released.
The DOM that percolates in deep horizons is, therefore,
different to the highly humified DOM that circulates in the E
SOIL, 7, 585–594, 2021 https://doi.org/10.5194/soil-7-585-2021P. Merdy et al.: Soil organic carbon mobility in equatorial podzols 593
References forested headwater catchment, Hydrol. Process., 18, 93–106,
https://doi.org/10.1002/hyp.1314, 2004.
Guo, M. and Chorover, J.: Transport and fractionation of dis-
Balesdent, J., Basile-Doelsch, I., Chadoeuf, J., Cornu, S., Der- solved organic matter in soil columns, Soil Sci., 168, 108–118,
rien, D., Fekiacova, Z., and Hatté, C.: Atmosphere–soil car- https://doi.org/10.1097/00010694-200302000-00005, 2003.
bon transfer as a function of soil depth, Nature, 559, 599–602, Hagvall, K., Persson, P., and Karlsson, T.: Speciation
https://doi.org/10.1038/s41586-018-0328-3, 2018. of aluminum in soils and stream waters: The impor-
Batjes, N. H.: Total carbon and nitrogen in the soils of the world, tance of organic matter, Chem. Geol., 417, 32–43,
Eur. J. Soil Sci., 47, 151–163, https://doi.org/10.1111/j.1365- https://doi.org/10.1016/j.chemgeo.2015.09.012, 2015.
2389.1996.tb01386.x, 1996. Hiederer, R. and Kochy, M.: Global Soil Organic Carbon Es-
Birkel, C., Duvert, C., Correa, A., Munksgaard, N. C., Maher, D. timates and the Harmonized World Soil Database, EUR
T., and Hutley, L. B.: Tracer-aided modeling in the low-relief, Scientific and Technical Research Series EUR 25225 EN,
wet-dry tropics suggests water ages and DOC export are driven https://doi.org/10.2788/1326, 2012.
by seasonal wetlands and deep groundwater, Water Resour. Res., Ishida, D. A., Montes, C. R., Lucas, Y., Pereira, O. J. R., Merdy, P.,
56, e2019WR026175, https://doi.org/10.1029/2019WR026175, and Melfi, A. J.: Genetic relationships between ferralsols, pod-
2020. zols and white kaolin in Amazonia, Eur. J. Soil Sci., 65, 706–717,
Boeglin, J. L., Ndam., J. R., and Braun, J. J.: Composition of the https://doi.org/10.1111/ejss.12167, 2014.
different reservoir waters in a tropical humid area: example of James, J., Devine, W., Harrison, R., and Terry, T.: Deep
the Nsimi catchment (Southern Cameroon), J. Afr. Earth Sci., Soil Carbon: Quantification and Modeling in Sub-
37, 103–110, https://doi.org/10.1016/S0899-5362(03)00041-1, surface Layers, Soil Sci. Soc. Am. J., 78, 1–10,
2003. https://doi.org/10.2136/sssaj2013.06.0245nafsc, 2014.
Chen, W., Westerhoff, P., Leenheer, J. A., and Booksh, K.: Flu- Jardine, P. M., McCarthy, J. F., and Weber, N. L.:
orescence Excitation−Emission Matrix Regional Integration Mechanisms of Dissolved Organic Carbon Adsorp-
to Quantify Spectra for Dissolved Organic Matter, Environ. tion on Soil, Soil Sci. Soc. Am. J., 53, 1378,
Sci. Technol. 37, 5701–5710, https://doi.org/10.1021/es034354c, https://doi.org/10.2136/sssaj1989.03615995005300050013x,
2003. 1989.
Cheng, T. and Saiers, J. E.: Effects of dissolved organic Johnson, M. S., Lehmann, J., Selva, E. C., Abdo, M., Riha, S., and
matter on the co-transport of mineral colloids and sorp- Couto, E. G.: Organic carbon fluxes within and streamwater ex-
tive contaminants, J. Contam. Hydrol., 177, 148–157, ports from headwater catchments in the southern Amazon, Hy-
https://doi.org/10.1016/j.jconhyd.2015.04.005, 2015. drol. Process., 20, 2599–2614, https://doi.org/10.1002/hyp.6218,
Coble, P. G.: Characterization of marine and terrestrial DOM 2006.
in seawater using excitation-emission matrix spectroscopy, Kaiser, K. and Guggenberger, G.: The role of DOM sorption to
Mar. Chem., 51, 325–346, https://doi.org/10.1016/0304- mineral surfaces in the preservation of organic matter in soils,
4203(95)00062-3, 1996. Org. Geochem., 31, 711–725, https://doi.org/10.1016/S0146-
Denef, K., Six, J., Bossuyt, H., Frey, S. D., Elliott, E. T., Merckx, 6380(00)00046-2, 2000.
R., and Paustian, K.: Influence of dry-wet cycles on the interre- Kaiser, K. and Zech, W.: Dissolved Organic Matter sorption
lationship between aggregate, particulate organic matter, and mi- by mineral constituents of subsoil clay fractions, J. Plant
crobial community dynamics, Soil Biol. Bioch., 33, 1599–1611, Nutr. Soil Sci., 163, 531–535, https://doi.org/10.1002/1522-
https://doi.org/10.1016/S0038-0717(01)00076-1, 2001. 2624(200010)163:53.3.CO;2-E, 2000.
Doupoux, C., Merdy, P., Montes, C. R., Nunan, N., Melfi, A. Lee, Y.: Aluminium speciation in different water types, Ecol. Bull.
J., Pereira, O. J. R., and Lucas, Y.: Modelling the genesis 37, 109–119, available at: http://www.jstor.org/stable/20112940
of equatorial podzols: age and implications for carbon fluxes, (last access: 26 August 2021), 1985.
Biogeosciences, 14, 2429–2440, https://doi.org/10.5194/bg-14- Lucas, Y.: The role of plants in controlling rates and
2429-2017, 2017. products of wheathering: Importance of biological
Fontaine, S., Barot, S., Barré, P., Bdioui, N., Mary, B., and pumping, Annu. Rev. Earth Planet. Sci., 29, 135–63,
Rumpel, C.: Stability of organic carbon in deep soil lay- https://doi.org/10.1146/annurev.earth.29.1.135, 2001.
ers controlled by fresh carbon supply, Nature, 450, 277–280, Lucas, Y., Montes, C. R., Mounier, S., Loustau Cazalet, M.,
https://doi.org/10.1038/nature06275, 2007. Ishida, D., Achard, R., Garnier, C., Coulomb, B., and Melfi,
Gibson, C. M., Estop-Aragonés, C., Flannigan, M., Thompson, A. J.: Biogeochemistry of an Amazonian podzol-ferralsol soil
D. K., and Olefeldt, D.: Increased deep soil respiration de- system with white kaolin, Biogeosciences, 9, 3705–3720,
tected despite reduced overall respiration in permafrost peat https://doi.org/10.5194/bg-9-3705-2012, 2012.
plateaus following wildfire, Environ. Res. Lett., 14, 125001, Lucas, Y., Santin„ R., Merdy, P., Melfi, A. J., Pereira, O. J. R.,
https://doi.org/10.1088/1748-9326/ab4f8d, 2019. and Montes, C. R.: Soil sample conservation from field to lab
Grace, J., Malhi, Y., Meir, P., and Higuchi, N.: Productivity of for heterotrophic respiration assessment, MethodsX, 7, 101039,
Tropical Rain Forests, in: Terrestrial Global Productivity – https://doi.org/10.1016/j.mex.2020.101039 hal-02954428, v1,
Physiological Ecology, edited by: Roy, J., Saugier, B., and 2020.
Mooney, H. A., Academic Press, San Diego, USA, 401–426, Mathieu, J. A., Hatté, C., Balesdent, J., and Parent, É.: Deep soil
https://doi.org/10.1016/B978-012505290-0/50018-1, 2001. carbon dynamics are driven more by soil type than by climate: a
Grimaldi, C., Grimaldi, M., Millet, A., Bariac, T., and Boulègue,
J.: Behaviour of chemical solutes during a storm in a rain-
https://doi.org/10.5194/soil-7-585-2021 SOIL, 7, 585–594, 2021594 P. Merdy et al.: Soil organic carbon mobility in equatorial podzols
worldwide meta-analysis of radiocarbon profiles, Glob. Change Pereira, O. J. R., Montes, C. R., Lucas, Y., and Melfi, A. J.: Evalu-
Biol., 21, 4278–4292, https://doi.org/10.1111/gcb.13012, 2015. ation of pedotransfer equations to predict deep soil carbon stock
McCarthy, J. F., Williams, T. M., Liang, L., Jardine, P. M., Jolley, L. in tropical Podzols compared to other soils of Brazilian Amazon
W., Taylor, D. L., Palumbo, A. V., and Cooper, L. W.: Mobility of forest, in: Digital Soil Morphometrics (Progress in Soil Science),
natural organic matter in a study aquifer, Environ. Sci. Technol., edited by: Hartemink, A. E. and Minasny B., Springer, Berlin,
27, 667–676, https://doi.org/10.1021/es00041a010, 1993. Heidelberg, Germany, 331–349, https://doi.org/10.1007/978-3-
McClain, M. E., Richey, J. E., Brandes, J. A., and Pimentel, T. P.: 319-28295-4_22, 2016.
Dissolved organic matter and terrestrial-lotic linkages in the Cen- Rumpel, C. and Kögel-Knabner, I.: Deep soil organic matter – a
tral Amazon Basin of Brazil, Global Biogeochem. Cy., 11, 295– key but poorly understood component of terrestrial C cycle, Plant
311, https://doi.org/10.1029/97GB01056, 1997. Soil, 338, 143–158, https://doi.org/10.1007/s11104-010-0391-5,
McDowell, W. H. M. and Wood, T.: Podzolization: Soil processes 2011.
control dissolved organic carbon concentration in stream water, Singh, S., D’Sa, E. J., and Swenson, E. M.: Chromophoric dis-
Soil Sci., 137, 23–32, 1984. solved organic matter (CDOM) variability in Barataria Basin us-
Meier, M., Namjesnik-Dejanovic, K., Maurice, P. A., Chin, Y. P., ing excitation–emission matrix (EEM) fluorescence and paral-
and Aiken, G. R.: Fractionation of aquatic natural organic matter lel factor analysis (PARAFAC), Sci. Total Environ., 408, 3211–
upon sorption to goethite and kaolinite, Chem. Geol., 157, 275– 3222, https://doi.org/10.1016/j.scitotenv.2010.03.044, 2010
284, https://doi.org/10.1016/S0009-2541(99)00006-6, 1999. Salati, E. and Marques, J.: Climatology of the Amazon region,
Merdy, P., Neytard, C., Meunier, J. D., and Lucas, Y.: PDMPO: a in: The Amazon, Monographiae Biologicae, edited by: Sioli,
specific silicon or silica, pH sensitive fluorescent probe?, RSC H., 56, Springer, Dordrecht, https://doi.org/10.1007/978-94-009-
Adv., 10, 31003–31011, https://doi.org/10.1039/D0RA05108J, 6542-3_4, 1984.
2020 Stahl, C., Freycon, V., Fontaine, S., Dezécache, C., Ponchant, L.,
Miretzky, P., Bisinoti, M. C., Jardim, W. F., and Rocha, J. Picon-Cochard, C., Klumpp, K., Soussana, J. F., and Blanfort,
C.: Factors affecting Hg (II) adsorption in soils from the V.: Soil carbon stocks after conversion of Amazonian tropical
Rio Negro basin (Amazon), Quimica Nova, 28, 438–443, forest to grazed pasture: importance of deep soil layers, Reg. En-
https://doi.org/10.1590/S0100-40422005000300014, 2005. viron. Change, 16, 2059–2069, https://doi.org/10.1007/s10113-
Montes, C. R., Lucas, Y., Pereira, O. J. R., Achard, R., 016-0936-0, 2016.
Grimaldi, M., and Melfi, A. J.: Deep plant-derived carbon Stedmon, C. A. and Markager, S.: Resolving the variability in dis-
storage in Amazonian podzols, Biogeosciences, 8, 113–120, solved organic matter fluorescence in a temperate estuary and
https://doi.org/10.5194/bg-8-113-2011, 2011. its catchment using PARAFAC analysis, Limnol. Oceanogr. 50,
Nebbioso, A. and Piccolo, A.: Molecular characterization of dis- 686–97, https://doi.org/10.4319/lo.2005.50.2.0686, 2005.
solved organic matter (DOM): a critical review, Anal. Bioanal. Tardy, Y. and Nahon, D.: Geochemistry of laterites, sta-
Chem., 40, 109–124, https://doi.org/10.1007/s00216-012-6363- bility of Al-goethite, Al-hematite, and Fe3+ -kaolinite
2, 2013. in bauxites and ferricretes: an approach to the mecha-
Neu, V., Ward, N. D., Krusche, A. V., and Neil, C.: Dis- nism of concretion formation, Am. J. Sci., 285, 865–903,
solved organic and inorganic carbon flow paths in an https://doi.org/10.2475/ajs.285.10.865, 1985.
Amazonian transitional forest, Front. Mar. Sci., 3, 114, Torn, M. S., Trumbore, S. E., Chadwick, O. A., Vitousek,
https://doi.org/10.3389/fmars.2016.00114, 2016. P. M., and Hendricks, D. M.: Mineral control of soil or-
Osburn, C. L., Oviedo-Vargas, D., Barnett, E., Dierick, D., ganic carbon storage and turnover, Nature, 389, 170–173,
Oberbauer, S. F., and Genereux, D. P.: Regional groundwa- https://doi.org/10.1038/38260, 1997.
ter and storms are hydrologic controls on the quality and van der Voort, T. S., Mannu, U., Hagedorn, F., McIntyre, C.,
export of dissolved organic matter in two tropical rainforest Walthert, L., Schleppi, P., Haghipour, N., and Eglinton, T. I.:
streams, Costa Rica, J. Geophys. Res.-Biogeo., 123, 850–866, Dynamics of deep soil carbon – insights from 14 C time se-
https://doi.org/10.1002/2017JG003960, 2018. ries across a climatic gradient, Biogeosciences, 16, 3233–3246,
Patel-Sorrentino, N., Lucas, Y., Eyrolles, F., and Melfi, A. J.: Fe, https://doi.org/10.5194/bg-16-3233-2019, 2019.
Al and Si species and organic matter leached off a ferrallitic Wan, J., Tokunaga, T. K., Dong, W., Williams, K. H., Kim, Y.,
and podzolic soil system from Central Amazonia, Geoderma, Conrad, M. E., Bill, M., Riley, W. J., and Hubbard, S. S.:
137, 444–454, https://doi.org/10.1016/j.geoderma.2006.10.002, Deep unsaturated zone contributions to carbon cycling in semi-
2007. arid environments, J. Geophys. Res.-Biogeo., 123, 3045–3054,
https://doi.org/10.1029/2018JG004669, 2018.
SOIL, 7, 585–594, 2021 https://doi.org/10.5194/soil-7-585-2021You can also read