Measurement report: Emissions of intermediate-volatility organic compounds from vehicles under real-world driving conditions in an urban tunnel
←
→
Page content transcription
If your browser does not render page correctly, please read the page content below
Atmos. Chem. Phys., 21, 10005–10013, 2021
https://doi.org/10.5194/acp-21-10005-2021
© Author(s) 2021. This work is distributed under
the Creative Commons Attribution 4.0 License.

Measurement report: Emissions of intermediate-volatility organic
compounds from vehicles under real-world driving conditions in an
urban tunnel
Hua Fang1,2,4 , Xiaoqing Huang1,2,4 , Yanli Zhang1,2,3 , Chenglei Pei1,4,5 , Zuzhao Huang6 , Yujun Wang5 ,
Yanning Chen5 , Jianhong Yan7 , Jianqiang Zeng1,2,4 , Shaoxuan Xiao1,2,4 , Shilu Luo1,2,4 , Sheng Li1,2,4 , Jun Wang1,2,4 ,
Ming Zhu1,2,4 , Xuewei Fu1,2,4 , Zhenfeng Wu1,2,4 , Runqi Zhang1,2,4 , Wei Song1,2 , Guohua Zhang1,2 , Weiwei Hu1,2 ,
Mingjin Tang1,2 , Xiang Ding1,2 , Xinhui Bi1,2 , and Xinming Wang1,2,3,4
1 StateKey Laboratory of Organic Geochemistry and Guangdong Key Laboratory of Environmental Protection and Resources
Utilization, Guangzhou Institute of Geochemistry, Chinese Academy of Sciences, Guangzhou 510640, China
2 CAS Center for Excellence in Deep Earth Science, Guangzhou 510640, China
3 Center for Excellence in Urban Atmospheric Environment, Institute of Urban Environment,

Chinese Academy of Sciences, Xiamen 361021, China
4 School of Resources and Environment, University of Chinese Academy of Sciences, Beijing 100049, China
5 Guangzhou Ecological and Environmental Monitoring Center of Guangdong Province, Guangzhou 510060, China
6 Guangzhou Environmental Technology Center, Guangzhou 510180, China
7 Guangzhou Tunnel Development Company, Guangzhou 510133, China

Correspondence: Xinming Wang (wangxm@gig.ac.cn) and Yanli Zhang (zhang_yl86@gig.ac.cn)

Received: 9 March 2021 – Discussion started: 26 March 2021
Revised: 8 June 2021 – Accepted: 10 June 2021 – Published: 6 July 2021

Abstract. Intermediate-volatility organic compounds              non-methane hydrocarbons (NMHCs) as results from previ-
(IVOCs) emitted from vehicles are important precursors to        ous chassis dynamometer tests. Estimated SOA production
secondary organic aerosols (SOAs) in urban areas, yet ve-        from the vehicular IVOCs and VOCs surpassed the POA
hicular emission of IVOCs, particularly from on-road fleets,     by a factor of ∼ 2.4, and IVOCs dominated over VOCs in
is poorly understood. Here we initiated a field campaign to      estimated SOA production by a factor of ∼ 7, suggesting
collect IVOCs with sorption tubes at both the inlet and the      that controlling IVOCs is of greater importance to modulate
outlet in a busy urban tunnel (> 30 000 vehicles per day)        traffic-related organic aerosol (OA) in urban areas. The
in south China for characterizing emissions of IVOCs from        results demonstrated that although on-road gasoline vehicles
on-road vehicles. The average emission factor of IVOCs           have much lower EFIVOCs , they contribute more IVOCs
(EFIVOCs ) was measured to be 16.77 ± 0.89 mg km−1 (aver-        than on-road diesel vehicles due to its dominance in the
age ±95 % CI, confidence interval) for diesel and gasoline       on-road fleets. However, due to greater diesel than gasoline
vehicles in the fleets, and based on linear regression, the      fuel consumption in China, emission of IVOCs from diesel
average EFIVOCs was derived to be 62.79 ± 18.37 mg km−1          engines would be much larger than that from gasoline
for diesel vehicles and 13.95 ± 1.13 mg km−1 for gasoline        engines, signaling the overwhelming contribution of IVOC
vehicles. The EFIVOCs for diesel vehicles from this study        emissions by non-road diesel engines in China.
was comparable to that reported previously for non-road
engines without after-treatment facilities, while the EFIVOCs
for gasoline vehicles from this study was much higher
than that recently tested for a China V gasoline vehicle.
IVOCs from the on-road fleets did not show significant
correlation with the primary organic aerosol (POA) or total

Published by Copernicus Publications on behalf of the European Geosciences Union.
10006                                H. Fang et al.: Emissions of IVOCs from vehicles under real-world driving conditions

1   Introduction                                                    et al., 2014; Zhang et al., 2016, 2017, 2018). However, to the
                                                                    best of our knowledge, until present no reports are available
Intermediate-volatility organic compounds (IVOCs) refer to          about vehicular emission factors of IVOCs through tunnel
organics with effective saturated concentrations ranging from       tests.
103 to 106 µg m−3 , roughly corresponding to the volatility            In China, the number of on-road vehicles reached
range of C12 –C22 normal alkanes (n-alkanes) (Donahue et            348 million in 2019, which is more than double that in
al., 2006; Zhao et al., 2014). Robinson et al. (2007) have          2009 (http://www.mee.gov.cn/hjzl/sthjzk/ydyhjgl/, last ac-
demonstrated that IVOCs, as the missing secondary organic           cess: 1 July 2021). However, emissions of IVOCs from mo-
aerosol (SOA) precursors in many model studies, could ef-           bile sources in China are very understudied. Only very re-
ficiently narrow the gap between model-predicted and field-         cently, Tang et al. (2021) tested emissions of IVOCs from
observed SOA. Smog chamber studies involving individual             a China V light-duty gasoline vehicle. As IVOC emission
IVOC species, like higher n-alkanes and two-ring aromat-            factors derived from vehicle tests in the US have been used
ics, have confirmed their significantly higher SOA forma-           to update China’s emission inventories with the inclusion of
tion potentials (Chan et al., 2009; Presto et al., 2010; Liu        IVOCs (Liu et al., 2017), it is unknown whether the borrowed
et al., 2015). In addition, recent model simulations including      emission factors could well reflect the vehicular emissions
IVOCs as SOA precursors revealed that 30 %–80 % of am-              of IVOCs in China. On the other hand, although China has
bient SOA could be explained by IVOCs (Ots et al., 2016;            made great achievements in combating air pollution in re-
Zhao et al., 2016; Yang et al., 2019; Lu et al., 2020; Huang        cent years, fine particle pollution is still an air quality prob-
et al., 2020). However, due to a lack of direct measurements,       lem in many of China’s cities (Wang et al., 2020). As organic
these model simulations used the ratios of IVOCs to other           matter is often the most abundant component in PM2.5 , and
species like primary organic aerosol (POA) or non-methane           SOA pollution is increasingly standing out with the intensi-
hydrocarbons (NMHCs) to estimate IVOC emissions.                    fied primary emission control (Guo et al., 2020), understand-
   Vehicular emission is an important anthropogenic source          ing IVOC emissions from on-road vehicles is of great impor-
of IVOCs especially in urban environments (Tkacik et al.,           tance given that vehicle-emitted IVOCs contribute greatly to
2014; Jathar et al., 2014; Cross et al., 2015; Zhao et al., 2015,   urban SOA formation (Gentner et al., 2012; Wu et al., 2019;
2016; Ots et al., 2016). IVOCs could account for ∼ 60 % of          Huang et al., 2020).
non-methane hydrocarbons (NMHCs) from diesel vehicles                  In this study, the emissions of IVOCs from on-road vehi-
and 4 %–17 % from gasoline vehicles, explaining a dominant          cles under real-world driving conditions were characterized
portion of estimated SOA mass from diesel and gasoline ex-          through tests in an urban tunnel in Guangzhou, which is a
haust (Zhao et al., 2015, 2016). Previous chamber simula-           megacity in southern China. The study aims to (1) inves-
tions on SOA formation from vehicle exhaust revealed that           tigate chemical compositions and volatility of IVOCs from
traditional volatile organic compounds (VOCs) could not ex-         on-road driving vehicles; (2) obtain average IVOC emission
plain the formed SOA, and IVOCs instead might dominate              factors for the on-road fleet based on tests in the tunnel;
the SOA production (Deng et al., 2020; Zhang et al., 2020).         (3) retrieve average IVOC emission factors for gasoline- and
In megacities like London, diesel-emitted IVOCs alone could         diesel-fueled vehicles by regression analysis, taking advan-
contribute ∼ 30 % SOA formed in ambient air (Ots et al.,            tage of a large number of vehicles (> 30 000 per day) pass-
2016). Therefore, for the control of fine particle pollution in     ing the tunnel; and (4) compare the SOA formation potential
urban areas, it is necessary to compile and upgrade emission        of vehicle-emitted IVOCs to that of vehicle-emitted VOCs
inventories for IVOCs, and more work is needed to charac-           measured in the same campaign.
terize their emissions from on-road vehicles.
   Although previous chassis dynamometer tests used limited
numbers of vehicles to characterize IVOC emissions (Zhao et         2     Methodology
al., 2015, 2016; Tang et al., 2021), the results obtained from
the tests were widely applied to recent models and emis-            2.1    Field sampling
sion inventories (Liu et al., 2017; Lu et al., 2018; Wu et al.,
2019; Huang et al., 2020). However, driving conditions sig-         The sampling campaign was concurrently conducted at both
nificantly influence vehicular IVOC emissions (Drozd et al.,        the inlet and at the outlet of the Zhujiang tunnel (23◦ 60 N,
2018; Tang et al., 2021); therefore, emissions of IVOCs un-         113◦ 140 E), which is located in urban Guangzhou, southern
der real-world driving conditions may be quite different from       China (Fig. S1), on three weekdays (14–16 October 2019)
that measured with chassis dynamometers. The tunnel test is         and two weekend days (13 and 19 October 2019). A de-
a widely used method to characterize vehicle emissions in           tailed description of the Zhujiang tunnel can be found in
light of its advantage in capturing real-world emissions with       our previous studies (Liu et al., 2014; Zhang et al., 2016,
a large number of driving vehicles. The emissions of PM2.5 ,        2017, 2018). IVOCs were collected by a sorption tube (Tenax
carbonaceous aerosols, VOCs, NOx , and NH3 from on-road             TA/Carbograph 5TD, Marks International Ltd., UK) using an
vehicles have been widely studied based on tunnel tests (Liu        automatic sampler (JEC921, Jectec Science and Technology,

Atmos. Chem. Phys., 21, 10005–10013, 2021                                           https://doi.org/10.5194/acp-21-10005-2021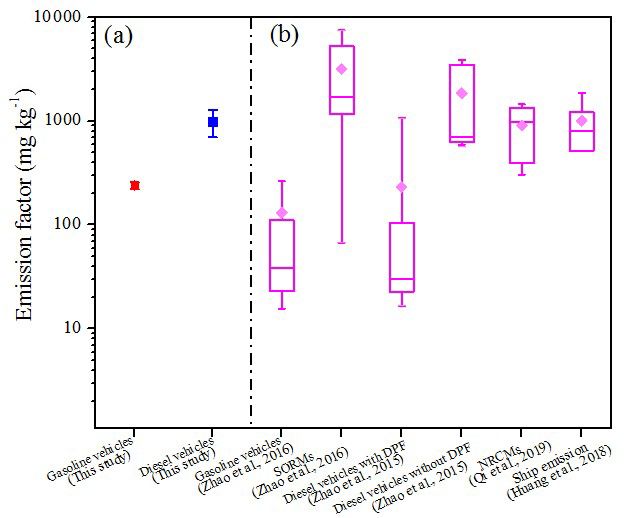
H. Fang et al.: Emissions of IVOCs from vehicles under real-world driving conditions                                        10007

Co., Ltd., Beijing, China). A Teflon filter was installed be-      termined by the difference between the total IVOCs and spe-
fore the tube to remove particles in the air flow. The sam-        ciated IVOCs in each bin. The UCM-IVOCs were further
pling flow rate was set at 0.6 L min−1 , and hourly samples        classified into unspeciated branch alkanes (b-alkanes) and
were collected from 05:00 to 24:00 LT on each sampling day.        cyclic compounds (Zhao et al., 2014) (Sect. S1). The anal-
In order to compare SOA production from IVOCs and VOCs,            ysis of VOCs can be found elsewhere (Zhang et al., 2018).
hourly VOC samples were collected on 13 October 2019 with          The POA emission was estimated as 1.2 times that of organic
stainless-steel canisters at a flow rate of 66.7 mL min−1 using    carbon that was measured in quartz filter samples (Zhao et
a model 910 pressurized canister sampler (Xonteck, Inc., CA,       al., 2015), which were analyzed by an OC/EC analyzer (DRI
USA). Two-hour quartz filter samples were also collected by        model 2015, Nevada, USA) (Li et al., 2018).
a high-volume PM2.5 sampler (Thermo Electron, Inc., USA)
at the outlet and inlet sampling sites from 13 to 19 Octo-         2.3    Quality assurance and quality control (QA/QC)
ber. Trace gases were measured by online analyzers (CO,
model 48i, Thermo Electron Inc., USA; NOx , model 42i,             Before their use for field sampling, sorption tubes were con-
Thermo Electron Inc., USA). A video camera was installed at        ditioned at 320 ◦ C for 2 h in an oxygen-free nitrogen flow
the inlet to record the vehicle flow during the campaign. Af-      and then sealed at both ends with brass storage caps fitted
ter sampling, the video data were used to count the passing        with PTFE ferrules. About 15 % of conditioned tubes were
vehicles and classify vehicles into different fuel types.          selected randomly to be analyzed in the same way as nor-
                                                                   mal samples to check if any targeted species existed in the
                                                                   tubes. The batch of sorption tubes were certified as clean if
2.2   Laboratory analysis
                                                                   speciated IVOCs were not found or presented in levels below
Sampled sorption tubes were analyzed by a thermal desorp-          the method detection limits (MDLs). Before and after sam-
tion (TD) system (TD-100, Markes International Ltd., UK)           pling, the flow rates of samplers were calibrated by a soap-
coupled to a gas chromatography and mass selective detec-          membrane flowmeter (Gilian Gilibrator-2, Sensidyne, USA).
tor (GC/MSD; 7890 GC/5975 MSD, Agilent Technologies,               During the sampling, 10 field blanks (five at the inlet and
USA) with a capillary column (HP-5MS, 30 m × 0.25 mm ×             five at the outlet) were collected by installing a sorption tube
0.25 µm, Agilent Technologies, USA). Deuterated standards          onto the sampler each day but with pump off at both the in-
(C12 -d26 , C16 -d34 , C20 -d42 , naphthalene-d8 , acenaphthene-   let and the outlet. The speciated IVOCs were not detected or
d10 , and phenanthrene-d10 ) were injected into the sorption       presented in levels below their MDLs in the blanks. MDLs
tubes to determine their recoveries before analysis. The sam-      for all the speciated IVOCs, including n-alkanes and poly-
pled sorption tubes and field blanks were thermally desorbed       cyclic aromatic hydrocarbons (PAHs), were below 8 ng m−3 ,
at 320 ◦ C for 20 min, and the desorbed compounds were car-        such as 5.8 ng m−3 for n-C12 , 5.9 ng m−3 for n-C16 , and
ried by high-purity helium into a cryogenic trap at −10 ◦ C;       4.7 ng m−3 for n-C22 . To check if any breakthrough occurred
then the trap was rapidly heated to transfer them into the         during the sampling, prior to the field campaign two sorption
GC/MSD system. The initial temperature of the GC oven              tubes were connected in series to sample at the tunnel outlet
was set at 65 ◦ C, held for 2 min, then increased to 290 ◦ C       station in the same way. IVOCs detected in the second tube
at 5 ◦ C min−1 , and kept at 290 ◦ C for 20 min. The MSD was       only accounted for 2.6 ± 1.4 % of the total in the two tubes,
used in the SCAN mode with an electron impacting ioniza-           indicating negligible breakthrough during the sampling. To
tion at 70 eV.                                                     check the recoveries during thermodesorption, selected sam-
   Individual speciated IVOCs were quantified with the cali-       pled sorption tubes were analyzed twice by the TD-GC/MS
bration curves by using authentic standards. The total IVOC        system, and the desorption recoveries, calculated as the per-
mass was determined using the approach developed by Zhao           centage of IVOCs in first analysis, were 96.7±3.2 % on aver-
et al. (2014, 2015, 2016), and a detailed description is pro-      age. Duplicated samples revealed less than 15 % differences
vided in the Supplement (Sect. S1). Briefly, the total ion         for all the speciated IVOCs.
chromatogram (TIC) of IVOCs was divided into 11 bins               2.4    Calculation of IVOC emission factors
based on the retention times of C12 –C22 n-alkanes. Each bin
centered on the retention time of an n-alkane. The start time      The vehicular EF of IVOCs can be calculated by the follow-
and end times of the bin were determined by the average re-        ing equation (Pierson and Brachaczek, 1983; Zhang et al.,
tention time of two successive n-alkanes. For example, the         2016, 2017, 2018):
start time of bin 16 (B16) was calculated as the average re-
                                                                          1C × Vair × T × A
tention time of n-C15 and n-C16 , and the end time of B16          EF =                     ,                                  (1)
as the average retention time of n-C16 and n-C17 . The IVOC                    N ×l
mass in each bin was quantified by the response factor of n-       where EF (mg km−1 veh.−1 ) is the fleet-average emission
alkane in the same bin. The total IVOC mass was the sum of         factor of a given species during the time interval T (1 h in
IVOC masses determined in the 11 bins. The mass of unre-           this study); 1C (mg m−3 ) is the inlet–outlet incremental con-
solved complex mixtures of IVOCs (UCM-IVOCs) was de-               centration of IVOCs; Vair (m s−1 ) is wind speed parallel to

https://doi.org/10.5194/acp-21-10005-2021                                        Atmos. Chem. Phys., 21, 10005–10013, 2021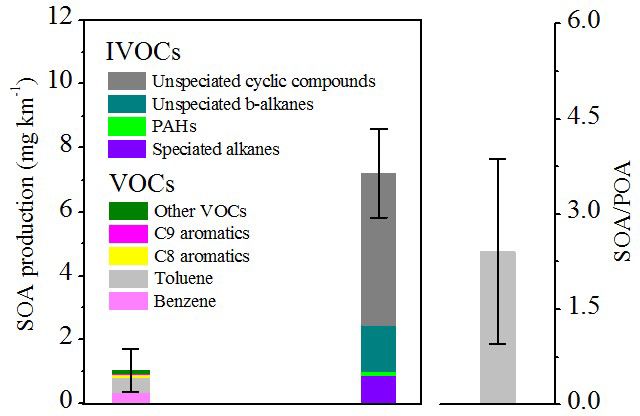
10008                                 H. Fang et al.: Emissions of IVOCs from vehicles under real-world driving conditions

Figure 1. Diurnal variations of vehicle fleets and fleet-average
EFIVOCs during the sampling period. Error bars represent 95 % con-
fidence intervals.

the tunnel measured by a 3-D sonic anemometer (Campbell,
Inc.); A (m2 ) is the cross-sectional area of the tunnel; N is
the number of vehicles traveling through the tunnel during
the time interval T ; and l (km) is the distance between the         Figure 2. Comparison of the EFIVOCs measured in this study with
outlet and the inlet.                                                that previously measured for fossil fuel combustion sources. The er-
                                                                     ror bars in (a) represent 95 % confidence interval. In (b), the boxes
                                                                     represent the 75th and 25th percentiles, the centerlines are the me-
                                                                     dians, and squares are the averages. The whiskers represent the 10th
3     Results and discussion
                                                                     and 90th percentiles. SORMs refer to small off-road machines fu-
                                                                     eled with gasoline. NRCMs represent non-road construction ma-
3.1    Emission factors and compositions of IVOCs
                                                                     chines fueled with diesel.
Figure 1 shows diurnal variations of vehicle numbers and ve-
hicular IVOC emission factors (EFIVOCs ) during the cam-
paign. Traffic flow in the tunnel varied between 571 and                The mileage-based EF can be converted to fuel-based
2263 vehicles per hour during the campaign, and gasoline             EF with the fuel density and fuel efficiency (Sect. S2)
vehicles (GVs) dominated the vehicle fleets with a share of          (Zhang et al., 2016). Thus, we could obtain an average fuel-
76.3 % on average; diesel vehicles (DVs) only accounted              based EFIVOCs of 239.5±19.5 mg kg−1 for GVs and 984.9±
for 4.0 %, and other types of vehicles, including lique-             288.2 mg kg−1 for DVs. Zhao et al. (2015, 2016) measured
fied petroleum gas vehicles (LPGVs) and electrical vehi-             IVOC emissions from DVs and GVs in the US by dy-
cles (EVs), had an average percentage of 18.7 % (Fig. S2).           namometer tests. As shown in Fig. 2, the average EFIVOCs for
As LPGVs and EVs are considered to have no IVOC emis-                DVs measured in our study was significantly lower than that
sions (Stewart et al., 2021), only GVs and DVs are re-               for DVs without any diesel particulate filter (DPF) in the US
sponsible for the inlet–outlet incremental concentrations of         but over 4 times higher than that with DPF. It is worth noting
IVOCs. Based on the above Eq. (1), fleet-average EFIVOCs             that the EFIVOCs for DVs from this study was comparable to
(GVs + DVs) ranged from 13.29 ± 5.08 mg km−1 veh.−1 to               that for ships and non-road construction machines (NRCMs)
21.40 ± 5.01 mg km−1 veh.−1 , with an average of 16.77 ±             with diesel-fueled engines in China (Fig. 2) (Huang et al.,
0.89 mg km−1 veh.−1 (average ±95 % CI, confidence inter-             2018; Qi et al., 2019). As a matter of fact, China III or lower
val) (Fig. 1). The average EFIVOCs for DVs and GVs could             emission standard DVs accounted for ∼ 40 % of China’s to-
be further derived through linear regression as below (Ho et         tal in-use DVs in 2019 (http://www.mee.gov.cn/xxgk2018/
al., 2007; Kramer et al., 2020):                                     xxgk/xxgk13/202012/t20201201_810776.html, last access:
                                                                     1 July 2021), and like the non-road engines, they are not
EFIVOCs = EFDV × α + EFGV × (1 − α) ,                         (2)    equipped with any after-treatment facilities. Although the
                                                                     after-treatment systems are installed in the China IV and
where EFIVOCs represents the fleet-average emission fac-             China V DVs, their working performance might be not so
tor measured during a time interval; EFDV and EFGV are               satisfactory (Wu et al., 2017). This may explain why the
the average EFIVOCs for DVs and GVs, respectively; and               DVs in this study had IVOC EFs comparable to non-road
α is the fraction of DVs in the total IVOC-emitting DVs              engines. The EFIVOCs for GVs from this study fell into the
and GVs traveling through the tunnel. Based on the re-               ranges of that for GVs in the US but was at the high end of
gression results (Fig. S3), the average EFIVOCs for DVs              the tested values (Fig. 2). A recent study revealed a signif-
(62.79 ± 18.37 mg km−1 veh.−1 ) was ∼ 4.5 times that for             icantly lower EFIVOCs of 83.7 mg kg−1 for a China V gaso-
GVs (13.95 ± 1.13 mg km−1 veh.−1 ).                                  line vehicle (Tang et al., 2021), implying that upgrading the

Atmos. Chem. Phys., 21, 10005–10013, 2021                                             https://doi.org/10.5194/acp-21-10005-2021
H. Fang et al.: Emissions of IVOCs from vehicles under real-world driving conditions 10009
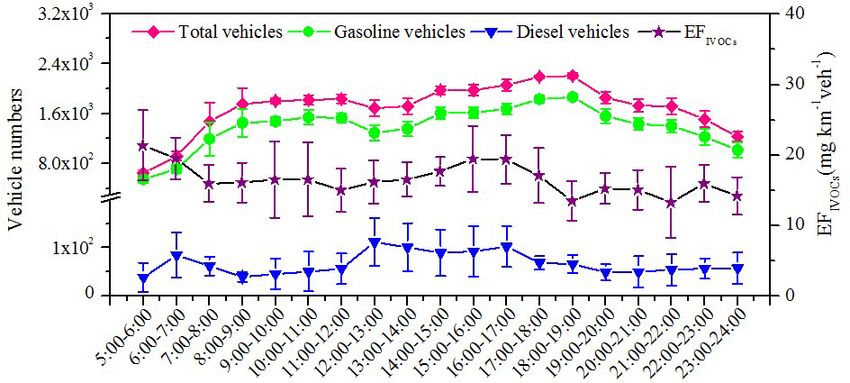
Figure 3. The average emission factor of vehicular IVOCs in dif-
ferent bins measured during the campaign.
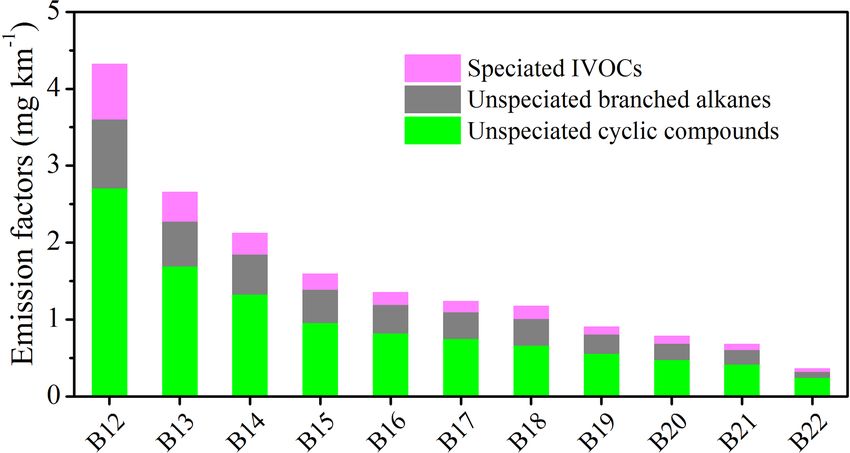
Figure 4. The predicted SOA formation potentials from different
classes of precursors (VOC and IVOCs). The error bars represent
95 % confidence intervals.
emission standard could help reduce emissions of IVOCs
from GVs, as China IV and China III GVs still share a these ratios, as the results here were obtained for a fleet dom-
much larger portion than the China V and China VI ones inated by GVs.
in China’s on-road fleets (http://www.mee.gov.cn/hjzl/sthjzk/
ydyhjgl/201909/P020190905586230826402.pdf, last access: 3.2 Relationships between IVOCs and other species
1 July 2021).
Figure 3 shows the EFs and compositions of the vehicu- Emissions of IVOCs from vehicles are often estimated by
lar IVOCs in each retention-time-based bin (Table S1). Sim- assuming a ratio of IVOCs to other species such as POA
ilar to previous studies (Zhao et al., 2015, 2016; Huang et or NMHCs (Shrivastava et al., 2008; Pye and Seinfeld,
al., 2018; Qi et al., 2019; Tang et al., 2021), the unspeci- 2010; Gentner et al., 2012; Murphy et al., 2017; Wu et
ated cyclic compounds dominated the IVOCs, accounting for al., 2019). However, these ratios might be highly variable
59.07 ± 1.06 %, followed by unspeciated b-alkanes (25.27 ± with fuel types, operation conditions, and engine perfor-
0.75 %) and speciated IVOCs (15.66 ± 0.60 %). Among the mance (Lu et al., 2018). As demonstrated in Fig. S6a and
speciated IVOCs (Table S1), naphthalene dominated the b, IVOCs correlated well with NOx (R = 0.63, p < 0.05)
quantified PAHs, accounting for 56.82±1.21 % of total PAH and CO (R = 0.58, p < 0.05), with an average IVOC-to-
emissions. The distribution of IVOCs in retention-time-based NOx ratio of 0.039 ± 0.004 and an average IVOC-to-CO
bins presented a significant decreasing trend with bin num- ratio of 0.033 ± 0.015. The measured IVOC-to-POA ratio
bers. Previous studies have reported that more than 50 % of was 3.35 ± 1.79 (Fig. S6c), which is comparable to that of
IVOCs concentrated in higher-volatility bins like B12, B13, 3.0±0.9 for GVs previously measured in dynamometer tests
and B14 in gasoline exhaust, while much broader volatility simulating arterial and freeway cycles but much higher than
distributions were found in diesel exhaust (Zhao et al., 2015, that of 1.5 previously used for estimating vehicle emissions
2016; Tang et al., 2021). The IVOCs in B12 measured in in models (Robinson et al., 2007; Hodzic et al., 2010). As
this study was also the most abundant as the GVs previously shown in Fig. S6d, the average IVOC-to-NMHC ratio mea-
tested in the US (Fig. S4). This was reasonable since the GVs sured in this study was 0.36 ± 0.09, which is lower than that
dominated the vehicle fleets during our tunnel experiments previously measured for diesel vehicle exhaust (0.6 ± 0.1)
(Fig. S2). As shown in Fig. S5, the IVOCs determined in (Zhao et al., 2015) but higher than that previously measured
each volatility bin well correlated with those in the volatility for gasoline vehicle exhaust (< 0.2) (Zhao et al., 2016; Tang
bins close to them, and the total IVOCs have stronger cor- et al., 2021). It is worth noting that the IVOCs did not present
relations with IVOCs in the higher-volatility bins like B12, significant correlations with POA or NMHCs from this study
B13, and B14. In addition, the n-alkanes, as displayed in Ta- for on-road vehicle fleets (Fig. S6c and d). This would cast
ble S2, were found to be significantly correlated to the total uncertainty over the emission estimates of IVOCs based on
IVOCs that determined in the same volatility bins except for their ratios to POA or NMHCs.
B20 and n-C20 . The mass ratios of IVOCs to the n-alkane
3.3 Estimated SOA production from IVOCs
in the bins ranged from 9.0 to 15.8 (Table S2). As n-alkanes
can be more easily and routinely quantified, the relationships SOA formation potentials of IVOCs from the on-road vehicle
of IVOCs and n-alkanes in each volatility bin might be used fleet as measured in this tunnel study can be estimated as
to estimate total IVOCs from on-road vehicles. However, ve- X
hicles types should be taken into consideration when using SOAFP = EFi × Yi , (3)
https://doi.org/10.5194/acp-21-10005-2021 Atmos. Chem. Phys., 21, 10005–10013, 202110010 H. Fang et al.: Emissions of IVOCs from vehicles under real-world driving conditions
where SOAFP is the SOA formation potential from the 2017). Similar to previous smog chamber simulation results
gaseous precursors; EFi represents the emission factor of about SOA formed from photochemical aging of vehicle ex-
precursor i; and Yi is the SOA yield of precursor i un- haust (Deng et al., 2020; Zhang et al., 2020), our tunnel test
der high NOx at OA concentration of 20 µg m−3 (Zhao et also demonstrated that estimated SOA surpassed the POA
al., 2015; Huang et al., 2018; Qi et al., 2019; Tang et emission. In addition, IVOCs were found to dominate over
al., 2021) (Table S3). As shown in Fig. 4, the SOA for- traditional VOCs in SOA formation potentials by a factor
mation potentials from vehicular VOCs and IVOCs totaled of ∼ 7, implying that reducing vehicle-emitted IVOCs is of
8.24 ± 0.68 mg km−1 . The SOA-to-POA ratio was 2.41 ± greater importance to modulate SOA for further reducing fine
1.45, which was comparable to that of GVs tested in China particle pollution particularly in urban areas. As for the ratios
(1.8–4.4) (Tang et al., 2021) and that of GVs (3.6) (Zhao et of IVOCs to other primary species, our tunnel tests for the on-
al., 2016) and high-speed DVs (3.2±1.7) without DPF in the road fleet revealed that, although the ratios of IVOC to POA
US (Zhao et al., 2015). Our previous chamber studies sim- and IVOC to NMHC were comparable to those from previ-
ulating SOA formation from vehicle exhausts revealed the ous chassis dynamometer tests, no significant positive corre-
SOA-to-POA ratios of 2.0 for DVs and 3.8 for GVs when lations were found between IVOCs and POA or NMHCs in
cruising at 40 km h−1 (Deng et al., 2020; Zhang et al., 2020), our tunnel measurements. This implied that caution should
which is near the average driving speed of vehicles in the be taken when applying the ratios from chassis dynamome-
tunnel. Among the vehicle-emitted SOA precursors, similar ter tests to estimate real-world traffic emissions or applying
to previous studies (Zhao et al., 2015, 2016; Huang et al., the ratios in the US to estimate the emissions in China or
2018; Qi et al., 2019; Tang et al., 2021), IVOCs produced other regions. As IVOCs are not considered in normal vehi-
significantly higher SOA (7.19 ± 0.62 mg km−1 ), which is cle emission tests, more field work characterizing real-world
∼ 7 times that from traditional VOCs (1.04±0.30 mg km−1 ). vehicular emissions of IVOCs is needed to further constrain
Previous smog chamber studies found that SOA formed dur- these ratios.
ing photochemical aging of vehicle exhaust could not be ex- EFIVOCs for the GV-dominated fleets from our tunnel
plained by traditional VOCs, especially for vehicles cruising test or EFIVOCs for GVs derived from regression was much
at higher speeds (Robinson et al., 2007; Deng et al., 2020; higher than that from a recent chassis test for a China V gaso-
Zhang et al., 2020). If this SOAIVOCs -to-SOAVOCs ratio of line vehicle (Tang et al., 2021), suggesting that stricter emis-
7 from this study is used to re-estimate the SOA formation sion standards might help reduce emissions of IVOCs from
from exhaust for vehicles cruising at 40 km h−1 in our previ- GVs. Meanwhile, the EFIVOCs for on-road DVs was compa-
ous chamber studies (Deng et al., 2020; Zhang et al., 2020), rable to that for non-road engines without any after-treatment
the VOC plus IVOC precursors could explain 91 %–98 % devices (Huang et al., 2018; Qi et al., 2019), suggesting that
SOA formed for GVs and 31.2 %–48.2 % SOA formed for facilitating the installation of after-treatment devices with
DVs. Zhao et al. (2015, 2016) reported significantly higher stricter emission standards or improving the performance
SOAIVOCs -to-SOAVOCs ratios for diesel vehicle exhaust than of existing after-treatment devices is crucial to lower IVOC
gasoline vehicle exhaust. Furthermore, we also resolved the emissions from DVs, which have much higher EFIVOCs than
SOAIVOCs -to-SOAVOCs ratios for DVs and GVs via liner GVs.
regression (Sect. S3). As shown in Fig. S7, although the Based on the regression-derived average EFIVOCs for GVs
correlation between SOAIVOCs -to-SOAVOCs ratios and DV and DVs and the camera-recorded fleet compositions, we
fractions was not significant, the DVs did present a much could estimate that ∼ 81 % of IVOCs by vehicles travel-
higher average SOAIVOCs -to-SOAVOCs ratio (54.9) than that ing through the tunnel were coming from GVs and only
of GVs (6.82). Thus, SOAIVOCs -to-SOAVOCs ratio of 7 ob- ∼ 19 % were from DVs (Table S4). This is reasonable since
tained from this study in a tunnel dominated by GVs would DVs have higher EFIVOCs but much lower proportions in
underestimate SOAIVOCs from DVs, consistent with higher the fleets. These percentages may underestimate the con-
NMHCs to IVOCs ratios in gasoline exhaust than in diesel tribution to IVOCs by on-road DVs at regional or national
exhaust (Zhao et al., 2015, 2016; Huang et al., 2018; Qi et scales since DVs travel less in core urban areas due to
al., 2019; Tang et al., 2021). Overall, the observed vehicu- traffic restriction rules in China. Differently, in an updated
lar IVOCs as SOA precursors can help achieve mass closure emission inventory of vehicular IVOCs in China (Liu et
between predicted and measured SOA. al., 2017) based on EFIVOCs tested in the US, emissions
of IVOCs from DVs (145.07 Gg) were about 2.6 times that
from GVs (55.30 Gg) in China in 2015. However, the ra-
4 Conclusions and implications tio of DV EFIVOCs to GV EFIVOCs used in the study (Liu
et al., 2017) on average was much higher than that of ∼ 4.5
Organic aerosol (OA), primary or secondary, accounts for a from this study for on-road vehicles. Using the EFIVOCs from
large fraction of particle matter (Zhang et al., 2007; Jimenez tests in the US might underestimate IVOC emissions from
et al., 2009). On-road vehicles could be an important source GVs but overestimate those from DVs in China. As an ex-
of OA especially in urban environments (Gentner et al., ample, EFIVOCs of 83.7 mg kg−1 reported very recently for a
Atmos. Chem. Phys., 21, 10005–10013, 2021 https://doi.org/10.5194/acp-21-10005-2021H. Fang et al.: Emissions of IVOCs from vehicles under real-world driving conditions 10011
China V gasoline vehicle (Tang et al., 2021) was still much Guangdong Province and the Guangzhou Tunnel Development
higher than the maximum EFIVOCs (47.15 mg kg−1 ) they Company for their support during the tunnel experiment.
adopted for China V GVs, and the EFIVOCs used for China III
and China IV DVs were however significantly larger than Financial support. This work has been funded by the Natural Sci-
those from our tunnel tests (Fig. 2) for on-road DVs (mostly ence Foundation of China (grant nos. 41961144029 and 42022023),
China III and China IV) (Liu et al., 2017). In 2019 the gaso- the Chinese Academy of Sciences (grant nos. QYZDJ-SSW-
line and diesel fuel consumptions in China were 1.20 × 10² DQC032, XDA23010303, and XDA23020301), the Youth Innova-
and 1.50×10² Tg, respectively (http://www.mee.gov.cn/hjzl/ tion Promotion Association, CAS (grant no. 2017406), the Hong
sthjzk/ydyhjgl/, last access: 1 July 2021). Since gasoline is Kong Theme-base project (grant no. T24-504/17-N), and the De-
mostly used for on-road vehicles, diesel may be used for partment of Science and Technology of Guangdong Province (grant
both on-road and non-road engines, and EFIVOCs for on-road nos. 2020B1212060053, 2017BT01Z134, and 2019B121205006).
diesel vehicles is comparable to that for non-road diesel en-
gines (Huang et al., 2018; Qi et al., 2019), we could use Review statement. This paper was edited by Jianzhong Ma and re-
the fuel-based EFIVOCs converted from our study to roughly viewed by two anonymous referees.
estimate IVOCs from diesel and gasoline combustion. This
way, the estimated emission of IVOCs from diesel engines
(147.74 Gg) was about 5 times that from gasoline engines
References
(28.74 Gg) in China in 2019 (Table S4). In comparison to
a previous study (Liu et al., 2017), this result implies large Chan, A. W. H., Kautzman, K. E., Chhabra, P. S., Surratt, J. D.,
uncertainties or even inconsistencies about China’s vehicular Chan, M. N., Crounse, J. D., Kürten, A., Wennberg, P. O.,
IVOC emission estimates. Moreover, as diesel vehicles share Flagan, R. C., and Seinfeld, J. H.: Secondary organic aerosol
less than 10 % among China’s motor vehicles, and a sub- formation from photooxidation of naphthalene and alkylnaph-
stantial part of diesel fuel is consumed by non-road engines, thalenes: implications for oxidation of intermediate volatility or-
the diesel-related IVOCs may largely come overwhelmingly ganic compounds (IVOCs), Atmos. Chem. Phys., 9, 3049–3060,
from non-road engines instead of on-road DVs, signaling the https://doi.org/10.5194/acp-9-3049-2009, 2009.
increasingly important role of non-road engines as sources Cross, E. S., Sappok, A., Wong, V., and Kroll, J. H.: Load-
dependent emission factors and chemical characteristics of
of IVOCs with the progress in on-road vehicular emission
IVOCs from a medium-duty diesel engine, Environ. Sci. Tech-
control.
nol., 49, 13483–13491, https://doi.org/10.1021/acs.est.5b03954,
2015.
Deng, W., Fang, Z., Wang, Z. Y., Zhu, M., Zhang, Y. L., Tang, M. J.,
Data availability. The dataset for this paper is available Song, W., Lowther, S., Huang, Z. H., Jones, K., Peng, P. A., and
upon request from the corresponding author Xinming Wang Wang, X. M.: Primary emissions and secondary organic aerosol
(wangxm@gig.ac.cn). formation from in-use diesel vehicle exhaust: comparison be-
tween idling and cruise mode, Sci. Total Environ., 699, 134357,
https://doi.org/10.1016/j.scitotenv.2019.134357, 2020.
Supplement. The supplement related to this article is available on- Donahue, N. M., Robinson, A. L., Stanier, C. O., and Pandis,
line at: https://doi.org/10.5194/acp-21-10005-2021-supplement. S. N.: Coupled partitioning, dilution, and chemical aging of
semivolatile organics, Environ. Sci. Technol., 40, 2635–2643,
https://doi.org/10.1021/es052297c, 2006.
Author contributions. XW and YZ designed the campaign and pro- Drozd, G. T., Zhao, Y. L., Saliba, G., Frodin, B., Maddox, C., Oliver
vided the funding supports. HF and XH analyzed the samples. HF Chang, M. C., Maldonado, H., Sardar, S., Weber, R. J., Robin-
wrote the paper. GZ, WH, MT, XD, and XB provided suggestions son, A. L., and Goldstein, A. H.: Detailed speciation of inter-
for this paper. XW revised and edited the paper. The others in author mediate volatility and semivolatile organic compound emissions
list conducted the field work. from gasoline vehicles: effects of cold-starts and implications for
secondary organic aerosol formation, Environ. Sci. Technol., 53,
1706–1714, https://doi.org/10.1021/acs.est.8b05600, 2018.
Competing interests. The authors declare that they have no conflict Gentner, D. R., Isaacman, G., Worton, D. R., Chan, A. W. H., Dall-
of interest. mann, T. R., Davis, L., Liu, S., Day, D. A., Russell, L. M., Wil-
son, K. R., Weber, R., Guha, A., Harley, R. A., and Goldstein,
A. H.: Elucidating secondary organic aerosol from diesel and
Disclaimer. Publisher’s note: Copernicus Publications remains gasoline vehicles through detailed characterization of organic
neutral with regard to jurisdictional claims in published maps and carbon emissions, P. Natl. Acad. Sci. USA, 109, 18318–18323,
institutional affiliations. https://doi.org/10.1073/pnas.1212272109, 2012.
Gentner, D. R., Jathar, S. H., Gordon, T, D., Bahreini, R., Day,
D. A., EI Haddad, I., Hays, P. L., Pieber, S. M., Platt, S. M.,
Acknowledgements. The authors gratefully acknowledge the de Gouw, J., Goldstein, A. H., Harley, R. A., Jimenez, J. L.,
Guangzhou Ecological and Environmental Monitoring Center of Prévôt, A. S. H., and Robinson, A. L.: Review of urban sec-
https://doi.org/10.5194/acp-21-10005-2021 Atmos. Chem. Phys., 21, 10005–10013, 202110012 H. Fang et al.: Emissions of IVOCs from vehicles under real-world driving conditions ondary organic aerosol formation from gasoline and diesel mo- Kramer, L. J., Crilley, L. R., Adams, T. J., Ball, S. M., Pope, F. tor vehicle emissions, Environ. Sci. Technol., 51, 1074–1093, D., and Bloss, W. J.: Nitrous acid (HONO) emissions under real- https://doi.org/10.1021/acs.est.6b04509, 2017. world driving conditions from vehicles in a UK road tunnel, At- Guo, J., Zhou, S., Cai, M., Zhao, J., Song, W., Zhao, W., Hu, W., mos. Chem. Phys., 20, 5231–5248, https://doi.org/10.5194/acp- Sun, Y., He, Y., Yang, C., Xu, X., Zhang, Z., Cheng, P., Fan, 20-5231-2020, 2020. Q., Hang, J., Fan, S., Wang, X., and Wang, X.: Characterization Li, S., Zhu, M., Yang, W. Q., Tang, M. J., Huang, X. L., Yu, of submicron particles by time-of-flight aerosol chemical speci- Y. G., Fang, H., Yu, X., Yu, Q. Q., Fu, X. X.; Song, W., ation monitor (ToF-ACSM) during wintertime: aerosol composi- Zhang, Y. L., Bi, X. H., and Wang, X. M.: Filter-based mea- tion, sources, and chemical processes in Guangzhou, China, At- surement of light absorption by brown carbon in PM2.5 in a mos. Chem. Phys., 20, 7595–7615, https://doi.org/10.5194/acp- megacity in South China, Sci. Total Environ., 633, 1360–1369, 20-7595-2020, 2020. https://doi.org/10.1016/j.scitotenv.2018.03.235, 2018. Ho, K. F., Ho, S. S. H., Cheng, Y., Lee, S. C., and Yu, J. Z.: Liu, H., Man, H., Cui, H., Wang, Y., Deng, F., Wang, Y., Yang, X., Real-world emission factors of fifteen carbonyl compounds mea- Xiao, Q., Zhang, Q., Ding, Y., and He, K.: An updated emission sured in a Hong Kong tunnel, Atmos. Environ., 41, 1747–1758, inventory of vehicular VOCs and IVOCs in China, Atmos. Chem. https://doi.org/10.1016/j.atmosenv.2006.10.027, 2007. Phys., 17, 12709–12724, https://doi.org/10.5194/acp-17-12709- Hodzic, A., Jimenez, J. L., Madronich, S., Canagaratna, M. R., De- 2017, 2017. Carlo, P. F., Kleinman, L., and Fast, J.: Modeling organic aerosols Liu, T., Wang, X., Deng, W., Hu, Q., Ding, X., Zhang, Y., He, in a megacity: potential contribution of semi-volatile and inter- Q., Zhang, Z., Lü, S., Bi, X., Chen, J., and Yu, J.: Secondary mediate volatility primary organic compounds to secondary or- organic aerosol formation from photochemical aging of light- ganic aerosol formation, Atmos. Chem. Phys., 10, 5491–5514, duty gasoline vehicle exhausts in a smog chamber, Atmos. https://doi.org/10.5194/acp-10-5491-2010, 2010. Chem. Phys., 15, 9049–9062, https://doi.org/10.5194/acp-15- Huang, C., Hu, Q. Y., Li, Y. J., Tian, J. J., Ma, Y. G., Zhao, 9049-2015, 2015. Y. L., Feng, J. L., An, J. Y., Qiao, L. P., Wang, H. L., Jing, Liu, T. Y., Wang, X. M., Wang, B. G., Ding, X., Deng, W., Lü, S. S. A., Huang, D. D., Lou, S. R., Zhou, M., Zhu, S. H., J., and Zhang, Y. L.: Emission factor of ammonia (NH3 ) from Tao, S. K., and Li, L.: Intermediate volatility organic com- on-road vehicles in China: tunnel tests in urban Guangzhou, pound emissions from a large cargo vessel operated under real- Environ. Res. Lett., 9, 064027, https://doi.org/10.1088/1748- world conditions, Environ. Sci. Technol., 52, 12934–12942, 9326/9/6/064027, 2014. https://doi.org/10.1021/acs.est.8b04418, 2018. Lu, Q., Zhao, Y., and Robinson, A. L.: Comprehensive or- Huang, L., Wang, Q., Wang, Y. J., Emery, C., Zhu, A. S., Zhu, Y. ganic emission profiles for gasoline, diesel, and gas-turbine en- H., Yin, S. J., Yarwood, G., Zhang, K., and Li, L.: Simulation of gines including intermediate and semi-volatile organic com- secondary organic aerosol over the Yangtze River Delta region: pound emissions, Atmos. Chem. Phys., 18, 17637–17654, the impacts from the emissions of intermediate volatility organic https://doi.org/10.5194/acp-18-17637-2018, 2018. compounds and the SOA modeling framework, Atmos. Environ., Lu, Q., Murphy, B. N., Qin, M., Adams, P. J., Zhao, Y., Pye, H. 246, 118079, https://doi.org/10.1016/j.atmosenv.2020.118079, O. T., Efstathiou, C., Allen, C., and Robinson, A. L.: Simula- 2020. tion of organic aerosol formation during the CalNex study: up- Jathar, S. H., Gordon, T. D., Hennigan, C. J., Pye, H. O., Pouliot, dated mobile emissions and secondary organic aerosol param- G., Adams, P. J., Donahue, N. M., and Robinson, A. L.: eterization for intermediate-volatility organic compounds, At- Unspeciated organic emissions from combustion sources and mos. Chem. Phys., 20, 4313–4332, https://doi.org/10.5194/acp- their influence on the secondary organic aerosol budget in the 20-4313-2020, 2020. United States, P. Natl. Acad. Sci. USA, 111, 10473–10478, Murphy, B. N., Woody, M. C., Jimenez, J. L., Carlton, A. M. G., https://doi.org/10.1073/pnas.1323740111, 2014. Hayes, P. L., Liu, S., Ng, N. L., Russell, L. M., Setyan, A., Jimenez, J. L., Canagaratna, M. R., Donahue, N. M., Prevot, A. S. Xu, L., Young, J., Zaveri, R. A., Zhang, Q., and Pye, H. O. T.: H., Zhang, Q., Kroll, J. H., DeCarlo, P. F., Allan, J. D., Coe, Semivolatile POA and parameterized total combustion SOA in H., Ng, N. L., Aiken, A. C., Docherty, K. S., Ulbrich, I. M., CMAQv5.2: impacts on source strength and partitioning, Atmos. Grieshop, A. P., Robinson, A. L., Duplissy, J., Smith, J. D., Chem. Phys., 17, 11107–11133, https://doi.org/10.5194/acp-17- Wilson, K. R., Lanz, V. A., Hueglin, C., Sun, Y. L., Tian, J., 11107-2017, 2017. Laaksonen, A., Raatikainen, T., Rautiainen, J., Vaattovaara, P., Ots, R., Young, D. E., Vieno, M., Xu, L., Dunmore, R. E., Al- Ehn, M., Kulmala, M., Tomlinson, J. M., Collins, D. R., Cubi- lan, J. D., Coe, H., Williams, L. R., Herndon, S. C., Ng, N. son, M. J., Dunlea, E. J., Huffman, J. A., Onasch, T. B., Al- L., Hamilton, J. F., Bergström, R., Di Marco, C., Nemitz, E., farra, M. R., Williams, P. I., Bower, K., Kondo, Y., Schnei- Mackenzie, I. A., Kuenen, J. J. P., Green, D. C., Reis, S., and der, J., Drewnick, F., Borrmann, S., Weimer, S., Demerjian, K., Heal, M. R.: Simulating secondary organic aerosol from missing Salcedo, D., Cottrell, L., Griffin, R., Takami, A., Miyoshi, T., diesel-related intermediate-volatility organic compound emis- Hatakeyama, S., Shimono, A., Sun, J. Y., Zhang, Y. M., Dzepina, sions during the Clean Air for London (ClearfLo) campaign, At- K., Kimmel, J. R., Sueper, D., Jayne, J. T., Herndon, S. C., Trim- mos. Chem. Phys., 16, 6453–6473, https://doi.org/10.5194/acp- born, A. M., Williams, L. R., Wood, E. C., Middlebrook, A. M., 16-6453-2016, 2016. Kolb, C. E., Baltensperger, U., and Worsnop, D. R.: Evolution Pierson, W. R. and Brachaczek, W. W.: Emissions of ammonia and of organic aerosols in the atmosphere, Science, 326, 1525–1529, amines from vehicles in the road, Environ. Sci. Technol., 17, https://doi.org/10.1126/science.1180353, 2009. 757–760, https://doi.org/10.1021/es00118a013, 1983. Atmos. Chem. Phys., 21, 10005–10013, 2021 https://doi.org/10.5194/acp-21-10005-2021
H. Fang et al.: Emissions of IVOCs from vehicles under real-world driving conditions                                                  10013

Presto, A. A. and Miracolo, M. A.: Secondary organic aerosol              Wu, Y., Zhang, S. J., Hao, J. M., Liu, H., Wu, X. M., Hu, J.
   formation from high-NOx photo-oxidation of low volatility                N., Walsh, M. P., Wallington, T. J., Zhang, M. K., and Ste-
   precursors: n-alkanes, Environ. Sci. Technol., 44, 2029–2034,            vanovic, S.: On-road vehicle emissions and their control in
   https://doi.org/10.1021/es903712r, 2010.                                 China: a review and outlook, Sci. Total Environ., 574, 332–349,
Pye, H. O. T. and Seinfeld, J. H.: A global perspective on aerosol          https://doi.org/10.1016/j.scitotenv.2016.09.040, 2017.
   from low-volatility organic compounds, Atmos. Chem. Phys., 10,         Yang, W. Y., Li, J., Wang, W. G., Li, J. L., Ge, M. F., Sun, Y. L.,
   4377–4401, https://doi.org/10.5194/acp-10-4377-2010, 2010.               Chen, X. S., Ge, B. Z., Tong, S. R., Wang, Q. Q., and Wang,
Qi, L. J., Liu, H., Shen, X. E., Fu, M. L., Huang, F. F., Man, H.           Z. F.: Investigating secondary organic aerosol formation path-
   Y., Deng, F. Y., Shaikh, A. A., Wang, X. T., Dong, R., Song,             ways in China during 2014, Atmos. Environ., 213, 133–147,
   C., and He, K. B.: Intermediate-volatility organic compound              https://doi.org/10.1016/j.atmosenv.2019.05.057, 2019.
   emissions from nonroad construction machinery under differ-            Zhang, Q., Jimenez, J. L., Canagaratna, M. R., Allan, J. D., Coe,
   ent operation modes, Environ. Sci. Technol., 53, 13832–13840,            H., Ulbrich, I., Alfarra, M. R., Takami, A., Middlebrook, A. M.,
   https://doi.org/10.1021/acs.est.9b01316, 2019.                           and Sun, Y. L.: Ubiquity and dominance of oxygenated species
Robinson, A. L., Donahue, N. M., Shrivastava, M. K., Weitkamp,              in organic aerosols in anthropogenically-influenced northern
   E. A., Sage, A. M., Grieshop, A. P., Lane, T. E., Pierce, J.             hemisphere midlatitudes, Geophys. Res. Lett., 34, L13801,
   R., and Pandis, S. N.: Rethinking organic aerosols: semivolatile         https://doi.org/10.1029/2007GL029979, 2007.
   emissions and photochemical aging, Science, 315, 1259–1262,            Zhang, Y. L., Wang, X. M., Wen, S., Herrmann, H., Yang, W. Q.,
   https://doi.org/10.1126/science.1133061, 2007.                           Huang, X. Y., Zhang, Z., Huang, Z. H., He, Q. F., and George, C.:
Shrivastava, M. K., Lane, T. E., Donahue, N. M., Pandis, S.                 On-road vehicle emissions of glyoxal and methylglyoxal from
   N., and Robinson, A. L.: Effects of gas particle partitioning            tunnel tests in urban Guangzhou, China, Atmos. Environ., 127,
   and aging of primary emissions on urban and regional organic             55–60, https://doi.org/10.1016/j.atmosenv.2015.12.017, 2016.
   aerosol concentrations, J. Geophys. Res.-Atmos., 113, D18301,          Zhang, Y. L., Yang, W. Q., Huang, Z. H., Liu, D., Simp-
   https://doi.org/10.1029/2007jd009735, 2008.                              son, I., Blake, D. R., George, C., and Wang, X. M.: Leak-
Stewart, G. J., Nelson, B. S., Acton, W. J. F., Vaughan, A. R.,             age rates of refrigerants CFC-12, HCFC-22, and HFC-134a
   Farren, N. J., Hopkins, J. R., Ward, M. W., Swift, S. J., Arya,          from operating mobile air conditioning systems in Guangzhou,
   R., Mondal, A., Jangirh, R., Ahlawat, S., Yadav, L., Sharma, S.          China: tests inside a busy urban tunnel under hot and humid
   K., Yunus, S. S. M., Hewitt, C. N., Nemitz, E., Mullinger, N.,           weather conditions, Environ. Sci. Technol. Lett., 4, 481–486,
   Gadi, R., Sahu, L. K., Tripathi, N., Rickard, A. R., Lee, J. D.,         https://doi.org/10.1021/acs.estlett.7b00445, 2017.
   Mandal, T. K., and Hamilton, J. F.: Emissions of intermediate-         Zhang, Y. L., Yang, W. Q., Simpson, I., Huang, X. Y., Yu, J. Z.,
   volatility and semi-volatile organic compounds from domestic             Huang, Z. H., Wang, Z. Y., Zhang, Z., Liu, D., Huang, Z. Z.,
   fuels used in Delhi, India, Atmos. Chem. Phys., 21, 2407–2426,           Wang, Y. J., Pei, C. L.,Shao, M., Blake, D. R., Zheng, J. Y.,
   https://doi.org/10.5194/acp-21-2407-2021, 2021.                          Huang, Z. J., and Wang, X. M.: Decadal changes in emissions
Tang, R., Lu, Q., Guo, S., Wang, H., Song, K., Yu, Y., Tan, R., Liu,        of volatile organic compounds (VOCs) from on-road vehicles
   K., Shen, R., Chen, S., Zeng, L., Jorga, S. D., Zhang, Z., Zhang,        with intensified automobile pollution control: case study in a
   W., Shuai, S., and Robinson, A. L.: Measurement report: Distinct         busy urban tunnel in South China, Environ. Pollut., 233, 806–
   emissions and volatility distribution of intermediate-volatility or-     819, https://doi.org/10.1016/j.envpol.2017.10.133, 2018.
   ganic compounds from on-road Chinese gasoline vehicles: impli-         Zhang, Y. L., Deng, W., Hu, Q. H., Wu, Z. F., Yang, W. Q., Zhang,
   cation of high secondary organic aerosol formation potential, At-        H. N., Wang, Z. Y., Fang, Z., Zhu, M., Li, S., Song, W., Ding, X.,
   mos. Chem. Phys., 21, 2569–2583, https://doi.org/10.5194/acp-            and Wang, X. M.: Comparison between idling and cruising gaso-
   21-2569-2021, 2021.                                                      line vehicles in primary emissions and secondary organic aerosol
Tkacik, D. S., Lambe, A. T., Jathar, S., Li, X., Presto, A. A.,             formation during photochemical ageing, Sci. Total Environ., 772,
   Zhao, Y. L., Blake, D., Meinardi, S., Jayne, J. T., Croteau,             137934, https://doi.org/10.1016/j.scitotenv.2020.137934, 2020.
   P. L., and Robinson, A. L.: Secondary organic aerosol for-             Zhao, Y. L., Hennigan, C. J., May, A. A., Tkacik, D. S., de Gouw,
   mation from in-use motor vehicle emissions using a potential             J. A., Gilman, J. B., Kuster, W. C., Borbon, A., and Robinson,
   aerosol mass reactor, Environ. Sci. Technol., 48, 11235–11242,           A. L.: Intermediate-volatility organic compounds: a large source
   https://doi.org/10.1021/es502239v, 2014.                                 of secondary organic aerosol, Environ. Sci. Technol., 48, 13743–
Wang, Y. H., Gao, W. K., Wang, S., Song, T., Gong, Z. Y., Ji, D. S.,        13750, https://doi.org/10.1021/es5035188, 2014.
   Wang, L. L., Liu, Z. R., Tang, G. Q., Huo, Y. F., Tian, S. L., Li,     Zhao, Y. L., Nguyen, N. T., Presto, A. A., Hennigan, C. J., May,
   J. Y., Li, M. G., Yang, Y., Chu, B. W., Petaja, T. K., Kerminen,         A. A., and Robinson, A. L.: Intermediate volatility organic
   V-M., He, H., Hao, J. M., Kulmala, M., Wang, Y. S., and Zhang,           compound emissions from on-road diesel Vehicles: chemical
   Y. H.: Contrasting trends of PM2.5 and surface-ozone concentra-          composition, emission factors, and estimated secondary organic
   tions in China from 2013 to 2017, Nat. Sci. Rev., 7, 1331–1339,          aerosol production, Environ. Sci. Technol., 49, 11516–11526,
   https://doi.org/10.1093/nsr/nwaa032, 2020.                               https://doi.org/10.1021/acs.est.5b02841, 2015.
Wu, L., Wang, X., Lu, S., Shao, M., and Ling, Z.: Emission in-            Zhao, Y. L., Nguyen, N. T., Presto, A. A., Hennigan, C. J., May,
   ventory of semi-volatile and intermediate-volatility organic com-        A. A., and Robinson, A. L.: Intermediate volatility organic com-
   pounds and their effects on secondary organic aerosol over the           pound emissions from on-road gasoline vehicles and small off-
   Pearl River Delta region, Atmos. Chem. Phys., 19, 8141–8161,             road gasoline engines, Environ. Sci. Technol., 50, 4554–4563,
   https://doi.org/10.5194/acp-19-8141-2019, 2019.                          https://doi.org/10.1021/acs.est.5b06247, 2016.

https://doi.org/10.5194/acp-21-10005-2021                                                Atmos. Chem. Phys., 21, 10005–10013, 2021
You can also read