South African Winter Rainfall Zone Shifts: A Comparison of Seasonality Metrics For Cape Town From 1841-1899 and 1933-2020 - Research Square
←
→
Page content transcription
If your browser does not render page correctly, please read the page content below
South African Winter Rainfall Zone Shifts: A Comparison of Seasonality
Metrics For Cape Town From 1841-1899 and 1933-2020
Sarah Jane Roffe ( sarahroffe1@gmail.com )
University of the Witwatersrand https://orcid.org/0000-0003-3683-8377
Jessica Steinkopf
University of the Witwatersrand
Jennifer Fitchett
University of the Witwatersrand
Research Article
Keywords: Winter rainfall zone drought, Rainfall seasonality, Seasonality score, Wet- and dry-season, Trend analysis, Climate change
Posted Date: November 2nd, 2021
DOI: https://doi.org/10.21203/rs.3.rs-867223/v1
License: This work is licensed under a Creative Commons Attribution 4.0 International License. Read Full License
Page 1/19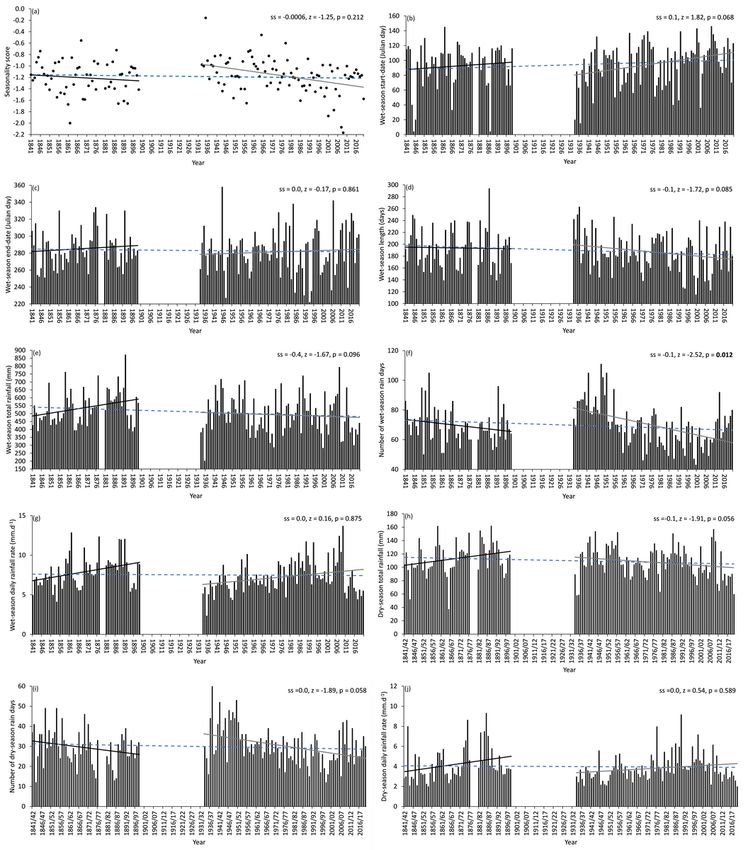
Abstract
Mounting evidence across South Africa’s southwestern winter rainfall zone (WRZ) reflects consistent drying since ~1980 and projected trends suggest this will
continue. However, limited evidence exists for the region’s rainfall seasonality changes. To improve our understanding of these WRZ drying trends, especially
within the context of Cape Town’s 2015-2017 “Day Zero” drought, it is necessary to explore long-term rainfall seasonality trends. Thus, we use the longest WRZ
meteorological record from the South African Astronomical Observatory (SAAO) in Cape Town to investigate rainfall seasonality shifts during 1841-2020.
Consistent with recorded poleward migrations of the subtropical high-pressure belt and mid-latitude westerlies, known drivers behind the drought and drying
trends, calculated trends demonstrate strengthening of WRZ conditions, primarily from a later start-date trend leading to a shorter wet-season. Long-term
drying trends are quantified for the wet- and dry-seasons, however, analysis of trend evolution reveals much variability, reflecting that drying has only persisted
since ~1892. Comparative analyses of the first and last 59 years of 1841-2020 reveals a rainfall decline of ~10% across both seasons – highlighting that the
extreme “Day Zero” drought was not only driven by wet-season rainfall declines. Results demonstrate that these drying trends were consistently driven by a
long-term decline in rain day counts and a more recent decline in average rainfall per rain day. Correspondence between our results and projected rainfall
seasonality trends suggests the trends we quantified will likely continue, thus improvements and continuation of existing water conservation and
management strategies are imperative for Cape Town.
1 Introduction
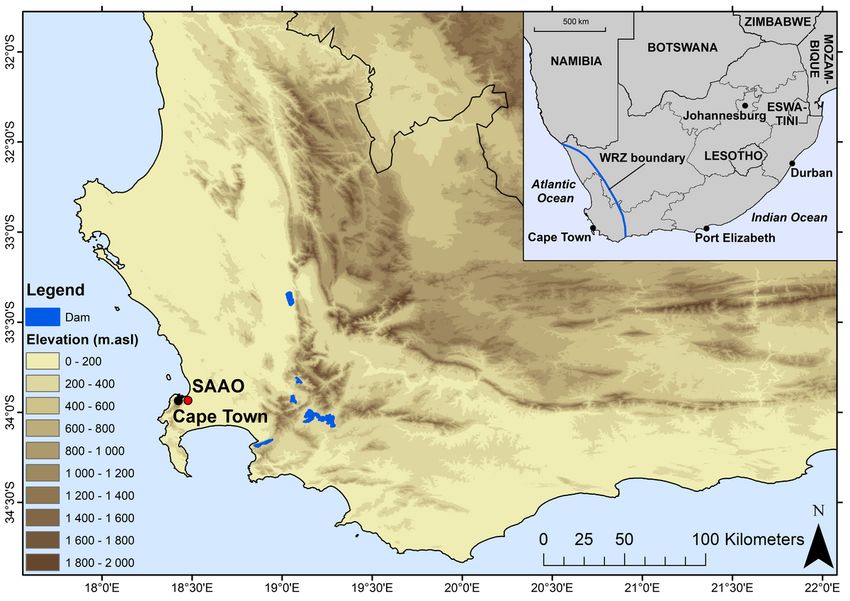
The southwestern region of South Africa’s winter rainfall zone (WRZ; Fig. 1) experienced below-average rainfall during the 2015–2017 April-September winter
wet-seasons, which resulted in the worst drought and water shortages across the region since 1904 (Botai et al. 2017; Wolski 2018). These deficits, which were
most pronounced for the autumn (March-May) and spring transition (September-November) seasons, led to supply dam water levels dropping to ~ 20%
capacity during May 2018 (Burls et al. 2019; Pascale et al. 2020). For the ~ 4 million inhabitants of the City of Cape Town, this culminated in an imminent
threat that dam levels would fall below ~ 10%, marking the level at which the city’s municipal water supply would have been disconnected, before the 2018
winter wet-season (Sousa et al. 2018). The fear surrounding this gathered much attention, with media and municipal authorities terming this event “Day Zero”,
and forced the city to enforce strict water restrictions, from pre-drought levels of ~ 200L per person per day to 50L per person per day (Muller 2018; Wolski
2018). Fortunately, “Day Zero” was averted as good early winter rains and near-average rainfall for the 2018 winter season led to dam levels rising to ~ 70% by
October 2018 (Sousa et al. 2018; Burls et al. 2019). This crisis highlighted that Cape Town is extremely vulnerable to multi-year droughts, which are expected
to increase in frequency and magnitude under anthropogenically induced climate change (Otto et al. 2018; Mahlalela et al. 2019; Pascale et al. 2020).
Many studies have investigated climatological factors driving the 2015–2017 drought. Although poor water-management practices and infrastructure
deficiencies exacerbated this water crisis (Muller 2018), the 2015–2017 rainfall deficit was the main driver (Otto et al. 2018; Wolski et al. 2020). Several
studies demonstrate that this rainfall deficit, particularly during the transition seasons, corresponds to trends of annual and seasonal rainfall declines, which
are more pronounced for recent decades from ~ 1980 (du Plessis and Schloms 2017; Sousa et al. 2018; Mahlalela et al. 2019; Jury 2020; Ndebele et al. 2020;
Wolski et al. 2021). Odoulami et al. (2021) demonstrate that the 2015–2017 rainfall deficits correspond to a decrease in winter rain-bearing circulation types,
including cold fronts, and an increase in dry circulation types, including the South Atlantic Anticyclone (SAA) and associated ridging anticyclones. These may
form part of a trend in changing regional synoptic climatology, quantified by Lennard and Hegerl (2015) to have started in ~ 1979. Moisture transport to the
southwestern Cape region and the amount of rain falling on days with rain-bearing circulation types was also demonstrated to be reduced during 2015–2017
(Odoulami et al. 2021). Burls et al. (2019) found similar results, with a decline, since 1979, in the duration of rainfall events and rainfall amount associated
with cold fronts for the April-September winter wet-season. It is established that these changes are linked to hemispheric-scale expansion of the Hadley cell,
which has in turn driven a poleward expansion of the subtropical high-pressure belt and a poleward displacement of the westerlies moisture corridor (Sousa et
al. 2018; Burls et al. 2019; Mahlalela et al. 2019; Odoulami et al. 2021).
Despite numerous studies exploring rainfall trends and the underlying mechanisms that drove the Cape Town “Day Zero” drought, there is a limited
understanding of rainfall seasonality trends, such as wet-season start- and end-date and duration trends, which may have contributed to the occurrence of this
drought. To understand this, it is necessary to explore long-term rainfall seasonality changes. Although recent research investigated rainfall seasonality trends
for several WRZ locations including Cape Town (Roffe et al. 2021a), the analysis period of 1987–2016 is too short and ends too early to effectively
understand how rainfall seasonality trends contributed to driving this drought. Derived from a ratio of monthly rainfall:temperature (Roffe et al. 2021b) and a
percentile-based seasonality metric (Roffe et al. 2020) and spanning 1841–2020, we therefore present a long-term rainfall seasonality record for the South
African Astronomical Observatory (SAAO) located in Cape Town (Fig. 1), the core region of the drought and WRZ. Using this record, we explore how rainfall
seasonality has shifted since 1841 as a means to better understand Cape Town’s rainfall seasonality dynamics in relation to the 2015–2017 “Day Zero” water
crisis. Given the occurrence of this recent extreme drought and since projections robustly reflect that such droughts will occur more frequently with higher
intensity in the future (Pascale et al. 2020), there is a clear need for such a study exploring long-term rainfall seasonality trends as this can inform
management strategies for rainfall sensitive activities (e.g. water resource management) across Cape Town.
2 Study Area: Cape Town’s Rainfall Climatology
While most of South Africa is categorized by a summer rainfall regime, Cape Town is situated within the country’s WRZ (Fig. 1; Roffe et al. 2021b). Hence,
Cape Town experiences a Mediterranean climate with warm, dry summers and cool, wet winters, receiving ~ 80% of annual rainfall during extended winter
months, from April-September (Mahlalela et al. 2019). Located windward of the Cape Fold Mountain Belt (Fig. 1), Cape Town receives an annual rainfall total
averaging ~ 600 mm.yr− 1 (Ndebele et al. 2020), which varies interannually in relation to the strength and position of the westerlies - the main winter rainfall
moisture source (Sousa et al. 2018). During winter, when the westerlies are situated farther north, mid-latitude cyclone cold fronts, tracking eastwards from the
southwest Atlantic Ocean, more frequently reach Cape Town and are responsible for ~ 89% of winter rainfall (Burls et al. 2019). Frontless troughs in the
westerly wave, which sometimes break-off forming cut-off lows, provide much of the remaining rainfall, primarily during autumn and spring months (Favre et
Page 2/19al. 2013; Omar and Abiodun 2020). Long, narrow moisture plumes, termed atmospheric rivers, also produce some of the remaining rainfall (Blamey et al. 2018). As the SAA and westerlies shift south during summer, fewer temperate weather systems reach Cape Town, and warm, dry conditions are promoted by subsidence associated with the SAA (Sousa et al. 2018; Ndarana et al. 2021). SAA ridging anticyclones, occurring year-round but more frequently during warmer months, also typically promote dry summer conditions (Mahlalela et al. 2019; Ndarana et al. 2021). Although the summer period is dry, some rain is delivered to Cape Town from convective storms (Lennard and Hegerl 2015), cut-off lows (Favre et al. 2013), and atmospheric rivers (De Kock et al. 2021). Winter rainfall across Cape Town displays considerable interannual to interdecadal variability, making it susceptible to dry periods (Dieppois et al. 2016; Sousa et al. 2018; Mahlalela et al. 2019). This is driven by several factors, including anomalies in South Atlantic sea surface temperatures and Southern Ocean sea ice (Reason et al. 2002; Reason and Jagadheesha 2005; Blamey and Reason 2007), and large-scale modes of variability including the Southern Annular Mode (Reason and Rouault 2005; Mahlalela et al. 2019) and El Niño Southern Oscillation (Reason et al. 2000; Philippon et al. 2012). These factors influence the position and strength of the westerlies storm track and associated moisture fluxes to the region (Sousa et al. 2018), which in turn determines rainfall variability primarily through changes in the number and intensity of cold fronts making landfall (Burls et al. 2019). 3 Data And Methodology 3.1 Data and pre-processing Records of daily rainfall and temperature, spanning 1841–1899 and 1933–2020, from the SAAO meteorological station were used to explore rainfall seasonality shifts. Data for 1841–1899 were digitized from meteorological registers held at the SAAO (see Picas et al. 2019; Ndebele et al. 2020). From these registers, sub-daily temperature readings, used to calculate mean daily temperatures, span 1834–1899 (Picas et al. 2019), however, daily rainfall records span 1841–1899 (Ndebele et al. 2020), thus we only use data for the overlapping period 1841–1899. Data for the SAAO for 1933–2020 were obtained from the South African Weather Service (SAWS). Although daily rainfall records span 1900–2020, daily maximum (Tmax) and minimum (Tmin) temperature records span 1933–2020, thus our analyses only consider data for 1933–2020. Before performing any statistical analyses, data quality was checked and cleaning was performed where necessary. Details of these processes undertaken for data for 1841–1899 are documented elsewhere (see Picas et al. 2019; Ndebele et al. 2020; Picas and Grab 2020). Given the absence of local rainfall and temperature reference datasets, prior to 1900, data gaps for 1878–1880 remain. Besides this, the dataset is complete. Before discussing the quality control and cleaning process for data for 1933–2020, note that we followed the process undertaken for 1841–1899 as closely as possible to ensure consistency, and raw data for 1933–2020 were near-complete, with ~ 8% missing Tmax and Tmin values and ~ 5% missing rainfall values. Initially, dates were checked for temporal consistency and values were rounded to one decimal place for uniformity. Thereafter, raw data were checked to identify errors and outliers. Typographic errors, negative rainfall values, accumulated rainfall values, and where Tmin ≥ Tmax were among the errors identified (Dyson et al. 2009; Durre et al. 2010; Ndebele et al. 2020; Picas and Grab 2020; van der Walt and Fitchett 2020). Outliers were identified using boxplots (for temperature), histograms (for rainfall) and tolerance tests, involving checking for rainfall and temperature values outside upper/lower limits for the SAAO (Aguilar et al. 2003; Durre et al. 2010). Once validated, through comparison with surrounding stations records, true erroneous/outlier values were deleted and recorded as missing values. These were estimated or replaced on a daily scale using nearby station records within a 15km radius and with a Pearson correlation coefficient value > 0.70 for existing data (Wolski et al. 2021). Missing temperature data were replaced with data from the closest station, or, if not possible, estimated using a five-day weighted average (Picas and Grab 2020; van der Walt and Fitchett 2020). Missing daily rainfall readings were estimated by a weighted amount, considering the common period rainfall at the SAAO and the nearest station (Ndebele et al. 2020). Estimation was only undertaken for missing SAAO values corresponding to non-zero rainfall values for the nearest station, while all other missing SAAO values were set to zero (Ndebele et al. 2020). Based on a weighted ratio, accumulated rainfall values, labelled by SAWS or identified when large rainfall values followed immediately after missing values, were disaggregated across rain days identified for the closest station (Ndebele et al. 2020). It is necessary, following data quality control and cleaning, to determine data homogeneity (Aguilar et al. 2003; Wolski et al. 2021). However, due to a lack of metadata, on changes in data collection methods or station relocation for instance, and no suitable reference series prior to 1900, homogenization was not possible for 1841–1899 (Picas et al. 2019). Thus, homogeneity was not tested. 3.2 Quantifying rainfall seasonality To quantify rainfall seasonality characteristics for the SAAO, a ratio of monthly rainfall:temperature (Roffe et al. 2021b) and a percentile-based wet-season start- and end-date metric (Roffe et al. 2020) were applied using a January-December climatological year. Although numerous metrics have been applied across South Africa (Roffe et al. 2019), these were applied because they accurately characterise and statistically discriminate South African summer-, winter- and year-round rainfall regimes (Roffe et al. 2020, 2021b). Mean monthly rainfall and temperature, calculated using daily rainfall and temperature records, were used to quantify annual seasonality scores (termed score hereafter) following the ratio method (see Roffe et al. 2021b for method details). This score, representing the unitless m-coefficient of the least squares linear regression equation, models the relationship between rainfall and temperature, where a negative (positive) relationship corresponds to high rainfall during cooler, winter (warmer, summer) months, and vice versa (Roffe et al. 2021). Resulting scores have positive/negative signs, indicative of seasonality timing, with varying magnitudes quantifying the degree of seasonality, which represents seasonality strength and measures the contrast in length and rainfall amount of wet- and dry-seasons (Roffe et al. 2021b). Based on this, scores are classified as summer-, winter- or year-round rainfall regimes, where scores
and duration, where WRZ conditions are classified when the wet-season is shorter than nine months (~ 270 days) and includes the winter solstice, but not the
summer solstice (Roffe et al. 2020). For the wet-season, we quantified annual start- and end-dates, length, total rainfall, number of rain days and daily rainfall
rate (Roffe et al. 2020, 2021a). As wet-season start- and end-dates broadly equate to dry-season end- and start-dates, respectively, and can be used to infer the
dry-season length, only the dry-season total rainfall, number of rain days and daily rainfall rate were calculated.
3.3 Analyses for rainfall seasonality shifts
Rainfall seasonality shifts were analysed through trend and comparative analyses. For all tests, statistical significance was determined using p values, with
the alpha level set to 5%.

Trends were calculated for 1841–1899, 1933–2020 and 1841–2020 using the non-parametric Mann-Kendall (MK) trend test with the Sen’s slope (ss)
estimator, calculating the trend magnitude (Mahlalela et al. 2019; Hekmatzadeh et al. 2020). Considering parametric test assumptions, this test, and all the
non-parametric tests discussed below, were applied as they are robust to outliers and have no data distribution assumptions (Hekmatzadeh et al. 2020).

Accounting for the data gap, the non-parametric sequential Mann-Kendall test (SQMKT) was applied only to records spanning 1841–1899 and 1933–2020 to
explore the evolution of trends, to determine the start of statistically significant trends if present, and to determine whether change points exist, following
George and Athira (2020) and Hekmatzadeh et al. (2020). Using this method, two indicators, termed U(t) and U′(t), are defined based on ranks of the prograde,
forward time series and retrograde, backward time series, respectively (Sneyers 1991). Abrupt change points, representing shifts in data distribution properties
including the mean and variance (Beaulieu et al. 2012), are identified by plotting U(t) and U′(t), where the intersection of the two curves indicates a potential
abrupt change point location (Sneyers 1991); changes in the trend direction are also evident from U(t) line direction changes (Hekmatzadeh et al. 2020).
Abrupt change points are considered statistically significant when Z > 1.96 (or
Table 1
Statistically significant change points, detected using the sequential Mann-Kendall (SQMKT) test, for the various rainfall seasonality variables for 1841–1899
   and 1933–2020. Here, ss represents the Sen’s slope, z represents the Mann-Kendall statistic and p represents the Mann-Kendall test p value. Statistically
                                                        significant p values (p < 0.05) are denoted in bold.
 Variable                                Statistically significant change             Year of change           Trend before change           Trend after change
                                         point(s) (Y/N)                               point(s)                 point(s)                      point(s)

 Seasonality score                       N                                            -                        -                             -

 Wet-season start-date (Julian           N                                            -                        -                             -
 day)

 Wet-season end-date (Julian             Y                                            1879                     ss = 0.8, z = 1.74, p =       ss = -0.6, z = -0.56, p =
 day)                                                                                                          0.082                         0.576

 Wet-season length (days)                N                                            -                        -                             -

 Wet-season total rainfall (mm)          Y                                            1879                     ss = 2.3, z = 1.74, p =       ss = -3.5, z = -0.22, p =
                                                                                                               0.082                         0.827

 Number of wet-season rain days          N                                            -                        -                             -

 Wet-season daily rainfall rate          Y                                            1879                     ss = 0.1, z = 2.47, p =       ss = -0.2, z = -1.74, p =
 (mm.d− 1)                                                                                                     0.013                         0.081

                                                                                      1982                     ss = 0.1, z = 2.78, p =       ss = -0.1, z = -2.83, p =
                                                                                                               0.005                         0.005

 Dry-season total rainfall (mm)          Y                                            1879/80                  ss = 0.7, z = 1.87, p =       ss = -2.2, z = -1.74, p =
                                                                                                               0.062                         0.081

                                                                                      1955/56                  ss = 1.6, z = 2.03, p =       ss = -0.3, z = -2.03, p =
                                                                                                               0.042                         0.042

 Number of dry-season rain days          Y                                            1949/50                  ss = 1.3, z = 1.44, p =       ss = -0.1, z = -2.34, p =
                                                                                                               0.149                         0.019

 Dry-season daily rainfall rate          Y                                            1879/80                  ss = 0.1, z = 2.22, p =       ss = -0.1, z = -2.73, p =
 (mm.d− 1)                                                                                                     0.026                         0.006

                                                                                      1996/97                  ss = 0.1, z = 3.82, p =       ss = -0.1, z = -3.75, p =
                                                                                                               0.0001                        0.0002

The very weak insignificant score trend of -0.0020.yr− 1 (z = -0.87, p = 0.385) for 1841–1899 indicates a tendency towards a stronger degree of seasonality as
scores tend away from zero, towards more unevenly distributed rainfall (Fig. 2a). The SQMKT results reflect strong variability, evident from numerous
insignificant change points and the highly variable nature of U(t), thus indicating no clear score trend (Fig. 3a). A reduction (an increase) in the wet-season
(dry-season) length similarly reflects a tendency towards a stronger degree of seasonality. This trend of -0.1d.yr− 1 (z = -0.34, p = 0.734) is similarly weak and
insignificant, and numerous insignificant change points with a highly variable nature of U(t) also indicates strong variability and no clear trend (Fig. 2d, 3d).
This is the case for the very weak insignificant wet-season start- (0.1d.yr− 1, z = 0.35, p = 0.724) and end-date (0.1d.yr− 1, z = 0.81, p = 0.420) trends, reflecting
later start- and end-dates (Fig. 2b, c, 3b, c). However, the wet-season end-dates were characterised by a significant change point for 1879 (Fig. 3c). Despite
being weaker than the trend prior to 1878 (given 1878–1880 missing data), the trend towards earlier end-dates (-0.6d.yr− 1, z = -0.56, p = 0.576) from 1881, may
have, together with the overall later start-date trend, contributed to driving the shorter wet-season trend until 1899 as this trend is more pronounced from ~
1881 (Fig. 3c, d, Table 1).

For 1841–1899, the wet-season totals increased significantly (2.2mm.yr− 1, z = 2.38, p = 0.017; Fig. 2e). A significant change point was detected for 1879, and a
decreasing trend of -3.5mm.yr− 1 (z = -0.22, p = 0.827) was calculated thereafter, despite the significant increasing trend, until 1892, demonstrated by the U(t)
line (Fig. 3e, Table 1). A decline of -0.2d.yr− 1 (z = -1.56, p = 0.118) was quantified for the rain day counts (Fig. 2f). However, this series demonstrates much
variability, reflected by numerous insignificant change points and the highly variable nature of U(t), indicating no clear trend (Fig. 3f). A significant increase of
0.1mm.d− 1.yr− 1 (z = 2.76, p = 0.006) was quantified for the wet-season daily rainfall rate (Fig. 2g). Though, a significant change point was detected for 1879,
and from 1881–1899 a near-significant (i.e. p < 0.10) decreasing trend of -0.2mm.d− 1.yr− 1 (z = -1.74, p = 0.081) was calculated, despite the significant
increasing trend until 1892 (Table 1, Fig. 3g).

For 1841/42-1898/99, the dry-season totals increased at a near-significant rate of 0.4mm.yr− 1 (z = 1.85, p = 0.064; Fig. 2h), however, a significant change point
was detected for 1879/80 (Fig. 3h). From 1881/82-1898/99, a near-significant decreasing trend (-2.2mm.yr− 1, z = -1.74, p = 0.081) was calculated (Table 1),
despite the significant increasing trend until 1892/93 (Fig. 3h). A near-significant decline of -0.1d.yr1 (z = -1.65, p = 0.099) was quantified for the dry-season
rain day counts (Fig. 2i). Numerous insignificant change points and high variability in the U(t) line suggests no clear trend, despite a relatively strong p value
(Fig. 2i, 3i). A significant increase of 0.1mm.d− 1.yr− 1 (z = 2.42, p = 0.016) was calculated for the dry-season daily rainfall rate (Fig. 2j). Though, from 1881/82-
1898/99, following a significant change point during 1879/80, a significant decreasing trend of -0.1mm.d− 1.yr− 1 (z = -2.73, p = 0.006) persisted (Table 1),
despite a significant increasing trend until 1886/87 (Fig. 3j).

For 1933–2020, the scores consistently tended away from zero, towards more unevenly distributed rainfall and a stronger degree of seasonality, evident from
low variability in the SQMKT results and the significant trend of -0.0038.yr− 1 (z = -3.41, p = 0.001; Fig. 3a, 4a). While the trend for the wet-season length

                                                                              Page 5/19
demonstrates notable variability (Fig. 3d), the near-significant decreasing trend of -0.3d.yr− 1 (z = -1.66, p = 0.097; Fig. 4d), which indicates a shorter (longer)
wet-season (dry-season) duration trend, corresponds to the score trend. The later wet-season start-date trend of 0.3d.yr− 1 (z = 2.88, p = 0.004) is significant,
and is stronger and varies less than the later end-date trend of 0.1d.yr− 1 (z = 0.70, p = 0.484), thus the start-date trend was a stronger driver of the declining
wet-season duration trend (Fig. 3b, c, 4b, c).
The trend of -0.5mm.yr− 1 (z = -0.90, p = 0.368) reflects a decline in wet-season totals for 1933–2020, despite being weak overall with notable variability in the
U(t) line (Fig. 3e, 4e). The wet-season rain day counts demonstrate little variability and declined at a significant rate of -0.3d.yr− 1 (z = -4.32, p < 0.0001; Fig. 3f,
4f). The wet-season daily rainfall rate increased at significant rate of 0.1mm.d− 1.yr− 1 (z = 2.39, p = 0.017), however, three significant change points exist from
1975–1982 (Fig. 3g, 4g). Considering the last change point, the wet-season daily rainfall rate decreased at a significant rate of -0.1mm.d− 1.yr− 1 (z = -2.83, p =
0.005) for 1982–2020 (Table 1), despite a significant increasing trend, reflected by the U(t) line for much of 1982–2009 (Fig. 3g).
Although the dry-season totals decreased significantly (-0.3mm.yr− 1; z = -2.27, p = 0.023) for 1933/34-2019/20 (Fig. 4h), according to the SQMKT results, this
significant decreasing trend only persisted from 1955/56 at rate of -0.3 mm.yr− 1 (z = -2.03, p = 0.042), following a significant increasing trend (1.6mm.yr− 1; z =
2.03, p = 0.042; Fig. 3h, Table 1). Similarly, while the dry-season rain day counts decreased significantly (-0.1d.yr− 1; z = -3.43, p = 0.001), this significant
decreasing trend only occurred from 1949/50 at a rate of -0.1d.yr− 1 (z = -2.34, p = 0.019; Fig. 3i, 4i, Table 1). The dry-season daily rainfall rate increased at a
near-significant rate of 0.1mm.d− 1.yr− 1 (z = 1.91, p = 0.057), however, three significant change points were detected from 1990/91-1996/97 (Fig. 3j, 4j). Again,
considering the last change point for 1996/97, the dry-season daily rainfall rate decreased at a significant rate of -0.1mm.d− 1.yr− 1 (z = -3.75, p = 0.0002) for
1996/97-2019/20 (Table 1), despite the significant increasing trend evident from the U(t) line until 2001/02 (Fig. 3j).
Consistent with the score trends detected for 1841–1899 and 1933–2020, the trend for 1841–2020 reflects a decreasing trend of -0.0006.yr− 1 (z = -1.25, p =
0.212; Fig. 5a), indicating that since 1841 the scores have generally tended towards stronger WRZ conditions. The near-significant decreasing trend (-0.1d.yr− 1;
z = -1.72, p = 0.085) for the wet-season length for 1841–2020 is similarly consistent with the decreasing trends for 1841–1899 and 1933–2020 (Fig. 5d).
Together with an increasing dry-season length, this also reflects a trend towards stronger WRZ conditions. Notably, the SQMKT results for the scores and wet-
season length appear to broadly track each other in direction throughout 1841–2020 (Fig. 3a, d), thus highlighting good agreement between the two methods
(Roffe et al. 2021a). The U(t) line reflects cyclic patterns, with periods of stronger and weaker seasonality (Fig. 3a, d); though further analysis in terms of
length and drivers of cycles is beyond this papers scope. The near-significant later wet-season start-date trend of 0.1d.yr− 1 (z = 1.82, p = 0.068) for 1841–2020
also corresponds to the trends quantified for 1841–1899 and 1933–2020 (Fig. 5b). No trend exists in the wet-season end-dates for 1841–2020 (Fig. 5c),
which corresponds to large variability in the end-dates for 1841–1899 and 1933–2020 (Fig. 3c). This highlights that since 1841, and particularly from 1933,
the later start-date trend has primarily driven the shorter wet-season trend. Given this, it is notable that the cyclic patterns reflected by the start-date U(t) line
broadly supports later (earlier) start-dates for periods with shorter (longer) wet-seasons, while relatively little correspondence exists between the end-dates and
wet-season length (Fig. 3b, c, d).
Although the wet-season totals trend for 1841–2020 indicates a near-significant decline of -0.4mm.yr− 1 (z = -1.67, p = 0.096; Fig. 5e), this trend has only
persisted since 1881, or more likely since 1892 (Fig. 3e, Table 1). The significant decreasing trend of -0.1d.yr− 1 (z = -2.52, p = 0.012) calculated for the wet-
season rain day counts for 1841–2020 corresponds to the decreasing trends quantified for 1841–1899 and 1933–2020 (Fig. 5f). No trend was detected for
the wet-season daily rainfall rate for 1841–2020 (Fig. 5g), despite significant increasing trends quantified for 1841–1899 and 1933–2020. This is primarily
because the series was characterised by relatively high variability, as is evident from the U(t) line and numerous significant and non-significant change points
(Fig. 3g, Table 1).
While the trend for 1841/42-2019/20 indicates a near-significant decline of -0.1mm.yr− 1 (z = -1.91, p = 0.056) for the dry-season totals (Fig. 5h), this trend has
only persisted at a significant rate of -0.3mm.yr− 1 (z = -2.03, p = 0.042) since 1955/56 (Fig. 3h, Table 1). No trend was calculated for 1841/42-2019/20 for the
dry-season rain day counts and daily rainfall rate (Fig. 5i, j). Despite a significant decreasing trend of -0.1d.yr− 1 (z = -2.34, p = 0.019) from 1949/50 for the dry-
season rain day counts, the no trend result broadly corresponds to relatively high variability evident from the U(t) line for 1841/42-1898/99 and the significant
change point detected (Fig. 3i, Table 1). For the dry-season daily rainfall rate, this corresponds to high variability throughout 1841–2020, evident from the U(t)
line and numerous significant and non-significant change points (Fig. 3j).
Although we do not further explore cyclic patterns for the various rainfall seasonality variables, it is worth noting similarity in trend evolution. This exists
between the wet- and dry-season totals (Fig. 3e, h), the wet- and dry-season rain day counts (Fig. 3f, i), and the wet- and dry-season daily rainfall rate (Fig. 3g,
j); though there appears to be stronger, more distinct cyclicity for the wet- and dry-season totals. The structure, and specifically the timing, of cyclicity appears
to change from the earlier (1841–1899) to later period (1933–2020); a result which is similarly evident for SAAO annual and seasonal rainfall totals (Ndebele
et al. 2020). As such, the similarity in trend structure across the wet- and dry-seasons highlights that despite differences in their timing, there is much similarity
in their rainfall characteristics and trends.
4.2 Statistically comparing historical (1841–1899) and recent (1962–2020) period rainfall
seasonality characteristics
Significant mean and data distribution differences in the various rainfall seasonality variables for 1841–1899 (HP) and 1962–2020 (RP) were calculated,
using the WPST, for the wet-season rainfall totals and rain day counts and the dry-season rainfall totals (Fig. 6e, f, h). For the remaining variables, the
differences are insignificant (Fig. 6a, b, c, d, g, i, j). Despite this, data distribution differences exist between the HP and RP for most variables – evident from
visual inspection of the boxplots, focusing mainly on the interquartile range (IQR), representing the behaviour and spread of most data values, and mean and
Page 6/19median values (Fig. 6). Notwithstanding the statistical significance level, the differences detected generally agree with trend results for 1841–2020 (Fig. 5, 6,
Table 2), reflecting that the mean and data distribution differences broadly represent the results of these trends.
Page 7/19Table 2
Descriptive statistics of rainfall seasonality characteristics for the historical (1841–1899) and recent (1962–2020) periods. HP and RP denote statistics for the
historical and recent periods, respectively.
Variable Minimum First Median Mean Third Maximum Interquartile Range Standard Coefficient Skewness
Quartile Quartile range deviation of
variation
(%)
HP -2.00 -1.39 -1.16 -1.21 -1.02 -0.56 0.37 1.44 0.28 23.1 -0.27
seasonality
score
RP -2.17 -1.35 -1.19 -1.23 -1.06 -0.46 0.29 1.71 0.30 24.3 -0.77
seasonality
score
HP start- 4 January 20 March 11 April 3 April 23 April 25 May 34 141 30 32.0 -1.32
date (4) (79) (101) (93) (113) (145)
(Julian
day)
RP start- 5 February 24 March 17 April 11 April 18 April 26 May 35 110 27 26.6 -0.59
date (36) (83) (107) (101) (118) (146)
(Julian
day)
HP end- 8 28 10 12 23 30 25 83 21 7.5 0.50
date September September October October October November
(Julian (251) (271) (283) (285) (296) (334)
day)
RP end- 10 August 23 11 10 1 8 39 120 28 9.9 -0.08
date (222) September October October November December
(Julian (266) (284) (283) (305) (342)
day)
HP wet- 139 168 192 194 218 294 50 155 33 17.1 0.49
season
length
(days)
RP wet- 115 159 184 183 209 240 50 125 32 17.5 -0.15
season
length
(days)
HP wet- 387.2 460.7 518.2 536.9 598.0 871.8 137.3 484.6 106.4 19.8 0.83
season
total
rainfall
(mm)
RP wet- 282.1 387.5 486.9 481.8 558.5 793.5 171.0 511.4 118.8 24.6 0.43
season
total
rainfall
(mm)
HP number 50 61 68 70 75 105 14 55 12 16.9 0.79
of wet-
season
rain days
RP number 43 57 63 64 72 92 15 49 11 16.6 0.14
of wet-
season
rain days
HP wet- 4.1 6.4 7.6 7.9 9.0 12.9 2.6 8.8 2.0 25.3 0.61
season
daily
rainfall rate
(mm.d− 1)
RP wet- 4.4 6.2 7.3 7.7 8.8 13.7 2.6 9.3 2.1 26.7 0.75
season
daily
rainfall rate
(mm.d− 1)
HP dry- 37.1 99.1 110.6 113.2 126.4 161.8 27.3 124.7 24.1 21.3 -0.42
season
total
rainfall
(mm)
Page 8/19Variable Minimum First Median Mean Third Maximum Interquartile Range Standard Coefficient Skewness
Quartile Quartile range deviation of
variation
(%)
RP dry- 59.6 87.6 103.0 104.2 120.3 156.9 32.7 97.3 22.3 21.4 0.20
season
total
rainfall
(mm)
HP number 12 24 30 29 36 49 12 37 9 30.0 0.11
of dry-
season
rain days
RP number 12 23 27 27 33 43 10 31 7 26.1 0.09
of dry-
season
rain days
HP dry- 2.0 3.2 3.8 4.2 5.0 9.3 1.8 7.3 1.7 40.3 1.22
season
daily
rainfall rate
(mm.d− 1)
RP dry- 2.0 3.2 3.7 4.1 4.6 9.2 1.4 7.2 1.4 34.7 1.42
season
daily
rainfall rate
(mm.d− 1)
The mean (HP = -1.21, RP = -1.23) and median (HP = -1.16, RP = -1.19) score values reflect slightly stronger RP scores (Fig. 6a, Table 2), indicating a shift
towards a slightly stronger degree of seasonality for the RP. This corresponds to a shorter (longer) RP wet-season (dry-season) length, supported by the plotted
IQR and smaller RP minimum (HP = 139 days, RP = 115 days), mean (HP = 194 days, RP = 183 days), median (HP = 192 days, RP = 184 days) and maximum
(HP = 294 days, RP = 240 days) values (Fig. 6d, Table 2). Although notable differences exist in the distribution of the HP and RP wet-season end-date datasets,
particularly reflected by larger interannual variability (HP coefficient of variability [CV] = 7.5%, RP CV = 9.9%) and larger IQR (HP = 25 days, RP = 39 days) values
for the RP, the mean (HP = 12 October, Julian day [JD] = 285, RP = 10 October, JD = 283) and median (HP = 10 October, JD = 283, RP = 11 October, JD = 284)
values are very similar and reflect little to no end-date shift (Fig. 6c, Table 2). This confirms that the wet-season (and dry-season) duration shift is primarily due
to later RP wet-season start-dates, evident from the plotted IQR, and later RP mean (HP = 3 April, JD = 93, RP = 11 April, JD = 101) and median (HP = 11 April,
JD = 101, RP = 17 April, JD = 107) values (Fig. 6b, Table 2).
Besides the wet-season timing shifts, changes occurred in the magnitude and intensity of wet-season rainfall, and rain day counts. The HP wet-season was
wetter than the RP wet-season (Fig. 6e, f, g, Table 2). Most (~ 70%) annual HP wet-season totals were higher than for the RP, evident from the plotted IQR, and
the minimum (HP = 387.2mm, RP = 282.1mm), mean (HP = 536.9mm, RP = 481.8mm), median (HP = 518.2mm, RP = 486.9mm) and maximum (HP = 871.8mm,
RP = 793.5mm) values (Fig. 6e, Table 2). The wet-season rain day counts were lower for the RP compared to the HP, as demonstrated by the plotted IQR, and
the minimum (HP = 50 days, RP = 43 days), mean (HP = 70 days, RP = 64 days), median (HP = 68 days, RP = 63 days) and maximum (HP = 105 days, RP = 92
days) values (Fig. 6f, Table 2). Compared to the HP, the RP wet-season daily rainfall rate was slightly reduced, evident from the plotted IQR, and the mean (HP
= 7.9mm.d− 1, RP = 7.7mm.d− 1) and median (HP = 7.6mm.d− 1, RP = 7.3mm.d− 1) values (Fig. 6g, Table 2).
Changes also occurred in the magnitude and intensity of dry-season rainfall, and the rain day counts, with the HP dry-season wetter than the RP dry-season
(Fig. 6h, i, j, Table 2). The plotted IQR, and mean (HP = 113.2mm, RP = 104.2mm) and median (HP = 110.6mm, RP = 103.0mm) values reflect lower RP dry-
season totals (Fig. 6h, Table 2). The RP dry-season rain day counts are marginally lower than those for the HP, reflected by the plotted IQR (Fig. 6i), and mean
(HP = 29 days, RP = 27 days) and median (HP = 30 days, RP = 27 days) values (Table 2). The HP dry-season daily rainfall rate was only slightly higher than that
for the RP, as demonstrated by the plotted IQR, and mean (HP = 4.2 mm.d− 1, RP = 4.1 mm.d− 1) and median (HP = 3.8 mm.d− 1, RP = 3.7 mm.d− 1) values (Fig. 6j,
Table 2).
5 Discussion
Using the SAAO meteorological record, we present the longest station-based rainfall seasonality record for Cape Town, within South Africa’s WRZ. This long-
term record is particularly valuable for trend analysis as trend evolution can be explored meaningfully and in detail as has been done here using the SQMKT
(Ndebele et al. 2020), and the influence of interdecadal variability on trend magnitude and direction is limited compared to that for shorter records (e.g. Roffe
et al. 2021a). While this is the case, it is important to acknowledge that the quasi-periodicities evident from the SQMKT plots can make detection and
interpretation of long-term trends difficult, thus necessitating consideration of trend evolution for long-term records (Wolski et al. 2021). Although we do not
further explore these periodicities, as this is beyond our paper scope, these periodicities, especially for the wet- and dry-season totals, would likely be similar to
those detected by Dieppois et al. (2016), Ndebele et al. (2020) and Wolski et al. (2021). Nevertheless, our results reflect that rainfall seasonality, expressed here
by variables measuring the degree of seasonality and the duration, intensity, magnitude and timing of wet- and dry-season rainfall, has, for 1841–2020,
undergone a significant change for some of the variables considered. Note that the rainfall seasonality trends quantified here tentatively extend across the
southwestern Cape region, containing Cape Town’s supply dams (Fig. 1). This is argued based on results from Wolski et al. (2021), as trends for stations
across the southwestern Cape region they defined, based on interannual rainfall variability patterns, are largely consistent, particularly in direction, throughout
the various temporal periods they considered. As rainfall seasonality characteristics represent surface responses of weather systems (Lennard and Hegerl
Page 9/192015), the changes quantified here are likely largely driven by weather system changes which are primarily driven by hemispheric-scale atmospheric
circulation changes (Sousa et al. 2018; Burls et al. 2019). As our aim is only to explore how Cape Town’s rainfall seasonality characteristics have changed
during 1841–2020, we only tentatively discuss trend drivers.
Results from the ratio and percentile-based seasonality metric demonstrate strong agreement, reflecting a trend towards stronger WRZ conditions. This trend
and agreement, evident from the score and wet-season (and dry-season) length trend directions and the SQMKT results thereof, exists throughout 1841–2020,
though trends are stronger for 1933–2020. The changes in seasonality timing are thus a degree of seasonality increase, with scores tending away from zero,
and a wet-season (dry-season) shortening (lengthening); a result consistent with observed and projected trends for the southwestern Cape (Li et al. 2016;
Pascale et al. 2016; du Plessis and Schloms 2017; Dunning et al. 2018; Jury 2020; Ndebele et al. 2020; Wolski et al. 2021). Although rainfall declines detected,
across the southwestern Cape, for spring (September-November) or months therein are argued to reflect earlier end-dates (du Plessis and Schloms 2017; Jury
2020; Ndebele et al. 2020), our results do not necessarily reflect end-date changes during 1841–2020, but instead the end-dates varied substantially; this
variability has seemingly increased for recent decades. The trend in wet-season duration is thus primarily driven by later (earlier) wet-season (dry-season)
start-dates (end-dates), which is near-significant for 1841–2020 and significant for 1933–2020. This is supported by our comparative analysis, and by later
wet-season start-date and autumn (March-May) drying trends quantified for recent decades, from ~ 1980, for Cape Town and the southwestern Cape,
respectively (Mahlalela et al. 2019; Roffe et al. 2021a; Wolski et al. 2021). Considering drivers behind the wet-season (and dry-season) timing changes, it is
likely that the later start-date trend is linked to increases in the frequency of post-frontal SAA ridging high-pressure systems recorded for 1979–2017, which is
likely driven by Hadley cell expansion and descending branch intensification, especially in Autumn (Grise et al. 2018; Burls et al. 2019; Mahlobo et al. 2019).
This is supported by Mahlalela et al. (2019) who link dry early winter (April-May) periods, which coincide with the timing of most SAAO start-dates, to an
increased frequency of SAA ridging high-pressure systems, across the southwestern Cape. Further, Mahlalela et al. (2019) note that the driest winters during
1979–2017 occurred after 2000, which corresponds to a significant later start-date trend, from ~ 2007 according to our SQMKT results.
Our results consistently demonstrate that the wet-season has become drier. Wet-season totals have declined since ~ 1881, or ~ 1892 at least, and our
comparative analysis results demonstrate that this reduction is one of the most distinct rainfall seasonality changes to have occurred during 1841–2020. The
winter wet-season drying trend, being the strongest direct driver of the 2015–2017 ‘Day Zero’ drought, is among the most robustly projected rainfall changes in
response to anthropogenically induced climate change (Dunning et al. 2018; Mahlalela et al. 2019; Pascale et al. 2020; Lim Kam Sian et al. 2021), and it is
significant for recent decades for Cape Town (Roffe et al. 2021a). Numerous studies have attributed this drying trend to an observed poleward expansion of
the subtropical high-pressure belt and migration of the westerlies (Sousa et al. 2018; Burls et al. 2019; Mahlalela et al. 2019), and it is very likely that these
trends will persist until the end of the century, at least (Engelbrecht et al. 2009; Chavaillaz et al. 2013; Fahad et al. 2020). Results from literature suggest these
trends have manifested as a decline in the frequency of winter rain-bearing circulation features, cold fronts in particular, with an increased frequency of dry
circulation features such as SAA ridging high-pressure systems (Lennard and Hegerl 2015; Sousa et al. 2018; Burls et al. 2019; Mahlalela et al. 2019; Odoulami
et al. 2021). Burls et al. (2019) additionally demonstrate that, due to increased post-frontal SAA ridging, the duration and intensity of cold front rainfall events
has declined since ~ 1979. This is linked to a long-term decline, since ~ 1900, in rain day counts and a more recent decline, since ~ 2010, in rainfall intensity
for the April-September winter wet-season (Burls et al. 2019). This is supported by our results of a decline in wet-season rain day counts throughout 1841–
2020, but more prominently since 1933, and of a more recent daily rainfall rate decline since ~ 2009.
Evidently, the dry-season has also become drier. This trend is significant from 1933, or more specifically from ~ 1955/56, and our comparative analysis results
robustly reflect reduced RP dry-season totals. Our results also reflect a significant decline, since ~ 1949/50 at the least, in the dry-season rain day counts and
during recent decades, from ~ 1996/97 or ~ 2001/02 at least, the daily rainfall rate has also declined. Thus, together with the wet-season rainfall decline, the
dry-season rainfall decline has contributed to an increasing duration, frequency and intensity of drought periods for Cape Town and the southwestern Cape
region recorded since ~ 1985 (Botai et al. 2017; De Kock et al. 2021). Notably, dry-season rainfall has received limited research attention, despite its
importance in mitigating drought impacts through a contribution to increasing dam levels, especially from large dry-season rainfall events (De Kock et al.
2021; Wolski et al. 2021). Despite this, much evidence exists for long-term drying during the dry-season, or months therein (Ndebele et al. 2020; De Kock et al.
2021; Wolski et al. 2021). Although limited evidence exists for changes in the dry-season rain day counts and daily rainfall rate, for Cape Town and the
southwestern Cape Mackellar et al. (2014) demonstrate declines in summer (December-February) rain day counts for 1960–2010. Considering drivers behind
the dry-season rainfall changes, it is likely that these are consistent with the hemispheric-scale drivers of wet-season rainfall changes. Not only is this
suggested by De Kock et al. (2021) and Wolski et al. (2021), but similar patterns of cyclicity across our SQMKT wet- and dry-season results reflects similar
trend drivers. Thus, the dry-season trends are similarly linked to a stronger and farther south and expanded SAA, induced by Hadley cell expansion and
descending branch intensification (Sousa et al. 2018; Mahlobo et al. 2019; Jury 2020; De Kock et al. 2021; Wolski et al. 2021). Declines in the rainfall
contributions from atmospheric rivers and cut-off lows are detected for dry-season months from 1979/80 and are similarly consistent with recorded poleward
deviations of the westerlies (De Kock et al. 2021). Rainfall declines can also be linked to an observed summer increase in dry circulation types associated with
subsidence (Lennard and Hegerl 2015; Jury 2020; Odoulami et al. 2021). Again, it should be highlighted that these hemispheric dynamics, identified as drivers
behind dry-season rainfall changes, are expected to change in a similar manner in the future (Engelbrecht et al. 2009; Chavaillaz et al. 2013; Fahad et al.
2020).
Strong consistency between the trend, SQMKT and comparative analysis results provides corroboration for the nature of seasonality trends quantified here,
while strong agreement with seasonality projections, especially for recent decades, suggests these trends may continue (Pascale et al. 2016; Dunning et al.
2018). The consistency and robustness of observed and projected trajectories of the Hadley cell and mid-latitude westerlies (Yin et al. 2005; Lu et al. 2007;
Chavaillaz et al. 2013; Nguyen et al. 2015; Sousa et al. 2018; Mahlobo et al. 2019; Fahad et al. 2020), similarly suggests that trends detected for recent
decades are likely to continue. Thus, coupled with increasing temperatures (Lakhraj-Govender et al. 2017), our results of drier conditions during the wet- and
dry-season, which is supported by copious evidence from the literature, demonstrates that Cape Town will likely experience increasing water stress. As such,
water resource management and planning need to focus on reducing the risks and vulnerability associated with changing rainfall regimes. Water conservation
Page 10/19and management strategies, such as recycling, water supply diversification (e.g. desalination and groundwater extraction), ecosystem-based approaches (e.g.
removal of invasive vegetation, ensuring more water reaches dams) and awareness initiatives, implemented not only in response to the 2015–2017 ‘Day Zero’
water crisis, but in general, must continue and be improved on (e.g. Booysen et al. 2019).
As for any study, there are limitations, and here these arise from the use of long-term data. For the SAAO record, limitations hinder establishment of dataset
homogeneity and include no existing reference series for 1841–1899 and little metadata found for instrumental type, changes in instrumentation and location,
and recording methods and times (Lakhraj-Govender et al. 2017; Picas et al. 2019). The rainfall record has, for the most part, been based on manually derived
daily rain gauge readings from the SAAO gardens (Ndebele et al. 2020), however, during 2009 an automatic station was installed (Glass 2018). For the
temperature record, several changes in recording times and methods occurred throughout 1841–2020 (Lakhraj-Govender et al. 2017; Picas and Grab 2020).
Recent records, from 2009, are captured hourly by automatic stations, whereas earlier records were manually captured at varying times (Lakhraj-Govender et
al. 2017; Picas and Grab 2020). With no station relocation records, it can be assumed that the SAAO monitoring station has remained in the same location
(Lakhraj-Govender et al. 2017; Ndebele et al. 2020; Picas and Grab 2020). Thus, the main limitation, besides that of the data gap for 1900–1933, underlying
our results is that our records were not homogenized to account for changes in instrumental type and recording times. Records for 1841–1899 are
comparable to recent records, which increases confidence in the reliability of these (Ndebele et al. 2020; Picas and Grab 2020), and results from Lakhraj-
Govender et al. (2017) reflect little change in trend magnitude and no change in trend direction for the SAAO 1933–2013 temperature series following
homogenization adjustments. Thus, this improves confidence in our results.
6 Conclusion
Based on the longest record of rainfall seasonality characteristics for Cape Town within South Africa’s WRZ, we demonstrate value in using long-term records
to explore rainfall regime trends in detail. This is particularly evident from our SQMKT application which demonstrates a complex temporal pattern for Cape
Town’s rainfall seasonality characteristics for 1841–2020 and reveals much value in exploring trend evolution, beyond simply considering overall trend
magnitudes and directions for arbitrarily defined periods. Together with evidence from projected rainfall seasonality trends for Cape Town, which correspond
to our findings, we provide an example of the likely rainfall seasonality patterns to occur across Cape Town in future decades. Our findings particularly
highlight trends towards shorter, later starting and drier wet-seasons together with longer and drier dry-seasons, and have important implications for rainfall
sensitive activities. Thus, our findings can contribute to water resource management strategies for Cape Town and the broader southwestern Cape region; a
region already vulnerable to rainfall regime changes. If scientific evidence is considered properly for such strategies, then the impacts of future extreme multi-
year droughts, which are projected with much robustness (Otto et al. 2018; Pascale et al. 2020), may be mitigated considerably.
Declarations
Acknowledgments
We thank the South African Weather Service for providing weather station data for 1933-2020 and Nothabo Ndebele for providing cleaned and quality
controlled daily rainfall data for 1841-1899 for the South African Astronomical Observatory.
Funding information
SJR acknowledges funding from the University of the Witwatersrand Faculty of Science Research Committee. JMF is funded by the DSI-NRF Centre of
Excellence for Palaeoscience.
Conflict of interest
The authors declare no conflict of interest.
Availability of data
Data for 1841-1899 can be obtained by direct request to the authors. Data for 1933-2020 can be obtained through a direct request to the South African
Weather Service (SAWS).
Code availability
Not applicable.
Author contributions
SJR, JS and JMF conceptualised the topic of this paper. SJR conducted all statistical analyses with input from JS and JMF. SJR compiled the manuscript,
and JS and JMF provided input on the various drafts.
Consent for publication
All authors agree to the publication of this manuscript.
Ethics approval
Not applicable
Page 11/19Consent to participate
Not applicable
References
1. Aguilar E, Auer I, Brunet M, Peterson TC, Wieringa J (2003) Guidance on metadata and homogenization, 1186. World Meteorological Organization
Technical Document no, p 53
2. Beaulieu C, Chen J, Sarmiento JL (2012) Change-point analysis as a tool to detect abrupt climate variations. Philos T R Soc A 370(1962):1228–1249.
https://doi.org/10.1098/rsta.2011.0383
3. Blamey RC, Ramos AM, Trigo RM, Tomé R, Reason CJC (2018) The influence of atmospheric rivers over the South Atlantic on winter rainfall in South
Africa. J Hydrometeorol 19(1):127–142. https://doi.org/10.1175/JHM-D-17-0111.1
4. Blamey R, Reason CJC (2007) Relationships between Antarctic sea-ice and South African winter rainfall. Clim Res 33:183–193.
https://doi.org/10.3354/cr033183
5. Booysen MJ, Rpunda C, Visser M (2019) Results from a water-saving maintenance campaign at Cape Town schools in the run-up to Day Zero. Sustain
Cities Soc 50:101639. https://doi.org/10.1016/j.scs.2019.101639
6. Botai CM, Botai JO, de Wit JP, Ncongwane KP, Adeola AM (2017) Drought characteristics over the Western Cape province, South Africa. Water 9(11):876.
https://doi.org/10.3390/w9110876
7. Burls NJ, Blamey RC, Cash BA, Swenson ET, Fahad M, Bopape MJM, Straus DM, Reason CJ (2019) The Cape Town “Day Zero” drought and Hadley cell
expansion. Npj Clim Atmos Sci 2:27. https://doi.org/10.1038/s41612-019-0084-6
8. Chavaillaz Y, Codron F, Kageyama M (2013) Southern westerlies in LGM and future (RCP 4.5) climates. Clim Past 9(2):517–524.
https://doi.org/10.5194/cp-9-517-2013
9. De Kock WM, Blamey RC, Reason CJC (2021) Large summer rainfall events and their importance in mitigating droughts over the South Western Cape,
South Africa. J Hydrometeorol 22(3):587–599. https://doi.org/10.1175/JHM-D-20-0123.1
10. Dieppois B, Pohl B, Rouault M, New M, Lawler D, Keenlyside N (2016) Interannual to interdecadal variability of winter and summer southern African
rainfall, and their teleconnections. J Geophys Res-Atmos 121(11):405–442. https://doi.org/10.1002/2015JD024576
11. du Plessis JA, Schloms B (2017) An investigation into the evidence of seasonal rainfall pattern shifts in the Western Cape, South Africa. J S Afr Inst Civ
Eng 59(4):47–55. http://dx.doi.org/10.17159/2309-8775/2017/v59n4a5
12. Dunning CM, Black EC, Allan RP (2018) Later wet seasons with more intense rainfall over Africa under future climate change. J Clim 31(23):9719–9738.
https://doi.org/10.1175/JCLI-D-18-0102.1
13. Durre I, Menne MJ, Gleason BE, Houston TG, Vose RS (2010) Comprehensive automated quality assurance of daily surface observations. J Appl Meteorol
Climatol 49(8):1615–1633. https://doi.org/10.1175/2010JAMC2375.1
14. Dyson LL (2009) Heavy daily-rainfall characteristics over the Gauteng Province. Water SA 35(5):627–638. https://doi.org/10.4314/wsa.v35i5.49188
15. Engelbrecht FA, McGregor JL, Engelbrecht CJ (2009) Dynamics of the Conformal-Cubic Atmospheric Model projected climate-change signal over southern
Africa. Int J Climatol 29(7):1013–1033. https://doi.org/10.1002/joc.1742
16. Fahad AA, Burls NJ, Strasberg Z (2020) How will southern hemisphere subtropical anticyclones respond to global warming? Mechanisms and seasonality
in CMIP5 and CMIP6 model projections. Clim Dyn 55:703–718. https://doi.org/10.1007/s00382-020-05290-7
17. Favre A, Hewitson B, Lennard C, Cerezo-Mota R, Tadross M (2013) Cut-off lows in the South Africa region and their contribution to precipitation. Clim Dyn
41:2331–2351. https://doi.org/10.1007/s00382-012-1579-6
18. George J, Athira P (2020) Long-term changes in climatic variables over the Bharathapuzha river basin, Kerala, India. Theor Appl Climatol 142:269–286.
https://doi.org/10.1007/s00704-020-03255-8
19. Glass IS (2018) The Royal Observatory rainfall records. Mon Notes Astron Soc S Afr 77(5–6):77–80. https://hdl.handle.net/10520/EJC-1342b9d7f0
20. Grise KM, Davis SM, Staten PW, Adam O (2018) Regional and seasonal characteristics of the recent expansion of the Tropics. J Clim 31(17):6839–6856.
https://doi.org/10.1175/JCLI-D-18-0060.1
21. Hekmatzadeh AA, Kaboli S, Torabi Haghighi A (2020) New indices for assessing changes in seasons and in timing characteristics of air temperature.
Theor Appl Climatol 140:1247–1261. https://doi.org/10.1007/s00704-020-03156-w
22. Jury MR (2020) Climate trends in the Cape Town area, South Africa. Water SA 46(3):438–447. https://doi.org.10.17159/wsa/2020.v46.i3.8654
23. Lakhraj-Govender R, Grab S, Ndebele NE (2017) A homogenized long-term temperature record for the Western Cape Province in South Africa: 1916–2013.
Int J Climatol 37(5):2337–2353. https://doi.org/10.1002/joc.4849
24. Lennard C, Hegerl G (2015) Relating changes in synoptic circulation to the surface rainfall response using self-organising maps. Clim Dyn 44:861–879.
https://doi.org/10.1007/s00382-014-2169-6
25. Li X, Hu ZZ, Jiang X, Li Y, Gao Z, Yang S, Zhu J, Jha B (2016) Trend and seasonality of land precipitation in observations and CMIP5 model simulations.
Int J Climatol 36(11):3781–3793. https://doi.org/10.1002/joc.4592
26. Lim Kam Sian KTC, Wang J, Ayugi BO, Nooni IK, Ongoma V (2021) Multi-Decadal Variability and Future Changes in Precipitation over Southern Africa.
Atmosphere 12(6):742. https://doi.org/10.3390/atmos12060742
Page 12/19You can also read


