Intelligent long term performance analysis in power electronics systems - Nature
←
→
Page content transcription
If your browser does not render page correctly, please read the page content below
www.nature.com/scientificreports
OPEN Intelligent long‑term performance
analysis in power electronics
systems
Saeed Peyghami1*, Tomislav Dragicevic2 & Frede Blaabjerg1
This paper proposes a long-term performance indicator for power electronic converters based on their
reliability. The converter reliability is represented by the proposed constant lifetime curves, which
have been developed using Artificial Neural Network (ANN) under different operating conditions.
Unlike the state-of-the-art theoretical reliability modeling approaches, which employ detailed
electro-thermal characteristics and lifetime models of converter components, the proposed method
provides a nonparametric surrogate model of the converter based on limited non-linear data from
theoretical reliability analysis. The proposed approach can quickly predict the converter lifetime under
given operating conditions without a further need for extended, time-consuming electro-thermal
analysis. Moreover, the proposed lifetime curves can present the long-term performance of converters
facilitating optimal system-level design for reliability, reliable operation and maintenance planning in
power electronic systems. Numerical case studies evaluate the effectiveness of the proposed reliability
modeling approach.
Long-term performance and reliability of a power electronic converter have gained increasing interest for opti-
mal design and operation of power electronic s ystems1. So far, the short-term characteristics of converters, such
as fault ride through capability, and voltage/frequency/power quality support, have been taken into account
for design and manufacturing, which are also covered by some standards such as IEC 621092 and IEEE 15473.
However, weak long-term performance of a converter will introduce more operational and maintenance costs
compared to the manufacturing c osts4,5. This is due to the fact that the power electronic converters contain fail-
ure-prone parts such as power devices which are also prone to wear-out failures according to the field experience6.
Therefore, reliability modeling in modern power electronic based power systems is of paramount importance.
In the conventional power engineering, the reliability is modeled based on historical data provided by the
system operator or handbooks such as MIL 2 177. However, these approaches suffer from poor accuracy. Moreo-
ver, they have failed to identify the weakest points of converters, thus not suitable for reliability r einforcement8.
Due to this fact, physics of failure analysis based approaches have been introduced in recent decade to assess
and enhance the reliability of converters1,9–15. Meanwhile, these approaches are still the method of choice used
in power system reliability engineering. In recent decade, in power electronics engineering model-based reli-
ability analysis on the basis of physics of failures is developed to model the impact of different failure sources
and mechanisms on the reliability of converters. According to this method, Stress-Strength Analysis (SSA) is
performed to obtain the aging probability of converter components taken into account the various uncertain-
ties. The models used for strength of components are obtained either empirically or t heoretically6,16,17, which are
modeling the aging process of power d evices7. The validation of the models for converter reliability prediction
with power cycling tests has been addressed in the literature e.g., in16. In fact, physics of failure analysis is one
step ahead of power system reliability engineering, which just relied on historical data without considering the
mission-profile based aging of converters.
This concept has been widely applied for photovoltaic and wind power applications1,6,18 in order to design
the converter or improve its reliability under a given mission profile. In general applications such as battery
storage systems, electric vehicle chargers, interlinking converters in micro-grids, and multi-terminal DC grids,
such converters are facing different operating conditions depending on power system demand and generation.
Thereby, following the grid generation and demand, the converter operating condition will be different. As a
result, estimating the converter lifetime for various operating conditions can be time-consuming considering the
electro-thermal modeling and Monte Carlo a nalysis7,18–22. Moreover, power networks are complicated systems
of systems that include huge number of components. Using stress-strength analysis for reliability modeling for
1
Department of Energy Technology, Aalborg University, 9220 Aalborg, Denmark. 2Department of Electrical
Engineering, Technical University of Denmark, 2800 Kgs. Lyngby, Denmark. *email: sap@et.aau.dk
Scientific Reports | (2021) 11:7557 | https://doi.org/10.1038/s41598-021-87165-3 1
Vol.:(0123456789)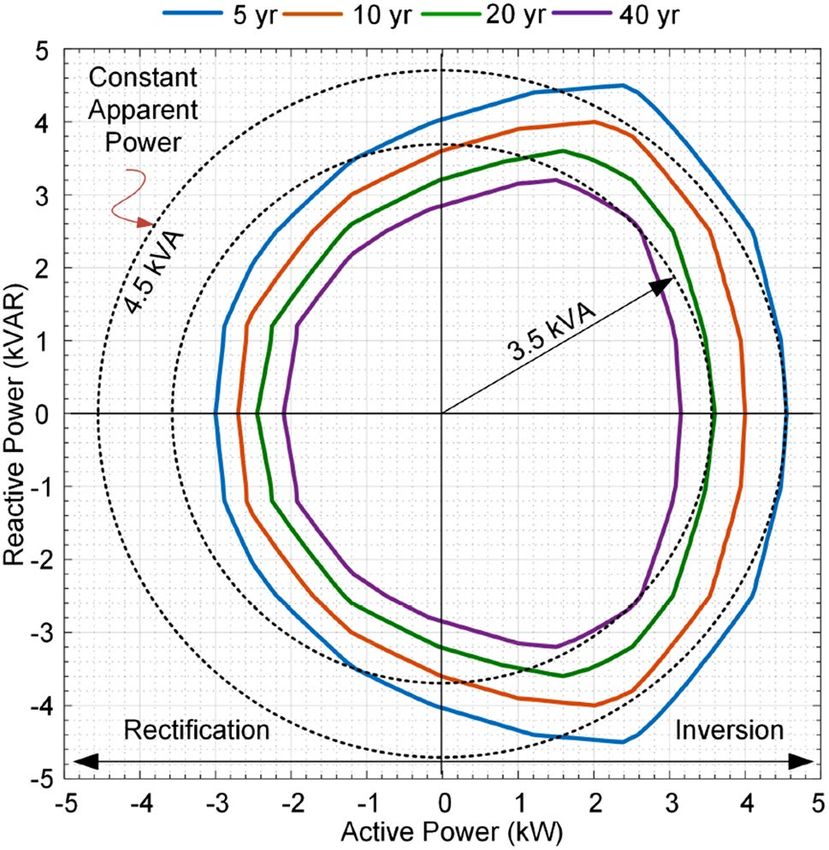
www.nature.com/scientificreports/
each converter is not possible in practice. This is due to the fact that the SSA requires to have detailed electro-
thermal characteristics and lifetime models of the converter components. Furthermore, in the most cases, the
detailed electro-thermal models and applied control systems are not provided by manufacturers. Therefore, in
order to have optimal design, planning and operation in modern power systems, an accurate, at the same time,
simple reliability models for converters are essential.
This is the main motivation to introduce a new modeling approach for reliability of power electronic convert-
ers as one of the most failure prone component in power systems, where AI is deployed to simplify the stress-
strength analysis and make it computationally feasible when a large number of components is considered. AI
is used as a surrogate lifetime estimator where there is no need for detailed electro-thermal and stress-strength
analysis for power system-level applications. This will facilitate rapid reliability analysis in power systems with
large number of components. This paper presents how to use model-based reliability approaches with the help
of AI for power system reliability analysis. It is worth to mention that the reliability of power converters has
been deeply addressed in power electronic engineering, while in system-level, i.e., power system engineering,
model-based reliability analysis is in the early stage. This is due to the fact that power system is a complicated
system and model-based approaches are very time consuming and are not applicable for these systems. Using
simplified model will help to incorporate model based analysis in power system engineering. Using model-based
approaches helps to have accurate model for reliability assessment and enhancement based on the physics of
failures, ultimately leading to optimal decision-makings.
Therefore, this paper proposes a new reliability modeling approach for power electronic converters by intro-
ducing a new lifetime-based performance indicator for converters. The converter reliability is represented by
constant lifetime curves. These curves cover the entire operating span of a converter in the active-reactive
power plane. In order to obtain these lifetime curves, an Artificial Neural Network (ANN) is employed as a
nonparametric surrogate model for a converter performance indicator. Hence, it models the converter reliability
precisely without using detailed converter component information. In the first step, the converter reliability is
estimated in limited operating points using the SSA. Notably, these data can be provided by manufacturers for
limited points on the proposed curves as well. Then the ANN is used as a nonparametric surrogate model of the
converter to quickly estimate the constant lifetime curves for the entire operating conditions. Furthermore, the
proposed curves as the power converter performance index are used for estimating the converter lifetime under
different operating mission profiles without using any detailed electro-thermal models and SSA. As a result,
the proposed ANN-based approach can facilitate the lifetime prediction of the converters in order to provide
a wide range of lifetime curves for different operating conditions. Furthermore, the proposed reliability curves
with the help of ANN can be used at system-level for an optimal design for reliability, optimal operation and
maintenance planning in PEPSs.
In the following, the proposed power converter long-term performance indicator is explained in “Proposed
long-term lifetime performance indicator”. The converter reliability prediction approach based on electro-thermal
analysis is explained in “Reliability prediction in converters”. Furthermore, “Proposed AI-based reliability pre-
diction” presents the proposed AI-based reliability modeling method and its application in predicting converter
performance indicator. Numerical analysis is provided in “Numerical analysis” illustrating the effectiveness of the
proposed method. Moreover, the system level application of proposed AI-based indicator in reliable operation
of a PEPS is demonstrated in “Power system-level application”. Finally, the outcomes are summarized in “Power
system-level application” including future perspectives.
Proposed long‑term lifetime performance indicator
A power electronic converter is usually designed for a specific application with specific input, output, and general
characteristics such as input/output voltage, operating frequency, rated power, reactive power support, total har-
monic distortion and efficiency. These characteristics indicate the short-term data provided by manufacturers,
while the long-term performance of a converter—e.g., its reliability—may not be provided in the datasheets. So
far, there is no standard for long-term performance testing and measuring of converters unlike the short-term
performance23. Moreover, the converter reliability depends on the operating and environmental conditions. The
converter loading, ambient temperature, humidity and vibration are also some of the factors affecting the lifetime
of the converter components. Therefore, unlike the short-term indicators, the reliability cannot be presented by
just a single number in a converter datasheet.
However, the converter lifetime is a key factor affecting the initial investment and the economic analysis of
a project where its replacement and maintenance costs might become higher than the manufacturing costs. In
practice, especially during planning, operation and maintenance scheduling, converter reliability behavior is of
paramount importance. Therefore, providing lifetime characteristics of converters by manufacturers can facilitate
planning, economical decision-making, operational planning, maintenance scheduling and system-level design
for reliability in PEPSs.
For instance, if the converter performance index is provided, its lifetime can be predicted according to opera-
tion and climate conditions estimation. Hence, the obtained lifetime can be used for system-level planning,
operation and design for reliability purposes. Moreover, this indicator can be implemented in the converter
control system as shown in Fig. 1. Using the operating condition and climate data within a specified time period,
e.g., every month, the performance indicator can be estimated. Hence, this indicator can be used to monitor
the converter lifetime and managing its lifetime. This can be performed by power-sharing control24 for adjust-
ing the converter loading. Moreover, the performance indicator can be used within operational planning and
maintenance scheduling. The converter lifetime can be used for preventive maintenance activities, which can
facilitate the optimal operation of converters in power systems. In practice, a converter can be used for different
applications. Even if it is used for an identical application, the operating conditions are not necessarily identical.
Scientific Reports | (2021) 11:7557 | https://doi.org/10.1038/s41598-021-87165-3 2
Vol:.(1234567890)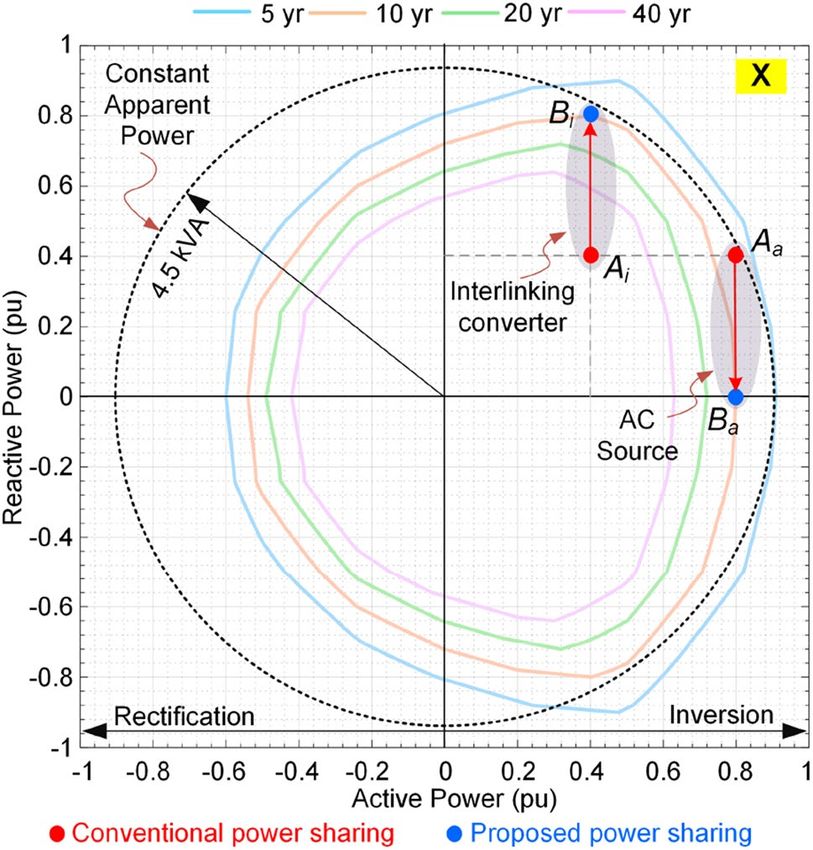
www.nature.com/scientificreports/
Figure 1. Hierarchical control structure of a power converter with proposed AI-based performance index
estimator.
For instance, solar inverters experience different loading due to climate conditions (e.g., irradiance and tem-
perature). Moreover, loading of an HVDC converter between two areas varies, or an interlinking converter in
microgrids depending on demands and energy management strategies. The same arguments are valid for other
applications such as motor drives, electric vehicle chargers, and so on.
As already mentioned, there are different factors affecting the converter lifetime. A converter failure can
occur due to random or systematic causes19. Systematic failures have non-physical causes such as design error,
installation error, etc. Moreover, the random failures happen in a random time due to one or more degradation
mechanisms in hardware. Random hardware failure may be induced by overstressing or aging of components19.
The first one is known as random chance failures which depend on a sudden change in operating conditions
such as grid faults. This could be modeled by historical field-return reliability data. However, the random wear-
out failures depend on the physical strength of components and applied stress to the potential failure cites of
components. Therefore, wear-out failure can be modeled by stress-strength analysis for all the converter fragile
components17,19,20,25.
Predicting the converter wear-out failure probability for different operating conditions require detailed char-
acteristics and lifetime models of its components. Moreover, lifetime prediction for different operating conditions
is time-consuming. In order to facilitate the lifetime prediction in power converters, this paper proposes an AI-
based reliability prediction approach for estimating its long-term performance. The proposed approach is shown
in Fig. 2. According to Fig. 2a, the converter lifetime, L for a limited set of operating conditions is predicted based
on the stress-strength analysis. These data can be provided by the manufacturers either using Accelerated Life
Test (ALT) or Filed Returned Data (FRD) as well. Then, an ANN is trained based on given operating data and
obtained lifetimes. Afterward, the converter long-term performance indicator is predicted for the whole span
of operating conditions. This performance indicator can thus be used to predict the converter lifetime operating
under different mission profiles as shown in Fig. 2b. In fact, the proposed method is used to predict the converter
reliability for a specific application using the limited reliability data provided by the manufacturers (i.e., ALT date
or FRD) or SSA with the help of AI. Notably, performing ALT for all operating conditions of a converter is not
feasible as a large number of items should be tested for each operating point. Therefore, AI can help to predict
the reliability data for the whole operation span. Furthermore, this performance indicator can be implemented in
the converter control system for control, operational planning, and maintenance activities as illustrated in Fig. 1.
One of the failure sources causing converter aging is the thermal cycling on power modules19–21 as a fragile
component of converters5,21,22,26,27. As a result, thermal cycling can limit the converter lifetime. The thermal cycles
affecting the power module lifetime can be classified into two categories including low-frequency oscillations and
fundamental line-frequency o scillations17,20. In many applications, the line-frequency impact may be dominating
the low-frequency o scillations20,28. Line-frequency cycling is a result of the electrical loading of the converter.
Therefore, the converter lifetime depends on its active and reactive powers (P and Q).
This paper proposes a long-term performance indicator for converters based on its operating conditions (P
and Q) as shown in Fig. 3. This indicator provides constant lifetime curves illustrating the converter lifetime
under the different active and reactive power supply. In this paper, the impact of loading is considered. The
impact of other parameters affecting the converter lifetime can also be taken into account in the modeling.
Similar to other converter characteristics such as efficiency, total harmonic distortion, safe operating area, this
Scientific Reports | (2021) 11:7557 | https://doi.org/10.1038/s41598-021-87165-3 3
Vol.:(0123456789)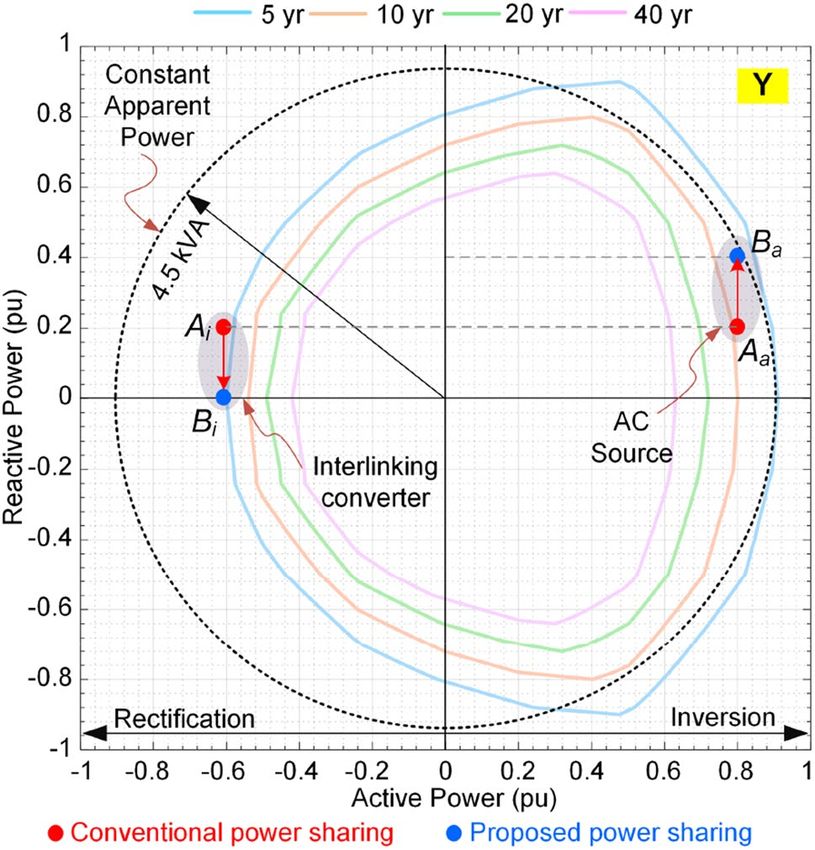
www.nature.com/scientificreports/
Figure 2. Proposed AI-based long-term performance prediction in converters, (a) performance indicator
prediction, (b) application of performance index in lifetime estimation. *SSA stress-strength analysis, ALT
accelerated life test, FRD field returned data.
Figure 3. Proposed B10 lifetime curves as long-term operation life performance index for a single-phase
converter associated with its 90% reliability.
index provides another measure of converter performance. Therefore, without analyzing the electro-thermal
behavior of the converter, its lifetime can be predicted using these curves. Following this indicator, the converter
B10 lifetime, the period that the converter reliability is equal to 90%—which can be provided for other B x val-
ues—can be predicted following its operating condition. Notably, this indicator is associated with the converter
loading, while other operating conditions such as humidity can be included by adding several dimensions to the
performance index. This can be used for design for reliability in power electronic-based power systems as well as
for system-level economical decision making for planning and maintenance in power systems. In the following,
Scientific Reports | (2021) 11:7557 | https://doi.org/10.1038/s41598-021-87165-3 4
Vol:.(1234567890)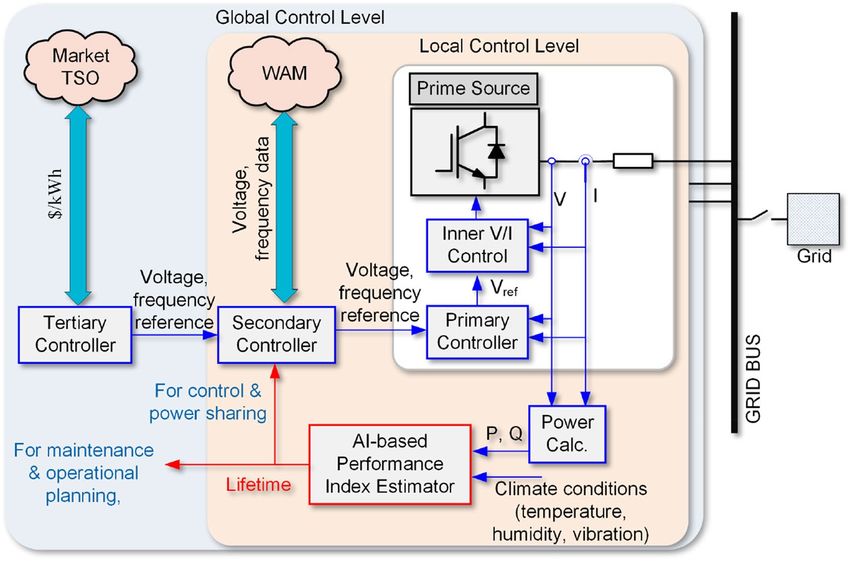
www.nature.com/scientificreports/
Figure 4. Wear-out failure probability modeling of power modules used in a power converter.
the prediction procedure of lifetime indictor in Fig. 3 is explained. Afterward, the proposed application of AI in
converter reliability estimation is presented.
Reliability prediction in converters
The converter reliability depends on various factors including component characteristics, operation conditions,
control and so on. According to the recent field data6, power modules are one of the main failure sources in such
converters and the power switches are considered to model the overall converter lifetime. The lifetime of power
devices can be predicted by the number of thermal cycles to failure, Nf which is given as:
−0.3
β ton
Nf = A · �Tjα · exp · (1)
Tjm 1.5
where, ΔTj denotes junction temperature swing, Tjm is its minimum value, and ton is the thermal heating t ime29.
According to29, A = 9.34 × 10E14, α = – 4.416 and β = 1290. Following (1), the junction temperature and its swing
will affect the converter reliability. The junction temperature is associated with the loading of the converter. The
converter loading is related to its application and its loading (mission). For instance, the loading of a solar inverter
depends on solar irradiance. In order to find the converter lifetime, its electrical loading is transferred to the
thermal variables by electro-thermal analysis as shown in Fig. 4. Then, the active and reactive powers are con-
verted to the junction temperature and temperature swing. Afterward, the number of cycles to failure for the
given loading condition is obtained by using (1). As already mentioned, the junction temperature swing is divided
into low-frequency and line-frequency terms, were the impact of the low-frequency oscillations, in some applica-
tions, on power devices lifetime is negligible. Notably, the low frequency oscillations related to the ambient
temperature are not considered in this study. Hence, the line-frequency, f, oscillations are the main source of the
thermal stress. As a result, if a converter operated under P and Q for a period of T (in years), the damage, D of
T·f
the device within T can be calculated as DT = Nf ,h (P,Q) . The annual damage, D can then be calculated as
D = DT T . The predicted lifetime is equal to the reciprocal of the annual damage. In practice, the device electrical
1
and thermal parameters, such as on state voltage, vce, on-state resistance, ron, are not identical for different samples
of a device, and hence, the predicted junction temperature has to be modified based on manufacturing uncer-
tainties. Moreover, the lifetime model parameters in (1) have some variations. These uncertainties should also
be considered in the lifetime prediction. Monte-Carlo simulations can be employed to take into account the
uncertainties to predict the device lifetime distribution as shown in Fig. 47,18,19. Therefore, the reliability of power
devices, i.e., switches, Rswitch and diodes Rdiode, is obtained as the complementary of their lifetime cumulative
distribution function. The total converter reliability is obtained as RT = Rswitch Rdiode , where, Ns and Nd
Ns Nd
denote the number of switches and diodes used in converter structure. The converter B10 lifetime under given
operating conditions is thus obtained from its reliability function RT.
As shown in Fig. 4, the reliability prediction procedure requires detailed electro-thermal analysis for power
devices. Moreover, Monte Carlo simulations are used for considering the impact of manufacturing and model
uncertainties. This process not only is time-consuming for different operating conditions, but also requires
providing detailed electro-thermal characteristics, device lifetime models and control system parameters such
as switching schemes and operating frequency. Moreover, presenting the lifetime curves in Fig. 3 for different
operating conditions requires providing huge amount of data from datasheets. Instead of providing detailed
Scientific Reports | (2021) 11:7557 | https://doi.org/10.1038/s41598-021-87165-3 5
Vol.:(0123456789)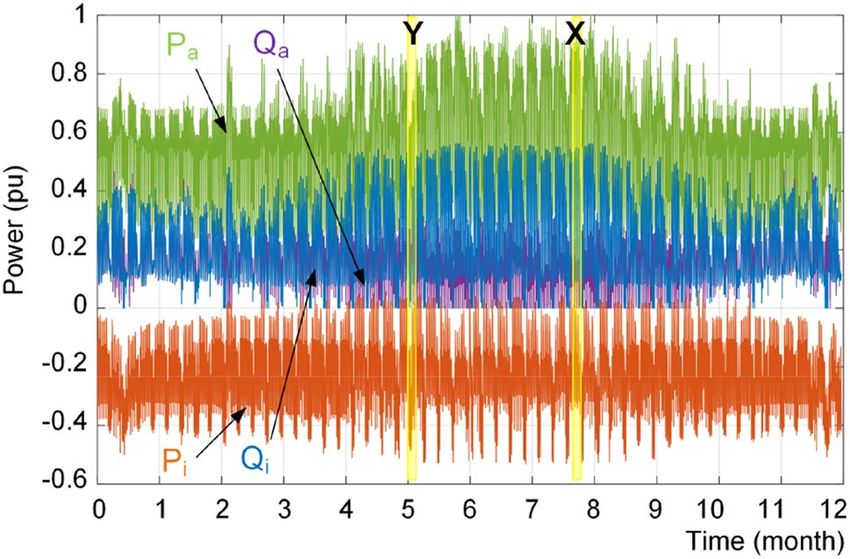
www.nature.com/scientificreports/
electro-thermal, lifetime and control system information as well as the whole lifetime curves in active-reactive
power span, the reliability performance index can be provided by the manufacturers for limited operating points.
Then, the lifetime at any operating condition can be obtained by employing AI algorithms. This will enable a
converter lifetime prediction with limited lifetime data. In the next section, the proposed AI approach for esti-
mating the converter lifetime is presented.
Proposed AI‑based reliability prediction
In order to reduce the computational burden, eliminate the need for detailed electro-thermal and lifetime mod-
els, and reduce storing huge amounts of lifetime data, the converter lifetime is predicted using an AI modeling
approach. There are various types of AI approaches—and more specifically deep learning approaches—used for
modeling non-linear, non-parametric problems including Artificial Neural Network (ANN), Recurrent Neural
Network (RNN), Convolution Neural Network (CNN) and so on. The ANN is the basic form of neural net-
works which maps the input to output in a forward direction. The RNN is a standard form of neural networks,
that is designed to recognize sequences. The RNN has been extended across time by having edges feeding into
the next time step instead of into the next layer in the same time step30–32. Moreover, CNN is a neural network
which is designed to recognize images by having convolutions inside for identifying the edges of an object on
the image33–35. The ANN is much suitable for tabular data analysis, while, the RNN and CNN are suitable for
processing and recognition of text, images, audios, videos and so on, where sequence and spatial features are
of importance.
In this paper, the AI approaches are used to model the converter reliability based on limited non-linear data.
Since the sequence and spatial features are not important, thus, the basic form of neural networks, i.e., ANN
is employed in order to predict the converter reliability. The ANN can precisely model non-linear functions
between inputs (e.g., active and reactive power) and output (e.g., lifetime). Furthermore, it does not need to
store a large amount of data which requires a large memory to store the data. Moreover, it can properly estimate
the output associated with the input data out of the data used in the training process. Hence, the ANN becomes
a surrogate model for an electro-thermal based lifetime estimator in order to quickly and precisely predict the
converter lifetime.
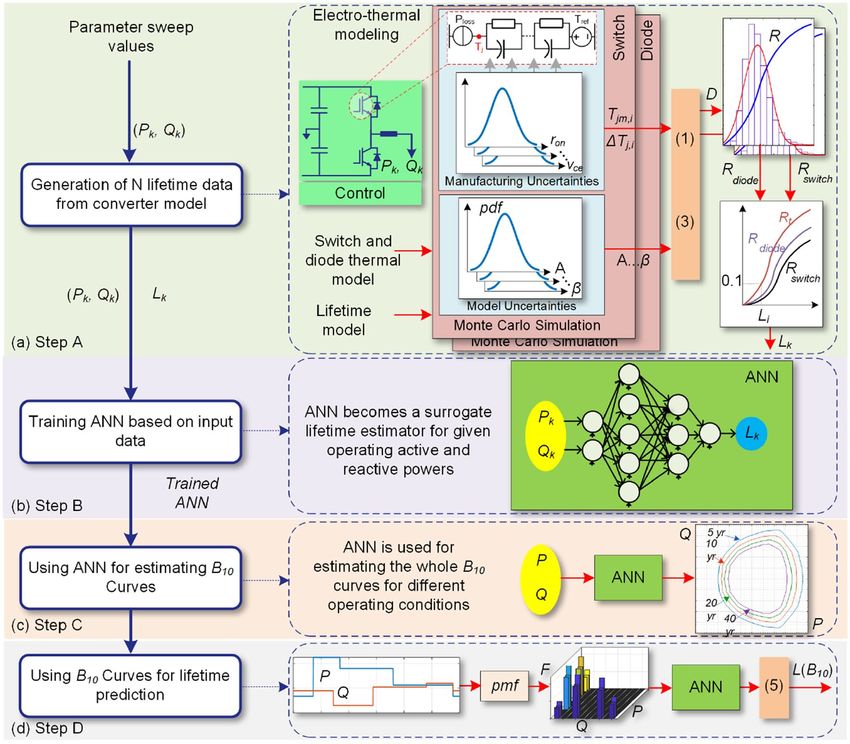
The proposed modeling procedure is shown in Fig. 5, which includes four steps. These four steps include;
(A) lifetime data generation using electro-thermal based SSA, (B) developing ANN, (C) predicting converter
performance index, and (D) predicting converter lifetime, which are explained in the following.
Step A: Generating limited lifetime data. The first step is to generate a lifetime data associated with the
limited operating conditions employing electro-thermal models and SSA as shown in Fig. 5a. This step has been
explained in “Reliability prediction in converters”, where a set of limited lifetime data Li attributed to the active
and reactive powers (Pi, Qi) are generated. Moreover, these data can also be provided by the manufacturer. In this
case, there is no need to provide electro-thermal and lifetime models which might be confidential in most cases.
Step B: Developing ANN. The generated lifetime data is used to train the ANN network in the second
step as shown in Fig. 5b. Training ANN is carried out by applying the “train” command in the MATLAB Deep
Learning Toolbox. The forward ANN comprises several layers, M with a number of neurons in each layer Nl,
1 ≤ l ≤ M as shown in Fig. 6. The neurons process the information coming from the neurons of the previous layer
to generate the input for the next layer. As a result, the output of each neuron in layer l, 1 < l < M is obtained a s36:
Nl−1
�
zil = σ ωijl zjl−1 + bil i = 1, ..., Nl , (2)
j=1
where, σ(a) = 1/(1 + exp(− a)) is a sigmoid function, ωlij is the weigh between the neuron j in layer l–1 and neuron
i in layer l, and bli is the bias terms of neuron i at layer l. For layer l = 1,
zi1 = xi i = 1, ..., N1 , (3)
and for layer l = M (last layer),
yi = ωiL ziL = i = 1, ..., NL , (4)
where, xi is the ith input and yi is the ith output. The inputs are active and reactive powers and thus, x1 = Pk,
and x2 = Qk at operating point k. The number of layers and neurons can be determined using the try-and-error
approach. In this paper, using try-and-error approach, four layers with the number of neurons in each layer equal
to N1 = 2, N2 = 5, N3 = 3 and N4 = 1 are selected as shown in Fig. 6.
According to36, the forward ANN is a universal approximator implying that the weight and bias terms can
be selected to obtain the desired resolution in approximating the relation between inputs and outputs. This can
be carried out within the training process of the forward ANN employing, e.g., back-propagation a lgorithm36.
After training the ANN, it becomes a surrogate lifetime estimator predicting the converter lifetime for a given set
of (Pk, Qk). Therefore, the converter lifetime can be obtained without using the detailed converter information.
Step C: Performance index estimation. After generating the lifetime data, and developing the ANN
as a surrogate lifetime model of the converter, its performance index can be predicted as shown in Fig. 5c. The
converter performance index is its B10 lifetime curves in the operating active and reactive power span as shown
Scientific Reports | (2021) 11:7557 | https://doi.org/10.1038/s41598-021-87165-3 6
Vol:.(1234567890)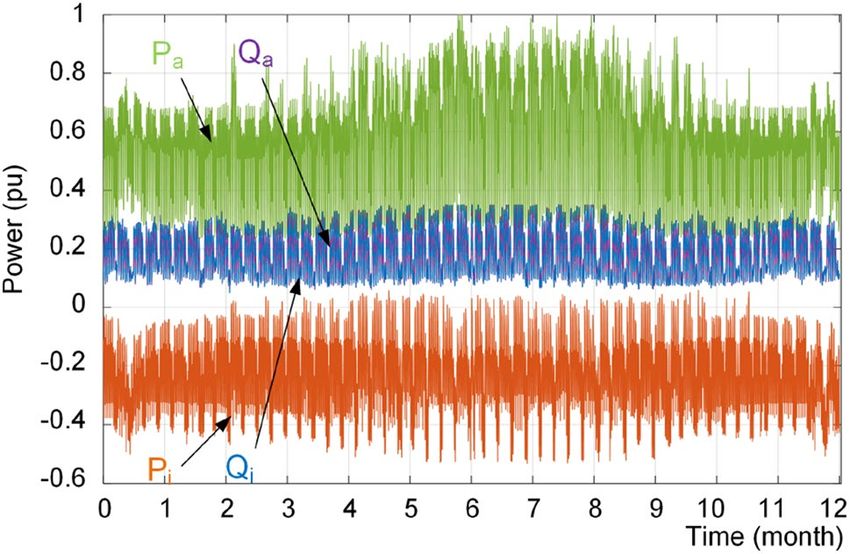
www.nature.com/scientificreports/

                                  Figure 5.  Proposed artificial intelligence-based converter lifetime prediction procedure; (a) generating
                                  reliability data, (b) training ANN, (c) B10 lifetime curve estimation, and (d) B10 lifetime prediction for a given
                                  mission profile. pmf probability mass function.

                                  Figure 6.  ANN structure. Weights and bias terms are not shown.

Scientific Reports |   (2021) 11:7557 |                https://doi.org/10.1038/s41598-021-87165-3                                                      7

                                                                                                                                                 Vol.:(0123456789)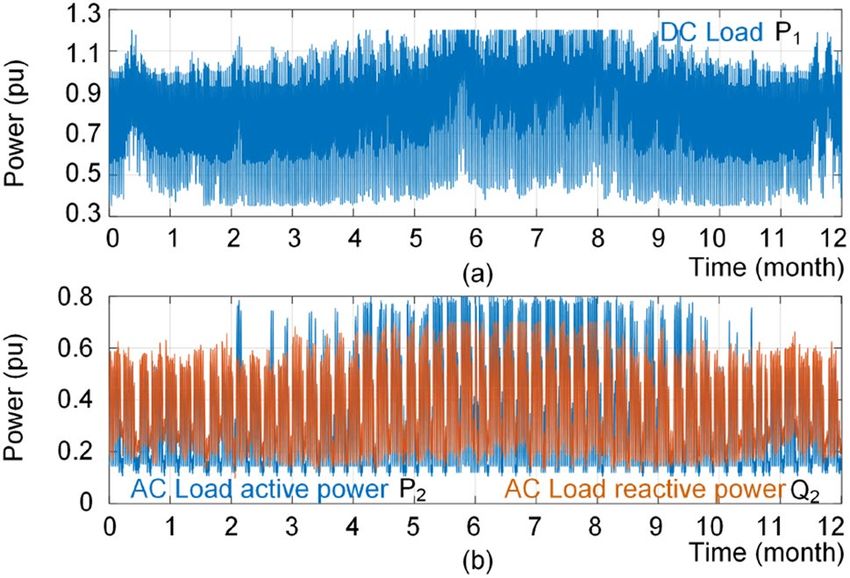
www.nature.com/scientificreports/
Figure 7. Half-bridge converter used for case studies.
Parameter Value
Rated power (kW) 5
DC voltage (V) 400
AC voltage (V) 230
Switching freq. (kHz) 20
Diode (D1, D2) IDP30E65D2
Switch (T1,T2) IGW30N60TP
Table 1. Converter parameters and devices.
in Fig. 3. As already mentioned, obtaining all points in the lifetime curves for different lifetimes using detailed
SSA is time-consuming. Therefore, the ANN is used to predict the different lifetime curves associated with dif-
ferent active and reactive power. Hence, the performance index can be obtained by the ANN employing limited
lifetime data. This fact will facilitate lifetime modeling by limiting the need for detail electro-thermal analysis
and extra information for different application of a converter under different operating conditions. Therefore,
the calculation burden will extremely be reduced. Moreover, this performance index will introduce an opportu-
nity for the system-level design of the reliability and optimal decision making in the planning and maintenance
of converters. For instance, in the next step (D), application of reliability performance index is presented for
lifetime prediction under a given mission profile, which can be used for system-level analysis. A system level
application of the proposed AI approach is provided in “Power system-level application”.
Step D: B10 lifetime prediction. The converter lifetime estimation under a given mission profile is per-
formed as the last step like shown in Fig. 5d. For this purpose, active P and reactive Q power profiles are classi-
fied and their frequency is presented by a Probability Mass Function (pmf), where Fi is the frequency of (Pi, Qi).
The converter lifetime associated with each pair of (Pi, Qi) is obtained by the performance index curves provided
in step C or predicted by using the ANN trained in step (B). Thereby, the B10 lifetime under given mission profile
can be predicted as:
−1
L(B10 ) = Fi Li . (5)
This equation provides an approximate B10 lifetime of the converter under a given mission profile, which can
be used for system-level analysis in power electronics systems.
Numerical analysis
This section presents numerical analysis implying the applicability of AI in power converter reliability prediction.
There are various converter topologies used for different applications in power industry. The proposed meth-
odology can be easily applied for any converter topology. Among various converter structures, the half-bridge
converter is the building block of many of them. Therefore, without losing generality, a half-bridge converter is
considered for analysis as shown in Fig. 7. Later, in the “Power system-level application”, three-phase three-leg
converters are considered for reliability analysis in a microgrid. The converter parameters and selected devices
are summarized in Table 1. In the following, the impact of converter loading on its performance is demonstrated.
Afterward, the application of AI in predicting the converter performance index is presented. Furthermore, the
converter reliability operating under different mission profiles are explored employing the converter performance
index.
Impact of converter loading. According to (1), the junction temperature and temperature swing have
a significant impact on the converter lifetime. The junction temperature, and consequently, the converter reli-
ability depends on its loading conditions. In order to demonstrate the impact of converter loading on junction
temperature of the switch and diode (see Fig. 7), the junction temperatures are experimentally measured under
Scientific Reports | (2021) 11:7557 | https://doi.org/10.1038/s41598-021-87165-3 8
Vol:.(1234567890)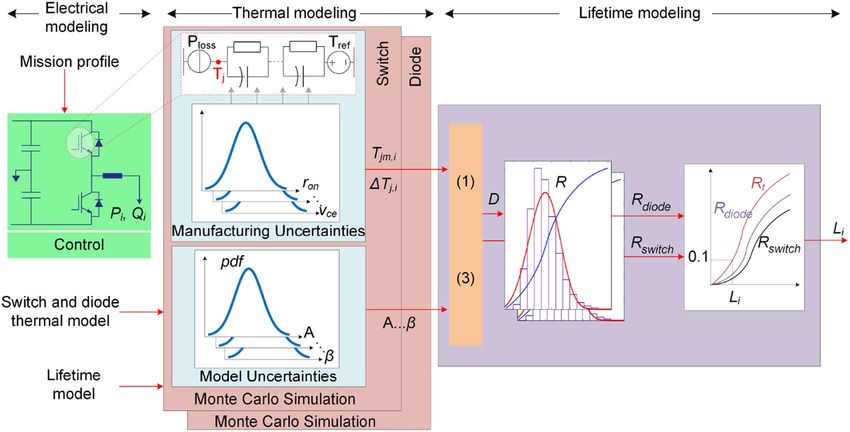
www.nature.com/scientificreports/

                                  Figure 8.  Obtained experimental results showing switch T1 and diode D1 junction temperatures at (a)
                                  rectification mode, and (b) inversion mode.

                                  Figure 9.  The 20-year B10 lifetime curve prediction based on data of 5-, 10- and 40-year B10 lifetime curves for
                                  different operating conditions.

                                  inversion and rectification modes of operation. For experimental measurements, the IGBT module’s cover is
                                  and gel is removed and optical fibers are used. The obtained experimental results are shown in Fig. 8a and b for
                                  inversion and rectification modes respectively.
                                      As shown in Fig. 8, the minimum junction temperature and temperature swing for both devices, switch and
                                  diode, depend on the operational mode of the converter. For instance, the temperature swing of the switch in the
                                  rectification mode is 4 °C, while it is 5.5 °C in the inversion mode. Moreover, the minimum junction temperature
                                  for diode is 50 °C in the rectification mode and 48.5 °C in the inversion mode. Thus, the operating conditions
                                  affect the converter thermal behavior and reliability.
                                      As a result, it should be taken into account during design and operation of converters. Since, the converters
                                  are used at different conditions, providing a single number or a curve as a reliability measure in practice is not
                                  possible. Therefore, it is crucial to provide the reliability data in such a way that the converter lifetime can be
                                  predicted for different operating conditions. This is required for any decision-making within planning and opera-
                                  tion of power electronic systems such as in motor drives, renewable power plants, MVDC-HVDC transmission
                                  systems, microgrids and so on.
                                      As already mentioned, constant lifetime curves are proposed in this paper to illustrate the converter reli-
                                  ability performance at different operating points as shown in Fig. 3. These data can be provided by converter
                                  manufacturers for limited operating points, since covering whole operating conditions is not possible. On the
                                  other hand, calculating the reliability data for whole operating region is very time-consuming. Moreover, the
                                  reliability prediction using SSA by the power electronic system designers or planners requires detailed lifetime
                                  models of its components, which might be not provided by manufacturers due to the market restrictions. Thus,
                                  the proposed constant reliability curves for limited points provided by manufacturers is a suitable approach for
                                  predicting the converter long-term performance, i.e., reliability under various operating conditions. In the fol-
                                  lowing, the application of AI in using these limited lifetime data in converter performance analysis is presented
                                  by several case studies.

                                  B10 lifetime curves as long‑term performance index. In order to show the performance of the AI
                                  application in lifetime prediction, two case studies are provided in the following. The B10 lifetime curves as the
                                  performance index of the converter are calculated based on a detailed electro-thermal based SSA as explained
                                  in “Proposed long-term lifetime performance indicator”7. Then, the 40 operating points (Pi, Qi) are selected for
                                  training the ANN, which are shown by “▫” in Fig. 9. Notably, the solid lines in Fig. 9 are the B10 curves calculated
                                  based on detailed electro-thermal model and SSA.

Scientific Reports |   (2021) 11:7557 |                https://doi.org/10.1038/s41598-021-87165-3                                                     9

                                                                                                                                               Vol.:(0123456789)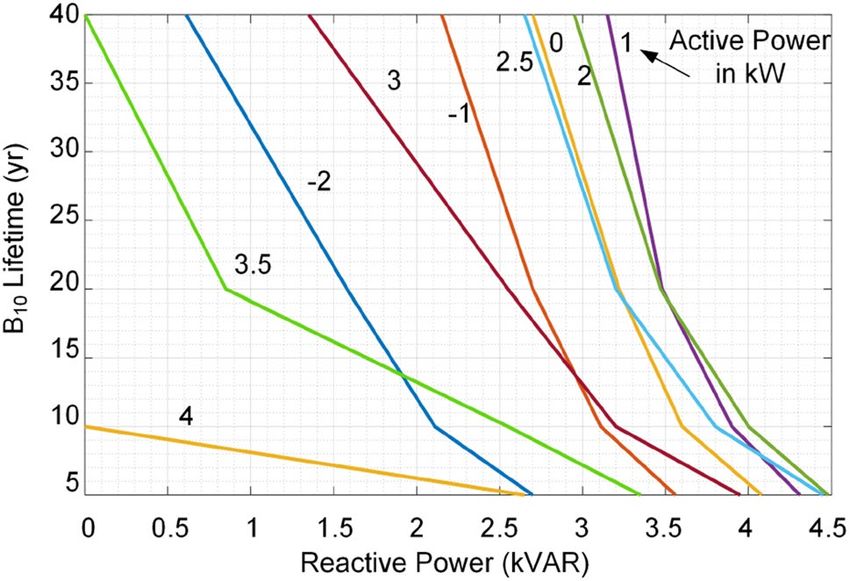
www.nature.com/scientificreports/

                                            Figure 10.  B10 lifetime curves versus reactive power and active power.

                                            Figure 11.  Daily load profiles; (a) Load I: Pure active power, (b) Load II: Constant power factor, and (c) Load
                                            III: Non-constant power factor.

                                                The data of 5-, 10-, and 40-year B10 curves highlighted by “▫” in Fig. 9 are used to predict the 20-year B10
                                            lifetime curve. The predicted 20-year B10 lifetime data are shown by “*” in Fig. 9, which are very close to the
                                            analytical data shown by green line. As it is seen form Fig. 9, the proposed ANN can precisely predict the 20-years
                                            B10 curve data using the limited data of the 5-, 10- and 40 years B10 curves. The obtained results show that the
                                            AI method can precisely predict the specific B10 lifetime curves by employing limited data of other B10 curves
                                            provided by manufacturer. Hence, this will be providing fast lifetime prediction and a simple way to model the
                                            converter reliability. Notably, the data correlation given in Fig. 9 is not linear. This means, even the green curve
                                            is located in the middle of pink and red curves associated with the 40- and 10-years lifetime, the corresponding
                                            lifetime is 20 years instead of being (40 + 10)/2 = 25 years. On the other hand, the distance between curves are
                                            almost the same, while the corresponding lifetimes do not change linearly. This non-linear behavior is shown
                                            if Fig. 10 in lifetime-reactive power plot for different active powers. It is obvious that there is no clear relation
                                            among lifetime, reactive and active powers. Thus, conventional look-up table-based data fitting techniques are
                                            not applicable for modeling the converter lifetime curves. However, the AI as a non-parametric surrogate model
                                            can properly model the non-linear relation between lifetime and operation conditions. This will be more feasible
                                            approach in case more operating conditions such as ambient temperature, low frequency oscillations, etc. which
                                            induce more non-linearity.

                                            B10 lifetime estimation under loading profiles.             In the next case, the lifetime of the converter operating
                                            under different mission profiles is predicted employing the conventional approach using the detailed thermo-
                                            electrical based SSA model and the proposed ANN approach. Three mission profiles are considered as shown
                                            in Fig. 11 including (a) Load I: Pure active load, (b) Load II: Constant power factor load, and (c) Load III: Non-
                                            constant power factor load.
                                                The reliability of the converter is estimated by the conventional approach using analytical SSA model under
                                            these three loads and the corresponding reliability functions are shown in Fig. 12. Moreover, the B10 lifetime of
                                            the converter for the given load profiles are predicted by the ANN and (5), and the results are depicted in Fig. 12
                                            by “*”. According to Fig. 12, the predicted B10 lifetimes using ANN approach are close to the predicted values by

          Scientific Reports |   (2021) 11:7557 |                https://doi.org/10.1038/s41598-021-87165-3                                                    10

Vol:.(1234567890)
www.nature.com/scientificreports/
Figure 12. Reliability of converter using conventional SSA approach and AI predicted B10 lifetime for different
loading profiles as shown in Fig. 11.
Calculation
B10 lifetime (year) time (s)
Load profile Predicted points SSA AI Error SSA AI
I M1 21.0 20.9 0.5 5.43 1.13
II M2 9.6 10.0 4 5.37 1.12
III M3 15.5 15.8 2 5.21 1.15
Table 2. Performance comparison between conventional (SSA) and AI-based approach in B10 lifetime
prediction for load profiles given in Fig. 11.
analytical approach using SSA. Thus, it can appropriately predict the converter lifetime under different operating
conditions. For instance, as shown in Fig. 12 and summarized in Table 2, the prediction error in points M1, M2
and M3 are 0.5%, 4% and 2% respectively. The obtained results show the effectiveness of the proposed AI-based
approach for estimating the lifetime of the converter for different operating conditions.
Notably, the conventional approach uses electrical and thermal analyses in time domain, which require detail
model parameters of converter components and its cooling system. Moreover, the reliability prediction employs
Monte Carlo simulations to predict the failure probability of converters. Not only the electro-thermal analyses
and Monte Carlo simulations are time consuming, but also, they need the lifetime model of converter compo-
nents. In this case, the time consumption for estimating the lifetime under three load profiles are summarized
in Table 2 implying five times faster performance of AI based method.
Instead of providing lifetime and electro-thermal models—some data like lifetime models may not be available
due to market restrictions—the proposed constant reliability curves can be provided. Furthermore, the proposed
AI approach can be used for rapidly predicting the converter lifetime using limited information with an accept-
able error like this case study. Notably, the proposed approach is suitable for the applications with slow dynamics
of load variations such as electric vehicle chargers and HV/MVDC system converters. Moreover, In the case of
fast load variations such as photovoltaic and wind power converters, the proposed approach only provides the
lifetime model associated with the line-frequency o scillations9. A complete lifetime model requires to include the
mission profile by classifying its variations into specific patterns. Thus, the converter lifetime under any mission
profile can be predicted by using AI and given lifetime curves for each operational pattern.
Power system‑level application
This section will present the application of long-term performance indicator in PEPS. In general, the convert-
ers are used for interfacing the energy units to the grid, interlinking different sub-girds (either ac/dc, or high/
medium/low voltage grids), and driving loads. In this paper, a typical PEPS with a single ac source, single dc
source and an Interlinking Converter (IC) is considered as shown in Fig. 13. Moreover, the system loads are
localized at common ac and dc busses (dc load: P1, ac load: P2, Q2). This study will focus on the performance of
the IC and ac source converter. These converters are identical and have a three-phase three-leg structure, where
each leg has the same devices used in Fig. 7 with the rated power of 15 kW.
In this section, the impact of converter application, load sharing and power flow direction will be illustrated
on the overall system performance using the proposed AI-based performance indicator. Moreover, the applica-
bility of the proposed indicator in enhancing the overall system reliability is demonstrated.
Conventional operation approach for hybrid AC–DC grids. Conventionally, the power sharing
between ac sources and dc sources is performed based on their rate powers. Therefore, with an identical rated
power for the units shown in Fig. 13, the active power sharing of ac and dc source will be the same. Moreover,
the reactive power between ac source and the IC converter is shared according to their rated power. Since, both
Scientific Reports | (2021) 11:7557 | https://doi.org/10.1038/s41598-021-87165-3 11
Vol.:(0123456789)www.nature.com/scientificreports/
Figure 13. Single line diagram of a hybrid AC–DC microgrid.
Figure 14. Impact of power sharing on the reliability of converters. P
1 = 0.4 pu, (P2, Q2) = (1.2 pu, 0.8 pu).
converters have the same ratings, the reactive power sharing among them will be equal. Technically, the active
and reactive power are controlled by droop scheme, which is comprehensively discussed in37. In this paper, the
focus will be on the reactive power sharing, where according to the droop control method, the output voltage of
converters can be controlled with respect to their output reactive power following (6).
Vref ,i = V ∗ − Kq,i Qi (6)
where, V* is the nominal voltage, Qi is the output reactive power, Kq,i is the droop gain, and Vref,i is the reference
voltage. Having the same rated power requires setting the droop gains to an identical value, thus introducing
equal reactive power sharing. In the following, two loading conditions are considered including: (a) P 1 = 0.4
pu and ( P2, Q2) = (1.2 pu, 0.8 pu), and (b) P 1 = 1.4 pu and ( P2, Q2) = (0.2 pu, 0.4 pu). The base power for per-
unitization (pu) is 15 kW. According to the conventional power sharing approach, ( P1 and P 2) are evenly sup-
ported by the ac and dc sources, thus ac source active power Pa = 0.5 × (P1 + P2). Therefore, the IC’s active power
will be P i = P2 – P
a. Moreover, both converters will share the load reactive power equally, i.e., Q i = Qa = 0.5 × Q2.
These operating points for both loading conditions are depicted on the proposed Q-P plot as shown in Figs. 14
and 15, respectively.
As shown in Fig. 14, the IC has B10 lifetime of more than 40 years at point Ai and the ac source converter’s
lifetime at point Aa is close to 5 years. Since, the converter operates under rated power, the reactive power sharing
can be changed. According to Fig. 14, if the whole reactive power is shifted to IC, the new operating points will
be obtained as Bi and Ba. It is obvious that the both converters will operate on the B 10 lifetime curve of 20 years.
It is interesting to highlight that the IC is operating close to rated power while the ac converter is below the rated
power. However, they both stay on the same B10 lifetime curve. This fact shows that the conventional approaches
which rely on rated power of converters, cannot guarantee reliable performance of the system. This is because
the device lifetime depends on the junction temperature and its fluctuations according to (1). The junction
temperature is associated with the average load and the temperature fluctuations depend on the load variations.
Scientific Reports | (2021) 11:7557 | https://doi.org/10.1038/s41598-021-87165-3 12
Vol:.(1234567890)www.nature.com/scientificreports/
Figure 15. Impact of power sharing on the reliability of converters. P
1 = 1.4 pu (P2, Q2) = (0.2 pu, 0.4 pu).
Considering the rated power for power sharing just impacts the junction temperature. However, in practice, the
effect of temperature fluctuations on the device lifetime is dominant22.
Moreover, at the second operating condition, the IC is in rectification mode as show in Fig. 15. The operating
points of both converters are shown with Ai and Aa. The lifetime of IC is lower than 5 years, while the ac source
converter has almost 10 years lifetime as shown in Fig. 15. The IC lifetime can be improved by shifting its reac-
tive power to the ac source. In this case, the IC will reach 5-year lifetime curve at point Bi and the ac source will
approach 5-year curve at point Ba. It is obvious that even though the IC is operating at almost 0.6 pu loading,
its lifetime is limited, while the ac source is operating at 0.8 pu loading and it can even support much power to
reach the same lifetime curve of 5 years as IC has reached. As the main consequences:
1. The IC has limited lifetime in the rectification mode compared to the inversion mode. Thus, in the rectifica-
tion mode might be better to work at lower reactive power support to extend its lifetime.
2. These conditions show asymmetric lifetime characteristics of converters; thus, they should be designed
considering the lifetime limits either in rectification or inversion mode. That means, a converter with a rated
power of 1 pu cannot support 1 pu power in rectification mode (in the present example it can only support
0.67 pu with the same reliability performance operating with rated power in the inversion mode). This is
due to the fact that the switches are highly loaded in the inversion mode, while in the rectification mode, the
anti-parallel diodes are conducting most portion of the power. Since the electro-thermal characteristics of the
diodes and switches are not identical, the lifetime behavior is physically different. If it is operated at the rated
power, in both directions, the planning considerations based on rated power of converters are indeed not
optimal in practice. This is due to the fact that the converter life expectancy will be lower than the designed
value. As a result, the power system maintenance periods may be different from the scheduled times. This
is of high importance in modern power systems as the bidirectional converters are growing in the medium
voltage dc transmission systems as well as low voltage microgrids. Therefore, precise design of converters
considering their lifetime characteristics will introduce optimal planning and operation of future PEPS.
In order to address this asymmetric behavior in the operation of bidirectional converters, the next subsection
will propose an intelligent approach to enhance the system performance.
The proposed approach for lifetime‑oriented power sharing. As a result of discussion in the previ-
ous subsection for the given two operating conditions in Figs. 14 and 15, it is clear that the routing of reactive
power can improve the system reliability. Therefore, the droop equation for reactive power is modified as (7),
where K0 is the conventional droop gain and Li and Lj are the lifetime of ith and jth converters under the operating
points of (Pi, Qi) and (Pj, Qj). Kq,i is the adjusted droop gain of ith converter.
Lj − Li
Kq,i = K0 1 + � � , i, j = {1, 2} (7)
Max Lj , Li
j�=i
Scientific Reports | (2021) 11:7557 | https://doi.org/10.1038/s41598-021-87165-3 13
Vol.:(0123456789)www.nature.com/scientificreports/
Figure 16. The proposed AI-based power sharing method.
Figure 17. Annual load profiles; (a) dc load power, and (b) ac load active and reactive power.
According to Fig. 16, the performance index estimator will predict the lifetime of converter under operat-
ing conditions of Pi and Qi using the proposed AI-based model. The lifetime of converter is compared with the
lifetime of jth converter. If the Lj > Li, according to Fig. 3, the jth converter should take over the majority of
reactive power than the ith converter. That means, the droop gain of ith converter should be larger than that of
for jth one. This fact is implemented by the adaptive droop gain given in (7), where for the mentioned condition
the Kq,j < K0 and Kq,i > K0. Therefore, the droop characteristics for the converters will be different from the con-
ventional one as shown in Fig. 16. As it is expected, using the proposed technique will result in Qj > Qi. Notably,
the reliability-oriented power sharing has already been introduced i n24,38. However, the employed method was
based on the damage of the components instead of using reliability, which requires detail data of thermal and
electrical characteristics of devices and heavy computation burden.
In order to show the performance of the proposed strategy, the dc and ac load profiles are considered as shown
in Fig. 17. The result of conventional power sharing is shown in Fig. 18, where the reactive power is shared equally
between IC and ac source converter. Furthermore, the IC is mostly operating in the rectification mode. Moreover,
the loading of converters using the proposed approach is shown in Fig. 19. It is obvious that the converters have
different reactive power sharing. For detail analysis a zoomed graphs of load profile during three days of the year
at two point of X and Y are further analyzed. Notably, the X is similar to the loading condition in Fig. 14 and Y
is similar to the example shown in Fig. 15 and discussed in previous subsection.
According to Figs. 20 and 21, the proposed reactive power sharing process includes three phases. In the first
phase (X1/Y1 in Fig. 20/Fig. 21), the reactive powers are equal since the active powers of both IC and ac source
converter are much lower than the rated value. The second phase (X2/Y2 in Fig. 20/Fig. 21) shows uneven reac-
tive power sharing as one converter approaching its rated power. In Fig. 20 at X2, the ac source active power is
almost 0.8 pu, while the IC is almost transferring zero pu power. Therefore, the IC carries more reactive power
than the other converter as shown in Fig. 20. On the other hand, as shown in Fig. 21 at point Y2, the ac source is
operating at lower than 0.6 pu, while the IC transfers lower than 0.5 pu. Since at this region according to Fig. 15,
the IC approaches its lower lifetime curves, the control system will decrease its reactive power support as shown
Scientific Reports | (2021) 11:7557 | https://doi.org/10.1038/s41598-021-87165-3 14
Vol:.(1234567890)www.nature.com/scientificreports/
Figure 18. Loading of interlinking converter ( Pi, Qi) and ac source converter ( Pa, Qa) under conventional power
sharing scheme.
Figure 19. Loading of interlinking converter (Pi, Qi) and ac source converter (Pa, Qa) under reliability-oriented
power sharing scheme.
Figure 20. Impact of reliability-oriented power sharing scheme on the converters loading with heaving ac side
loading.
in Fig. 21. Finally, at point of X3 in Fig. 20, the ac source operates at higher than 0.8 pu that is close to the limited
lifetime curves as shown in Fig. 14. Since the IC operates at lower powers, the control system shifts the whole
reactive power to the IC to maintain the lifetime of ac source converter. This is similar to the operating condition
in Fig. 14 in the rectification mode. Similarly, at point Y3 in Fig. 21, the IC is operating at 0.5 pu, while the ac
Scientific Reports | (2021) 11:7557 | https://doi.org/10.1038/s41598-021-87165-3 15
Vol.:(0123456789)www.nature.com/scientificreports/
Figure 21. Impact of reliability-oriented power sharing scheme on the converters loading with heaving dc side
loading.
Figure 22. Impact of reliability-oriented power sharing scheme on the reliability of converters.
source operates at 0.6 pu. In this case, the IC is approaching its limited lifetime curves shown in Fig. 15. Thus,
the control system shifts all reactive power to the ac source to maintain the IC lifetime.
As a result, the converters lifetime under conventional and proposed power sharing approaches are shown in
Fig. 22. The reliability functions are directly predicted using stress-strength analysis shown in Fig. 4 in order to
further illustrate the effectiveness of the using the proposed AI-based performance indicator for power sharing
technique. To do so, first, the load sharing is performed using the AI-based performance indicator as shown
in Fig. 16. Then, the obtained loading profiles are used to predict the converters reliability using the process
shown in Fig. 4.
According to Fig. 22, the B 1 lifetime of ac source is limited to 12 years using conventional power sharing
approach, while the IC has a longer lifetime. However, using the proposed approach extends the lifetime of the
ac source by 3.5 year (30%), while the lifetime of IC is limited to 35.5 years using the proposed approach. In fact,
as shown in Fig. 19, the ac source converter is operating close to limited lifetime curves at much longer times
compared to the IC. Therefore, the load reactive power is shifted to the IC as shown in Fig. 19 which decrease
its reliability. In practice, if the new lifetime (here 35.5 years) is not acceptable, the system should be re-planned
either designing both converters with higher reliability or timely replacing them. It is worth to mention that the
results are associated with the wear-out failures. A converter faces different failure types namely random chance,
infant mortality and wear-out failures. The two others are extrinsic failures and hence it is not possible to model
them theoretically8. However, in practice, the lifetime will be lower than e.g., 35.5 years in the last case due to
other failure types7. Notably, the given analysis and the obtained results are valid for the given load profiles in
Fig. 17 and the converter parameters given in Table 1. Different load profiles and sharing coefficient between
ac and dc sources will affect the results. This is the main motivation to equipped a converter with a brain to take
care of its health. Thus, this paper has introduced an intelligent approach to predict the converter lifetime, which
can be used for power system planning purposes.
Conclusion
This paper has proposed an efficient and compact long-term reliability performance indicator for power elec-
tronic converters. This performance indicator is represented by the constant lifetime curves, which are mod-
eled and estimated employing an Artificial Neural Network (ANN). The ANN provides a fast, non-parametric
Scientific Reports | (2021) 11:7557 | https://doi.org/10.1038/s41598-021-87165-3 16
Vol:.(1234567890)www.nature.com/scientificreports/
surrogate model for converter performance indicator, which eliminates the need for the detailed electro-thermal
and lifetime models of converter components. The proposed performance index can be provided by converter
manufacturers as technical data for the optimal and application-specific design for its reliability as well as for
operation and maintenance planning in power electronic systems.
The numerical analysis shows that the ANN approach can quickly and accurately predict the converter per-
formance index and its reliability under operating mission profiles. It has been shown that the computation time
can be 5 times faster than conventional approach with an acceptable accuracy. Moreover, the application of the
proposed ANN approach on the reliable operation of converters with proper active and reactive power sharing
in a PEPS has been demonstrated. The proposed power sharing approach introduces 30% lifetime extenuation
by considering the lifetime of converter during operation. Moreover, it has been illustrated how the converter
behaves in the inversion and rectification mode from reliability standpoint, which should be considered during
design and operation of converters. For instance, the lifetime of converter for the selected devices in this paper,
was limited in the rectification mode, and operating in that mode in the rated power will extremely reduce its
expected lifetime. This paper for the first time introduced a long-term indicator for power electronic converters
considering its operating conditions of active and reactive power. Possible future works will be to include the
impact of other devices lifetime and fast dynamics of mission profiles. Moreover, other operating conditions such
as ambient temperature, humidity and vibration on the lifetime curves of converters could provide comprehensive
indicator modeling the converter lifetime.
Received: 21 December 2020; Accepted: 23 March 2021
References
1. Wang, H., Ma, K. & Blaabjerg, F. Design for reliability of power electronic systems. in Proc. IEEE IECON 33–44 (IEEE, 2012).
https://doi.org/10.1109/IECON.2012.6388833.
2. IEC62109:2010. Safety of Power Converters for Use in Photovoltaic Power Systems. https://webstore.iec.ch/publication/6470 (2010).
3. IEEE Standard Association: IEEE Std 1547–2018. IEEE Standard for Interconnection and Interoperability of Distributed Energy
Resources with Associated Electric Power Systems Interfaces. IEEE Std 1547–2018 (2018). https://doi.org/10.1109/IEEESTD.2018.
8332112.
4. Crabtree, C. J., Zappalá, D. & Hogg, S. I. Wind energy: UK experiences and offshore operational challenges. Proc. Inst. Mech. Eng.
A 229, 727–746 (2015).
5. Fischer, K. et al. Reliability of power converters in wind turbines: Exploratory analysis of failure and operating data from a world-
wide turbine fleet. IEEE Trans. Power Electron. 34, 6332–6344 (2018).
6. Falck, J., Felgemacher, C., Rojko, A., Liserre, M. & Zacharias, P. Reliability of power electronic systems: An industry perspective.
IEEE Ind. Electron. Mag. 12, 24–35 (2018).
7. Peyghami, S., Wang, Z. & Blaabjerg, F. A guideline for reliability prediction in power electronic converters. IEEE Trans. Power
Electron. 35, 10958–10968 (2020).
8. Pecht, M. & Gu, J. Physics-of-failure-based prognostics for electronic products. Trans. Inst. Meas. Control 31, 309–322 (2009).
9. Dragicevic, T., Wheeler, P. & Blaabjerg, F. Artificial intelligence aided automated design for reliability of power electronic systems.
IEEE Trans. Power Electron. 34, 7161–7171 (2019).
10. Peyghami, S., Pakensky, P., Blaabjerg, F., Palensky, P. & Blaabjerg, F. An overview on the reliability of modern power electronic
based power systems. IEEE Open J. Power Electron. 1, 34–50 (2020).
11. Tu, P., Member, S., Yang, S. & Member, S. Reliability and cost based redundancy design for modular multilevel converter. IEEE
Trans. Ind. Electron. 66, 2333–2342 (2019).
12. Aghdam, F. H., Member, S. & Abapour, M. Reliability and cost analysis of multistage boost converters connected to PV panels.
IEEE J. Photovolt. 6, 981–989 (2020).
13. Zhang, Y. et al. Simplified thermal modeling for IGBT modules with periodic power loss profiles in modular multilevel converters.
IEEE Trans. Ind. Electron. 66, 2323 (2019).
14. Xu, S. et al. Reliability analysis on power converter of switched reluctance machine system under different control strategies. IEEE
Trans. Ind. Electron. 66, 6570–6580 (2019).
15. Raveendran, V., Andresen, M. & Liserre, M. Improving onboard converter reliability for more electric aircraft with lifetime-based
control. IEEE Trans. Ind. Electron. https://doi.org/10.1109/TIE.2018.2889626 (2019).
16. Choi, U. M., Ma, K. & Blaabjerg, F. Validation of lifetime prediction of IGBT modules based on linear damage accumulation by
means of superimposed power cycling tests. IEEE Trans. Ind. Electron. 65, 3520–3529 (2018).
17. Chung, H. S., Wang, H., Blaabjerg, F. & Pecht, M. Reliability of Power Electronic Converter Systems (IET, 2016).
18. Peyghami, S., Wang, H., Davari, P. & Blaabjerg, F. Mission profile based system-level reliability analysis in DC microgrids. IEEE
Trans. Ind. Appl. 55, 5055–5067 (2019).
19. Peyghami, S., Wang, Z. & Blaabjerg, F. Reliability modeling of power electronic converters: A general approach. in Proc. IEEE
COMPEL 1–7 (IEEE, 2019). https://doi.org/10.1109/COMPEL.2019.8769685.
20. De Reigosa, P., Wang, H., Yang, Y. & Blaabjerg, F. Prediction of bond wire fatigue of IGBTs in a PV inverter under a long-term
operation. IEEE Trans. Power Electron. 31, 3052–3059 (2016).
21. Falck, J., Felgemacher, C., Rojko, A., Liserre, M. & Zacharias, P. Reliability of power electronic systems. IEEE Ind. Electron. Mag.
12, 24–35 (2018).
22. Ma, K., Wang, H. & Blaabjerg, F. New approaches to reliability assessment: Using physics-of-failure for prediction and design in
power electronics systems. IEEE Power Electron. Mag. 3, 28–41 (2016).
23. Doyle, T., Desharnais, R. & Mills-Price, M. 2019 Pv Inverter Scorecard. (2019).
24. Peyghami, S., Davari, P. & Blaabjerg, F. System-level reliability-oriented power sharing strategy for DC power systems. IEEE Trans.
Ind. Appl. 55, 4865–4875 (2019).
25. Peyghami, S., Davari, P., Wang, H. & Blaabjerg, F. The impact of topology and mission profile on the reliability of boost-type
converters in PV applications. in Proc. IEEE COMPEL 1–8 (2018).
26. Song, Y. & Wang, B. Survey on reliability of power electronic systems. IEEE Trans. Power Electron. 28, 591–604 (2013).
27. Yang, S. et al. An industry-based survey of reliability in power electronic converters. IEEE Trans. Ind. Appl. 47, 1441–1451 (2011).
28. Ma, K., Liserre, M., Blaabjerg, F. & Kerekes, T. Thermal loading and lifetime estimation for power device considering mission
profiles in wind power converter. IEEE Trans. Power Electron. 30, 590–602 (2015).
29. Bayerer, R., Herrmann, T., Licht, T., Lutz, J. & Feller, M. Model for power cycling lifetime of IGBT modules: Various factors influ-
encing lifetime. in Proc. IEEE CIPS 1–6 (VDE, 2008).
Scientific Reports | (2021) 11:7557 | https://doi.org/10.1038/s41598-021-87165-3 17
Vol.:(0123456789)You can also read