Mobile Phone and Device Black Spots Connectivity Assessment - Greater ...
←
→
Page content transcription
If your browser does not render page correctly, please read the page content below
Whitsunday Regional Organisation of Councils

          Mobile Phone and Device Black Spots
               Connectivity Assessment
                                Isaac Regional Council
                                    2 February 2016

                                          Strategy, Planning & Development
                                                  Implementation Programs
                                         Research, Analysis & Measurement
                                                    Mobile Coverage Testing
                                                             Digital Mapping

Digital Economy Group Pty Ltd                           P.O. Box 1191
ABN 48 153 285 191                                      Nambour, Queensland 4560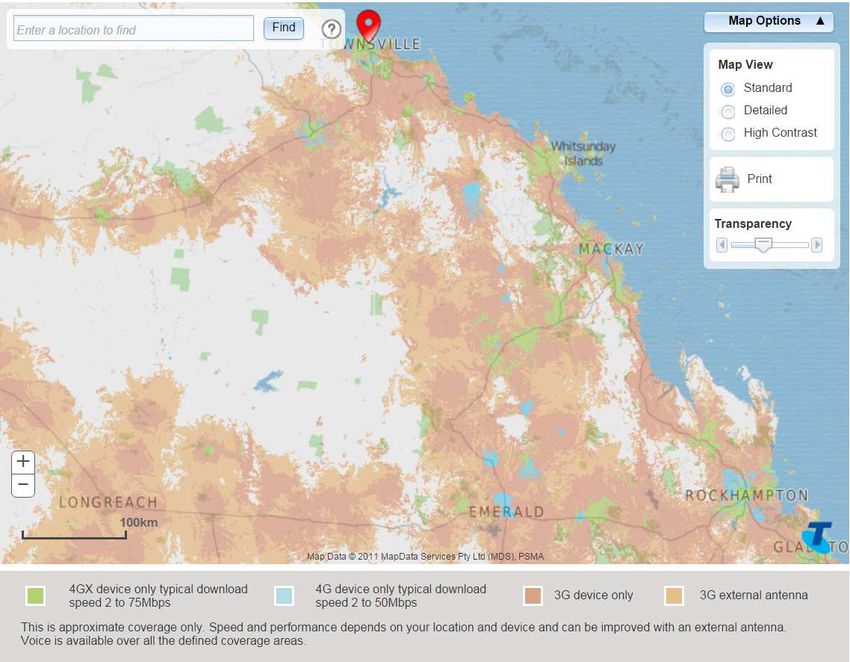
Isaac Regional Council               Mobile Phone and Device
                                      Black Spots Connectivity
                                            Assessment

Document History
  Version   Author                        Amendments                        Date
  V1.1        Michael Whereat             Initial Draft                     16 November 2015
  V1.1        Michael Whereat             Import test results               29 November 2015
  V1.2        Michael Whereat             Draft Priorities                  5 December 2015
  V1.3        Michael Whereat             Draft                             13 December 2015
  V1.4        Megan Whereat               Final                             24 January 2016
  V1.5        Michael Whereat             Final with amendments             2 February 2016

Distribution List
  Person                    Title
  Heather Norris            Executive Officer, Whitsunday ROC Ltd
  Michael Whereat           Director, Digital Economy Group

  Disclaimer:
  Information in this document is based on available data at the time of writing this document.
  Digital Economy Group Pty Ltd or its officers accept no responsibility for any loss occasioned to
  any person acting or refraining from acting in reliance upon any material contained in this
  document.

  Copyright
  © Digital Economy Group 2011-16.
  This document is copyright and must be used except as permitted below or under the Copyright
  Act 1968. You may reproduce and publish this document in whole or in part for you and your
  organisation’s own personal and internal compliance, educational or non-commercial purposes.
  You must not reproduce or publish this document for commercial gain without the prior written
  consent of the Digital Economy Group Pty. Ltd.

 Digital Economy Group Pty Ltd                                    P.O. Box 1191
 ABN 48 153 285 191                                               Nambour, Queensland 4560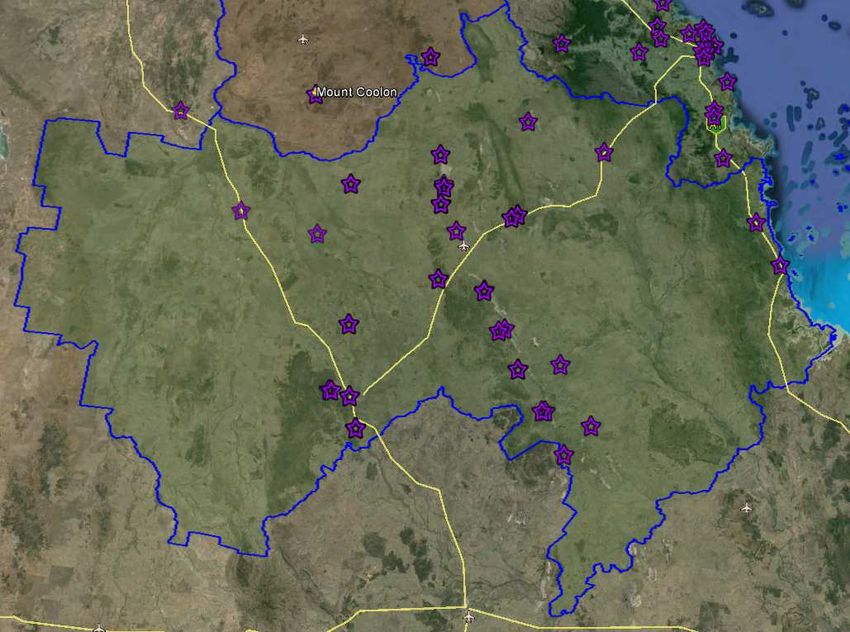
Isaac Regional Council                                   Mobile Phone and Device
                                                          Black Spots Connectivity
                                                                Assessment

Contents
1.    Executive Summary                                                                                                                            1
2.    Introduction                                                                                                                                 5
3.    Methodology                                                                                                                                  6
3.1.  The Study Area                                                                                                                               6
3.2.  Current Carrier Coverage                                                                                                                     6
3.3   Current Carrier Sites and ACMA Licences overview                                                                                             9
3.4   Carrier Baseline                                                                                                                             9
3.5   Testing Methodology                                                                                                                         10
3.5.1 Network Performance Tests                                                                                                                   10
3.5.2 Network Performance Time Series Testing                                                                                                     11
3.5.3 Testing Equipment and Presentation Limitations                                                                                              11
4     Australian Government Mobile Black Spot Programme and locally identified Black Spots                                                        12
4.1   Mobile Black Spot Programme                                                                                                                 12
4.2   Mobile Black Spot Programme – Round 2                                                                                                       13
4.3   Locally identified Black Spots                                                                                                              13
5     Mobile Coverage Testing Results                                                                                                             14
5.1   Tested Routes                                                                                                                               14
5.2   Signal Strength                                                                                                                             14
5.2.1 Voice and 3G Black Spots                                                                                                                    15
5.2.2 4G LTE Black Spots                                                                                                                          17
5.3   Network Site Test locations and assessment overview                                                                                         18
5.4   Network Performance Time Series Tests                                                                                                       22
5.5   Network Performance Time Series Test Carrier Comparison                                                                                     24
5.6   Top priority locations for the Isaac Regional Council                                                                                       27
6     Conclusion                                                                                                                                  29
Appendix 1: AT&T Drive Studio and Ericsson Release Global Study on Connected Car Buyers                                                           30
Appendix 2: Mobile Black Spot Programme Round 1 Successful Sites                                                                                  31
Appendix 3: Current Carrier Infrastructure                                                                                                        32
Appendix 4: Network Performance Test Results by Carrier                                                                                           35
Appendix 5: Network Performance Time Series Test Graphs                                                                                           38
Appendix 6: Terms and Abbreviations                                                                                                               43

Table of Figures
Figure 1: Benchmark Location Brisbane CBD – Time Series Testing ..................................................... 11
Figure 2: Signal Strength – Rural Town (left) & – Town Centre (right) ................................................. 15
Figure 4: Time Series Test - Clermont ................................................................................................... 22
Figure 5: Time Series Test - Moranbah ................................................................................................. 23
Figure 6: Time Series Test - Dysart ........................................................................................................ 23
Figure 7: Time Series Test -Middlemount ............................................................................................. 24
Figure 8: Time Series Test - Nebo ......................................................................................................... 24
Figure 9: Telstra Time Series Tests........................................................................................................ 25
Figure 10: Optus Time Series Tests ....................................................................................................... 25
Figure 11: Vodafone Time Series Tests ................................................................................................. 26

Table of Maps
Map 1: Isaac Regional Council Priority Map .......................................................................................... 2
Map 2: Study Area .................................................................................................................................. 6
Map 3: Telstra Mobile Phone and Broadband Coverage ........................................................................ 7
Map 4: Optus Mobile Broadband Coverage ........................................................................................... 8
Map 5: Vodafone Mobile Broadband Coverage ..................................................................................... 8

 Digital Economy Group Pty Ltd                                Commercial in Confidence
 ABN 48 153 285 191
                                                                                                                                        i|Page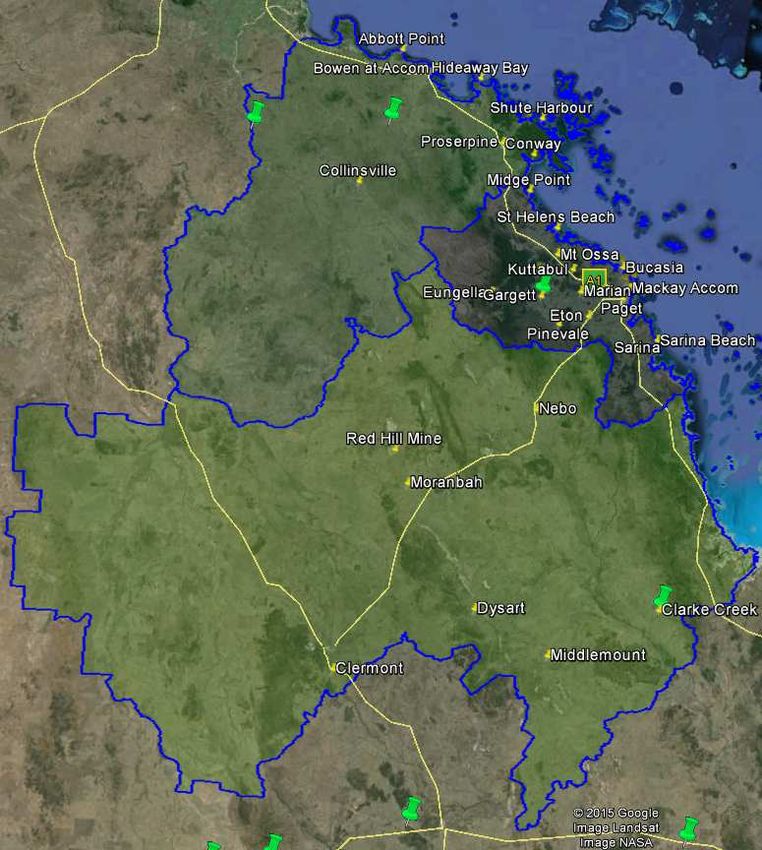
Isaac Regional Council                                Mobile Phone and Device
                                                       Black Spots Connectivity
                                                             Assessment

Map 6: Current Mobile Carrier Sites – Isaac Regional Council ............................................................... 9
Map 7: Mobile Black Spot Programme Community contributed Black Spot locations ........................ 12
Map 8: Routes used for Voice, 3G & Call Drop together with testing for 4G LTE ................................ 14
Map 9: Voice, 3G and Call Drop Black Spots ......................................................................................... 16
Map 10: Isaac 4G LTE Black Spots ......................................................................................................... 17
Map 11: Network Performance Test Locations (using Telstra results)................................................. 19
Map 12: Isaac Regional Council Priority Map ...................................................................................... 27

Tables
Table 1: Network Performance Test Scores.......................................................................................... 10
Table 2: Digital Divide and Location Comparison ................................................................................. 14
Table 3: Summary of Voice, 3G & Call Drop Black Spots ...................................................................... 16
Table 4: Summary of 4G Black Spots for the Isaac Regional Council Area ........................................... 17
Table 5: Network Performance Test Results and Assessment............................................................. 20
Table 6: Consolidated Network Performance Test Scores................................................................... 21

 Digital Economy Group Pty Ltd                            Commercial in Confidence
 ABN 48 153 285 191
                                                                                                                               ii | P a g e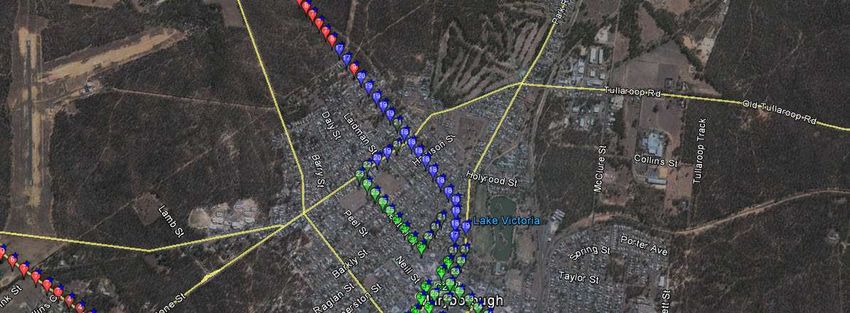
Isaac Regional Council                   Mobile Phone and Device
                                          Black Spots Connectivity
                                                Assessment

1. Executive Summary
Mobile connectivity, for phone calls and broadband, has become a utility expected by business,
residents and the community. The rapid development of new technologies and faster connection
options has resulted in regional and rural areas of Australia being on the wrong side of the ‘Digital
Divide’. In our capital cities there are virtually no Black Spots for coverage and rapid deployment of
the latest generation of connectivity. On the other side of the ‘Digital Divide’ Black Spots form the
largest part of the landscape and their townships have technology a generation or two behind.
For Local Government areas such as Isaac Regional Council, the challenge is to find ways to partner
with the three privately owned carriers to reduce the extent of Black Spot coverage and increase
access to quality internet data transfer speeds. They must seek to drive expanded and advanced
deployment of the best generation technology the carriers are prepared to invest in.
Managing the region in times of disaster or emergency, providing a positive experience for visitors
and delivering greater productivity for businesses is now a constant requirement for successful local
government areas.

Whitsunday ROC has engaged the Digital Economy Group (DEG) to benchmark carrier performance
and identify priorities to reduce Black Spots and improve coverage across the region. This report has
been prepared specifically for Isaac Regional Council (Council) to provide a local perspective. An
overarching report for the whole region has also been produced to draw the key finding of all 3
individual reports together and guide the regional priorities.
This report contains the following three elements:
          identify the Voice, Black Spots, Call Drop and sample 4G LTE in the urban areas
          test the network performance to identify where network upgrades are required
          list the priority locations and short list for Council and the region to pursue the Mobile Black
          Spot Programme Round 2 funding
A total of approximately 799klms of roads were driven across the Isaac Regional Council area. For the
Voice, 3G and Call Drop testing, 731klms were driven and 68klms for 4G LTE testing. A total of 45
individual Network Performance Tests were also completed to test the validity of the coverage maps
and confirm that the signal strength maps translated into actual connectivity. A total of 5 Time Series
Network Performance tests were performed to illustrate the quality of each respective network and
associated reliability.

 Digital Economy Group Pty Ltd              Commercial in Confidence
                                                                                                1|P age
 ABN 48 153 285 191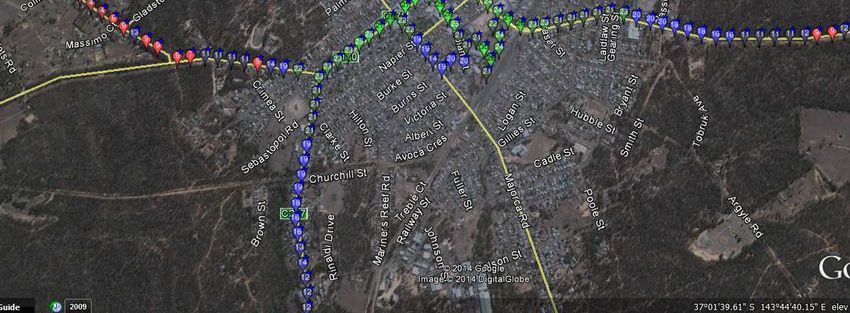
Isaac Regional Council                 Mobile Phone and Device
                                        Black Spots Connectivity
                                              Assessment

The top priority locations for the Isaac Regional Council:
The Isaac Regional Council priority areas are based on a consolidation of the three testing
methodologies together with anecdotal survey responses. There are two types of focus for Isaac
Regional Council to work with the carriers on:
         Mobile Black Spot Programme Round 2 opportunities to remove black spots, and
         improving capacity and competition where there is coverage.

The Map below identifies the roads driven with a thin pale blue line. Locations along the driven routes
without any colouring have coverage from all three carriers. To identify mobile coverage Black Spots
(areas where there is no coverage from any of the three carriers) look for the solid black lines. The
thick yellow lines represent where Telstra and Vodafone have coverage but Optus does not. The thick
red lines Telstra and Optus have coverage and Vodafone does not have coverage. The third colour,
orange, represents locations where Optus and Vodafone do not have coverage but Telstra does.
Map 1: Isaac Regional Council Priority Map

 Sources: Google Earth 2015,
           Queensland Local
   Government Areas & DEG
              interpretation

 Digital Economy Group Pty Ltd            Commercial in Confidence
                                                                                            2|P age
 ABN 48 153 285 191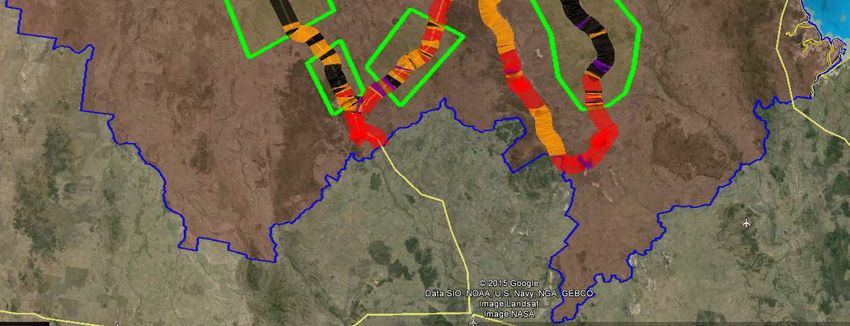
Isaac Regional Council                 Mobile Phone and Device
                                        Black Spots Connectivity
                                              Assessment

The Isaac Regional Council mobile coverage and capacity priorities (draft) are:

                                         Priority 1 – Peak Downs Highway between the retreat and the Mt
                                         Spencer turnoff

                                         This location was nominated as a known Black Spot. Detailed
                                         testing has confirmed the absence of coverage for all three
                                         carriers. Despite a small population base, this section of the
                                         highway has high volumes of traffic. It warrants a detailed
                                         evaluation for the Mobile Black Spot Funding Round 2.

                                             Priority 2 – Fitzroy         Development       Road    between
                                             Middlemount and Nebo

                                         This location was identified by DEG as a Black Spot area. Detailed
                                         testing has confirmed the absence of coverage for all three
                                         carriers. Despite a small population base, this highway is a
                                         strategic connection with regular volumes of traffic. It warrants a
                                         detailed evaluation for the Mobile Black Spot Funding Round 2.

                                             Priority 3 – Gregory Development Rd from Belyando
                                             Crossing to 60klms north of Clermont

                                         This 105klm section of highway is significant as a strategic
                                         connection highway and its extent of Black Spots. Detailed testing
                                         has confirmed the extent of non-coverage.

                                         Despite a small population base, this agricultural area warrants a
                                         detailed evaluation for the Mobile Black Spot Funding Round 2.

                                         To actively service this whole area may take an additional 3-4
                                         mobile sites. Using Mobile Black Spot Programme funding to
                                         service the centre of this area would at least reduce the significant
                                         section of Black Spot.

The DEG report forms the initial basis for effectively seeking to reduce Black Spots and progress to a
higher standard of communications coverage.
Whitsunday ROC and the Isaac Regional Council will now need to continue building the partnership
with the carriers based on knowledge of their networks and an insight into carriers’ intent to deliver
a high standard where it is commercially viable. A key part of building the partnership with carriers is
to demonstrate a willingness to encourage the uptake of services on the network by providing a good

 Digital Economy Group Pty Ltd             Commercial in Confidence
                                                                                                    3|P age
 ABN 48 153 285 191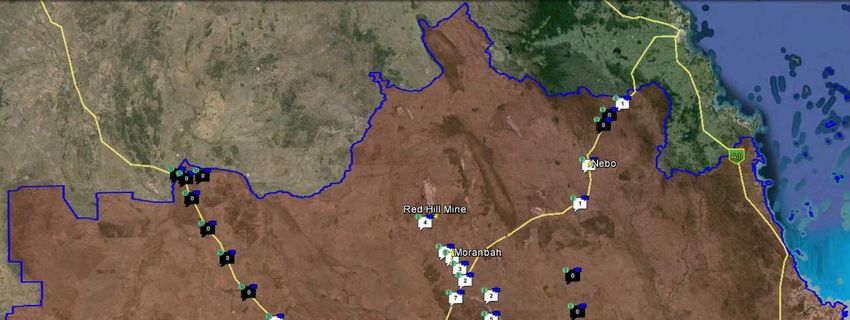
Isaac Regional Council                  Mobile Phone and Device
                                         Black Spots Connectivity
                                               Assessment

communications program. When developed in consultation with the carriers, independent of
individual carriers, business and community can identify ways to use mobile networks to achieve
productivity benefits for their business. This helps carriers to achieve greater viability for investment.
The Whitsunday ROC and the Isaac Regional Council region has the potential to influence the carrier
investment programs, achieve better services for the region and move to the right side of the digital
divide. The best way to do this is by using this baseline report and continuing the facilitation of mobile
communications coverage and good partnerships.

 Digital Economy Group Pty Ltd              Commercial in Confidence
                                                                                               4|P age
 ABN 48 153 285 191
Isaac Regional Council                          Mobile Phone and Device
                                                    Black Spots Connectivity
                                                          Assessment

2. Introduction
Mobile phone and broadband services continue to be the major growth area of the Australian
telecommunications market. Mobile use of the internet for business and personal use is a major
influence in this growth.

At the time Australia’s population had reached 22.8 million (30 June 2011) there were 29.28 million
mobile services (voice and data). Telstra reported recently that 4G data use for Australians was
doubling every 4 months and the number of 4G customers had doubled in 6 months.

Connectivity is becoming an essential feature for car buyers. A new study by AT&T Drive Studio and
Ericsson has found connectivity to be a critical factor for car buyers looking to make a new purchase.
The study, based on the opinions of customers likely to buy a car in the next three years from the US,
Germany, Brazil, Mexico and China, found increased awareness and demand for in-vehicle
connectivity and more importantly, connected car services such as internet radio, navigation service
with real time traffic updates, and on board Wi-Fi hotspot (Refer Appendix 1).

This is significant for all areas of Australia as the rapid growth is forecast to continue creating a digital
divide for those areas where mobile connectivity is reduced or compromised compared with the
capital cities.

The Whitsunday ROC has engaged the Digital Economy Group to complete a Mobile Phone and Device
Black Spots Connectivity Assessment for the Whitsunday region. This includes the preparation of
individual reports for the 3 local governments.

This report has been prepared specifically for the Isaac Regional Council.

1   Australian Bureau of Statistics, 2006 Census.

    Digital Economy Group Pty Ltd                     Commercial in Confidence
                                                                                                  5|P age
    ABN 48 153 285 191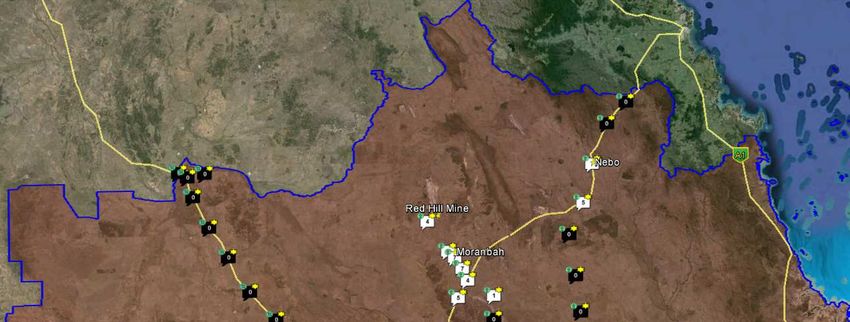
Isaac Regional Council Mobile Phone and Device
Black Spots Connectivity
Assessment
3. Methodology
The methodology used by DEG for independent Mobile Coverage Testing (MCT) has been developed
over five years of ground proofing and evolving discussions with carriers. The methodology follows
seven steps:
1. establish the study area
2. capturing current carrier coverage maps
3. create carrier infrastructure maps showing active sites
4. identifying testing routes and site test locations
5. completing the three selected core testing methods:
5.1. signal strength
5.2. network performance and
5.3. time series network performance
6. establish carrier Black Spot and determine priority network upgrades
7. providing a localised implementation plan
3.1. The Study Area
The study area for the whole project is the Whitsunday ROC area. The study area of this report is the
Isaac Regional Council.
Map 2: Study Area
Source: Google Earth 2015, Queensland Local Government Boundaries & DEG interpretation.
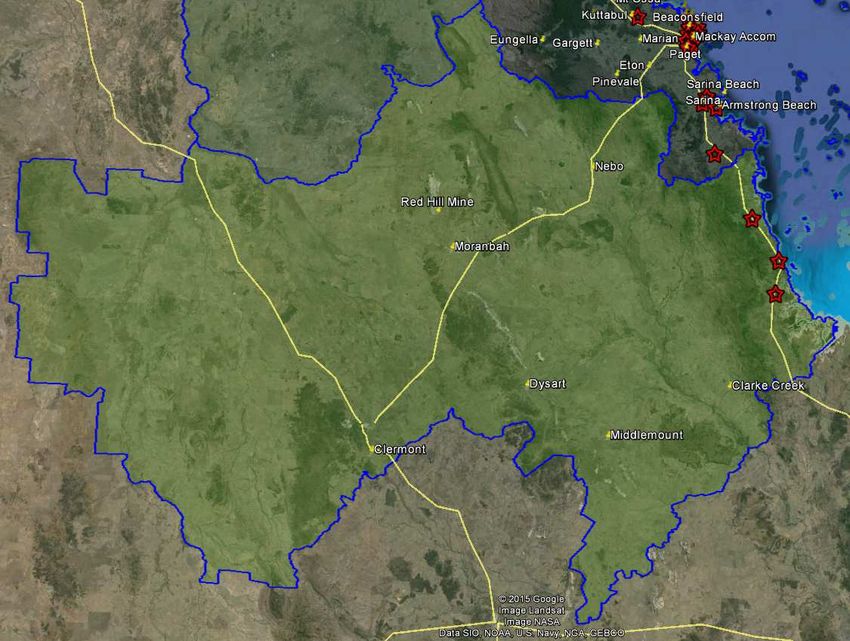
3.2. Current Carrier Coverage
Each of the three current active carriers publish indicative mobile broadband coverage maps on their
respective websites2 3 4. Carrier coverage maps are updated and modified from time to time. The
capture of this information allows DEG to establish the baseline coverage for each carrier in each of
the detailed study areas. These maps will allow the reader to compare current advertised coverage
2 http://www.telstra.com.au/mobile-phones/coverage-networks/our-coverage/mobile-broadband/
3
http://www.vodafone.com.au/aboutvodafone/network/checker
4 https://www.optus.com.au/network/mobile/coverage
Digital Economy Group Pty Ltd Commercial in Confidence
6|P age
ABN 48 153 285 191Isaac Regional Council Mobile Phone and Device
Black Spots Connectivity
Assessment
for each of the carriers as it relates to their own localities. This baseline information is a key reference
point for expectations relating to the service levels of each of the carriers.
Note: Each of the carriers provides detailed caveats regarding the propagation characteristics of networks and
mobile broadband. Current versions of these considerations can be found on the relevant carrier websites as it
changes from time to time.
Map 3: Telstra Mobile Phone and Broadband Coverage
Source: http://www.telstra.com.au/mobile-phones/coverage-networks/our-coverage/ 22 November 2015
Digital Economy Group Pty Ltd Commercial in Confidence
7|P age
ABN 48 153 285 191Isaac Regional Council Mobile Phone and Device
Black Spots Connectivity
Assessment
Map 4: Optus Mobile Broadband Coverage
Source https://www.optus.com.au/network/mobile/coverage Sourced: 22 November 2015
Map 5: Vodafone Mobile Broadband Coverage
Source: http://www.vodafone.com.au/aboutvodafone/network/checker Sourced: 22 November
2015
Digital Economy Group Pty Ltd Commercial in Confidence
8|P age
ABN 48 153 285 191Isaac Regional Council Mobile Phone and Device
Black Spots Connectivity
Assessment
3.3 Current Carrier Sites and ACMA Licences overview
All carrier radio licences in Australia are registered and managed by the Australian Communications
Media Authority (ACMA). The following map for Isaac Regional Council shows all current active radio
licences for Telstra, Optus and Vodafone. Carriers use different spectrum and technologies to deliver
connectivity for mobile phone calls and mobile internet. There is no consistent radius from a site nor
can it be expected that every site will generate 360 degree coverage. Local topography and vegetation
has a big impact on the ability of a device to secure a signal. Likewise, using a phone or internet
connected device indoors can significantly reduce the user experience.
nbn has been set with the challenge to deploy approx. 2,400 sites by mid-2018. nbn has appointed
Ericsson on a $1Billion plus contract. Many of the 2,400 sites required will have to be new sites
(particularly in regional and rural areas), as the existing three carriers have not extended their reach
to many of these areas.
Some sites are colocation (using existing radio transmission sites) with the balance being Greenfield
sites in new areas, potentially providing future mobile network expansion with reduced cost and
timeframe.
Map 6: Current Mobile Carrier Sites – Isaac Regional Council
Source: ACMA Radio Frequency Licences (Telstra, Optus & Vodafone) at 30 October 2015, Google
Earth 2015, Queensland Local Government Boundaries & DEG interpretation.
3.4 Carrier Baseline
The carrier baseline developed below uses the most recent release of ACMA data (capturing licence
information up to the 30th October 2015). The full database contains over 30 columns of information
and many thousands of licences for all radio frequency licences in Australia. This has been filtered to
ensure only the Telstra, Optus and Vodafone radio licence information is used. This is further filtered
to remove satellite earth receive and send sites, navigation and aeronautical equipment maintained
by these companies.
Digital Economy Group Pty Ltd Commercial in Confidence
9|P age
ABN 48 153 285 191Isaac Regional Council Mobile Phone and Device
Black Spots Connectivity
Assessment
Mobile broadband networks have two key components. The first is the transmission network, which
sends and receives data signals to the site and the second is the local access network – from the user
to the tower. The transmission network can be connected to a tower in two ways – either directly by
optic fibre or by wireless microwave. Carriers prefer to have optic fibre connectivity for all sites,
however, the microwave wireless network is more cost efficient to deploy to distant sites or in
locations with relatively small data transfers. In rural areas it is more common to have microwave
connectivity.
The transmission network usually consists of two types of set up. Point to point and point to multi
point. Locations set up as point to point only are retransmission sites. They therefore have the
potential to be upgraded with far less cost than a completely new site. A business case demonstrating
the number of clients served or strategic benefit is still required. Of the three carriers, Telstra has
more of these assets than Vodafone and Optus.
The local access network has one or more bands of spectrum deployed based on spectrum for the
areas, expected traffic demands on the site and other related factors. Local Access licences breakdown
into the bands of spectrum deployed in the area. The acquisition of spectrum is expensive and
complex, as parts of Australia are broken into areas including urban and non-urban. Depending on the
area and the population, carriers will seek to deploy spectrum to reflect their licences and the
strongest attributes to give ‘coverage’ to achieve the best possible results. Having two bands of
spectrum deployed across the region is the minimum objective.
3.5 Testing Methodology
There are three testing methods used to inform this report:
1. signal strength
• Call drop out for Voice and 3G
• 4G LTE
2. network performance
3. time series network performance
Each testing method serves to build a comprehensive picture of the service standards from all three
carriers and inform the priority builds across the tested area.
3.5.1 Network Performance Tests
The Network Performance tests are sited to evaluate the performance of specific carrier sites and
where possible, also test spectrum performance. The Network Performance Tests (NPTs) are
completed to validate the Signal Strength results and to challenge the carrier network with download,
upload and network response time. This test methodology reflects a real world scenario for a user,
downloading a 7.5Mb item and uploading a 7.5Mb item. Both tests are aggregated into a score as seen
in Table 1 below.
Table 1: Network Performance Test Scores
Score Latency/Ping (ms) Download Speed (in Mbps) Upload Speed (in Mbps)
0 - 0 0
1 2000+ 0.01 – 0.25 0.01-0.249
2 1500-1999 0.26-0.50 0.250-0.500
3 1200-1499 0.51- 0.99 0.500-0.749
4 1000-1199 1.00 -1.99 0.750-0.99
5 800-999 2.00 -2.99 1.00-1.99
6 600-799 3.00 – 3.99 2.00-2.49
7 500-599 4.00 – 4.99 2.50-4.99
Digital Economy Group Pty Ltd Commercial in Confidence
10 | P a g e
ABN 48 153 285 191Isaac Regional Council Mobile Phone and Device
Black Spots Connectivity
Assessment
Score Latency/Ping (ms) Download Speed (in Mbps) Upload Speed (in Mbps)
8 300-499 5.00 – 9.99 5.00-7.49
9 200-299 10.00 – 19.99 7.50-9.99
10 100-199 20.00 – 49.99 10.00-14.99
11 75-99 50.00-74.99 15.00-19.99
12 50-74 75.00-99.99 20.00-29.99
13 30-49 100-124.99 30.00-39.99
14 20-29 125-149.99 40.00-49.99
15 Less than 20 150 + 50+
3.5.2 Network Performance Time Series Testing
The primary Time Series Test used in the Mobile Coverage Testing program is 10 Network Performance
Tests in a series. This serves to validate the individual Network Performance Tests and puts the
individual networks and the devices under a spot light. The overlay of all three test results onto the
same graph (sample below) clearly illustrates the network performance.
Figure 1: Benchmark Location Brisbane CBD – Time Series Testing
14
12
10
8
Mbps
6
4
2
0
1 2 3 4 5 6 7 8 9 10
Telstra DL Optus DL Vodafone DL
Telstra UL Optus UL Vodafone UL
Source: DEG MCT 2014
The Time Series Tests combined with the individual Network Performance Tests establishes a robust
profile of the carrier performance confirming strengths and highlighting weaknesses.
The sites used for the Isaac Region testing program are spread across the local government area and
illustrate the performance of networks with higher and lower investment strategies.
3.5.3 Testing Equipment and Presentation Limitations
While all care is taken to ensure the highest quality data capture and result presentation, there are a
number of known limitations:
tests are taken at a point in time and repeated tests may show some variation due to
network performance, weather and electronic interference. Where Time Series Testing is
used, this serves to validate the Network Performance Test results.
any network based on radio technology, device quality or local conditions may prevent or
interfere with mobile reception within coverage areas. e. g. inside concrete buildings, lift
wells, basements, tunnels and road cuttings. High rise buildings may also suffer
degradation of service
Digital Economy Group Pty Ltd Commercial in Confidence
11 | P a g e
ABN 48 153 285 191Isaac Regional Council Mobile Phone and Device
Black Spots Connectivity
Assessment
all results are indicative of signal strength at one point in time at any given location from
a given provider, are not represented in a time scale over, and therefore are not
necessarily representative of the mean signal strength in any place over a given period of
time
variations between equipment can assist or limit the results. DEG use identical
smartphones to remove most of the potential variables.
4 Australian Government Mobile Black Spot Programme and locally identified Black Spots
4.1 Mobile Black Spot Programme
In 2014, the Australian Government announced the Mobile Black Spot Programme (The Programme)
and committed $100 million towards a funding program involving eligible carriers, state, local
governments and other contributing stakeholders.
On 25 June 2015, the Round 1 sites were announced with 499 sites funded using a total funding pool
of $385 million. On the same day, the Australian government committed a further $60million as the
foundation commitment to a Round 2 of the Programme.
To assist with the identification of Black Spot locations, the Department of Communications
established a database and provided the opportunity for individuals, and organisations to register
where they considered there to be Black Spots – See Map 7 below.
Map 7: Mobile Black Spot Programme Community contributed Black Spot locations
Date: 5 December 2105 Source: http://nationalmap.gov.au/ - Layer: mobile-black-spot-
programme:database-group
The nature of the user contributed database means that there are no qualitative parameters. A user
with an Optus account may resister a site despite having Telstra and Vodafone coverage and so on.
The concentration of Submitted Black Spots in the Isaac area highlights this. In addition, areas that are
Black Spots may not have been nominated. To qualify for the Programme, an area must not have
signal from any of the three carriers.
In the Whitsunday ROC area, three sites were identified for funding from Round 1:
Gargett - Mackay RC
Bowen Developmental Road, between Bowen and Collinsville – Whitsunday RC
Clarke Creek – Isaac RC5
5
Note. The Clarke Creek site identified as a Round 1 site as a result of earlier testing and validation by DEG in
2012.
Digital Economy Group Pty Ltd Commercial in Confidence
12 | P a g e
ABN 48 153 285 191Isaac Regional Council Mobile Phone and Device
Black Spots Connectivity
Assessment
Each of the three local governments share extensive and pervasive three carrier Black Spots that
warrant investigation for Round 2 of the Programme.
4.2 Mobile Black Spot Programme – Round 2
Round 2 of the Programme is expected to operate under similar guidelines as the first round of the
Programme. The Government will review the results of Round 1 to determine if there should be any
changes.
Round 2 of the Programme will offer further opportunities to meet unmet demand and provide
coverage to more locations around regional and remote Australia.
The competitive selection process for the second round of funding is expected to commence in 2016,
after allowing time for further locations to be nominated by members of the public. The locations to
be funded under Round 2 are expected to be announced by the end of 2016.
Following the completion of the testing and prioritisation process, Whitsunday ROC will need to
complete the online Black Spot Nomination Form6. DEG will undertake supporting advocacy as per
the contract. The Whitsunday ROC together with each of the three Councils are encouraged to engage
with local, state and commonwealth representatives to seek letters of support for priority locations.
Areas with additional site assessments and potential contributions generated higher success rates
than areas that simply nominated Black Spot locations.
4.3 Locally identified Black Spots
Prior to testing, Whitsunday ROC provided DEG with the following known Black Spot locations in the
Isaac Regional Council Area.
Peak Downs Highway between the retreat and the Mt Spencer turnoff
This location proved to be a clear candidate for the Programme and has been included as a priority
location for Isaac.
O’Neil Street, Moranbah (Steven Tye)- very poor phone / data services, in addition to poor quality
ADSL services
Testing for mobile coverage was conducted
here. O’Neil Street Moranbah – Strong
Telstra Voice & 3G Signals, No Vodafone and
very weak Optus. Telstra Network
Performance Test result was 3.09 Mbps
upload, 49Mbps download and a ping or
Latency core of 137ms. This indicated that
Telstra has its 4GX network operating in
Moranbah with good coverage to this
location. It is likely that there are no/limited
ADSL2+ ports in Moranbah due to the
expected rollout of NBN in the next 2-3
years.
6
https://www.communications.gov.au/blackspots
Digital Economy Group Pty Ltd Commercial in Confidence
13 | P a g e
ABN 48 153 285 191Isaac Regional Council Mobile Phone and Device
Black Spots Connectivity
Assessment
5 Mobile Coverage Testing Results
The Mobile Phone and Device Black Spots Connectivity Assessment for the Isaac Regional Council area
highlights the digital divide that the region is seeking to overcome. The Isaac Regional Council area
can be characterised as being regional and rural when referenced against the Digital Divide and
Location Comparison developed by DEG for mobile coverage assessment.
Council and regional stakeholders will need to focus on reducing the extent of mobile phone and
mobile broadband Black Spot coverage and push for higher penetration of 4G and 4G Advanced.
Capital cities and urban locations may always have another level of technology first, but regions need
to push to narrow the divide and remain attractive to retain population and attract new local
investment.
Table 2: Digital Divide and Location Comparison
Source: DEG 2015
5.1 Tested Routes
The proposed testing routes for the Isaac Regional Council included approximately 799klms of testing.
Approximately 731klms were driven capturing Voice and 3G results and 68klms for 4G LTE. The map
below illustrates the actual Voice 3G and 4G LTE routes completed during testing.
Map 8: Routes used for Voice, 3G & Call Drop together with testing for 4G LTE
Voice, 3G & Call Drop Testing 731klms 4G LTE Testing – 63klms
Sources: Google Earth 2015, Queensland Local Governments & DEG overlay
5.2 Signal Strength
The signal strength testing is undertaken for each of the three major carriers: Telstra, Optus and
Vodafone. The smart phone devices are typically set to generate markers every 50m.
Digital Economy Group Pty Ltd Commercial in Confidence
14 | P a g e
ABN 48 153 285 191Isaac Regional Council Mobile Phone and Device
Black Spots Connectivity
Assessment
The tests are exported to a GIS platform to allow a rapid on site assessment of the full range of signal
strengths from Low Signal Range to High Signal Range and Black Spot locations. This assessment phase
also involves a comparison of the test results with the carrier advertised coverage maps. The Signal
Strength Test evaluates the strength of the signal from the local tower to the testing location.
Figure 2: Signal Strength – Rural Town (left) & – Town Centre (right)
Sources: Google Earth 2015 and DEG 2015
The Signal Strength Test involves the capture of phone signal strengths from 0 through to 31. Where
the signal is zero, a Black Spot is registered. The remaining 31 bands are broken into:
1-10 (red shades) as the Low Signal Range, poorest signals
11-20 (blue shades) as the Mid Signal Range representing the middle of the spectrum and
21-31 (green shades) representing the High Signal Range and the strongest signals possible
5.2.1 Voice and 3G Black Spots
Black Spots are locations or sections of road where no signal can be found, resulting in failure to
connect to the network. The identification of a Black Spot (Map below) begins with the signal strength
markers collected across the region.
The Voice & 3G signal strength testing for the Isaac covered approx. 731klms and generated approx.
14,620 markers for each of the three carriers (with signal strength taken every 50m). The resultant
43,860 markers provide a strong and detailed evidence base showing the real extent of network
coverage for mobile phones.
This data has then been filtered and mapped to highlight coverage Black Spots. The Map below shows
the roads tested and the extent of Black Spots in the area. The colour code is as follows:
Black – no signal for Telstra, Optus and Vodafone
Orange - Optus and Vodafone have no signal – Telstra is generating a signal
Yellow – No Optus signal – Telstra and Vodafone have signal
Red - No Vodafone signal – Telstra and Optus have signal
Blue – No Telstra signal – Optus and Vodafone have signal
Green – Telstra and Optus have no signal – Vodafone has signal
Purple – Telstra and Vodafone have no signal – Optus has signal
Of the 731 klms driven in Isaac, 213klms or 29% were blackspots for all three carriers. Where Telstra
does have coverage, but Optus and Vodafone do not is a further 153klm or almost 21%. The absence
of Vodafone here makes the greatest impact with 279klms or a staggering 48% of roads tested
Digital Economy Group Pty Ltd Commercial in Confidence
15 | P a g e
ABN 48 153 285 191Isaac Regional Council Mobile Phone and Device
Black Spots Connectivity
Assessment
where there is no Vodafone coverage and Telstra and Optus are present. A small 11klms or 1.5% of
the roads tested have Optus but not Telstra or Vodafone. This leaves only 73klms or 10% of Isaac
roads tested with three carriers present.
Map 9: Voice, 3G and Call Drop Black Spots
Sources: Google Earth 2015, Queensland Local Government Areas & DEG interpretation
There are many candidates for the Programme and clear opportunities for new coverage by Vodafone
and Optus.
Table 3: Summary of Voice, 3G & Call Drop Black Spots
Voice, 3G and Call Drop Signal Strength Coverage klms percent
White - coverage from all three carriers 73.99 10.12
Black – no signal for Telstra, Optus and Vodafone 213.67 29.23
Orange - Optus and Vodafone have no signal – Telstra has signal 153.16 20.95
Yellow – No Optus signal – Telstra and Vodafone have signal 0 0.00
Red - No Vodafone signal – Telstra and Optus have signal 279.04 38.17
Blue – No Telstra signal – Optus and Vodafone have signal 0 0.00
Green – Telstra and Optus have no signal – Vodafone has signal 0 0.00
Purple – Telstra and Vodafone have no signal – Optus has signal 11.14 1.52
Total 731 100
Digital Economy Group Pty Ltd Commercial in Confidence
16 | P a g e
ABN 48 153 285 191Isaac Regional Council Mobile Phone and Device
Black Spots Connectivity
Assessment
5.2.2 4G LTE Black Spots
Digital Economy Group tested for 4G LTE signals in the Isaac Regional Council area in key urban
locations and where return drives provided the opportunity for additional capture to occur. The
extensive Black Spot (black- all three carriers) is typically in rural and remote road locations. Optus
and Vodafone have no 4G presence that was detected.
Isaac Regional Council and Whitsunday ROC are encouraged to seek a facilitated rollout for the region
to improve coverage, capacity and competition.
Table 4: Summary of 4G Black Spots for the Isaac Regional Council Area
4G LTE Signal Strength Coverage Category klms percent
White - coverage from all three carriers 0 0.00
Black – no signal for Telstra, Optus and Vodafone 40.71 60.20
Orange - Optus and Vodafone have no signal – Telstra has signal 26.91 39.80
Yellow – No Optus signal – Telstra and Vodafone have signal 0 0.00
Red - No Vodafone signal – Telstra and Optus have signal 0 0.00
Blue – No Telstra signal – Optus and Vodafone have signal 0 0.00
Green – Telstra and Optus have no signal – Vodafone has signal 0 0.00
Purple – Telstra and Vodafone have no signal – Optus has signal 0 0.00
Total 67.62 100
Map 10: Isaac 4G LTE Black Spots
Sources: Google Earth 2015, Queensland Local Government Areas & DEG interpretation
Digital Economy Group Pty Ltd Commercial in Confidence
17 | P a g e
ABN 48 153 285 191Isaac Regional Council Mobile Phone and Device
Black Spots Connectivity
Assessment
5.3 Network Site Test locations and assessment overview
Network Performance Tests were conducted in 49 locations across the Isaac Regional Council area in
November 2015. The testing methodology (outlined above) replicates a real world user experience.
Whilst the individual site tests do allow for network performance variation, the sample Time Series
Tests below demonstrate that network performance generally remains within a band. As a result,
network performance results are generally within plus or minus one of that score achieved when
repeated over time. The Map below shows the results for Telstra in the Isaac Regional Council area.
To see all three carrier results together refer to Appendix 4.
Digital Economy Group Pty Ltd Commercial in Confidence
18 | P a g e
ABN 48 153 285 191Isaac Regional Council Mobile Phone and Device
Black Spots Connectivity
Assessment
Map 11: Network Performance Test Locations (using Telstra results)
Sources: Google Earth 2015, Local Government Boundaries & DEG interpretation
A table compiling locality, test result, quality assessment and proposed action assessment has been
prepared and can be found below. The selection of the site test locations was predominantly
determined by localities and/or major road junctions or council boundaries.
The overall performance of each of the three carriers is highlighted in seven colour bands to inform
the assessment and proposed priorities for this local government. The colour bands are:
Rating Description
Locations where the user experience is approaching the advertised potential
Extremely Good (11-15)
of the network and their device with very little congestion
Highlights locations with results that stand out for the location and users are
Very Good (8-10)
actively using their connection without any delay
User experience matches expectations. Intensive applications work to a high
Good (5-7)
standard most of the time
Largely consistent with expectations however network congestion or use of
Acceptable (4)
intensive apps will result in noticeable network slow downs
Users are constantly considering how to maintain a connection or are unable
Poor (2-3)
to actively use all applications due to network performance issues.
Substandard results and typically a ‘dial-up’ speeds for download or upload
Very Poor (1)
or both. User experience will result in little or no viable use of internet.
Network fail due to the download, upload or ping failures. A download may
Network Fail - (0) be achievable but upload cannot be sustained. No functional use of the
internet.
Note: The rating for all three results in each carrier is based on the download result only.
Digital Economy Group Pty Ltd Commercial in Confidence
19 | P a g e
ABN 48 153 285 191Isaac Regional Council Mobile Phone and Device
Black Spots Connectivity
Assessment
Table 5: Network Performance Test Results and Assessment
Ref Location Telstra Optus Vodafone
UL DL PG UL DL PG UL DL PG
1 Bowen Devel. Rd/ 9km west of Gregory Devel. Rd 0 0 0 0 0 0 0 0 0
2 Bowen Devel. Rd/ Gregory Devel Rd intersection 0 0 0 0 0 0 0 0 0
3 Clermont Airport 7 10 10 7 10 10 0 0 0
4 Clermont- BP station 7 10 10 6 4 5 0 0 0
5 Clermont- Capella St 7 11 10 7 10 10 0 0 0
6 Dysart 7 9 10 3 1 9 0 0 0
7 Dysart Rd/ 15km Sth Peak Downs Hwy intersection 2 5 7 1 5 10 0 0 0
8 Dysart Rd/ 2km south of Peak Downs Mine 5 3 3 0 0 0 0 0 0
9 Dysart Rd & Saraji mine 4 9 10 0 0 0 0 0 0
10 Fitzroy Devel. Rd 5km Nth of Middlemount Rd 0 0 0 7 6 10 0 0 0
11 Fitzroy Devel. Rd 25km Nth of Middlemount Rd 4 8 9 5 8 3 0 0 0
12 Fitzroy Developmental Rd/ Isaac River Bridge 0 0 0 0 0 0 0 0 0
13 Fitzroy Devel. Rd 7km Sth of Iffley Connection Rd 0 0 0 0 0 0 0 0 0
14 Fitzroy Devel. Rd 8km Sth of Valkyrie-Isaacs River Rd 0 0 0 0 0 0 0 0 0
15 Fitzroy Developmental Rd/ Spring Creek Bridge 0 0 0 0 0 0 0 0 0
16 Gregory Devel. Rd Isaac Regional Council Boundary 0 0 0 0 0 0 0 0 0
17 Gregory Devel. Rd 10 km Sth of Bowen Devel. Rd 0 0 0 0 0 0 0 0 0
18 Gregory Devel. Rd 27km Sth of Bowen Devel. Rd 0 0 0 0 0 0 0 0 0
19 Gregory Devel. Rd 45km Sth of Bowen Devel. Rd 0 0 0 0 0 0 0 0 0
20 Gregory Devel. Rd 65km Sth of Bowen Devel. Rd 0 0 0 0 0 0 0 0 0
21 Gregory Developmental Rd/ Frankfield Rd 2 1 1 0 0 0 0 0 0
22 Gregory Developmental Rd/ 19km Sth Frankfield Rd 1 1 1 0 0 0 0 0 0
Gregory Devel. Rd/ 6km Nth of Kilcummin-Diamond 0 0 0 0 0 0 0 0 0
23 Downs Rd
24 Gregory Devel. 14km north of Peak Downs Hwy 0 0 0 0 0 0 0 0 0
25 Gregory Developmental Rd/ Peak Downs Hwy 7 9 8 0 0 0 0 0 0
26 Gregory Hwy/ Isaac Regional Council Boundary 7 10 8 5 2 3 0 0 0
Hazledean - Peak Downs Hwy/ Isaac Council 1 9 10 7 8 9 0 0 0
27 Boundary
28 Middlemount Central 7 7 9 6 8 10 0 0 0
29 Cnr Middlemount Rd Centenary Dr Middlemount 7 7 4 5 8 9 0 0 0
30 Middlemount Rd Norwich Park Mine 5 3 10 1 3 10 0 0 0
31 Middlemount Rd Isaac Council Boundary Northwest 5 3 10 0 0 0 0 0 0
32 Moranbah Airport 3 8 8 7 8 10 0 0 0
33 Moranbah - Goonyella Rd/ Cunningham Way 7 10 10 7 8 10 0 0 0
34 Moranbah- Goonyella Rd/ O’Neill St 7 10 10 4 4 5 0 0 0
35 Nebo 5 9 9 7 7 10 0 0 0
36 Peak Downs Hwy/ West Wolfang Creek Bridge 0 0 0 0 0 0 0 0 0
37 Peak Downs Hwy/ 6kms east of Russel Park Rd 0 0 0 1 6 10 0 0 0
38 Peak Downs Hwy/ 3km north of Logan Creek Bridge 7 9 10 7 9 11 0 0 0
Digital Economy Group Pty Ltd Commercial in Confidence
20 | P a g e
ABN 48 153 285 191Isaac Regional Council Mobile Phone and Device
Black Spots Connectivity
Assessment
Ref Location Telstra Optus Vodafone
UL DL PG UL DL PG UL DL PG
39 Peak Downs Hwy/ 9km south of Dysart Rd 7 9 10 5 8 10 0 0 0
40 Peak Downs Hwy/ Dysart Rd 2 6 8 4 5 10 0 0 0
41 Peak Downs Hwy/ 8km East of Fitzroy Devel. Rd 1 7 9 5 8 1 0 0 0
42 Peak Downs Hwy/Cut Creek Bridge 0 0 0 0 0 0 0 0 0
43 Peak Downs Hwy/ Denison Creek Bridge 0 0 0 0 0 0 0 0 0
44 Peak Downs Hwy/Stockyard Creek Bridge 1 3 9 0 0 0 0 0 0
45 Red Hill Mine 4 8 1 4 3 2 0 0 0
Table 6: Consolidated Network Performance Test Scores
Rating/Carrier Telstra Optus Vodafone
Extremely Good (11-15) 1 0 0
Very Good (8-10) 15 11 0
Good (5-7) 5 5 0
Acceptable (4) 0 2 0
Poor (2-3) 4 3 0
Very Poor (1) 2 1 0
Network Fail (0) 18 23 45
Total 45 45 45
Telstra Network Performance test results and action assessment
Telstra performed reasonably well in urban areas. Out of a total of 45 test locations, Telstra has 2 that
were rated ‘Very Poor’, 4 rated ‘Poor’ and 18 that were rated ‘Network Fail’. The 20 rated ‘Good’ and
‘Very Good’ were mostly similar to Optus results nearer to urban areas of Clermont (where Telstra
had the only ‘Extremely Good’ result in the Isaac Council area), Dysart, Middlemount, Moranbah and
Nebo, as well as along the Peak Downs Highway in various places. What let Telstra down in the Isaac
region is its coverage of important arterial routes, such as Gregory Developmental Road and parts of
the Peak Downs Highway. Refer Appendix 4 for Telstra Map of Network Performance Test results.
Optus Network Performance test results and action assessment
Optus’s results were trailing behind Telstra’s by approximately 5 positive results. Optus had better
coverage in urban areas, and predominately ‘Network Fail’ sites along arterial routes such as Gregory
Developmental Road, Dysart Road, Middlemount Road, Fitzroy Developmental Road and the Peak
Downs Highway. Optus had 16 ‘Good’ and ‘Very Good’ site results and 23 ‘Network Fail’ results out of
45 locations. Refer Appendix 4 for Optus Map of Network Performance Test results.
Vodafone Network Performance test results and action assessment
In the Isaac Regional Council area, Vodafone had the only ‘Network Fail’ results of all sites tested (45).
They had the worst coverage of all three carriers, as most of their coverage is concentrated on the
East Coast. Refer Appendix 4 for Vodafone Map of Network Performance Test results.
Digital Economy Group Pty Ltd Commercial in Confidence
21 | P a g e
ABN 48 153 285 191Isaac Regional Council Mobile Phone and Device
Black Spots Connectivity
Assessment
5.4 Network Performance Time Series Tests
Network Performance tests in a time series serve to amplify the quality of the network over 10
repeated Network Performance tests. Three network characteristics are separately recorded: Ping
(latency or time to connect to the internet and return), download and upload. Within the Isaac
Regional Council area these tests were completed at 5 locations:
Clermont
Moranbah
Dysart
Middle Mount
Nebo
Figure 3: Time Series Test - Clermont
Download and Upload Speeds
50.00
40.00
30.00
20.00
10.00
0.00
1 2 3 4 5 6 7 8 9 10
Telstra Down Telstra Up Optus Down
Optus Up Vodafone Down Vodafone Up
Source: DEG 2015
In Clermont Telstra asserted its clear dominance with 4GX services – 38Mbps download average. And
3Mbps uploads. Optus coverage in Clermont in contrast is 2 generations of technology behind. At less
than 1Mb down and up, it is time for Optus to catch-up with a network upgrade if it is to keep a
customer base there. Vodafone was nowhere to be seen.
Digital Economy Group Pty Ltd Commercial in Confidence
22 | P a g e
ABN 48 153 285 191Isaac Regional Council Mobile Phone and Device
Black Spots Connectivity
Assessment
Figure 4: Time Series Test - Moranbah
Download and Upload Speeds
20.00
15.00
10.00
5.00
0.00
1 2 3 4 5 6 7 8 9 10
Telstra Down Telstra Up Optus Down
Optus Up Vodafone Down Vodafone Up
Sources: DEG 2015
In Moranbah, Optus had moved to 3G or 3.5G but is not competing with Telstra providing 4G like
speeds. Still no Vodafone.
Figure 5: Time Series Test - Dysart
Download and Upload Speeds
20.00
15.00
10.00
5.00
0.00
1 2 3 4 5 6 7 8 9 10
Telstra Down Telstra Up Optus Down
Optus Up Vodafone Down Vodafone Up
Sources: DEG 2015
In Dysart Optus struggled to connect. The ten 7.5Mb downloads and 7.5Mb uploads took a long time
to complete. Telstra required a resetting of internet but then was able to deliver respectable
connectivity. Still no Vodafone.
Digital Economy Group Pty Ltd Commercial in Confidence
23 | P a g e
ABN 48 153 285 191Isaac Regional Council Mobile Phone and Device
Black Spots Connectivity
Assessment
Figure 6: Time Series Test -Middlemount
Download and Upload Speeds
20.00
15.00
10.00
5.00
0.00
1 2 3 4 5 6 7 8 9 10
Telstra Down Telstra Up Optus Down
Optus Up Vodafone Down Vodafone Up
Sources: DEG 2015
In Middlemount Telstra remained in the lead with an average of 18Mbps with one notable dip to
12Mbps, but still managed to clear Optus’s best performance. Optus averaged 8.5Mb with a spread
between just over 5Mbps and 11Mbps. Still no Vodafone.
Figure 7: Time Series Test - Nebo
Download and Upload Speeds
12.00
10.00
8.00
6.00
4.00
2.00
0.00
1 2 3 4 5 6 7 8 9 10
Telstra Down Telstra Up Optus Down
Optus Up Vodafone Down Vodafone Up
Sources: DEG 2015
In Nebo, Optus was almost an equivalent with Telstra as they both achieved results of between 6-
8Mbps for the most part. Still no Vodafone.
5.5 Network Performance Time Series Test Carrier Comparison
The Network Performance Tests provide an opportunity to compare the performance of each carrier
location by location. Graphs have been prepared for download, upload and ping and can be reviewed
Digital Economy Group Pty Ltd Commercial in Confidence
24 | P a g e
ABN 48 153 285 191Isaac Regional Council Mobile Phone and Device
Black Spots Connectivity
Assessment
as Attachment 5. The performance of carrier networks is often focussed on the download speed.
Below Telstra, Optus and Vodafone download results highlight the fluctuations of each carrier.
Figure 8: Telstra Time Series Tests
Telstra Isaac Download Speeds
50.00
45.00
40.00
35.00
30.00
25.00
20.00
15.00
10.00
5.00
0.00
1 2 3 4 5 6 7 8 9 10
Clermont Moranbah Dysart Middlemount Nebo
Sources: DEG 2015
Telstra is a clear winner in Clermont with an average of approx. 40Mbps there. The remaining 4 sites
fit within a band from 5Mbps to 20Mbps.
Figure 9: Optus Time Series Tests
Optus Isaac Download Speeds
12.00
10.00
8.00
6.00
4.00
2.00
0.00
1 2 3 4 5 6 7 8 9 10
Clermont Moranbah Dysart Middlemount Nebo
Source: DEG 2015
The Optus Time Series results are all within two clear bands – Moranbah, Middlemount and Nebo
cover 4Mbps to 11Mbps. A second band for Clermont and Dysart, where Optus struggled to connect
and communicate with the internet.
Digital Economy Group Pty Ltd Commercial in Confidence
25 | P a g e
ABN 48 153 285 191Isaac Regional Council Mobile Phone and Device
Black Spots Connectivity
Assessment
Figure 10: Vodafone Time Series Tests
Vodafone Isaac Download Speeds
1
0.9
0.8
0.7
0.6
0.5
0.4
0.3
0.2
0.1
0
1 2 3 4 5 6 7 8 9 10
Clermont Moranbah Dysart Middlemount Nebo
Sources: DEG 2015
The lack of absence of Vodafone in Isaac is loud and clear in this graph. Zero.
Digital Economy Group Pty Ltd Commercial in Confidence
26 | P a g e
ABN 48 153 285 191Isaac Regional Council Mobile Phone and Device
Black Spots Connectivity
Assessment
5.6 Top priority locations for the Isaac Regional Council
The Isaac Regional Council priority areas are based on a consolidation of the three testing
methodologies together with anecdotal survey responses. There are two types of focus for Isaac
Regional Council to work with the carriers on:
Mobile Black Spot Programme Round 2 opportunities to remove black spots, and
improving capacity and competition where there is coverage.
The Map below identifies the roads driven with a thin pale blue line. Locations along the driven routes
without any colouring have coverage from all three carriers. To identify mobile coverage Black Spots
(areas where there is no coverage from any of the three carriers) look for the solid black lines. The
thick yellow lines represent where Telstra and Vodafone have coverage but Optus does not. The thick
red lines Telstra and Optus have coverage and Vodafone does not have coverage. The third colour,
orange, represents locations where Optus and Vodafone do not have coverage but Telstra does.
Map 12: Isaac Regional Council Priority Map
Sources: Google Earth 2015,
Queensland Local
Government Areas & DEG
interpretation
Digital Economy Group Pty Ltd Commercial in Confidence
27 | P a g e
ABN 48 153 285 191Isaac Regional Council Mobile Phone and Device
Black Spots Connectivity
Assessment
The Isaac Regional Council mobile coverage and capacity priorities are:
Priority 1 – Peak Downs Highway between the retreat and the Mt
Spencer turnoff
This location was nominated as a known Black Spot. Detailed
testing has confirmed the absence of coverage for all three
carriers. Despite a small population base, this section of the
highway has high volumes of traffic. It warrants a detailed
evaluation for the Mobile Black Spot Funding Round 2.
Priority 2 – Fitzroy Development Road between
Middlemount and Nebo
This location was identified by DEG as a Black Spot area. Detailed
testing has confirmed the absence of coverage for all three
carriers. Despite a small population base, this highway is a
strategic connection with regular volumes of traffic. It warrants a
detailed evaluation for the Mobile Black Spot Funding Round 2.
Priority 3 – Gregory Development Rd from Belyando
Crossing to 60klms north of Clermont
This 105klm section of highway is significant as a strategic
connection highway and the extent of Black Spots. Detailed testing
has confirmed the extent of non-coverage.
Despite a small population base, this agricultural area warrants a
detailed evaluation for the Mobile Black Spot Funding Round 2.
To actively service this whole area may take an additional 3-4
mobile sites. Using Mobile Black Spot Programme funding to
service the centre of this area would at least reduce the significant
section of Black Spot.
The DEG report forms the initial basis for effectively seeking to reduce Black Spots and progress to a
higher standard of communications coverage.
Whitsunday ROC and Isaac Regional Council will now need to continue building the partnership with
the carriers based on knowledge of their networks and an insight into carrier’s intent to deliver a high
standard where it is commercially viable. A key part of building the partnership with carriers is to
demonstrate a willingness to encourage the uptake of services on the network by providing a good
Digital Economy Group Pty Ltd Commercial in Confidence
28 | P a g e
ABN 48 153 285 191Isaac Regional Council Mobile Phone and Device
Black Spots Connectivity
Assessment
communications program. When developed in consultation with the carriers, independent of
individual carriers, business and community can identify ways to use mobile networks to achieve
productivity benefits for their business. This helps carriers to achieve greater viability for investment.
The Whitsunday ROC and the Isaac Regional Council region has the potential to influence the carrier
investment programs, achieve better services for the region and move to the right side of the digital
divide. The best way to do this is by using this baseline report and continuing the facilitation of mobile
communications coverage and good partnerships.
6 Conclusion
Having the mobile broadband Black Spots independently tested and mapped is the first step towards
improving the mobile broadband basis for a strong digital economy. In the same way that local
governments know, understand, and seek funding for priority infrastructure in their area, carrier
network infrastructure is also critical.
The difference with mobile digital infrastructure to traditional council infrastructure is that it is
privately owned. The primary tactic for facilitating increased investment is knowledge of the network,
its performance and choosing priority locations (in partnership with the carriers.)
Carriers look to councils for two key types of support:
The first and most important is facilitation through the approvals process. Councils need to
see the investment in new mobile sites (upwards of $800,000 per site) in the same way that a
development application delivering new employment or business growth gets support. The
recent studies by Ericson and 7Chalmers University demonstrating that doubling broadband
speeds increased the GDP by 0.3% needs to be considered
The second is the support where leases are required for use of council owned or controlled
land. Often legal firms acting for councils or councils own representatives do not seek to
facilitate the timely completion of a standard legal agreement. Each protracted completion or
delay creates a reputation profile for the local government.
Carriers enter into a more productive dialogue when a local government or Regional Organisation of
Councils has independently tested Black Spot mapping and have a strong knowledge of the digital
infrastructure of the area. Carriers ultimately have a large number of sites in various locations and
jurisdictions. Locations where approvals and leases are completed easily will have networks
established faster and sooner.
Digital Economy Group Pty Ltd Commercial in Confidence
29 | P a g e
ABN 48 153 285 191You can also read