Mobile Phone and Device Black Spots Connectivity Assessment - Greater Whitsunday ...
←
→
Page content transcription
If your browser does not render page correctly, please read the page content below
Whitsunday Regional Organisation of Councils

          Mobile Phone and Device Black Spots
               Connectivity Assessment
                        Whitsunday Regional Council
                                2 February 2016

                                      Strategy, Planning & Development
                                              Implementation Programs
                                     Research, Analysis & Measurement
                                                Mobile Coverage Testing
                                                         Digital Mapping

Digital Economy Group Pty Ltd                       P.O. Box 1191
ABN 48 153 285 191                                  Nambour, Queensland 4560
Whitsunday Regional Council          Mobile Phone and Device
                                      Black Spots Connectivity
                                            Assessment

Document History
  Version   Author                        Amendments                        Date
  V1.0        Megan Whereat               Initial Draft                     16 November 2015
  V1.1        Michael Whereat             Prepare & import test results     29 November 2015
  V1.2        Michael Whereat             Assess blackspots & priorities    5 December 2015
  V1.3        Michael Whereat             Final Draft                       13 December 2015
  V1.4        Michael Whereat             Final                             24 January 2016
  V1.5        Michael Whereat             Final with amendments             2 February 2016

Distribution List
  Person                    Title
  Heather Norris            Executive Officer, Whitsunday ROC Ltd
  Michael Whereat           Director, Digital Economy Group

  Disclaimer:
  Information in this document is based on available data at the time of writing this document.
  Digital Economy Group Pty Ltd or its officers accept no responsibility for any loss occasioned to
  any person acting or refraining from acting in reliance upon any material contained in this
  document.

  Copyright
  © Digital Economy Group 2011-15.
  This document is copyright and must be used except as permitted below or under the Copyright
  Act 1968. You may reproduce and publish this document in whole or in part for you and your
  organisation’s own personal and internal compliance, educational or non-commercial purposes.
  You must not reproduce or publish this document for commercial gain without the prior written
  consent of the Digital Economy Group Pty. Ltd.

 Digital Economy Group Pty Ltd                                     P.O. Box 1191
 ABN 48 153 285 191                                                Nambour, Queensland 4560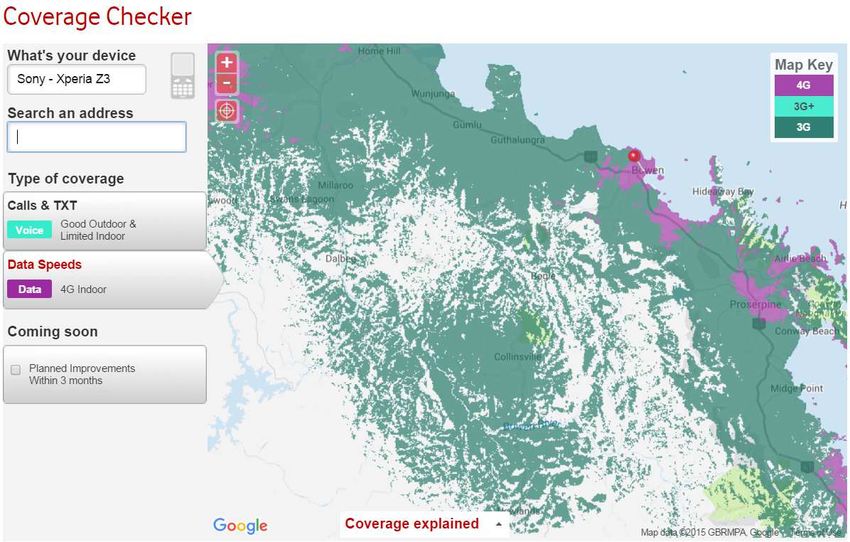
Whitsunday Regional Council                              Mobile Phone and Device
                                                          Black Spots Connectivity
                                                                Assessment

Contents
1.    Executive Summary                                                                                                                            1
2.    Introduction                                                                                                                                 6
3.    Methodology                                                                                                                                  7
3.1   The Study Area                                                                                                                               7
3.2   Current Carrier Coverage                                                                                                                     8
3.3   Current Carrier Sites and ACMA Licences overview                                                                                            10
3.4   Carrier Baseline                                                                                                                            11
3.5   Testing Methodology                                                                                                                         11
3.5.1 Network Performance Tests                                                                                                                   11
3.5.2 Network Performance Time Series Testing                                                                                                     12
3.5.3 Testing Equipment and Presentation Limitations                                                                                              13
4     Australian Government Mobile Black Spot Programme and locally identified Black Spots                                                        13
4.1   Mobile Black Spot Programme                                                                                                                 13
4.2   Mobile Black Spot Programme – Round 2                                                                                                       14
4.3   Locally identified Black Spots                                                                                                              15
5     Mobile Coverage Testing Results                                                                                                             16
5.1   Tested Routes                                                                                                                               16
5.2   Signal Strength                                                                                                                             17
5.2.1 Voice and 3G Black Spots                                                                                                                    17
5.2.2 4G LTE Black Spots                                                                                                                          19
5.3   Network Performance Test locations and assessment overview                                                                                  21
5.4   Network Performance Time Series Tests                                                                                                       24
5.5   Network Performance Time Series Test Carrier Comparison                                                                                     27
5.6   Top priority locations for the Whitsunday Regional Council                                                                                  29
6     Conclusion                                                                                                                                  33
Appendix 1: AT&T Drive Studio and Ericsson Release Global Study on Connected Car Buyers                                                           34
Appendix 2: Mobile Black Spot Programme Round 1 Successful Sites                                                                                  35
Appendix 3: Current Carrier Infrastructure                                                                                                        36
Appendix 4: Network Performance Test Results by Carrier                                                                                           39
Appendix 5: Network Performance Time Series Test Graphs                                                                                           42
Appendix 6: Terms and Abbreviations                                                                                                               47

Table of Figures
Figure 1: Benchmark Location Brisbane CBD – Time Series Testing ..................................................... 12
Figure 2: Signal Strength – Rural Town (left) & – Town Centre (right) ................................................. 17
Figure 3: Time Series Test – Airlie Beach .............................................................................................. 24
Figure 4: Time Series Test – Shute Harbour.......................................................................................... 25
Figure 5: Time Series Test - Proserpine................................................................................................. 25
Figure 6: Time Series Test - Collinsville ................................................................................................. 26
Figure 7: Time Series Test - Bowen ....................................................................................................... 26
Figure 8: Telstra Time Series Tests........................................................................................................ 27
Figure 9: Optus Time Series Tests ......................................................................................................... 27
Figure 10: Vodafone Time Series Tests ................................................................................................. 28

Table of Maps
Map 1: Whitsunday Regional Council Priority Map ................................................................................ 2
Map 2: Study Area .................................................................................................................................. 7
Map 3: Telstra Mobile Phone and Broadband Coverage ........................................................................ 8
Map 4: Optus Mobile Broadband Coverage ........................................................................................... 9
Map 5: Vodafone Mobile Broadband Coverage ..................................................................................... 9

 Digital Economy Group Pty Ltd                                Commercial in Confidence
 ABN 48 153 285 191
                                                                                                                                        i|Page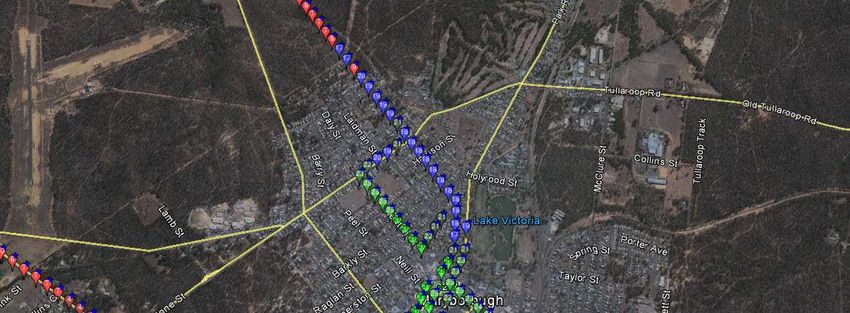
Whitsunday Regional Council                         Mobile Phone and Device
                                                     Black Spots Connectivity
                                                           Assessment

Map 6: Current Mobile Carrier Sites – Whitsunday Regional Council .................................................. 10
Map 7: Mobile Black Spot Programme Community contributed Black Spot locations ........................ 14
Map 8: Routes used for Voice, 3G & Call Drop together with testing for 4G LTE ................................ 17
Map 9: Voice, 3G & Call Drop Black Spots ............................................................................................ 18
Map 10: Whitsunday Regional Council 4G LTE Black Spots .................................................................. 20
Map 11: Network Performance Test Locations (using Telstra results)................................................. 21
Map 12: Whitsunday Regional Council Priority Map ............................................................................ 29

Tables
Table 1: Network Performance Test Scores.......................................................................................... 12
Table 2: Digital Divide and Location Comparison ................................................................................. 16
Table 3: Summary of Voice, 3G & Call Drop Black Spots ...................................................................... 19
Table 4: Summary of 4G Black Spots for the Whitsunday Regional Council Area ................................ 20
Table 5: Network Performance Test Results and Assessment ............................................................. 22
Table 6: Consolidated Network Performance Test Scores ................................................................... 23

 Digital Economy Group Pty Ltd                          Commercial in Confidence
 ABN 48 153 285 191
                                                                                                                           ii | P a g e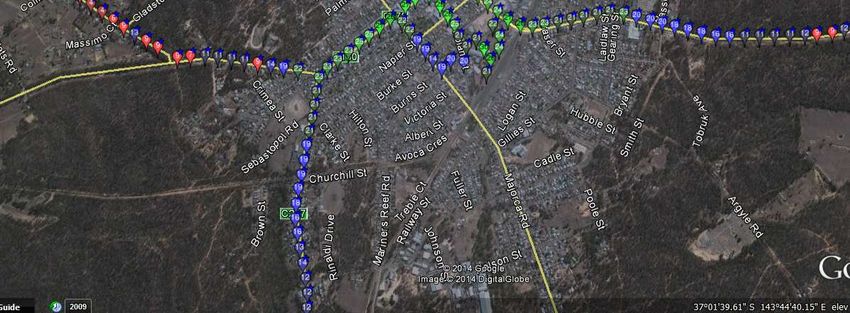
Whitsunday Regional Council              Mobile Phone and Device
                                          Black Spots Connectivity
                                                Assessment

1. Executive Summary
Mobile connectivity, for phone calls and broadband, has become a utility expected by business,
residents and the community. The rapid development of new technologies and faster connection
options has resulted in regional and rural areas of Australia being on the wrong side of the ‘Digital
Divide’. In our capital cities there are virtually no Black Spots for coverage and rapid deployment of
the latest generation of connectivity. On the other side of the ‘Digital Divide’ Black Spots form the
largest part of the landscape and their townships have technology a generation or two behind.
For Local Government areas such as Whitsunday Regional Council, the challenge is to find ways to
partner with the three privately owned carriers to reduce the extent of Black Spot coverage and
increase access to quality internet data transfer speeds. They must seek to drive expanded and
advanced deployment of the best generation technology the carriers are prepared to invest in.
Managing the region in times of disaster or emergency, providing a positive experience for visitors
and delivering greater productivity for businesses is now a constant requirement for successful local
government areas.

Whitsunday ROC has engaged the Digital Economy Group (DEG) to benchmark carrier performance
and identify priorities to reduce Black Spots and improve coverage across the region. This report has
been prepared specifically for Whitsunday Regional Council (Council) to provide a local perspective.
An overarching report for the whole region has also been produced to draw the key findings of all 3
individual reports together and guide the regional priorities.
This report contains the following three elements:
          identify the Voice, 3G Black Spots, Call Drop and sample 4G LTE in the urban areas
          test the network performance to identify where network upgrades are required
          list the priority locations and short list for Council and the region to pursue the Mobile Black
          Spot Programme Round 2 funding

A total of approximately 948klms of roads were driven across the Whitsunday Regional Council area.
For the voice, 3G and call drop testing, 695 klms were driven and 253 klms for 4G LTE testing. A total
of 45 individual Network Performance Tests were also completed to test the validity of the coverage
maps and confirm that the signal strength maps translated into actual connectivity. A total of 5 Time
Series Network Performance tests were performed to illustrate the quality of each respective network
and associated reliability.

 Digital Economy Group Pty Ltd              Commercial in Confidence
                                                                                                1|P age
 ABN 48 153 285 191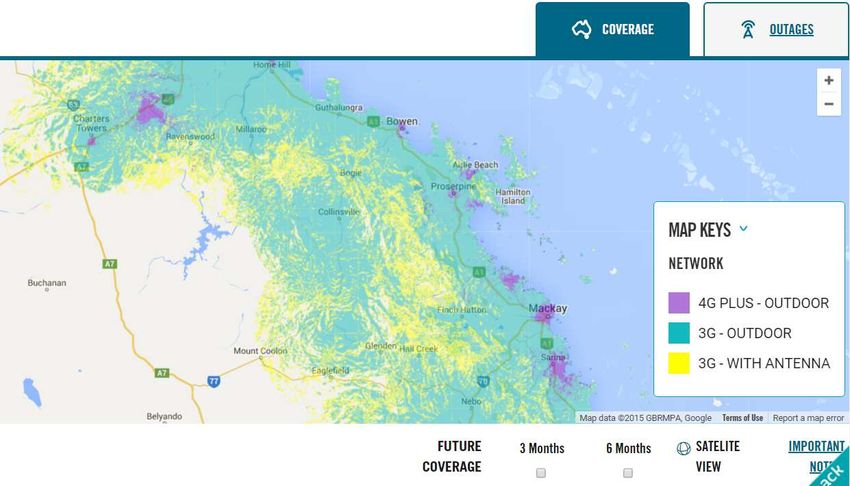
Whitsunday Regional Council Mobile Phone and Device
Black Spots Connectivity
Assessment
The top priority locations for the Whitsunday Regional Council:
The Whitsunday Regional Council priority areas are based on a consolidation of the three testing
methodologies together with anecdotal survey responses. There are two types of focus for
Whitsunday Regional Council to work with the carriers on:
Mobile Black Spot Programme Round 2 opportunities to remove Black Spots, and
improving capacity and competition where there is coverage.
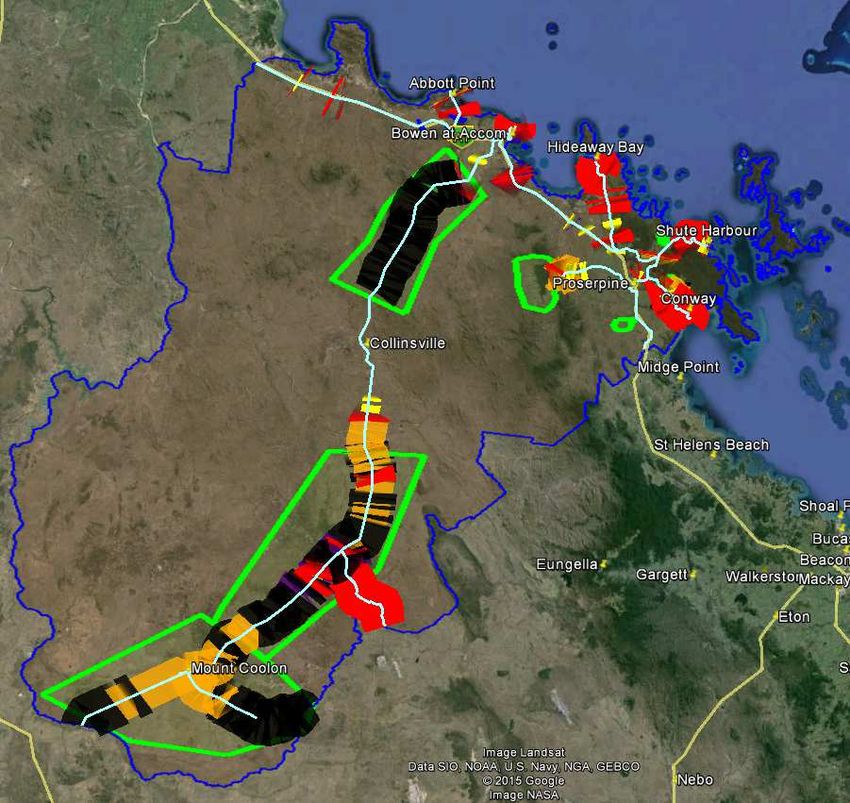
The Map below identifies the roads driven with a thin pale blue line. Locations along the driven routes
without any colouring have coverage from all three carriers. To identify mobile coverage Black Spots
(areas where there is no coverage from any of the three carriers) look for the solid black lines. The
thick yellow lines represent where Telstra and Vodafone have coverage but Optus does not. The thick
red lines Telstra and Optus have coverage and Vodafone does not have coverage. The third colour,
orange, represents locations where Optus and Vodafone do not have coverage but Telstra does.
Map 1: Whitsunday Regional Council Priority Map
Sources: Google Earth 2015,
Queensland Local Government
Areas & DEG interpretation
Digital Economy Group Pty Ltd Commercial in Confidence
2|P age
ABN 48 153 285 191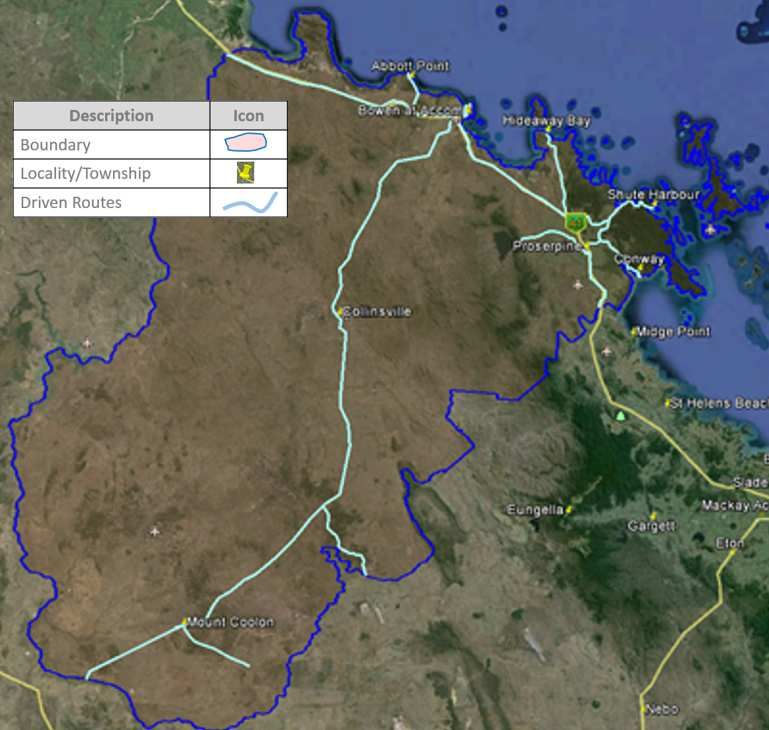
Whitsunday Regional Council           Mobile Phone and Device
                                       Black Spots Connectivity
                                             Assessment

The Whitsunday Regional Council mobile coverage and capacity priorities (draft) are:

                                                   Priority 1 – Bowen Developmental Rd between
                                                   Collinsville and Mt Coolon
                                              This is a clear, large expanse of a highly utilised road that
                                              presents a significant safety issue.
                                              This location was identified by DEG as a Black Spot. Detailed
                                              testing has confirmed the absence of coverage from all
                                              three carriers for most of the area. Despite a small
                                              population base, this section of the Bowen Developmental
                                              Rd remains a regularly used and strategic connection.

                                              It warrants a detailed evaluation for the Mobile Black Spot
                                              Funding Round 2.
                                                   Priority 2 – Bowen Developmental Rd -
                                                   North, South and West of Mt Coolon
                                              This is a clear, large expanse of highly utilised roads that
                                              present significant safety issues.

                                              This location was identified by DEG as a Black Spot. Detailed
                                              testing has confirmed the absence of coverage for all three
                                              carriers for much of the area. Despite a small population
                                              base, this section of the Bowen Developmental Rd remains
                                              a regularly used and strategic connection. The remainder
                                              of the road to Belyando Crossing and 105klms South to
                                              Clermont is also a pervasive blackspot.

                                              It warrants a detailed evaluation for the Mobile Black Spot
                                              Funding Round 2.
                                                   Priority 3 – Bowen Developmental Rd between
                                                   Bowen and Collinsville
                                                   Advised as successful in Round 1 of the Programme
                                                   (however no confirmed implementation timing from
                                                   Telstra other than “within the next three years”). This
                                                   is a clear, large expanse of a highly utilised road that
                                                   presents a significant safety issue and clearly meets the
                                                   criteria. Included here for completeness and escalation
                                                   of urgency.

 Digital Economy Group Pty Ltd           Commercial in Confidence
                                                                                                  3|P age
 ABN 48 153 285 191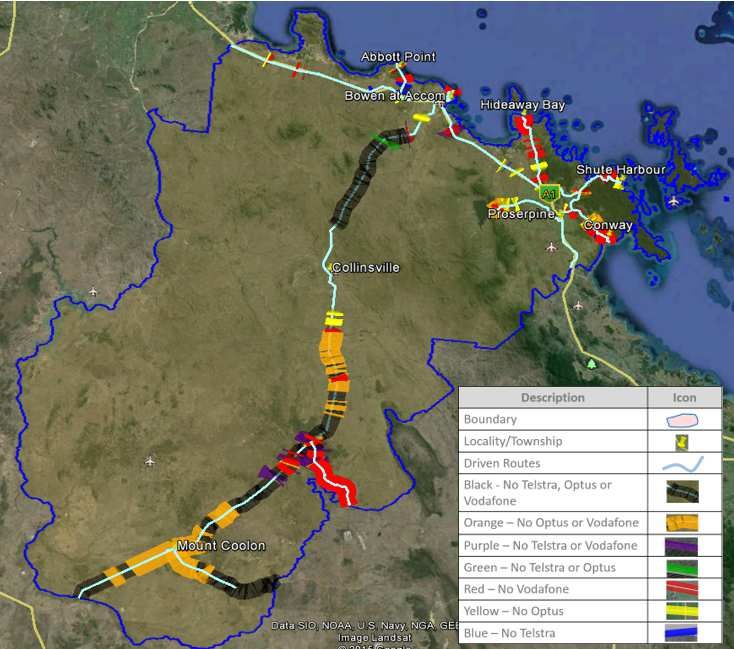
Whitsunday Regional Council     Mobile Phone and Device
                                Black Spots Connectivity
                                      Assessment

                                            Priority 4 - Woodwark (Mobile Black Spot Programme
                                            candidate area identifier QLD-0956).
                                       This rural – residential corridor to the north of Airlie Beach
                                       and Cannonvale has a community of several hundred
                                       residents and is a bush fire hazard zone.
                                       It was an unsuccessful nomination in the previous round.
                                       The mobile blackspot issues remain and it appears to meet
                                       the required criteria.

                                            Priority 5 - Whitsunday Coast Airport
                                       Whilst there is partial Telstra mobile coverage at the airport
                                       already, it is not provided by a normal external base station,
                                       but only a limited capacity NextG Distributed Antenna
                                       System micro-cell within the building. As a result, the
                                       coverage is geographically limited and the service becomes
                                       fully saturated at peak terminal times each day. It also does
                                       not provide the data capacity of a 3G or 4G service. This is
                                       a significant frustration for passengers and also presents a
                                       risk should a safety-related event occur.
                                            Priority 6 – Conway Rd towards Conway Beach
                                       This relatively small Voice and 3G Black Spot is also a 4G LTE
                                       Blackspot.

                                       Conway Road towards Conway and Wilsons Beach and
                                       expanded to include areas of Palm Grove (Mobile Black
                                       Spot Programme candidate area identifier QLD-0736) and
                                       Proserpine River. Further to the commentary in the draft
                                       ROC study, Conway Beach is not only home to a small
                                       resident population, but the broader area including Palm
                                       Grove is the location of three popular tourist and
                                       recreational destinations - Conway & Wilsons Beaches;
                                       Cedar Creek Falls; and Proserpine River / Boat Ramp.

                                            Priority 7 - Lake Proserpine / Peter Faust Dam (Mobile
                                            Black Spot Programme candidate area identifier QLD-
                                            0956).
                                       Identified by the Federal Government as a candidate area
                                       in the previous funding round, Lake Proserpine is a premier
                                       recreational and fishing location with a high number of
                                       visitors each year.
                                       There is no mobile coverage for most of the lake area and
                                       sections of the highly utilised road leading to it.

Digital Economy Group Pty Ltd     Commercial in Confidence
                                                                                           4|P age
ABN 48 153 285 191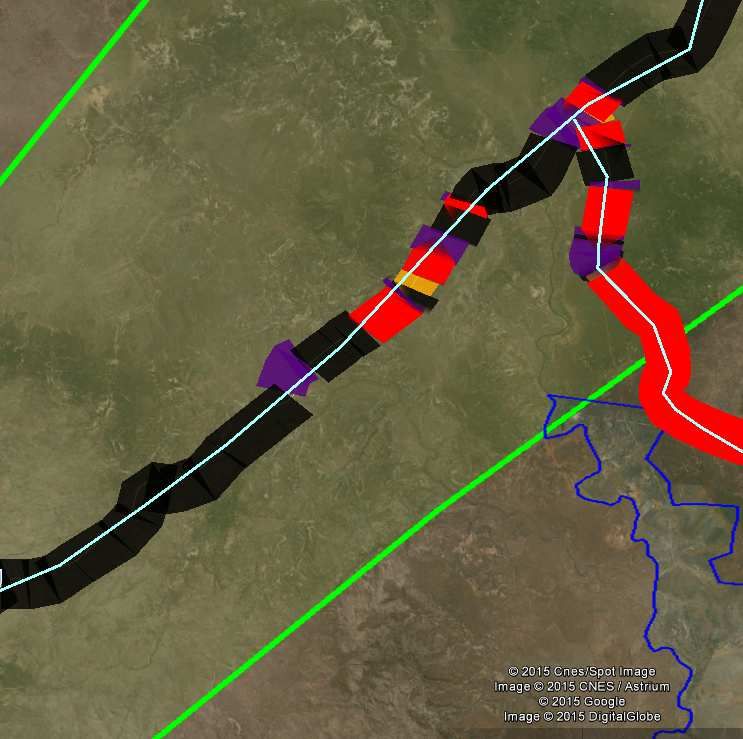
Whitsunday Regional Council             Mobile Phone and Device
                                         Black Spots Connectivity
                                               Assessment

The DEG report forms the initial basis for effectively seeking to reduce Black Spots and progress to a
higher standard of communications coverage.
Whitsunday ROC and the Whitsunday Regional Council will now need to continue building the
partnership with the carriers based on knowledge of their networks and an insight into carriers’ intent
to deliver a high standard where it is commercially viable. A key part of building the partnership with
carriers is to demonstrate a willingness to encourage the uptake of services on the network by
providing a good communications program. When developed in consultation with the carriers,
independent of individual carriers, business and community can identify ways to use mobile networks
to achieve productivity benefits for their business. This helps carriers to achieve greater viability for
investment.
The Whitsunday ROC and the Whitsunday Regional Council has the potential to influence the carrier
investment programs, achieve better services for the region and move to the right side of the digital
divide. The best way to do this is by using this baseline report and continuing the facilitation of mobile
communications coverage and good partnerships.

 Digital Economy Group Pty Ltd              Commercial in Confidence
                                                                                               5|P age
 ABN 48 153 285 191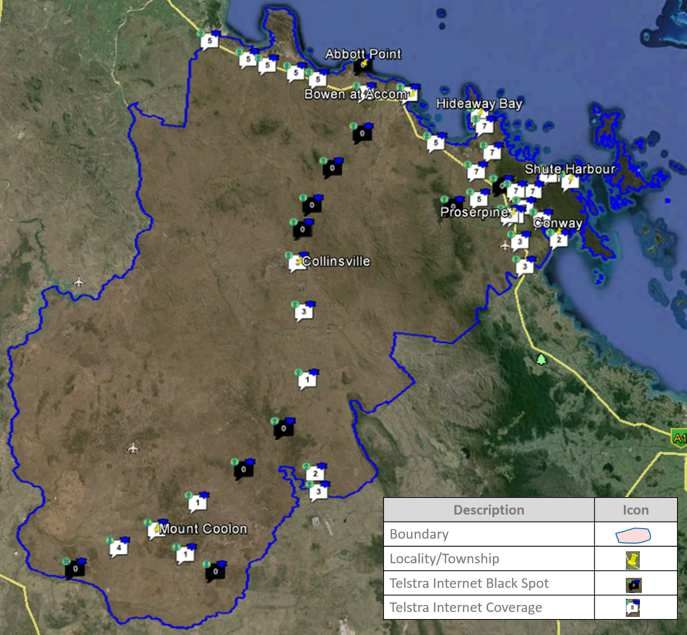
Whitsunday Regional Council                     Mobile Phone and Device
                                                    Black Spots Connectivity
                                                          Assessment

2. Introduction
Mobile phone and broadband services continue to be the major growth area of the Australian
telecommunications market. Mobile use of the internet for business and personal use is a major
influence in this growth.

At the time Australia’s population had reached 22.8 million (30 June 20111) there were 29.28 million
mobile services (voice and data). Telstra reported recently that 4G data use for Australians was
doubling every 4 months and the number of 4G customers had doubled in 6 months.

Connectivity is becoming an essential feature for car buyers. A new study by AT&T Drive Studio and
Ericsson has found connectivity to be a critical factor for car buyers looking to make a new purchase.
The study, based on the opinions of customers likely to buy a car in the next three years from the US,
Germany, Brazil, Mexico and China, found increased awareness and demand for in-vehicle
connectivity and more importantly, connected car services such as internet radio, navigation service
with real time traffic updates, and on board Wi-Fi hotspot (Refer Appendix 1).

This is significant for all areas of Australia as the rapid growth is forecast to continue, creating a digital
divide for those areas where mobile connectivity is reduced or compromised compared with the
capital cities.

The Whitsunday ROC has engaged the Digital Economy Group (DEG) to complete a Mobile Phone and
Device Black Spots Connectivity Assessment for the Whitsunday region. This includes the preparation
of individual reports for the 3 local governments.

This report has been prepared specifically for the Whitsunday Regional Council.

1   Australian Bureau of Statistics, 2006 Census.

    Digital Economy Group Pty Ltd                     Commercial in Confidence
                                                                                                   6|P age
    ABN 48 153 285 191
Whitsunday Regional Council Mobile Phone and Device
Black Spots Connectivity
Assessment
3. Methodology
The methodology used by DEG for independent Mobile Coverage Testing (MCT) has been developed
over five years of ground proofing and evolving discussions with carriers. The methodology follows
seven steps:
1. establish the study area
2. capturing current carrier coverage maps
3. create carrier infrastructure maps showing active sites
4. identifying testing routes and site test locations
5. completing the three selected core testing methods:
5.1. signal strength
5.2. network performance and
5.3. time series network performance
6. establish carrier Black Spots and determine priority network upgrades
7. providing a localised implementation plan
3.1 The Study Area
The study area for the whole project is the Whitsunday ROC area. The study area of this report is the
Whitsunday Regional Council.
Map 2: Study Area
Source: Google Earth 2015, Queensland Local Government Boundaries & DEG interpretation.
Digital Economy Group Pty Ltd Commercial in Confidence
7|P age
ABN 48 153 285 191Whitsunday Regional Council Mobile Phone and Device
Black Spots Connectivity
Assessment
3.2 Current Carrier Coverage
Each of the three current active carriers publish indicative mobile broadband coverage maps on their
respective websites2 3 4. Carrier coverage maps are updated and modified from time to time. The
capture of this information allows DEG to establish the baseline coverage for each carrier in each of
the detailed study areas. These maps will allow the reader to compare current advertised coverage
for each of the carriers as it relates to their own localities. This baseline information is a key reference
point for expectations relating to the service levels of each of the carriers.
Note: Each of the carriers provides detailed caveats regarding the propagation characteristics of networks and
mobile broadband. Current versions of these considerations can be found on the relevant carrier websites as it
changes from time to time.
Map 3: Telstra Mobile Phone and Broadband Coverage
Sourced: http://www.telstra.com.au/mobile-phones/coverage-networks/our-coverage/ 22 November
2015
2 http://www.telstra.com.au/mobile-phones/coverage-networks/our-coverage/mobile-broadband/
3
http://www.vodafone.com.au/aboutvodafone/network/checker
4 https://www.optus.com.au/network/mobile/coverage
Digital Economy Group Pty Ltd Commercial in Confidence
8|P age
ABN 48 153 285 191Whitsunday Regional Council Mobile Phone and Device
Black Spots Connectivity
Assessment
Map 4: Optus Mobile Broadband Coverage
Sourced https://www.optus.com.au/network/mobile/coverage Sourced: 22 November 2015
Map 5: Vodafone Mobile Broadband Coverage
Sourced: http://www.vodafone.com.au/aboutvodafone/network/checker Sourced: 22 November
2015
Digital Economy Group Pty Ltd Commercial in Confidence
9|P age
ABN 48 153 285 191Whitsunday Regional Council Mobile Phone and Device
Black Spots Connectivity
Assessment
3.3 Current Carrier Sites and ACMA Licences overview
All carrier radio licences in Australia are registered and managed by the Australian Communications
Media Authority (ACMA). The following map for Whitsunday Regional Council shows all current active
radio licences for Telstra, Optus and Vodafone. Carriers use different spectrum and technologies to
deliver connectivity for mobile phone calls and mobile internet. There is no consistent radius from a
site nor can it be expected that every site will generate 360 degree coverage. Local topography and
vegetation has a big impact on the ability of a device to secure a signal. Likewise, using a phone or
internet connected device indoors can significantly reduce the user experience.
nbn has been set with the challenge to deploy approx. 2,400 sites by mid-2015. Nbn has appointed
Ericsson on a $1Billion plus contract. Many of the 2,400 sites required will have to be new sites
(particularly in regional and rural areas), as the existing three carriers have not extended their reach
to many of these areas.
Some sites are colocation (using existing radio transmission sites) with the balance being Greenfield
sites in new areas, potentially providing future mobile network expansion with reduced cost and
timeframe.
Map 6: Current Mobile Carrier Sites – Whitsunday Regional Council
Source: ACMA Radio Frequency Licences (Telstra, Optus & Vodafone) at 30 October 2015, Google
Earth 2015, Queensland Local Government Boundaries & DEG interpretation.
Digital Economy Group Pty Ltd Commercial in Confidence
10 | P a g e
ABN 48 153 285 191Whitsunday Regional Council Mobile Phone and Device
Black Spots Connectivity
Assessment
3.4 Carrier Baseline
The carrier baseline developed below uses the most recent release of ACMA data (capturing licence
information up to the 30th October 2015). The full database contains over 30 columns of information
and many thousands of licences for all radio frequency licences in Australia. This has been filtered to
ensure only the Telstra, Optus and Vodafone radio licence information is used. This is further filtered
to remove satellite earth receive and send sites, navigation and aeronautical equipment maintained
by these companies.
Mobile broadband networks have two key components. The first is the transmission network, which
sends and receives data signals to the site and the second is the local access network – from the user
to the tower. The transmission network can be connected to a tower in two ways – either directly by
optic fibre or by wireless microwave. Carriers prefer to have optic fibre connectivity for all sites,
however, the microwave wireless network is more cost efficient to deploy to distant sites or in
locations with relatively small data transfers. In rural areas it is more common to have microwave
connectivity.
The transmission network usually consists of two types of set up. Point to point and point to multi
point. Locations set up as point to point only are retransmission sites. They therefore have the
potential to be upgraded with far less cost than a completely new site. A business case demonstrating
the number of clients served or strategic benefit is still required. Of the three carriers, Telstra has
more of these assets than Vodafone and Optus.
The local access network has one or more bands of spectrum deployed based on spectrum for the
areas, expected traffic demands on the site and other related factors. Local Access licences breakdown
into the bands of spectrum deployed in the area. The acquisition of spectrum is expensive and
complex, as parts of Australia are broken into areas including urban and non-urban. Depending on the
area and the population, carriers will seek to deploy spectrum to reflect their licences and the
strongest attributes to give ‘coverage’ to achieve the best possible results. Having two bands of
spectrum deployed across the region is the minimum objective.
3.5 Testing Methodology
There are three testing methods used to inform this report:
1. signal strength
• Call drop out for Voice and 3G
• 4G LTE
2. network performance
3. time series network performance
Each testing method serves to build a comprehensive picture of the service standards from all three
carriers and inform the priority builds across the tested area.
3.5.1 Network Performance Tests
The Network Performance tests are sited to evaluate the performance of specific carrier sites and
where possible, also test spectrum performance. The Network Performance Tests (NPTs) are
completed to validate the Signal Strength results and to challenge the carrier network with download,
upload and network response time. This test methodology reflects a real world scenario for a user,
downloading a 7.5Mb item and uploading a 7.5Mb item. Both tests are aggregated into a score as seen
in Table 1 below.
Digital Economy Group Pty Ltd Commercial in Confidence
11 | P a g e
ABN 48 153 285 191Whitsunday Regional Council Mobile Phone and Device
Black Spots Connectivity
Assessment
Table 1: Network Performance Test Scores
Score Latency/Ping (ms) Download Speed (in Mbps) Upload Speed (in Mbps)
0 - 0 0
1 2000+ 0.01 – 0.25 0.01-0.249
2 1500-1999 0.26-0.50 0.250-0.500
3 1200-1499 0.51- 0.99 0.500-0.749
4 1000-1199 1.00 -1.99 0.750-0.99
5 800-999 2.00 -2.99 1.00-1.99
6 600-799 3.00 – 3.99 2.00-2.49
7 500-599 4.00 – 4.99 2.50-4.99
8 300-499 5.00 – 9.99 5.00-7.49
9 200-299 10.00 – 19.99 7.50-9.99
10 100-199 20.00 – 49.99 10.00-14.99
11 75-99 50.00-74.99 15.00-19.99
12 50-74 75.00-99.99 20.00-29.99
13 30-49 100-124.99 30.00-39.99
14 20-29 125-149.99 40.00-49.99
15 Less than 20 150 + 50+
3.5.2 Network Performance Time Series Testing
The primary Time Series Test used in the Mobile Coverage Testing program is 10 Network Performance
Tests in a series. This serves to validate the individual Network Performance Tests and puts the
individual networks and the devices under a spot light. The overlay of all three test results onto the
same graph (sample below) clearly illustrates the network performance.
Figure 1: Benchmark Location Brisbane CBD – Time Series Testing
14
12
10
8
Mbps
6
4
2
0
1 2 3 4 5 6 7 8 9 10
Telstra DL Optus DL Vodafone DL
Telstra UL Optus UL Vodafone UL
Source: DEG MCT 2015
The Time Series Tests combined with the individual Network Performance Tests establishes a robust
profile of the carrier performance confirming strengths and highlighting weaknesses.
The sites used for the Whitsunday Regional Council area testing program are spread across the local
government areas and illustrate the performance of networks with higher and lower investment
strategies.
Digital Economy Group Pty Ltd Commercial in Confidence
12 | P a g e
ABN 48 153 285 191Whitsunday Regional Council Mobile Phone and Device
Black Spots Connectivity
Assessment
3.5.3 Testing Equipment and Presentation Limitations
While all care is taken to ensure the highest quality data capture and result presentation, there are a
number of known limitations:
tests are taken at a point in time and repeated tests may show some variation due to
network performance, weather and electronic interference. Where Time Series Testing is
used, this serves to validate the Network Performance Test results.
any network based on radio technology, device quality or local conditions may prevent or
interfere with mobile reception within coverage areas. e. g. inside concrete buildings, lift
wells, basements, tunnels and road cuttings. High rise buildings may also suffer
degradation of service
all results are indicative of signal strength at one point in time at any given location from
a given provider, are not represented in a time scale over, and therefore are not
necessarily representative of the mean signal strength in any place over a given period of
time
variations between equipment can assist or limit the results. DEG use identical
smartphones to remove most of the potential variables.
4 Australian Government Mobile Black Spot Programme and locally identified Black Spots
4.1 Mobile Black Spot Programme
In 2014, the Australian Government announced the Mobile Black Spot Programme (The Programme)
and committed $100 million towards a funding program involving eligible carriers, state, local
governments and other contributing stakeholders.
On 25 June 2015, the Round 1 sites were announced with 499 sites funded using a total funding pool
of $385million. On the same date, the Australian government committed a further $60miilion as the
foundation commitment to a Round 2 of the programme.
To assist with the identification of Black Spot Locations, the Department of Communications
established a database and provided the opportunity for individuals, and organisations to register
where they considered there to be Black Spots – See Map 7 below.
Digital Economy Group Pty Ltd Commercial in Confidence
13 | P a g e
ABN 48 153 285 191Whitsunday Regional Council Mobile Phone and Device
Black Spots Connectivity
Assessment
Map 7: Mobile Black Spot Programme Community contributed Black Spot locations
Date: 5 December 2105 Source: http://nationalmap.gov.au/ - Layer: mobile-black-spot-
programme:database-group
The nature of the user contributed database means that there are no qualitative parameters. A user
with an Optus account may resister a site despite having Telstra and Vodafone coverage and so on.
The concentration of Submitted Black Spots in the Mackay area highlights this. In addition, areas that
are Black Spots may not have been nominated. To qualify for the Programme, an area must not have
signal from any of the three carriers.
In the Whitsunday ROC area, three sites were identified for funding from Round 1:
Gargett - Mackay RC
Bowen Developmental Road, between Bowen and Collinsville – Whitsunday RC
Clarke Creek – Isaac RC5
Each of the three local governments share extensive and pervasive three carrier Black Spots that
warrant investigation for Round 2 of the Programme
4.2 Mobile Black Spot Programme – Round 2
Round 2 of the Programme is expected to operate under similar guidelines as the first round of the
Programme. The Government will review the results of Round 1 to determine if there should be any
changes.
5
Note. The Clarke Creek site identified as a Round 1 site as a result of earlier testing and validation by DEG in
2012.
Digital Economy Group Pty Ltd Commercial in Confidence
14 | P a g e
ABN 48 153 285 191Whitsunday Regional Council Mobile Phone and Device
Black Spots Connectivity
Assessment
Round 2 of the Programme will offer further opportunities to meet unmet demand and provide
coverage to more locations around regional and remote Australia.
The competitive selection process for the second round of funding is expected to commence in 2016,
after allowing time for further locations to be nominated by members of the public. The locations to
be funded under Round 2 are expected to be announced by the end of 2016.
The Whitsunday ROC together with each of the three Councils are encouraged to engage with local,
state and commonwealth representatives to seek letters of support for priority locations.
Areas with additional site assessments and potential contributions generated higher success rates
than areas that simply nominated Black Spot locations.
4.3 Locally identified Black Spots
Whitsunday ROC provided DEG with the following known Black Spot locations in the Whitsunday
Regional Council area following the completion of testing. These will now be used as part of the report.
Bowen Developmental Road between Collinsville & Mt Coolon. This is a clear, large expanse
of a highly utilised road that presents a significant safety issue.
Bowen Developmental Road North, South & West of Mt Coolon. This is a clear, large expanse
of highly utilised roads that present significant safety issues.
Bowen Developmental Road between Bowen & Collinsville. Advised as successful in the
Previous Round (however no confirmed implementation timing from Telstra other than
“within the next three years”). This is a clear, large expanse of a highly utilised road that
presents a significant safety issue and clearly meets the criteria. Included here for
completeness and escalation of urgency.
Woodwark. (Mobile Black Spot Programme candidate area identifier QLD-0956). This rural –
residential corridor to the north of Airlie Beach and Cannonvale has a community of several
hundred residents and is a bush fire hazard zone. It was an unsuccessful nomination in the
previous round. The mobile blackspot issues remain and it appears to meet the required
criteria.
Whitsunday Coast Airport. During the 2014-15FY passenger numbers reached in excess of
282,000 with further anticipated growth to deliver a forecast of between 325,000 and 390,000
passengers for the 2015-16FY. There is considerable further growth expected in the next 20
years and the 2035 high forecast of 901,404 reflects this. The airport currently provides
between four and five services daily. This is expected to increase to six by the end of 2015 and
to include international services by 2018. Whilst there is partial Telstra mobile coverage at the
airport already, it is not provided by a normal external base station, but only a limited capacity
NextG Distributed Antenna System micro-cell within the building. As a result, the coverage is
geographically limited and the service becomes fully saturated at peak terminal times each
day. It also does not provide the data capacity of a 3G or 4G service. This is a significant
frustration for passengers and also presents a risk should a safety-related event occur.
Discussions with Telstra are ongoing regarding a possible upgrade of their service.
Conway Road towards Conway and Wilsons Beach and expanded to include areas of Palm
Grove (Mobile Black Spot Programme candidate area identifier QLD-0736) and Proserpine
River. Further to the commentary in the draft ROC study, Conway Beach is not only home to
a small resident population, but the broader area including Palm Grove is the location of three
popular tourist and recreational destinations - Conway & Wilsons Beaches; Cedar Creek Falls;
and Proserpine River / Boat Ramp. As a result, this road is heavily trafficked and the multiple
blackspots have a significant community safety impact. This is especially the case at Cedar
Creek Falls which is a premier and highly promoted tourist location and the site of frequent
Digital Economy Group Pty Ltd Commercial in Confidence
15 | P a g e
ABN 48 153 285 191Whitsunday Regional Council Mobile Phone and Device
Black Spots Connectivity
Assessment
serious injuries and some fatalities. There is no mobile coverage at the falls or carpark and
contact can only be achieved by driving back towards Conway Road. The Proserpine River is
also a premier tourist & recreational fishing destination with large numbers of vessels utilising
the river and boat ramp. There are numerous reaches with no or limited mobile coverage. An
improvement of mobile coverage in this general area would contribute significantly to
improved safety, not just to the community residents, but the large volume of tourist and
recreational visitors.
Lake Proserpine / Peter Faust Dam. (Mobile Black Spot Programme candidate area identifier
QLD-0956). Identified by the Federal Government as a candidate area in the previous funding
round, Lake Proserpine is a premier recreational and fishing location with a high number of
visitors each year. There is no mobile coverage for most of the lake area and sections of the
highly utilised road leading to it.
5 Mobile Coverage Testing Results
The Mobile Phone and Device Black Spots Connectivity Assessment for the Whitsunday Regional
Council highlights the digital divide that the region is seeking to overcome. The Whitsunday Regional
Council area can be characterised as being regional and rural when referenced against the Digital
Divide and Location Comparison developed by DEG for mobile coverage assessment.
Council and regional stakeholders will need to focus on reducing the extent of mobile phone and
mobile broadband Black Spot coverage and push for higher penetration of 4G and 4G Advanced.
Capital cities and urban locations may always have another level of technology first, but regions need
to push to narrow the divide and remain attractive to retain population and attract new local
investment.
Table 2: Digital Divide and Location Comparison
Source: DEG 2015
5.1 Tested Routes
The proposed testing routes for Whitsunday Regional Council included approximately 948klms of
testing. Approximately 695klms were driven capturing Voice and 3G results and 252.97klms for 4G
LTE. The map below illustrates the actual Voice 3G and 4G LTE routes completed during testing.
Digital Economy Group Pty Ltd Commercial in Confidence
16 | P a g e
ABN 48 153 285 191Whitsunday Regional Council Mobile Phone and Device
Black Spots Connectivity
Assessment
Map 8: Routes used for Voice, 3G & Call Drop together with testing for 4G LTE
Voice, 3G & Call Drop Testing 695klms 4G LTE Testing – 253klms
Sources: Google Earth 2015, Queensland Local Governments & DEG overlay
5.2 Signal Strength
The signal strength testing is undertaken for each of the three major carriers: Telstra, Optus and
Vodafone. The smart phone devices are typically set to generate markers every 50m.
The tests are exported to a GIS platform to allow a rapid on site assessment of the full range of signal
strengths from Low Signal Range to High Signal Range and Black Spot locations. This assessment phase
also involves a comparison of the test results with the carrier advertised coverage maps. The Signal
Strength Test evaluates the strength of the signal from the local tower to the testing location.
Figure 2: Signal Strength – Rural Town (left) & – Town Centre (right)
Sources: Google Earth 2015 and DEG 2015
The Signal Strength Test involves the capture of phone signal strengths from 0 through to 31. Where
the signal is zero, a Black Spot is registered. The remaining 31 bands are broken into:
1-10 (red shades) as the Low Signal Range, poorest signals
11-20 (blue shades) as the Mid Signal Range representing the middle of the spectrum and
21-31 (green shades) representing the High Signal Range and the strongest signals possible
5.2.1 Voice and 3G Black Spots
Black Spots are locations or sections of road where no signal can be found, resulting in failure to
connect to the network. The identification of a Black Spot (Map below) begins with the signal strength
markers collected across the region.
Digital Economy Group Pty Ltd Commercial in Confidence
17 | P a g e
ABN 48 153 285 191Whitsunday Regional Council Mobile Phone and Device
Black Spots Connectivity
Assessment
The Voice & 3G signal strength testing for the Whitsunday Regional Council covered approx. 695klms
and generated approx. 13,900 markers for each of the three carriers (with signal strength taken every
50m). The resultant 41,700 markers provide a strong and detailed evidence base showing the real
extent of network coverage for mobile phones.
This data has then been filtered and mapped to highlight coverage Black Spots. The Map below shows
the roads tested and the extent of Black Spots in the area. The colour code is as follows:
Black – no signal for Telstra, Optus and Vodafone
Orange - Optus and Vodafone have no signal – Telstra is generating a signal
Yellow – No Optus signal – Telstra and Vodafone have signal
Red - No Vodafone signal – Telstra and Optus have signal
Blue – No Telstra signal – Optus and Vodafone have signal
Green – Telstra and Optus have no signal – Vodafone has signal
Purple – Telstra and Vodafone have no signal – Optus has signal
The Map (below) highlights the concentration of Black Spots on rural roads away from urban centres.
The first observation to note is that only 390klms or 56.14% of the roads tested have coverage from
all three carriers. The next key point is that out of the approx. 695klms tested, some 139.24klms of
roads or approx. 20%, experienced Black Spots for all of three carriers. The table below separates each
of the Black Spot categories by kilometres and percentage of the total.
Map 9: Voice, 3G & Call Drop Black Spots
Sources: Google Earth 2015, Queensland Local Government Areas & DEG interpretation
Digital Economy Group Pty Ltd Commercial in Confidence
18 | P a g e
ABN 48 153 285 191Whitsunday Regional Council Mobile Phone and Device
Black Spots Connectivity
Assessment
The three carrier Black Spots in the Whitsunday Regional Council area are located in only a few
concentrated locations. It is the Black Spots of Vodafone (shown in red) that occupy significant areas
of the map. The Optus Black Spots (11.28klms) and combined Vodafone/Optus Black Spots (81.46klms)
that colour the map. In terms of signal strength, the map clearly shows the need for Telstra, Optus
and Vodafone to improve their network performance here. There are a number of locations where all
three carriers need to invest to ensure there are no Black Spots here.
Table 3: Summary of Voice, 3G & Call Drop Black Spots
Voice, 3G and Call Drop Signal Strength Coverage klms percent
White - coverage from all three carriers 390.15 56.14
Black – no signal for Telstra, Optus and Vodafone 139.24 20.03
Orange - Optus and Vodafone have no signal – Telstra has signal 81.46 11.72
Yellow – No Optus signal – Telstra and Vodafone have signal 11.28 1.62
Red - No Vodafone signal – Telstra and Optus have signal 60.27 8.67
Blue – No Telstra signal – Optus and Vodafone have signal 2.98 0.43
Green – Telstra and Optus have no signal – Vodafone has signal 1.2 0.17
Purple – Telstra and Vodafone have no signal – Optus has signal 8.42 1.21
Total 695 100
5.2.2 4G LTE Black Spots
Digital Economy Group tested for 4G LTE signals in the Whitsunday Regional Council area. The
locations selected for testing included key urban locations and where return drives provided the
opportunity to capture this data without additional driving. In the Whitsunday Regional Council area,
only 16.55klms or 6.54% of the area tested had coverage for all three carriers. Over 180klms or 71.19%
were 4G LTEs three carrier blackspots. If more extensive testing had occurred, the extent of 4G LTE
coverage in and around urban areas would be better demonstrated.
The presence of all three carriers in urban and rural communities is a welcome outcome from the
testing with opportunities for additional upgrades and new sites through Council and Whitsunday ROC
communicating the current and expected growth in demand.
Digital Economy Group Pty Ltd Commercial in Confidence
19 | P a g e
ABN 48 153 285 191Whitsunday Regional Council Mobile Phone and Device
Black Spots Connectivity
Assessment
Map 10: Whitsunday Regional Council 4G LTE Black Spots
Sources: Google Earth 2015, Queensland Local Government Areas & DEG interpretation
Table 4: Summary of 4G Black Spots for the Whitsunday Regional Council Area
4G LTE Signal Strength Coverage Category klms percent
White - coverage from all three carriers 16.55 6.54
Black – no signal for Telstra, Optus and Vodafone 180.09 71.19
Orange - Optus and Vodafone have no signal – Telstra has signal 27.3 10.79
Yellow – No Optus signal – Telstra and Vodafone have signal 9.74 3.85
Red - No Vodafone signal – Telstra and Optus have signal 3.18 1.26
Blue – No Telstra signal – Optus and Vodafone have signal 0 0.00
Green – Telstra and Optus have no signal – Vodafone has signal 16.11 6.37
Purple – Telstra and Vodafone have no signal – Optus has signal 0 0.00
Total 252.97 100
Digital Economy Group Pty Ltd Commercial in Confidence
20 | P a g e
ABN 48 153 285 191Whitsunday Regional Council Mobile Phone and Device
Black Spots Connectivity
Assessment
5.3 Network Performance Test locations and assessment overview
Network Performance Tests were conducted in 45 locations across the Whitsunday Regional Council
area in November 2015. The testing methodology (outlined above) replicates a real world user
experience. Whilst the individual site tests do allow for network performance variation, the sample
Time Series Tests below demonstrate that network performance generally remains within a band. As
a result, network performance results are generally within plus or minus one of that score achieved
when repeated over time. The Map below shows the results for Telstra in the Whitsunday Regional
Council area. To see all three carrier results together refer to Appendix 4.
Map 11: Network Performance Test Locations (using Telstra results)
Sources: Google Earth 2015, Local Government Boundaries & DEG interpretation
A table compiling locality, test result, quality assessment and proposed action assessment has been
prepared and can be found below. The selection of the site test locations was predominantly
determined by localities and/or major road junctions or council boundaries.
The overall performance of each of the three carriers is highlighted in seven colour bands to inform
the assessment and proposed priorities for this local government. The colour bands are:
Digital Economy Group Pty Ltd Commercial in Confidence
21 | P a g e
ABN 48 153 285 191Whitsunday Regional Council Mobile Phone and Device
Black Spots Connectivity
Assessment
Rating Description
Locations where the user experience is approaching the advertised potential
Extremely Good (11-15)
of the network and their device with very little congestion
highlights locations with results that stand out for the location and users are
Very Good (8-10)
actively using their connection without any delay
User experience matches expectations. Intensive applications work to a high
Good (5-7)
standard most of the time
Largely consistent with expectations however network congestion or use of
Acceptable (4)
intensive apps will result in noticeable network slow downs
Users are constantly considering how to maintain a connection or are unable
Poor (2-3)
to actively use all applications due to network performance issues.
Substandard results and typically a ‘dial-up’ speeds for download or upload
Very Poor (1)
or both. User experience will result in little or no viable use of internet.
Network fail due to the download, upload or ping failures. A download may
Network Fail - (0) be achievable but upload cannot be sustained. No functional use of the
internet.
Note: The rating for all three results in each carrier is based on the download result only.
Table 5: Network Performance Test Results and Assessment-
Ref Location Telstra Optus Vodafone
UL DL PG UL DL PG UL DL PG
1 Abbott Point Terminal 2 8 10 0 0 0 0 0 0
2 Airlie Beach Central 7 10 10 6 8 10 7 4 10
3 Airlie Beach Marina 7 10 10 7 6 10 7 3 10
4 Bowen- Bowen Connection Rd/Gregory St 1 1 7 6 8 10 5 9 10
5 Bowen Developmental Rd/ Gee Dee Rd 0 0 0 0 0 0 0 0 0
6 Bowen Devel. Rd/ 10km north of Bogie River Bridge 0 0 0 0 0 0 0 0 0
7 Bowen Devel. Rd/ 7km south of Bogie River Bridge 0 0 0 0 0 0 0 0 0
8 Bowen Devel. Rd/ 15km north of Collinsville 7 9 9 4 3 8 0 0 0
9 Bowen Devel. Rd/ 5km north of Bowen River Bridge 3 1 9 0 0 0 0 0 0
10 3km Nth of Collinsville-Elphinstone Rd intersection 1 3 10 0 0 0 2 1 9
11 Bowen Developmental Rd/ Newlands Access Rd 0 0 0 5 5 9 0 0 0
12 Bowen Devel. Rd/ 22km Sth of Newlands Access Rd 0 0 0 0 0 0 0 0 0
13 Bowen Developmental Rd/ 20km north of Mt Coolon 1 1 1 0 0 0 0 0 0
14 Bowen Developmental Rd/ 15km south of Mt Coolon 2 4 1 0 0 0 0 0 0
15 Bowen Developmental Rd/ 32km south of Mt Coolon 0 0 0 0 0 0 0 0 0
16 Bruce Hwy/ Abbott Point Rd 4 4 8 3 3 10 0 0 0
17 Bruce Hwy/ Billy Creek Bridge 7 10 10 5 8 10 6 8 9
18 Bruce Hwy/ Cape Creek Rd 5 8 10 5 8 10 2 2 10
19 Bruce Hwy/ Saltwater Creek Rd 5 5 3 7 8 10 5 9 10
20 Bruce Hwy/ Slater Creek Bridge 5 6 10 7 8 8 7 9 10
21 Bruce Hwy/ Yeates Creek Bridge 5 8 10 7 8 10 7 9 10
22 Gregory-Cannon Valley Rd/ Shute Harbour Rd 7 10 10 3 8 10 0 0 0
23 Cape Gloucester- Hydeaway Bay Dr/ Dingo Beach Rd 7 10 10 7 8 4 0 0 0
24 Collinsville 3 9 10 0 0 0 0 0 0
25 Conway Beach 2 1 1 3 6 10 0 0 0
26 Conway Rd/ Leeder Rd 4 2 7 0 0 0 5 1 10
Digital Economy Group Pty Ltd Commercial in Confidence
22 | P a g e
ABN 48 153 285 191Whitsunday Regional Council Mobile Phone and Device
Black Spots Connectivity
Assessment
Ref Telstra Optus Vodafone
UL DL PG UL DL PG UL DL PG
27 Crystal Brook 5 9 10 5 8 10 7 8 10
28 Dingo Beach Rd/ Earlando Rd 7 9 10 5 6 10 0 0 0
29 Gregory-Cannon Valley Rd/ Dingo Beach Road 7 10 10 2 2 4 0 0 0
30 Gumlu 5 9 10 4 4 10 7 8 10
31 Gunyarra- Bruce Hwy/ Gunyarra Rd 3 5 10 5 4 10 5 5 9
32 Guthalungra 5 6 10 7 8 10 5 8 10
33 Hideaway Bay 7 10 10 6 9 10 0 0 0
34 Lake Proserpine 0 0 0 0 0 0 0 0 0
35 Mount Coolon 3 6 6 0 0 0 0 0 0
36 Mount Julian-Conway Rd/ Shute Harbour Rd 7 7 10 6 5 5 2 8 10
37 Newlands Coal Mine 2 7 10 7 5 10 0 0 0
38 Newlands Coal Mine South 3 5 9 7 5 10 0 0 0
39 O’Connell River-Bruce Hwy/Council Boundary 3 8 10 5 8 9 5 4 8
40 Proserpine- Bruce Hwy/Fuljames St 7 10 10 7 11 10 6 8 5
41 Proserpine- Faust St/ Juip St 5 9 10 7 8 9 6 8 5
42 Shute Harbour 7 9 10 1 1 1 4 1 10
43 Strathdickie- Gregory – Cannon Valley Rd/ Dinnie Rd 7 10 9 5 7 10 6 8 7
44 Suttor Devel. Rd/ 15km south of Mount Coolon 1 1 3 0 0 0 0 0 0
45 Suttor Devel. Rd/ 27km south of Mount Coolon 0 0 0 0 0 0 0 0 0
Table 6: Consolidated Network Performance Test Scores
Rating/Carrier Telstra Optus Vodafone
Extremely Good (11-15) 0 1 0
Very Good (8-10) 20 14 12
Good (5-7) 8 8 1
Acceptable (4) 2 2 2
Poor (2-3) 2 3 2
Very Poor (1) 5 1 3
Network Fail (0) 8 16 25
Total 45 45 45
Telstra Network Performance test results and action assessment
Telstra performed very well in the Whitsunday Regional Council area. Out of a total of 45 test
locations, Telstra had 5 that were rated ‘very poor’, 2 rated ‘poor’ and 8 that were Network Fails.
Telstra had 20 sites rated ‘Very Good’ and 8 rated ‘Good’ showing a clear lead over Optus and more
than double the number of positive sites than Vodafone. What let Telstra down in the Whitsunday
Regional Council area was its failed coverage in the section of Bowen Developmental Road north of
Collinsville, as well as a few other satellite rural locations, which had either no coverage or limited
coverage from one of the other networks.
Optus Network Performance test results and action assessment
Optus’s results trailed behind those of Telstra however were markedly ahead of Vodafone’s results.
Optus had up to 23 sites out of 45, with a score above the ‘Good’ range, including the only ‘Extremely
Good’ result in Proserpine. Optus had however, 16 Network Fail results, predominately along Bowen
Developmental Road, and in the locations of Abbott Point, Conway and Lake Proserpine.
Digital Economy Group Pty Ltd Commercial in Confidence
23 | P a g e
ABN 48 153 285 191Whitsunday Regional Council Mobile Phone and Device
Black Spots Connectivity
Assessment
Vodafone Network Performance test results and action assessment
In the Whitsunday Regional Council area, Vodafone has the most ‘Network Fail’ results of all three
carriers (25). These locations and the 5 ‘Poor’ results were along Bowen Developmental Road,
locations northwest of Bowen, Cannon Valley, Conway, Lake Proserpine, and urban areas, Airlie Beach,
West Proserpine and Shute Harbour, where improvements should be prioritised. However, Vodafone
did have 12 ‘Very Good’ sites particularly along the Bruce Highway and at Bowen.
5.4 Network Performance Time Series Tests
Network Performance tests in a time series serve to amplify the quality of the network over 10
repeated Network Performance tests. Three network characteristics are separately recorded: Ping
(latency or time to connect to the internet and return), download and upload. Within the Whitsunday
Regional Council area these tests were completed at 5 locations:
Airlie Beach
Shute Harbour
Proserpine
Collinsville
Bowen
Figure 3: Time Series Test – Airlie Beach
Download and Upload Speeds
60.00
50.00
40.00
30.00
20.00
10.00
0.00
1 2 3 4 5 6 7 8 9 10
Telstra Down Telstra Up Optus Down
Optus Up Vodafone Down Vodafone Up
Source: DEG 2015
Telstra had the best download speeds averaging 48Mbps combined with a 3Mbps upload avg. The
gap to the Optus network is substantial with Optus averaging 10Mbps downloads. Vodafone trailed
in third position with 5Mbps average download speeds.
Digital Economy Group Pty Ltd Commercial in Confidence
24 | P a g e
ABN 48 153 285 191Whitsunday Regional Council Mobile Phone and Device
Black Spots Connectivity
Assessment
Figure 4: Time Series Test – Shute Harbour
Download and Upload Speeds
18.00
16.00
14.00
12.00
10.00
8.00
6.00
4.00
2.00
0.00
1 2 3 4 5 6 7 8 9 10
Telstra Down Telstra Up Optus Down
Optus Up Vodafone Down Vodafone Up
Sources: DEG 2015
In nearby Shute Harbour the three networks performance dropped considerably. Telstra still
achieved the highest average download at 10Mbps. Their ninth test however crashed, as did the
Optus and Vodafone networks. The final and tenth test saw their respective networks back and
operating at the same speeds again. Optus was in third place here with speeds reflective of a 2.5G
network. Great scope here for network upgrades.
Figure 5: Time Series Test - Proserpine
Download and Upload Speeds
70.00
60.00
50.00
40.00
30.00
20.00
10.00
0.00
1 2 3 4 5 6 7 8 9 10
Telstra Down Telstra Up Optus Down
Optus Up Vodafone Down Vodafone Up
Sources: DEG 2015
Proserpine provided Optus the chance to show off its 4G plus network and outperformed Telstra
with 50+Mbps downloads. Telstra trailed on a 40+Mbps average leaving Vodafone way behind with
just under 10Mbps download speeds. All three had relatively poor upload speeds.
Digital Economy Group Pty Ltd Commercial in Confidence
25 | P a g e
ABN 48 153 285 191Whitsunday Regional Council Mobile Phone and Device
Black Spots Connectivity
Assessment
Figure 6: Time Series Test - Collinsville
Download and Upload Speeds
16.00
14.00
12.00
10.00
8.00
6.00
4.00
2.00
0.00
1 2 3 4 5 6 7 8 9 10
Telstra Down Telstra Up Optus Down
Optus Up Vodafone Down Vodafone Up
Sources: DEG 2015
Collinsville does not rate on the Vodafone network, so no network and no results. Their focus is capital
cities and urban centres. Telstra led here with respectable 4G speeds – 12.5Mbps downloads. Optus
averaged 10Mbps downloads and 3Mbps uploads – beating Telstra here.
Figure 7: Time Series Test - Bowen
Download and Upload Speeds
60.00
50.00
40.00
30.00
20.00
10.00
0.00
1 2 3 4 5 6 7 8 9 10
Telstra Down Telstra Up Optus Down
Optus Up Vodafone Down Vodafone Up
Sources: DEG 2015
Telstra again displayed the best upload and download speeds of the three carriers. Telstra’s download
speed averaged 45Mbps and the average upload speed was 3Mbps. Optus’s Time Series Test indicated
the second best results showing an average download speed of 14Mbps and an average upload speed
of 3Mbps. Vodafone had the worst result of the three carriers displaying an average download speed
of 5.132Mbps and an average upload speed of 2.416Mbps. Plenty of scope for Optus and Vodafone
to improve compared with the Telstra network.
Digital Economy Group Pty Ltd Commercial in Confidence
26 | P a g e
ABN 48 153 285 191Whitsunday Regional Council Mobile Phone and Device
Black Spots Connectivity
Assessment
5.5 Network Performance Time Series Test Carrier Comparison
The Network Performance Tests provide an opportunity to compare the performance of each carrier
location by location. Graphs have been prepared for download, upload and ping and can be reviewed
as Attachment 5. The performance of carrier networks is often focussed on the download speed.
Below Telstra, Optus and Vodafone download results highlight the fluctuations of each carrier.
Figure 8: Telstra Time Series Tests
Time Series Download Speeds - Telstra
60
50
40
Mbps
30
20
10
0
1 2 3 4 5 6 7 8 9 10
Airlie Beach Shute Harbour Proserpine Collinsville Bowen
Sources: DEG 2015
The comparison of the 5 Time Series Tests for Whitsunday Regional Council reveal two levels of service
standard. Airlie Beach, Proserpine and Bowen have strong connectivity at around 25-52Mbps for
downloads. Shute Harbour and Collinsville had weaker connectivity at 10-16Mbps. There was a single
test that failed at Shute Harbour.
Figure 9: Optus Time Series Tests
Time Series Download Speeds - Optus
70.00
60.00
50.00
40.00
30.00
20.00
10.00
0.00
1 2 3 4 5 6 7 8 9 10
Proserpine Shute Harbour Airlie Beach Bowen Collinsville
Source: DEG 2015
The Optus Time Series results are all within three bands, whereas Proserpine had strong 4G Plus
connectivity at 45-60Mbps. Bowen, Collinsville and Airlie Beach had average connectivity 13Mbps,
while Shute Harbour had poor connectivity with no network signal (under 0.9Mbps).
Digital Economy Group Pty Ltd Commercial in Confidence
27 | P a g e
ABN 48 153 285 191You can also read