Understanding Mass-Market Mobile TV Behaviors in the Streaming Era - MIT
←
→
Page content transcription
If your browser does not render page correctly, please read the page content below
Understanding Mass-Market Mobile TV Behaviors in
                the Streaming Era
                               Frank Bentley                                                       Danielle Lottridge
                                 Yahoo/Oath                                                             Yahoo/Oath
                               Sunnyvale, CA                                                          Sunnyvale, CA
                             fbentley@oath.com                                                     dlottridge@oath.com

ABSTRACT                                                                          1   INTRODUCTION
Despite claims of Mobile TV’s mainstream arrival in 2010, it                      Mobile television services, providing access to long-form,
took until 2017 for watching professionally-produced tele-                        professionally produced video programs on mobile devices,
vision content on mobile phones to truly become a mass-                           have been researched and deployed since 2002. Through
market phenomenon in America, with half of all TV content                         successive waves of technology (DMB [22], DVB-H [21], etc.),
expected to be watched on mobile phones by 2020. But what                         many services were launched, but few saw mass adoption
professionally produced content are people watching on                            in America. While these early video systems focused on
their phones and when are they watching it? Are there any                         live broadcasts, the growth of 4G networks and the mass
clusters of behavior that emerge in the broader population                        popularity of online television streaming sites (e.g. Netflix,
when it comes to watching TV on the phone? We set out                             Hulu, and Amazon Prime Video) have led to a new mobile
to answer these questions through two surveys deployed to                         television ecosystem.
representative samples of online Americans. We discuss our                           In addition, many cable operators have starting providing
findings on the mass-market arrival of Mobile TV viewing                          mobile access to live content and recorded shows on mobile
and differences from how the HCI community has previously                         devices through the data network. New Over the Top (OTT)
envisioned mobile video. We conclude with implications for                        television solutions have also launched, such as YouTube TV,
the design of future Mobile TV systems.                                           Sling, and DirectTV. These services provide access to cable
                                                                                  television content on phones and laptops without purchasing
CCS CONCEPTS                                                                      wired cable service to the home.
• Information systems → Multimedia streaming; Video                                  These new services have massively changed the ways that
search; • Human-centered computing → Empirical stud-                              Americans consume television content. The trends are such
ies in HCI ;                                                                      that six in ten young adults were getting the majority of
                                                                                  their television content through streaming services in 2017
KEYWORDS                                                                          [15] and by 2020, half of all TV content in America will be
Television; Streaming; Mobile; Smartphone; Survey                                 consumed on mobile devices [9]. This rise of cord-cutting
                                                                                  and smartphone penetration (80% of Americans own smart-
ACM Reference Format:                                                             phones [10]) is radically transforming a cable industry that
Frank Bentley and Danielle Lottridge. 2019. Understanding Mass-                   has been operating under many of the same basic practices
Market Mobile TV Behaviors in the Streaming Era. In CHI Con-                      since the 1980s.
ference on Human Factors in Computing Systems Proceedings (CHI                       Despite the massive adoption of mobile television stream-
2019), May 4–9, 2019, Glasgow, Scotland Uk. ACM, New York, NY,
                                                                                  ing through OTT video sources, little is understood about
USA, 11 pages. https://doi.org/10.1145/3290605.3300491
                                                                                  how Americans are using these services. Which combina-
                                                                                  tions of services are being used? When are people watching
Permission to make digital or hard copies of all or part of this work for         television content on their phones? What content is being
personal or classroom use is granted without fee provided that copies are not
                                                                                  viewed? Are they watching along or together? We set out
made or distributed for profit or commercial advantage and that copies bear
this notice and the full citation on the first page. Copyrights for components    on this research with several broad questions, to better un-
of this work owned by others than ACM must be honored. Abstracting with           derstand the use of mobile television viewing in America.
credit is permitted. To copy otherwise, or republish, to post on servers or to    Specifically, we wanted to know:
redistribute to lists, requires prior specific permission and/or a fee. Request
                                                                                     (1) What types of professionally-produced content are
permissions from permissions@acm.org.
CHI 2019, May 4–9, 2019, Glasgow, Scotland Uk
                                                                                         users watching on their mobile phones?
© 2019 Association for Computing Machinery.                                          (2) How and where are people watching Mobile TV? (us-
ACM ISBN 978-1-4503-5970-2/19/05. . . $15.00                                             ing headphones, locations of use, the social context,
https://doi.org/10.1145/3290605.3300491                                                  etc.)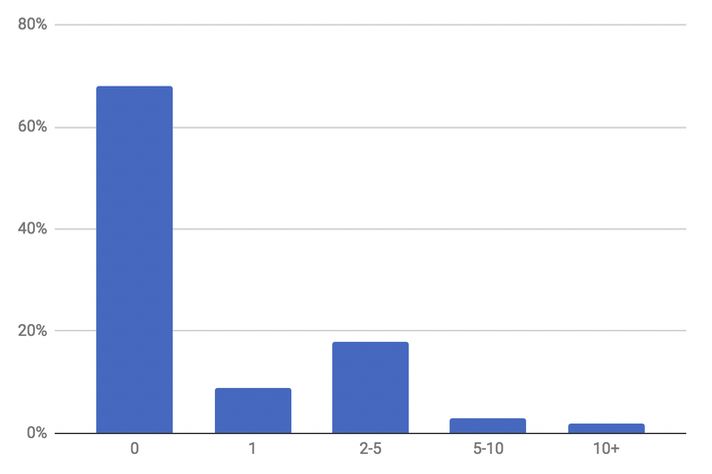
(3) Are there clusters of behaviors across large numbers of   one of the first to discuss co-viewing on the mobile screen,
        users that can help us target the design of new Mobile    although they mention only a few anecdotes. We were in-
        TV services?                                              terested in quantifying behaviors like this in the general
                                                                  American population given the new spread of access to TV
   We will begin by setting this work in the context of ex-
                                                                  content on mobile devices.
isting research on mobile television services and use. We
                                                                     Schuurman et al. [18] were interested in the content that
will then describe our method and the backgrounds of our
                                                                  should be displayed on Mobile TV and argued that “Mobile
participants before exploring answers to each of our research
                                                                  TV should be considered as a new mass medium with its
questions in depth. We will conclude with a discussion of
                                                                  own content and usage modes.” They explored the types of
how current mobile television viewing practices are quite
                                                                  content that were best suited to this medium, and argued
different from what was imagined only eight years ago, and
                                                                  that new types of content should be created solely for the
what this means for the design of future mobile television
                                                                  mobile viewing experience. While they point to the consid-
services.
                                                                  erable issues in business models, they highlight that making
                                                                  content for a shorter attention span that can be viewed in
2    BACKGROUND                                                   noisy environments is a unique opportunity for Mobile TV
The concept of Mobile TV has existed in the research and con-     systems. They also discussed the importance of having the
sumer electronics field for some time. Early work focused on      “triumvirate” of content — news, entertainment, and sports
standards for broadcasting television on separate frequencies     — but highlighted that news was the most desired, making
from the mobile data networks. Technologies such as DVB-H         Mobile TV more of a “visual radio” than an entertainment
gained popularity in the 2000’s and were even included in         platform. By contrast, we will show how, in the end, the
a variety of handsets, mostly outside the US. These radio         content that was “king” was the already very-popular cable
broadcast technologies were still seen as the probable future     and streaming TV entertainment shows.
of mobile television as late as 2009, when an influential book       Several researchers have studied Netflix behaviors, focus-
on “Mobile Television” was published by many members of           ing on mobile viewing. Rigby et al. [16] found that viewers
the CHI community. [12] Kitson, in a chapter titled “Mobile       reported lower immersion with content when viewed on
TV’s Time to Shine has Arrived,” [8] wrote that “over-the-        smaller mobile devices. Rigby et al. [17] also explored cross-
air digital television to mobile devices” was the future of       device viewing, finding that the nine households they studied
television and Shuurman et al. [18] declared that delivery of     preferred mobile viewing for shorter clips, to watch content
television over a mobile network has “ceased to be viable”        that others were not interested in, and to entertain kids.
given low bitrates and network congestion, meaning that           Groshek et al. [6] explored binge watching on Netflix finding
live broadcasts on dedicated radio frequencies would be the       “differential and largely non-negative effects across emotional
only way to get television content to mobile handsets.            and health domains” of watching multiple episodes at once.
   In an early field study that explored how people used             Beyond studying “Mobile TV” (professionally produced
mobile broadcast television (DVB-H) in Europe, Leivens et al.     television content on smartphones) other researchers have
[11] cataloged how 70 participants used a system that had 12      more broadly studied mobile video practices on smartphones
broadcast channels in Ghent. They found that participants         [3, 19, 23]. Brown et al. [3] found that 0.5% of all mobile phone
preferred short, 10 to 15-minute sessions of use, that usage      use was spent in YouTube in a study from 2013. Interestingly,
was very rare and sporadic, that usage fit into spare moments     they found that reading was far more prevalent than any
of the day (eating, driving, waiting), and that use was almost    video or audio experiences. Sun et al. [19] explored chal-
always alone. They even went on to state that Mobile TV           lenges when trying to watch YouTube together with others
“cannot generate” a relaxing experience like a television set     on a mobile phone, and discussed scenarios where viewers
because the screen is so small. We will return to most of these   watched together with others on one device or casted to a
findings below, as we explore how Mobile TV is currently          larger display. Bentley and Murray [1] explored rewatching
being used in a world of near infinite program choice and         a variety of different types content and found that mobile
ubiquitous high-resolution smart devices. There are many          devices were rarely used to re-watch TV content, which was
differences from these early deployments.                         much more prevalent on desktops and television sets.
   A similar study was conducted in Japan by Miyauchi et             Finally, McNally and Harrington [13] explored how mil-
al. [14] for a multi-channel broadcast system that was de-        lennials were using mobile video in their lives, again using
ployed in Tokyo. Participants most preferred watching vari-       this broader definition of video that went beyond television
ety shows during their evening train commutes. They also          content. While professional TV content such as Netflix did
observed participants using Mobile TV at home in another          come up, most of the discussion was on short user generated
room from the main television or while cooking. They were
videos on Instagram, YouTube, or Snapchat, leaving many exploratory data analysis [24]. The default algorithm for
questions open as to their TV content use. initial k-means centers (initial scanning of data) was used. We
The Mobile TV landscape in America has vastly changed explored subgroup composition for n+/-1 clusters to confirm
since the earlier Mobile TV research was conducted around stability of subgroups.
2010. Streaming services such as Netflix and Hulu, mobile
apps for premium cable channels such as HBONow and 4 FINDINGS
ShowtimeNow, and streaming apps from cable providers In the following sections we will explore the data from the
providing access to live and recorded cable TV shows have two surveys in order to answer our broader research ques-
provided access to vast libraries of on-demand content. This tions. We will begin by exploring what types of television
is very different from the dozen or so channels of digital content Americans are watching on their mobile phones.
broadcast content studied in much of the work above. Tele- Then we will explore how they are watching it, followed by
vision on mobile devices is no longer a second-class citizen the context of watching. Finally, we will explore behavioral
to cable TV content-wise, but has as much (or more) content clusters among mobile television watchers, highlighting the
available to stream on-demand. It is in this new Mobile TV behaviors that specific groups of users share. The following
environment that we wanted to explore current behaviors section will then discuss the importance of these findings,
in the American population. how current mobile television deployments are quite differ-
3 METHOD ent from what the HCI research community once predicted,
and implications for the design of new mobile television
To answer our research questions, we conducted two sur- services.
veys that were deployed to representative samples of online
Americans. Both surveys used SurveyMonkey to reach their
What are people watching?
target audiences, a service that has shown to be accurate
to within several percentage points of the American pop- First, we will explore the types of television content that
ulation [2] when studying technology use and is used by people are watching on their mobile phones, including the
polling companies such as FiveThirtyEight to assess Amer- services that they are using to access this content. Table 1
ican opinions. Since these panels are largely not validated highlights the broad array of sources that participants were
outside of the United States, we restricted our sampling to using to watch professionally-produced video content on
US participants. Both surveys were fielded in the fall/winter their phones. Many traditional cable TV sources appear: 40%
of 2017. All methods used were approved by our institution’s of participants had used an app from a cable provider, 31%
standard review processes before the study was conducted. had used the HBO app, 26% had used Hulu (network TV), and
Survey 1 (S1) was completed by 306 participants, aged 18- 23% had used Showtime. However, the most popular source
60+, 53% of whom were female. Survey 2 (S2) was completed of mobile television was Netflix, with 56% of participants
by 509 participants, also aged 18 to 60+, 54% of whom were fe- watching a show on their phones, and 37% doing this at least
male. Participants in both surveys had education and income once a week.
distributions that matched the broader American population Now that we know the sources of content that were being
(44% made less than $50k in household income, with 14% used, we wanted to dig deeper into the specific types of
making over $125k) and were distributed throughout the shows that were being watched. Early Mobile TV systems
United States in a similar pattern to the overall population focused on live events such as sports [8]. But with these new
(New England 6%, Mid-Atlantic 11%, E North Central 14%, services, had this changed?
W North Central 8%, S Atlantic 18%, E South Central 7%, Table 2 highlights the genres of content that participants
W South Central 14%, Mountain 6%, Pacific 17%). We were reported liking to watch on their smartphones. What is most
quite happy with the samples we received and as discussed interesting to us is that the types of live TV that were most
in the Findings below, the participants scored within a few popular in early Mobile TV deployments are not as popular
percentage points of larger national surveys on questions in real use today. While 65% of people reported liking to
that we asked in common to test for representativeness. watch Comedy shows on their phones, only 34% reported
In addition to analyzing the results for each question and liking to watch Sports. Documentary (50% liked) and Tutorial
question grouping, we used cluster analysis to find patterns (46% liked) were also surprisingly high. There is little existing
in behaviors, preferences, and demographics from the second research on these types of television shows on mobile devices
survey (which was also why we recruited more participants and perhaps it is an opportunity for new services to approach
for this survey). We performed a K-means clustering to find these types of content in more depth.
a solution where no group had less than 75 participants. K- We were also curious to what extent mobile phones had
means clustering was chosen as a standard technique for eclipsed other devices for viewing television content. WereHave Not Less Than At Least Once At Least Once Most Days
Watched Monthly a Month a Week
Netflix 44% 11% 8% 15% 22%
Cable Provider App 60% 11% 11% 9% 10%
Facebook Watch 62% 11% 5% 10% 12%
HBO 69% 11% 8% 9% 3%
Hulu 74% 10% 6% 5% 7%
Snapchat Discover 77% 5% 6% 5% 7%
Showtime 77% 10% 6% 4% 2%
Table 1: The services that participants were using to watch professionally produced content on their mobile
phones along with the relative frequencies of viewing this content. (S2)
Strongly Dislike Neutral Like Strongly Like
Dislike
Comedy 7% 3% 25% 34% 31%
Documentary 11% 6% 32% 32% 18%
Tutorial 14% 9% 30% 29% 17%
Sports 27% 14% 25% 18% 16%
News 12% 8% 30% 34% 15%
Drama 12% 10% 36% 28% 14%
Kids 26% 16% 36% 14% 7%
Reality TV 33% 17% 30% 13% 7%
Celebrity 35% 19% 25% 15% 6%
Table 2: Genres of content that participants reported liking to watch on their phones. (S2)
2 min 5 min 10 min 30 min 60 min 90+ min
In the morning 43% 23% 18% 12% 3% 2%
Commuting 41% 18% 19% 17% 3% 2%
Free time during 26% 20% 22% 20% 9% 4%
the day
In the evening 21% 14% 18% 20% 19% 8%
When traveling 24% 13% 13% 16% 14% 21%
Table 3: Ideal lengths for professionally produced video content on the phone in a variety of situations. (S2)
Americans watching shows exclusively on their mobile de- of people the other devices still account for a majority of
vices now? Or were smartphones augmenting other devices? television viewing time. Any service that offers television
Figure 1 shows the number of shows that participants had content would be at a significant disadvantage in the current
watched only on their phones in the past month. By far the market if it only offered content on the mobile platform, as
most common response, at 68% of participants, was that all users expect to be able to watch a television series on any
of the shows that they watched on their mobile phones they device as they move throughout their day.
also watched episodes of on another device, such as a com- Mobile television opens up the possibility to watch content
puter or television. However, that also means that 32% of in many different situations. We were interested in the differ-
participants had watched at least one show solely on their ent places and activities where people watched TV content
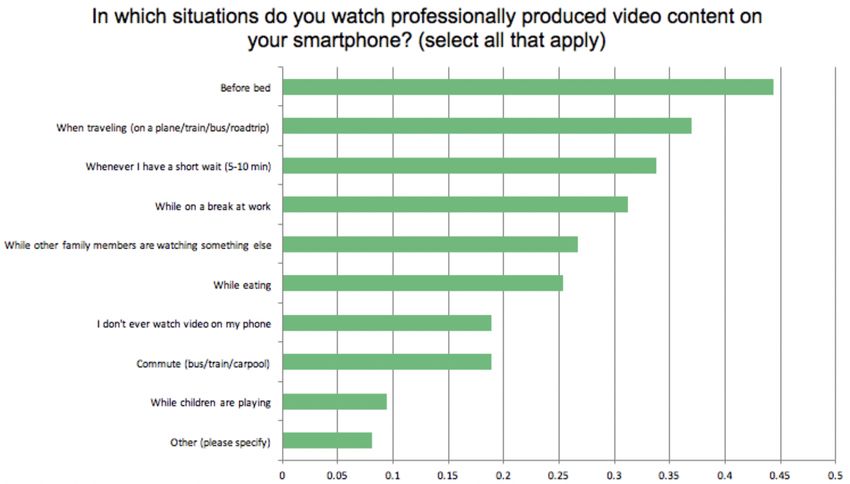
mobile devices. on their phones. Figure 2 shows these situations. Watching
At least currently, mobile phones are still a part of a larger television before bed was the most common response, with
ecosystem of television viewing, and for the vast majority 44% of participants watching this way. Traveling (37%), whilewith some of the micro-show formats that services such as
Figure 1: “In the past month, how many different TV series Snapchat and Facebook have been exploring. Shows such
have you only watched on your phone (i.e. you did not watch as The Voice for Snapchat were 5 minutes long1 . During
any episodes on a TV or computer)?” (S1) the evening and while traveling participants wanted longer
form content, with 47% of participants wanting 30+ minute
content in the evening and 51% wanting this type of content
while traveling. That compares to only 17% who wanted this
type of content in the morning or 22% who wanted it while
commuting.
Overall, our participants were watching a variety of dif-
ferent television genres (favoring Comedy, Documentary,
and Tutorials) from a variety of providers (OTT, cable pack-
ages, cable networks). They watched content on their phone
before bed, while traveling, and while having short breaks
during the day, preferring shorter content during daytime
hours and longer forms at night. Mobile was just one device
that they used to watch television, with the vast majority
of series that they watched on the phone also watched on
another device.
Figure 2: The situations where people watched mobile tele- Most All
vision. (S1) Some- of of
Never Rarely
times the the
Time Time
Use
Head- 33% 15% 22% 18% 12%
phones
Use
Closed 59% 14% 15% 6% 6%
Captioning
Table 4: The use of headphones and closed captioning.
(S1)
having a short wait (34%) and when having a break at work How are people watching?
(31%) were other popular times to watch video content. We We will now turn to an exploration of how people are watch-
found it interesting that 27% reported watching mobile tele- ing television content on their mobile phones. We were in-
vision while other family members were watching different terested in exploring the use of features such as captioning
content on the television, quantifying an early qualitative and headphones as well as in exploring how often people
finding from Holz et al [7]. 25% reported watching TV on watched with others and if they turned their phone horizon-
their phones while eating, another situation that has not tal to watch content, given that most television content is
been explored in great detail. produced for landscape viewing.
As mobile television services continue to expand, and OTT Since mobile devices are often used in public or other lo-
solutions free themselves from the strict 30 or 60-minute long cations where sound is often not permitted, we were curious
show formats of linear broadcast television, the opportunities about the use of headphones and closed captioning while
for different show lengths emerged. We asked participants watching TV shows. Surprising to us was the high use of
what their ideal show length would be for watching mobile closed captioning, as shown in Table 4. Overall, 41% of par-
television in in a variety of situations. Table 3 shows the re- ticipants had used closed captions while watching mobile
sults. Interestingly, participants preferred very short formats
1 https://www.snapchat.com/discover/The-Voice/0306340785
for professionally produced mobile video. This aligns wellLess Greater and News clips on Facebook/Twitter (31%) and Snapchat
About
than than Stories (21%). Only 6% had watched live sports vertically and
Half Almost
Never Half Half 10% had watched TV episodes this way in the past month.
the Always
the the Older adults were the most likely keep their phone vertical
Time
Time Time (50% for those 60+) (perhaps due to using orientation locks)
By for the last video watched. Women were also slightly less
18% 4% 10% 15% 52%
Yourself likely to turn their device, with 23% not turning the device,
With a compared with only 16% of men.
51% 31% 12% 3% 3%
Partner Overall, about half of participants were watching mobile
With television content with others at least some of the time and
69% 20% 6% 4% 2%
Kids many utilized closed captioning or headphones at least some
With of the time. Most of the time, devices were rotated to watch
61% 26% 7% 3% 2%
Friends television content full screen in a horizontal orientation.
Table 5: The Social context of mobile television view-
Cluster Analysis
ing. (S2)
Finally, we will explore how the behaviors discussed above
cluster together. Through a K-means cluster analysis, we
identified five well-sized, distinct clusters of users based on
television in the past. Also, 66% had reported using head- their behaviors. The clusters converged in 19 iterations. All
phones, with 30% reporting using them most or all of the variables in Table 6 were significant at p < 0.04 and each
time that they watched television on their phones. cluster had more than 15% of the 509 total participants. We
We were also interested in the social context of mobile will discuss the demographics of each cluster as well as their
television watching. While the home television has been most salient behaviors that differ from the other clusters.
typified as the device that brought the family together in
Cluster 1 (15% of participants): No free time, low video users.
the evenings, the mobile phone is seen in the popular press
This cluster was the highest educated, oldest, and generally
as more of an isolating device [20]. Were people watching
upper middle class. On average, they reported not watching
together on these small screens? Table 5 shows the details.
videos during the little free time they had. Most notably, they
While over half of participants (52%) almost always watch
reported having the lowest interest in most types of content,
alone, 18% watch half the time or more often with their part-
had the least frequent video watching behaviors on their
ner, 12% watched this often with kids, and 12% also watched
mobile devices and mostly did not subscribe to any video
this often with friends. This is not an insignificant percent-
services. They strongly favored short-form video and, for
age of the time, and more often than we had expected before
the little content that they watched, they watched it alone.
conducting this research. Phones are not always an isolating
force, where people watch videos alone, but a significant Cluster 2 (23% of participants): Long form, watch alone user.
percent of the time about half of users are watching with This cluster strongly preferred watching longer form content
others on the single phone screen. on their mobile devices, with longest form preferences (60
Interestingly, when further exploring the 18% who “never” minutes) during travel. They liked watching Comedy, Drama,
watched alone, only 9% of this group was in the 18-24 range, Documentary, and Tutorial shows and were less likely to be
with increasing percentages in each age group up to the 60+ into Sports. They tended to be mid income (~$50k) and were
group which comprised 42% of those who never watched more likely to be subscribed to Netflix, Hulu, HBO, and cable.
alone. While younger people are often seen as being more They love traditional longer form shows and use the mobile
social with their phones, it is the older adults who are more phone to augment existing viewing on television sets.
likely to watch television content together with others on
Cluster 3 (25% of participants): Shorter form, watch alone.
the small screen of the phone.
Cluster 3 is similar to Cluster 2 in demographics and tend-
Finally, we wanted to explore how participants were hold-
ing to watch videos alone, however this segment watches
ing their devices. As watching video full screen involves
subscriptions less often and the majority has never watched
turning the device, we were curious how often this happened.
a series solely on a mobile phone despite having a stronger
When asked to think beyond TV to any type of video watched
preference for shorter programs (2-5 minutes). Also in con-
on the phone, participants stated that YouTube videos were
trast to Cluster 2, who watched videos before bed and during
most commonly watched vertically (52% of participants who
travel, those in Cluster 3 did not watch videos as often in
watched this type of content watched vertically in the past
those situations.
month), followed by Social posts on Facebook/Twitter (40%),Cluster 1: No Cluster 2: Long Cluster 3: Cluster 4: Cluster 5: High
free time, low form, watch Shorter form, Mobile video income,
video alone watch alone lovers. multi-length
viewers
Education Bachelor’s Degree Assoc/Trade Assoc/Trade Assoc/Trade Assoc/Trade
Age 45-60 30-44 30-44 30-44 30-44
Income 100k-125k 50k-75k 50k-75k 25k-50k >200k
Free time watching video none > half about half most of free time > half
Use of the following services in the past three months:
Netflix never monthly < monthly weekly monthly
HBO never < monthly never monthly < monthly
Showtime never never never < monthly never
Hulu never < monthly never < monthly < monthly
Snapchat never < monthly never < monthly < monthly
FB Watch never < monthly < monthly monthly < monthly
Cable App never < monthly < monthly monthly < monthly
TV series only on phone none 1 series none 1 series 1 series
Use closed captioning never rarely rarely rarely rarely
Situations of watching professionally produced video content on the phone: (0=Don’t do this, 1=Do this)
Before bed 0 1 0 1 1
While Traveling 0 1 0 1 0
Watching mobile video:
By yourself < half > half > half > half > half
With a partner never < half < half < half < half
With kids never never never < half never
With friends never never never < half < half
Genre Preferences (1=Strongly dislike, 2=Dislike, 3=Neutral, 4=Like, 5=Strongly like)
Comedy 2 4 4 4 4
Drama 2 4 3 4 3
Kids Programming 2 3 3 3 2
Reality TV 2 3 2 3 2
News 2 3 3 4 3
Celebrity TV 2 2 2 3 2
Documentaries 2 4 4 4 3
Tutorials 2 4 3 3 3
Sports 2 2 3 4 3
Ideal content length (1=2min, 2=5min, 3=10min, 4=30min, 5=60min, 6=90min+)
Morning 1 3 1 3 2
Commuting 1 3 1 3 2
FreeTime 1 4 2 4 3
Evening 1 4 2 4 4
Travel 1 5 2 4 4
Services Used: (1= Do not use, 2=Share an account, 3=Pay for my own account)
Netflix 2 2 2 2 2
Hulu 1 2 1 2 1
HBO 1 2 1 2 1
Showtime 1 1 1 2 1
Starz 1 1 1 2 1
Cable 2 2 2 2 2
PPV 1 2 1 2 1
When watching video on your phone, which of the following genres do you prefer?
Daily Comedy 1 2 2 4 3
Sitcoms 1 2 2 4 2
Dramas 1 2 2 3 2
Reality TV 1 2 2 3 2
News 1 2 2 3 2
Sports 1 1 2 4 2
Table 6: Cluster Centers, Most Relevant Variables included in Cluster analysis. (S2)Cluster 4 (19% of participants): Mobile video lovers. This was community did not anticipate the rapid rollout of 4G/LTE
the lowest income group, and tended to be younger. They networks that would enable streaming services. This in turn
watch the most video on their phones from a wide variety limited our ability to see the rise of streaming as the primary
of paid subscriptions (HBO, Showtime, Hulu, Cable Apps) as mode of television content delivery and led to our focus on
well as Snapchat and Facebook Watch. They reported having broadcast and other multi-cast technologies.
the most free time and watched video content in their down- Current content preferences can also be driven substan-
time and sometimes with friends. They strongly preferred tially by marketing. Netflix alone is now spending $1B per
longer form shows (10-30 minutes) over shorter form clips year just on advertising their content and original shows
or programs. Overall, these are mobile video fanatics. [5]. Big cable networks such as HBO also spend significant
amounts on advertising, taking over large percentages of bill-
Cluster 5 (17% of participants): High income, multi-length view- boards and subway stations in major cities for the premier
ers. This group was the highest income group. They had the of each of their big-budget shows. As people turn to mobile
widest range of preferences in terms of variety of different devices for more and more of their media consumption, it
content lengths to fit different parts of their day, preferring makes sense that they also watch more of the blockbuster
shorter content in the morning and long-form content in entertainment content on these devices.
the evenings and when traveling. Similar to Cluster 4, they The true mass-market nature of mobile television con-
occasionally watch with friends. sumption was also quite interesting to us. In our cluster
Overall, each of these clusters shows a different type of analysis, only 15% of our representative online American
mobile television viewer, and different types of services can sample was in the low/no Mobile TV use cluster. The vast
be targeted to each cluster. While some want shorter form majority of Americans with smartphones are using them at
content in the mornings, others heavily watch longer form least some time in a month to watch a television program.
programs in bed with their partner. Some “snack” on episodes And many are using them daily to watch television content
of shows that they also watch on other devices, while others in the morning, on commutes, while cooking/eating, in bed,
consume large amounts of video content multiple times per or while others are watching something else on the main
week. The demographics of each cluster also indicate which television set.
are most lucrative for higher-cost packages of premium con- Cluster analysis enabled us to observe different patterns
tent, although it is notable that lower-income clusters (e.g. indicative of behavior related to “snacking” on short videos,
Cluster 4) subscribe to many different video services. watching one or a few episodes or “binge watching” for
longer sessions. Cluster 1 “No free time, low video users”
5 DISCUSSION have no free time for video “snacking” throughout the day,
Mobile television viewing has now reached mass-market whereas the others did, especially Cluster 4. One might ex-
adoption in the United States. With this growth in use, Mo- pect a cluster that prefers snacking over other types of watch-
bile TV turned out to be quite different from what many in ing, however this pattern did not exist; Participants in Clus-
our community were proposing in 2010 in the Mobile TV ter 4 were overall enthusiasts with the strongest desire for
book [12]. While earlier research focused on live broadcast- short-form as well as long-form content.
ing of linear TV channels, most viewing in 2017 occurs via Most interesting to us is the rapid pace at which video prac-
streaming sites such as Netflix, HBONow, or Hulu. tices have changed in America. The behaviors that we have
And while that earlier research often pointed to news or observed are so new that even papers published a few years
other “visual radio” content being most appreciated [14], ago seem to describe another world. While most video watch-
our participants reported strongly preferring traditional en- ing just a few years ago was on services such as YouTube and
tertainment TV formats such as 30-minute comedies or 60- television content was mostly relegated to larger-screened
minute drama shows, watched on demand and often while televisions and laptops, our survey participants were ex-
in bed or while traveling. tremely engaged in watching mobile television content. Mo-
It is interesting to think about why the HCI community bile rights are now available for sites like Netflix to stream
was so wrong about the future paths of technology and con- large TV content libraries and new services from cable net-
tent consumption, with most discussion in 2010 focusing works, such as dedicated mobile apps to purchase and stream
on DVB-H [8, 11, 12] and related broadcast technologies as content from industry powerhouses such as HBO, Showtime,
the future of Mobile TV. Partially, this is a common error in and CBS have entered the market. Yet the phone is still a
underestimating the impact and rapid deployment of new complementary device to the television set, with the majority
infrastructure. Similar to the case study of the Iridium satel- of TV series where an episode or more was watched on the
lite phone service, [4] where executives failed to anticipate phone also watched on the television set for other episodes
how quickly cellular infrastructure would be deployed, our in the series.6 IMPLICATIONS FOR DESIGN to engage users throughout the day. The temporal prefer-
Overall, this study has enabled us to look at mainstream ences that we observed can also be leveraged here. Short
mobile television viewing practices and content preferences. (2-10 minute) teasers, behind the scenes “extras” content, or
This opens up several implications for the design of new mini-episodes could be created for the morning with longer
mobile television services and content. episodes meant to be consumed in the evenings.
Premium Content Remains King (As Does Content
Design for Complementary Use
Advertising)
While Mobile TV viewing was quite high across our sample,
The types of content that our participants engaged with
most shows continued to be watched on other devices, such
were the big blockbuster cable (and premium streaming site)
as a television, with the occasional episode being watched
content. What users are advertised and what everyone is
on a mobile phone while traveling or when in bed for the
talking about remain to be what people are watching on their
night. Services that only provide content on mobile devices
handheld devices. The large video services have budgets in
are missing out from the user expectation that content is
the billions of dollars for content creation and marketing, and
available everywhere. Providing content on all devices is
have now taken over from lower budget sources of content
critical for future professional video services.
for mobile viewing. While the big networks were late to the
This often runs into the many issues of content rights.
game (HBONow only launched in 2015), they now dominate
But this is a concept that most users do not fully understand.
viewing on this platform. New mobile television services
From other interviews we have conducted, we have seen that
need to recognize this reality and compete with the large
users are often confused when services offer content only on
content players.
one type of device. Viewing on a TV through a cable provider,
or Chromecasting from a laptop or phone to the TV seem to 7 LIMITATIONS
be the same use case to users, but are often different types
While our study enabled us to get feedback from a broad, rep-
of rights that must be acquired, even though they result in
resentative sample of Americans, there are some limitations
the same experience — viewing a show on the television set.
that we would like to point out. The survey data is based on
self-reported use, and is subject to the usual biases that can
Design Content for Mobile
appear when people are asked to remember their behaviors.
The TV content that our participants watched was designed For most questions, we sought to limit these biases by asking
for a larger screen. When it is viewed on a small device, it participants about activities that they have performed in the
tends to be viewed horizontally and details that are visible on last month and also grounding some questions in specific last
a television set might be lost. As mobile television use grows instances of use. We specifically did not ask about frequency
(to over half of all TV viewing by 2020 [9]), content producers of viewing specific types of shows, as people are generally
should consider these smaller format screens when crafting not able to accurately answer these types of questions about
their scenes, special effects, and any on-screen text that will everyday behaviors.
be much harder to read on a small device. Other content that In addition, our surveys were only conducted in the United
is less visually dynamic, such as stand-up comedy, can be States. Behaviors in other countries may be different, and
cropped vertically, which would increase the size of the actor are topics for future work. Given the large media ecosystem
and take advantage of typical way that smartphones are held. in America, and these ease of conducting surveys with rep-
Popular shows such as The Voice are already exploring these resentative samples of users, we feel that it is a good place
types of formats on Snapchat. to start.
Overall, we see our key contribution in the broad sample
Mix Long-form and Short-form Content of our research participants and understanding new pat-
Our participants had preferences for all lengths of content. terns of Mobile TV behavior at scale. The tradeoffs above
Short form content was most frequently preferred on the were necessary to collect data with such a broad sample
mobile device for morning activities. Quick mini-episodes, of people across a variety of services that do not provide
similar to those being produced for Snapchat, can make for researchers with access to usage data. Additional research
quick entertainment in the morning. However, participants would be necessary to qualitatively understand why people
also strongly preferred traditional long-form TV content for are choosing the content that they are, or the details around
the evening and while traveling. logistics for co-watching. We hope that this research can
Thirty-minute sitcoms and sixty-minute dramas remain open up a variety of interesting questions for future smaller-
incredibly popular to watch on mobile devices. New mobile scale ethnographic-style research to further understand user
streaming services should balance these two types of content motivations.8 CONCLUSION [7] Christian Holz, Frank Bentley, Karen Church, and Mitesh Patel. 2015.
I’m just on my phone and they’re watching TV: Quantifying mobile
Mobile TV has greatly evolved from the earlier research in device use while watching television. In Proceedings of the ACM Inter-
the CHI community around digital video broadcast technolo- national Conference on Interactive Experiences for TV and Online Video.
gies. The way that television content is viewed on mobile ACM, 93–102.
devices today in America is not in the form of a linear broad- [8] Fred Kitson. 2010. Mobile TV’s Time to Shine Has Arrived. In Mobile
cast, but rather on-demand via a variety of streaming apps TV: Customizing Content and Experience. Springer, 5–9.
[9] Ericsson Consumer Lab. 2017. TV and Media 2017: A consumer-
from mass-market brands such as Netflix, HBO, and major driven future of media. (2017). https://www.ericsson.com/en/
cable networks, with preferences for certain content types networked-society/trends-and-insights/consumerlab/consumer-
especially suited to the handheld format. insights/reports/tv-and-media-2017
The evolution in how people receive television content [10] Adam Lella. 2017. U.S. Smartphone Penetration Surpassed 80 Per-
on their phones has led to a wide variety of changing be- cent in 2016. (2017). https://www.comscore.com/Insights/Blog/US-
Smartphone-Penetration-Surpassed-80-Percent-in-2016
haviors, including strong preferences for traditional pro- [11] Bram Lievens, Eva Vanhengel, Jo Pierson, and An Jacobs. 2010. Does
gramming, however documentaries and tutorials were also Mobile Television Enhance a New Television Experience? In Mobile
surprisingly popular. Mobile TV did not replace viewing on TV: Customizing Content and Experience. Springer, 81–96.
a traditional television set or computer – it augmented this [12] Aaron Marcus, Anxo Cereijo Roibás, and Riccardo Sala. 2009. Mobile
behavior through watching some episodes on the mobile TV: Customizing Content and Experience. Springer.
[13] Jennifer McNally and Beth Harrington. 2017. How Millennials and
device when it was most convenient (e.g. in bed, while com- Teens Consume Mobile Video. In Proceedings of the 2017 ACM Interna-
muting or traveling, etc.). Surprisingly, given the personal tional Conference on Interactive Experiences for TV and Online Video.
nature of the mobile phone, half of participants had watched ACM, 31–39.
a show together with other people simultaneously on the [14] Koji Miyauchi, Taro Sugahara, and Hiromi Oda. 2010. Different at-
same mobile device. titudes concerning the usage of live mobile tv and mobile video. In
Mobile TV: Customizing Content and Experience. Springer, 165–193.
We hope that this study opens up even more questions [15] Lee Rainie. 2017. About 6 in 10 young adults in U.S.
for future qualitative exploration. We believe it is incredibly primarily use online streaming to watch TV. (2017).
important to conduct studies like this one in order to size http://www.pewresearch.org/fact-tank/2017/09/13/about-6-in-
certain behaviors at a country level and to see where cer- 10-young-adults-in-u-s-primarily-use-online-streaming-to-watch-
tain behaviors might be more niche or widespread. Future tv/?utmc ontent=buffer45fc5&utmm edium=social&utms ource=
twitter.com&utmc ampaign=buffer
ethnographic work can better understand the motivations
[16] Jacob M. Rigby, Duncan P. Brumby, Anna L. Cox, and Sandy J. J. Gould.
and emotional reactions to various Mobile TV content types 2016. Watching Movies on Netflix: Investigating the Effect of Screen
or viewing situations. Size on Viewer Immersion. In Proceedings of the 18th International
Conference on Human-Computer Interaction with Mobile Devices and
Services Adjunct (MobileHCI ’16). ACM, New York, NY, USA, 714–721.
REFERENCES https://doi.org/10.1145/2957265.2961843
[1] Frank Bentley and Janet Murray. 2016. Understanding Video Rewatch- [17] Jacob M. Rigby, Duncan P. Brumby, Sandy J. J. Gould, and Anna L.
ing Experiences. In Proceedings of the ACM International Conference on Cox. 2018. "I Can Watch What I Want": A Diary Study of On-Demand
Interactive Experiences for TV and Online Video (TVX ’16). ACM, New and Cross-Device Viewing. In Proceedings of the 2018 ACM Interna-
York, NY, USA, 69–75. https://doi.org/10.1145/2932206.2932213 tional Conference on Interactive Experiences for TV and Online Video
[2] Frank R Bentley, Nediyana Daskalova, and Brooke White. 2017. Com- (TVX ’18). ACM, New York, NY, USA, 69–80. https://doi.org/10.1145/
paring the reliability of Amazon Mechanical Turk and Survey Monkey 3210825.3210832
to traditional market research surveys. In Proceedings of the 2017 CHI [18] Dimitri Schuurman, Lieven De Marez, and Tom Evens. 2010. Content
Conference Extended Abstracts on Human Factors in Computing Systems. for Mobile Television: Issues Regarding a New Mass Medium Within
ACM, 1092–1099. Today’s ICT Environment. In Mobile TV: Customizing content and
[3] Barry Brown, Moira McGregor, and Donald McMillan. 2014. 100 experience. Springer, 143–163.
days of iPhone use: understanding the details of mobile device use. In [19] Emily Sun, Rodrigo de Oliveira, and Joshua Lewandowski. 2017. Chal-
Proceedings of the 16th international conference on Human-computer lenges on the Journey to Co-Watching YouTube. In Proceedings of the
interaction with mobile devices & services. ACM, 223–232. 2017 ACM Conference on Computer Supported Cooperative Work and
[4] Sydney Finkelstein and Shade H Sanford. 2000. Learning from corpo- Social Computing. ACM, 783–793.
rate mistakes: The rise and fall of Iridium. Organizational Dynamics [20] Sherry Turkle. 2017. Alone together: Why we expect more from technol-
29, 2 (2000), 138–148. ogy and less from each other. Hachette UK.
[5] Wayne Friedman. 2017. Netflix Ups Marketing Budget to $1 Bil- [21] European Broadcasting Union. 2004. ETSI EN 302 304 V1.1.1 (2004-11)
lion. (2017). https://www.mediapost.com/publications/article/307175/ Digital Video Broadcasting (DVB); Transmission System for Hand-
netflix-ups-marketing-budget-to-1-billion.html held Terminals (DVB-H). (2004). https://www.etsi.org/deliver/etsie n/
[6] Jacob Groshek, Sarah Krongard, and Yiyan Zhang. 2018. Netflix and 3023003 02399/302304/01.01.016 0/en3 02304v010101p.pdf
Ill?: Emotional and Health Implications of Binge Watching Streaming [22] European Broadcasting Union. 2009. ETSI TS 102 428 V1.2.1 (2009-
TV. In Proceedings of the 9th International Conference on Social Media 04) Digital Audio Broadcasting (DAB); DMB video service; User ap-
and Society (SMSociety ’18). ACM, New York, NY, USA, 296–300. https: plication specification. (2009). https://www.etsi.org/deliver/etsit s/
//doi.org/10.1145/3217804.3217932 1024001 02499/102428/01.02.016 0/ts1 02428v010201p.pdf[23] W Alex Vorbau, April Slayden Mitchell, and Kenton O’Hara. 2007. "
My iPod is my Pacifier": An Investigation on the Everyday Practices
of Mobile Video Consumption. In Eighth IEEE Workshop on Mobile
Computing Systems and Applications. IEEE, 29–33.
[24] Kyrylo Zakharov. 2016. Application of k-means clustering in psycho-
logical studies. Tutorials in Quantitative Methods for Psychology 12, 2
(2016), 87–100.You can also read