A hybrid network intrusion detection using darwinian particle swarm optimization and stacked autoencoder hoeffding tree
←
→
Page content transcription
If your browser does not render page correctly, please read the page content below
MBE, 18(6): 8024–8044.
 DOI: 10.3934/mbe.2021398
 Received: 13 July 2021
 Accepted: 01 September 2021
 Published: 15 September 2021
http://www.aimspress.com/journal/MBE

Research article

A hybrid network intrusion detection using darwinian particle swarm
optimization and stacked autoencoder hoeffding tree

B. Ida Seraphim1, E. Poovammal1, Kadiyala Ramana2,*, Natalia Kryvinska3,* and N.
Penchalaiah4

1
 Department of Computer Science and Engineering, SRM Institute of Science and Technology,
 Chennai, India
2
 Department of Artificial Intelligence & Data Science, Annamacharya Institute of Technology and
 Sciences, Rajampet, India
3
 Head of Information Systems Department, Faculty of Management Comenius University in
 Bratislava, Odbojárov 10, 82005 Bratislava 25, Slovakia
4
 Department of CSE, Annamacharya Institute of Technology and Sciences, Rajampet, India

* Correspondence: Email: natalia.kryvinska@univie.ac.at, ramana.it01@gmail.com.

Abstract: Cybersecurity experts estimate that cyber-attack damage cost will rise tremendously. The
massive utilization of the web raises stress over how to pass on electronic information safely. Usually,
intruders try different attacks for getting sensitive information. An Intrusion Detection System (IDS)
plays a crucial role in identifying the data and user deviations in an organization. In this paper, stream
data mining is incorporated with an IDS to do a specific task. The task is to distinguish the important,
covered up information successfully in less amount of time. The experiment focuses on improving the
effectiveness of an IDS using the proposed Stacked Autoencoder Hoeffding Tree approach (SAE-HT)
using Darwinian Particle Swarm Optimization (DPSO) for feature selection. The experiment is
performed in NSL_KDD dataset the important features are obtained using DPSO and the classification
is performed using proposed SAE-HT technique. The proposed technique achieves a higher accuracy
of 97.7% when compared with all the other state-of-art techniques. It is observed that the proposed
technique increases the accuracy and detection rate thus reducing the false alarm rate.

Keywords: intrusion detection system (IDS); stream data mining; stacked autoencoder; DPSO;
Hoeffding tree; feature selection
8025

1. Introduction

 With the development of internet technology, there is a tremendous increase in the dimensions of
information that are generated, exchanged and processed. Almost in all the fields there is a difficulty
in handling large amount of high dimensional data. These data become the target for illegal activities
which impose a severe threat to the network security. The traditional security techniques such as
antivirus, firewall, data encryption and user identification which acts as the first line of defense that
alone is not sufficient to provide the better security to the network. The second line of security is highly
recommended that can be provide by an Intrusion Detection System (IDS) [1]. Using these two lines
of security enhances the overall network security. An Intrusion Detection System (IDS) identifies the
intruders who are harmful to an organization. The main goal of an IDS is to monitor the network or
system for abnormal pattern or traffic and prevent it from unauthorized access [2]. However, the key
problem is identifying the unknown malicious traffic. The Intrusion Detection Systems is broadly
classified into two types based on the source of data. First, Network Intrusion Detection System (NIDS)
placed near the network points checks the network traffic from the routers and gateways for intrusion.
It can detect attacks in real time. The main limitation of NIDS is that it can monitor the traffic passing
through the specific network nodes. Second, the Host Intrusion Detection System (HIDS) scans the
individual host for suspicious activities like an unwanted configuration change, deletion or
modification of system files, or an unwanted sequence of system calls. If any of these activity occurs,
it sends an alert to the administrator [3]. The main limitation in HIDS is that it cannot analyze the
network behaviors. Next the Intrusion Detection System (IDS) uses three different detection
mechanisms to detect the attacks and each detection method is further classified accordingly. Figure 1
shows the different detection mechanisms to detect the intrusions.

 Figure 1. Types of detection mechanism.

Mathematical Biosciences and Engineering Volume 18, Issue 6, 8024–8044.
8026

1.1. Signature-based/misuse detection mechanism

 Signature-based IDS uses the set of rules or predefined signatures for detecting the known
attacks [3]. Misuse detection techniques are based on knowledge or based on Machine Learning (ML)
methods. In a knowledge-based strategy, the network stream of traffic or host audit data is analyzed
and compared with the predefined set of rules. There are three ways of applying the knowledge-based
approach: signature matching, rule-based expert system, and state transition analysis [3]. The signature
matching compares the incoming network traffic with the predefined attack signatures for intrusion. A
rule-based expert system finds out the intrusion by comparing the traffic with the predetermined rules.
Finally, state transition analysis maintains the state transition model for each known suspicious activity.
Machine Learning (ML) based IDS offers learning based on model to detect the normal behavior from
attack behavior. The ML model generates the representation for the known models. It uses supervised
machine learning techniques such as SVM, Decision Tree to detect the known attacks more efficiently.
 The significant drawback of Signature-based Detection is that it needs to update the signatures
regularly for new attacks for which signatures are not there in the database. As a result, it generates
more false alarms. It has to maintain a large signature database.

1.2. Anomaly-based detection mechanism

 Anomaly-based detection uses a hypothesis to detect novel, unknown intrusion if any deviation
or behaviour change occurs [3]. Anomaly-based detection comprises statistical techniques, Finite State
Machine (FSM) and machine learning techniques. FSM generates the behaviour model that contains
states, actions and transitions. Semi-Supervised and Unsupervised ML techniques such as clustering
algorithms, one class SVM are mainly used for anomaly detection. The anomaly-based detection can
detect both known and unknown attacks. The prime limitation is that anomaly-based detection suffers
from high false positives [3].

1.3. Hybrid detection mechanism

 Hybrid detection mechanism combines signature and anomaly-based detection to detect the
intrusion [3].

1.4. Limitations of current IDS

 Current IDS can detect more accurately and precisely the known attacks, which leaves the system
more vulnerable to novel malicious attacks where predefined signatures are not available [4].
 High False positives-The current IDS suffers from high false positives. False positives are the
incorrect classification of a normal event as malicious events. The main aim of an IDS is to minimize
the false positives as far as possible [4].
 High False-negatives-The current IDS suffers from high false negatives. False negatives are the
incorrect classification of malicious events as normal events. The main aim of an IDS is to reduce the
false negatives as minimum as possible [4].
 Data Overload-Millions of data are generated every day depending on the company's size and
the IDS tools used, which leads to a data overload [4].

Mathematical Biosciences and Engineering Volume 18, Issue 6, 8024–8044.
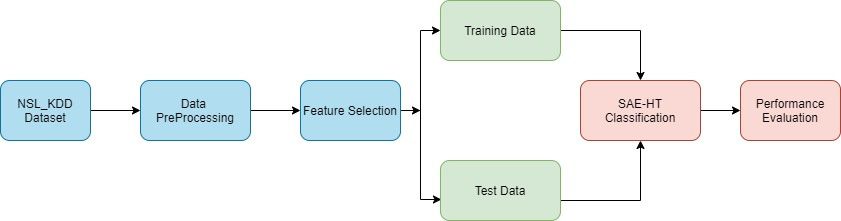
8027

1.5. DataStream mining

 DataStream mining is the continuous well-ordered sequence of data that arrives in a timely
fashion [5]. Data streams are a constant flow of unlimited data with high speed, and data changes with
time compared to the traditional databases [6]. The primary requirement of the stream data is to inspect
each instance only once. Therefore, it should use a limited amount of memory and should give the
outcome in a less amount of time. Data streams are of two types, namely streams that are static and
streams that are evolving. The bulk arrival of data that won’t change with time is called static stream.
The data that arrives continuously and changes with time is called evolving data streams [6].
 The paper is organized as follows: Section 2 presents the earlier work on various machine learning
and feature selection techniques. Section 3 discusses the methodology used for preprocessing, feature
selection and classification. Section 4 discusses the experimental setup, dataset details and the
performance evaluation metrics used. Section 5 presents the result outcomes and its performance
comparison with the state of art methods and finally Section 6 summarizes the research work
undergone and future scope.

2. Related works

 There has been quite a lot of research on intrusion detection using machine learning and deep
learning techniques and the hybrid approaches. The related work (Table 1) presents the latest
techniques used and its relevant advantages and disadvantages.

3. Methodology

 The proposed work uses the NSL_KDD benchmark dataset for intrusion analysis. The first phase
focuses on feature selection using Darwinian Particle Swarm Optimization and selects key features
that contribute to intrusion. The second phase emphasises applying the proposed Stacked Encoding
Hoeffding Tree technique to classify the data based on performance metrics like accuracy, specificity,
sensitivity, false-positive rate, false-negative rate and F1 score.
 The benchmark NSL_KDD dataset is taken for the analysis. The dataset which we have taken is
standalone dataset in order to incorporate stream data, the dataset is streamed using the techniques in
Matlab tool. The system object technique simplifies the streaming process in Matlab. The data is now
continuous and it possess the characteristics of streaming data. The attacks are detected using the
proposed Stacked Autoencoder Hoeffding Tree (SAE-HT) classification approach. The bio-inspired
technique called Darwinian Particle Swarm Optimization (DPSO) enhances the performance of the
SAE-HT classification technique. The distracting variance is removed from the data using the DPSO
feature selection technique that enables the classifier to perform better, especially when dealing with
the high dimensional features. Figure 2 shows the flow diagram of SAE-HT classification technique.

Mathematical Biosciences and Engineering Volume 18, Issue 6, 8024–8044.
8028
 Table 1. Related works.
 Authors Algorithms Used Computational Methods Pros Cons
 X. Li et al. (2021) CMPSO, ACO, KH, IKH, The NSL_KDD dataset is taken for Good convergence speed. Lower false Attack with fewer
 [7] LNNLS-KH intrusion detection. The proposed positive rate. samples, an adversarial
 LNNLS-KH is compared with CMPSO, LNNLS-KH gives an accuracy of 96.12% learning method can be
 ACO, KH, and IKH algorithms and best used to create similar
 features are selected. Then KNN attacks.
 technique is applied for further
 classification.
 X. K. Zhou et al. AdaBoost, LSTM, CNN The authors proposed a variational long The loss function helps to reconstruct the Imbalanced data is still a
 (2021) [8] LSTM, VLSTM short-term memory technique that hidden variable into meaningful form. challenge in anomaly
 detects intrusion anomalies efficiently Proposed VLSTM gives the accuracy of detection.
 based on feature reconstruction. 89.5%.
 T. H. Hai et al. Novel architecture of storage The Novel storage with HBase or Processing time is reduced. Takes more query time.
 (2020) [9] tools and distributed log Apache Spark enhances NIDS data
 processing processing.
 S. N. Mighan et al. SVM, SAE-SVM Hybrid scheme that uses deep learning SAE-SVM shows higher accuracy of Computational time taken
 (2020) [10] and machine learning method together 95.98%. is more.
 (SAE-SVM) can detect intrusion attacks
 more precisely.
 T. Vaiyapuri et al. Stacked Autoencoder, Sparse All the methods mentioned are compared SAE 85.23%, SAAE 86.02% DAE Reduced reconstruction
 (2020) [11] Autoencoder, Denoising with contractive autoencoder. The 86.92% ContAE 87.98% CAE 81.07% ability further needs to be
 Autoencoder, Contractive contractive autoencoder gives 87.98% improved
 Autoencoder, Convolution intrusion detection accuracy.
 Autoencoder
 C. F. Tang et al. Stacked Autoencoder Deep SAAE selects the needed features from SAE-DNN gives 82.23% accuracy. The The accuracy achieved can
 (2020) [12] Neural Network (SAE- the intrusion dataset and initializes proposed SAAE-DNN shows higher be improved further.
 DNN), SAAE-DNN weight to DNN thus improves the accuracy of 87.74% when compared to
 intrusion detection accuracy. SAE-DNN.
 Continued on next page
Mathematical Biosciences and Engineering Volume 18, Issue 6, 8024–8044.
8029
 Authors Algorithms Used Computational Methods Pros Cons
 A. D. Jadhav et al. SVM, KNN, Decision Tree, The proposed distributed and parallel Faster detection of intrusion. Not applied in real time
 (2019) [13] Naïve Bayes classifier approach enhances the efficiency of environment.
 machine learning techniques detecting the intrusions faster.
 to detect the attacks.
 Proposed a distributed and
 parallel approach.
 A. Muallem et al. Hoeffding Tree Restricted, The survey talks about the flexibility of All the techniques surveyed gives good Improvement in accuracy
 (2017) [14] Hoeffding Trees AUE2 with the methods when used in different accuracy. Hoeffding Tree 93% Restricted is needed.
 Buffer AUE2 without Buffer domains of streaming data. Hoeffding Trees 92.15% AUE2 with
 Hoeffding Adaptive Trees Combinations of technique solves the Buffer 94.07% AUE2 without Buffer
 with DDM and ADWIN intrusion anomaly detection problem. 94.06% Hoeffding Adaptive Trees with
 DDM and ADWIN 92%.
 G. Kim et al. Hybrid approach combines C C 4.5 is used to build the misuse Good detection accuracy for both known Processing time is more
 (2014) [15] 4.5 algorithm and one class detection model and decompose the and unknown attacks. Low false positive. for the proposed
 SVM approach training data into smaller subsets. technique.
 Multiple one class SVM models are built
 to enhance intrusion detection accuracy
 H. K. Sok et al. ADT algorithm The alternating decision tree algorithm is Classification process simplifies. Evaluation speed needs to
 (2013) [16] used for knowledge discovery and be improved.
 effective selection of features.
 S. J. Horng et al. BIRCH hierarchical It combines BIRCH hierarchical The training time is reduced and gives a It cannot detect U2L and
 (2011) [17] clustering technique, SVM clustering technique and SVM which good detection accuracy of 95.72%. It R2L attacks.
 gives good detection accuracy. mainly detects DOS or Probe attacks.
 Tavallaee et al. KDD CUP 99 dataset Analysis on KDD CUP 99 dataset is Good for signature-based detection. Poor detection when used
 (2009) [18] made. for anomaly detection.
 Contains many duplicate
 values leads to
 performance degradation.

Mathematical Biosciences and Engineering Volume 18, Issue 6, 8024–8044.
8030

 Figure 2. Flow diagram of SAE-HT classification technique.

3.1. Data Preprocessing

 Data preprocessing is a vital step in machine learning. The raw data collected is made ready to be
used by machine learning techniques to extract meaningful insights from the data. The NSL_KDD
dataset taken from Canadian Institute for Cybersecurity is analyzed. If the downloaded dataset is in gz
or Tcpdump format, convert that to CSV file format and load the dataset into the environment. The
proposed classification technique supports only the numeric data. Since most machine learning (ML)
techniques use mathematical equations that only support the usage of numeric data, the conversion of
categorical data into numerical data using data conversion functions should occur. The one-hot
encoding technique converts the categorical data to numerical data, thus making it convenient to apply
machine learning techniques to the dataset.

3.2. One-hot encoding technique

 The one-hot encoding technique is the most effective encoding technology to deal with the
conversion of numeric to categorical features [19]. It can convert the categorical features to a binary
vector. The vector holds Zeroes, and One’s as values. The vector holds only one element with the value
one and other values corresponding to Zero. An element with value one indicates the occurrence of the
possible values against the categorical features. The NSL_KDD dataset contains three categorical
features such as protocol_type, service and flag. For example, the protocol_type consists of three
attributes: ICMP, TCP, UDP. Using one hot encoding technique, ICMP can be encoded as (1,0,0), TCP
can be encoded as (0,1,0), UDP can be encoded as (0,0,1). Similarly, categorical features service and
flag are also encoded into one-hot encoding vectors.

3.3. Feature selection

 Feature selection mainly reduces the features by removing the insignificant or less significant ones.
There are many feature selection techniques. This paper uses the Bio-Inspired feature selection
technique called Darwinian Particle Swarm Optimization (DPSO) to select optimal features. The main
goal of the DPSO is to find the non-redundant and highly correlated features, thus eliminates the least
correlated features [20]. DPSO is the extension of the PSO technique with the basic principle of
survival of the fittest. The major drawback of PSO and other bio-inspired feature selection techniques

Mathematical Biosciences and Engineering Volume 18, Issue 6, 8024–8044.
8031

is that it gets trapped in the local optimum. No long-term memory effect leads to premature
convergence to the local optimum DPSO overcomes the above drawback. DPSO consists of multiple
swarms in which each swarm performs like an individual PSO. All the swarms run simultaneously
towards the local optimum, and each swarm is compared. The best swarm gets the extended life, and
the stagnated or insufficient swarm got deleted.
 DPSO is an effective evolutionary algorithm that searches the population of individuals for local
optimum. The population represents the “swarm”, and individuals represent the “particles”.
Throughout the evolutionary process, every particle updates its moving direction according to the
position. There are two positions, namely local best and global best position [21]. The local best
position (pbest) is the particle's position among all the particles that are visited so far. The global best
position (gbest) is the best fitness achieved among all the visited particles so far. In each iteration, the
particle updates its velocity and position, which is given by Eqs (1) and (2) [22].

 1 (1)

 1 1 (2)
 , ,…., denotes the particle position at generation j in a D-dimensional search
space. Vj (t + 1) is the velocity produced at time t + 1. Pj is the best position of the particles found so
far (pbest). It denotes the cognitive component of Eq (1). Pg is the best global position found so far
(gbest). It represents the social component of Eq (1). ω signifies the inertia weight, c signifies a
constant called local and global weight, r signifies random variable which ranges between (0,1). The
searching process keeps on going until the predefined threshold reaches. DPSO is more efficient than
the original PSO and thus prevents premature convergence to a local optimum. Rearrange the velocity
function in Eq (1), and it is given by Eq (3) [22].
 1
 1 1 2
 2 6

 1 2
 3 (3)
 24
 The left side of Eq (3) gives a discrete version of the derivative of velocity D [V + 1] with
order α = 1. Finally, the Grunwald-Letnikov derivative expresses the discrete-time implementation
using Eq (4) [22].

 1 1 Γ 1
 (4)
 Γ 1 Γ 1

 Here T represents a sample period, and r represents the truncate order. Repeat Eq (3) to update
every particle velocity. The different values generated to control the convergence speed of the
optimization process.

3.4. Proposed classification algorithm (SAE-HT)

 Classification is the supervised machine learning technique that divides the set of data into
different classes. As the data generation is continuous, it is impossible to store a massive amount of
data. So, the data needs to be analyzed as it comes in. The classification techniques are very much

Mathematical Biosciences and Engineering Volume 18, Issue 6, 8024–8044.
8032

helpful in classifying the streaming data [23]. This paper proposes a classification technique for stream
data mining called the Stacked Autoencoder Hoeffding Tree approach. Even though stacked
autoencoder gives good accuracy on its own but in order to improve it further we applied hoeffding
tree approach. The stacked autoencoder is an unsupervised learning technique that maintains three
layers: input, output, and hidden layers [24]. An encoder takes the input and maps it to the hidden
representation. Finally, the decoder reconstructs the input. Equation (5) gives the encoder process [24].
 h f Wx b (5)
where hn represents the encoder, vector determined from xn. Encoding function f, weight matrix of the
encoder W1, and bias vector b1.
 Equation 6 represents the decoder process. Where g denotes decoding function, W2 denotes the
decoders weight matrix, and b2 denotes the bias vector [24].
 X g Wh b (6)
 When the decoder reconstructs the input data, there is a possibility that it results in reconstruction
error. Equation (7) minimizes the reconstruction error [24].

 arg min 1
 ϕ Θ L X ,X (7)
 θ, θ n

where L denotes the loss function, and , ∥ ∥ represents the loss function.
 Now Hoeffeding tree is used to classify the class labels. The Hoeffding tree is a kind of decision
tree that consists of a root node, test node and leaf node. The leaf node holds the class prediction. The
main requirement in streaming data is to classify the data in a single pass. The data represented as a
tree structure using the Hoeffding tree technique when the model built incrementally. The main
disadvantage in Hoeffding tree classification is that it fails to classify the data into a tree when a tie
occurs. Equation (8) gives the formula for Hoeffding bound calculation [25].
 1
 log (8)
 ∈
 2

where R denotes the range of random variable, δ denotes the desired probability not within ε of the
expected value, N denotes the number of instances collected at the node.

 Algorithm: Stacked Autoencoder Hoeffding Tree Approach
Input: NSL_KDD benchmark dataset
Output: Classification results: Accuracy, Sensitivity, Specificity, False Alarm Rate, False Negative
Rate and F1 Score.
 Procedure
 1. Load the network intrusion benchmark dataset (NSL_KDD dataset)
 2. Data preprocessing
 3. Apply bio-inspired feature selection technique (DPSO) to select the significant features
 4. Partition the dataset into training and testing data
 5. Input data to the encoder and maps it to the hidden representation to obtain a learned feature
vector.
 6. The feature vector from the previous layer is the input to the next layer. This process repeats

Mathematical Biosciences and Engineering Volume 18, Issue 6, 8024–8044.
8033

till the training ends.
 7. The decoder reconstructs the input from the hidden representation. Thus, Eq (7) minimizes
the reconstruction error.
 8. for entire training data, do
 9. Use the Hoeffding tree technique and sort the instances to leaf
 10. Update the necessary statistics in
 11. Increment , for all the instances at
 12. if mod 0 and instances at are of a different class, then
 13. Calculate for each feature
 14. The feature with the highest value represents
 15. The feature with the second-highest value represents
 16. Calculate Hoeffding Tree Bound using Eq (8)
 17. If ≠ ∅ and ( - > ∈ or ∈ < τ) then
 18. Replace with an internal node that splits on
 19. for entire branches, do
 20. Add and initialize a new leaf with sufficient statistics
 21. End
 22. Returns the classification result.

 The pseudocode of the stacked autoencoder hoeffdding tree explains the following: Line 1 loads
and streams the NSL_KDD dataset using Matlab platform. Line 2 performs the preprocessing of the
dataset. The categorical data in the dataset is converted to numeric data using the one-hot encoding
technique. In line 3, the DPSO feature selection algorithm is applied, and the important features are
selected based on the selection score generated by the algorithm. Line 4 the data is divided into test
and train sets. Lines 5–7 explains the stacked autoencoder process where the input data to the encoder
is mapped to the hidden representations to obtain the learned features. The learned feature vector is
given as an input to the next layer. This process continues till the training ends. The decoder
reconstructs the hidden representations. The reconstruction error is minimized by calculating the loss
function. Lines 8–21 explains the procedure of the hoeffding tree. The output generated by the stacked
autoencoder is fed as an input to the hoeffding tree technique. The input is taken and the root node is
decided and initialized. The tree is constructed incrementally for each training data until suitable leaf
arrives. Each node has enough information to make a decision. It uses information gain to make the
attribute split. The best attribute is found at each node and test is performed to decide whether the
attribute yields better results based on Hoeffding bound. The test is applied on the attributes to find out
which attribute gives better results and split the node for the growth of the tree. Line 22 returns the
classification results.

4. Experimental setup

 The experiment was conducted with the proposed technique in MATLAB R2021a on Windows 10
64-bit operating system with Ryzen 7 processor and 16 GB RAM. The experiment uses a stream-
oriented offline database for querying the network traffic data. It enables a natural data analysis within
the IDS. The streaming architecture is used across multiple sites to process attack data to increase the
performance in large scale systems because the data is processed during the natural flow and stored
only for a limited amount of time for analysis. In the research work, we have applied a hybrid

Mathematical Biosciences and Engineering Volume 18, Issue 6, 8024–8044.
8034

classification technique. The proposed hybrid classification technique’s performance was analyzed by
applying various performance evaluation metrics.

4.1. Intrusion dataset

 The NSL_KDD dataset is used for experimentation of the proposed work. The KDD CUP’99
dataset is the popular benchmark dataset used for network intrusion detection system. The main
limitation of the KDD CUP’99 dataset is that it contains a high number of redundant records that affect
the effectiveness of the evaluated system [26]. The improved version of KDD CUP’99 is the
NSL_KDD dataset in which the redundant records are removed. NSL_KDD dataset have
approximately 125,973 training data and 22,544 testing data [27]. Similar to KDD CUP’99, the records
in NSL KDD dataset are unique and labelled as normal and anomaly. It has 41 features that address
four different categories of attacks. Table 2 shows the NSL KDD features [27].

 Table 2. NSL_KDD dataset features.
 No NSL_KDD Feature Names No NSL_KDD Feature Names
 1 duration 21 _is_host_login
 2 protocols_types 22 _is_guests_login
 3 services 23 _counts
 4 flag 24 src_counts
 5 source_bytes 25 srcerror_rate
 6 dstn_bytes 26 srcs_error_rate
 7 lang 27 rerrors_rate
 8 wrong_fragments 28 src_rerrors_rate
 9 urgent 29 simlr_srcs_rate
 10 hot 30 diff_srcs_rate
 11 numbr_failed_login 31 src_diffs_host_rate
 12 usr_login 32 dstv_host_counts
 13 numbr_compromises 33 dstn_host_src_count
 14 numbr_root_shell 34 dstn_simlr_src_rate
 15 numbr_attempts 35 dstn_diffs_srce_rate
 16 numbr_of_roots 36 dstn_hosts_sim_srce_port_rates
 17 numbr_files_creation 37 dstn_hosts_src_diffr_host_rates
 18 numbr_offshell 38 dstn_hosts_srcerror_rate
 19 numbr_access_usrfiles 39 dstn_hosts_srce_srerror_rate
 20 numbr_outbounds_cmd 40 dstn_hosts_error_rates
 41 dstn_hosts_srce_error_rates

4.2. Performance evaluation

 The study was conducted to measure the performance and compare the results based on the
performance metrics such as accuracy, sensitivity, specificity, False Positive Rate (FPR), False
Negative Rate (FNR). The feature selection technique selects the important features that play a
significant role in the intrusion. Then the proposed classifier performance is determined with the help

Mathematical Biosciences and Engineering Volume 18, Issue 6, 8024–8044.
8035

of performance evaluation metrics. Accuracy is the most common performance evaluation technique.
Accuracy is the total number of instances correctly predicted as an attack from the ratio of all predictions
made from the given dataset. Equation (9) shows the way of accuracy (ACC) calculation [28].
 TP TN
 CC (9)
 TP TN FP FN
 The confusion matrix in Table 3 defines the TP, TN, FP, FN
 TN (True Negative): The actual and predicted instances both are classified as normal.
 FP (False Positive): The actual normal instance is predicted as an anomaly by the IDS.
 FN (False Negative): The actual anomaly instance is predicted as normal by the IDS.
 TP (True Positive): The actual anomaly instance is predicted as an anomaly by the IDS.

 Table 3. Confusion matrix for IDS.
 Actual Instance Predicted Instance
 Normal Anomaly
 Normal True Negative (TN) False Positive (FP)
 Anomaly False Negative (FN) True Positive (TP)

 Sensitivity (S) is the probability to identify an attack instance as an attack accurately. Recall or True
Positive Rate (TPR) are the other names for sensitivity. Sensitivity can be calculated as in Eq (10) [29].
 TP
 S (10)
 TP FN
 Specificity (SP) is the probability to identify a normal instance as normal correctly. Specificity can
be named as True Negative Rate (TNR). Equation (11) shows the specificity calculation formula [29].
 TN
 SP (11)
 TN FP
 FPR is the chance that the normal instance incorrectly classified as an attack. FPR is also known
as False Alarm Rate (FAR). FPR calculation is given by Eq (12) [30].
 FP
 FPR (12)
 FP TN
 FNR is the chance that the attack instance incorrectly classified as normal. It is also named Miss
Rate. FNR calculation is given in Eq (13) [30].
 FN
 FNR (13)
 FN TP
 F1 Score is the harmonic mean of precision and recall. F1 Score serves as the derived effectiveness
measurement. F1 Score calculation is given by Eq (14) [30].

 ∗
 F Score 2∗ (14)

 We designed an overall system architecture for supporting the properties of Network IDS with
the help of machine learning techniques. Figure 2 shows the flow diagram of system architecture

Mathematical Biosciences and Engineering Volume 18, Issue 6, 8024–8044.
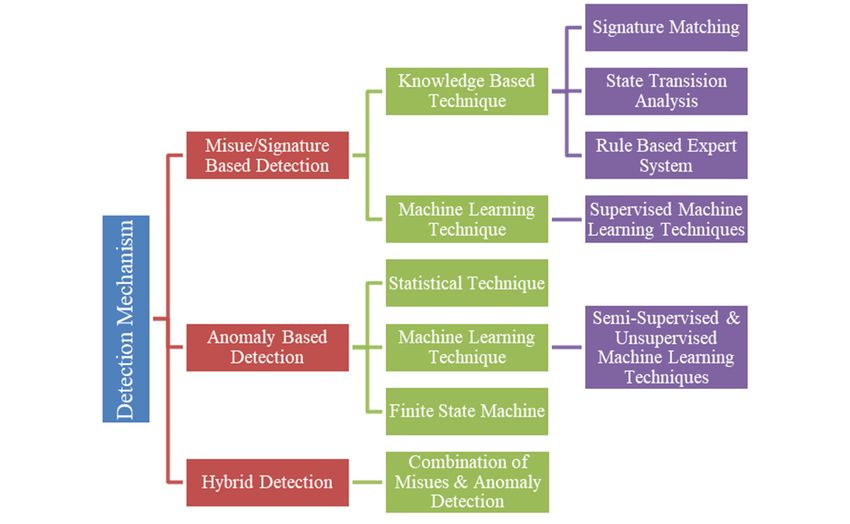
8036 consisting of network benchmark dataset, feature selection, proposed classifier, evaluation parameters and analysis of results. 5. Results and discussion In this experimental analysis, the feature selection technique selects the optimal subset of informative features from the given dataset. We take the optimal subset of features for analyzing the impact of the proposed technique on how accurately it classifies the network traffic into normal or anomaly. A comprehensive study was conducted to validate the impact of the proposed technique, such as performance metrics, feature selection analysis which is helpful in the prediction of anomalies in the network traffic. The main objective of this experimental study is that. To identify the optimal subset of informative features that contributes to intrusion from the intrusion dataset. Though the DPSO feature selection technique is not new, the main advantage of DPSO is that it won't get trapped in the local optimum that helps us select the best features for evaluation. To enhance the efficiency of intrusion detection using a hybrid classification technique, which is novel and is used to evaluate the performance and detection capabilities. To evaluate the proposed classification technique on the NSL_KDD dataset. To study the performance evaluation of the proposed classification technique by applying various performance measures such as accuracy, sensitivity, specificity, FPR and FNR. To compare the efficiency of the proposed technique with state-of-art methods. 5.1. Feature selection techniques analysis A comprehensive study was performed between five different bio-inspired feature section techniques in terms of accuracy, detection rate and FPR. The proposed feature selection technique achieved a considerable performance improvement compared to other feature selection techniques. The results achieved after applying the feature selection and proposed classification technique to the NSL_KDD dataset is depicted in Table 4. It compares classification accuracy, classifiers detection rate and false positive rate of the proposed technique with the state-of-art techniques. In the compared feature selection techniques LHHLS-KH feature selection technique has given the best accuracy of 96.12%, detection rate of 96.48% and false positive rate of 4%. Now the performance of the proposed technique combined with feature selection gives an accuracy of 97.70 %, detection rate of 97% and false positive rate of 1.25 % which is 0.52, 1.58 and 2.75% higher than LHHLS-KH technique. To visualize the difference between classification accuracy, DR and FPR are shown in Figure 3. For the NSL_KDD dataset, the false positive rate of DPSO with the proposed classification technique is 1.25%. It reduces by 23.45, 18.05, 11.63, 6.09 and 2.75%, respectively, compared with Cross Mutation Particle Swarm Optimization (CMPSO), Ant Colony Optimization (ACO), Krill Herd (KH), Improved Krill Herd (IKH) and Linear Nearest Neighbor Lasso Step-Krill Herd (LHHLS-KH). Similarly, the detection rate of the DPSO with the proposed classification technique is 97% which is 13.99, 9.85, 7.54, 5.25, 0.52% higher than CMPSO, ACO, KH, IKH and LHHLS-KH. Similarly, the accuracy of DPSO with the proposed classification technique is 97.70% which is 16.79, 13.67, 9.49, 6.48 and 1.58% higher than CMPSO, ACO, KH, IKH and LHHLS-KH. In conclusion, the proposed Mathematical Biosciences and Engineering Volume 18, Issue 6, 8024–8044.
8037

classification technique with DPSO proves that it has higher detection accuracy, lower false positive
rate and higher detection rate.

 Table 4. Classification accuracy, DR and FPR of various feature selection techniques
 (NSL_KDD dataset).
 Feature Number of Selected features Accuracy Detection False Positive
 Selection Features (%) Rate (DR) Rate (FPR)
 (%) (%)
 CMPSO [7] 33 2,3,4,5,6,7,8,9,10,11,12,13,14, 80.91 83.01 24.70
 17,18,19,20,21,22,23,25,26,27,
 30,32,33,34,35,37,40,41
 ACO [7] 31 1,3,4,6,7,8,12,14,15,16,17,19,20,2 84.03 87.15 19.30
 1,23,24,25,27,28,29,30,33,34,
 35,36,37,38, 39,40,41
 KH [7] 26 2,3,4,5,6,7,8,9,10,12,13,14,15,18, 88.21 89.46 12.88
 19,21,22,23,24,26,28,30,31,32,
 40,41
 IKH [7] 25 2,3,4,5,6,8,10,11,12,14,17,18,20,2 91.22 91.75 7.34
 1,22,27,28,29,30,31,34,35,36,
 39,41
 LHHLS-KH 19 2,3,4,6,8,10,11,15,17,19,20,21, 96.12 96.48 4
 [7] 29,30,33,34,36,37,40
 DPSO 28 2,3,4,6,7,8,11,12,13,15,16,17,18,1 97.70 97 1.25
 9,21,23,24,25,26,28,29,30,33,
 34,35,36,37,40

 Figure 3. Comparison of classification accuracy, DR and FPR with FS techniques
 (NSL_KDD dataset).

Mathematical Biosciences and Engineering Volume 18, Issue 6, 8024–8044.
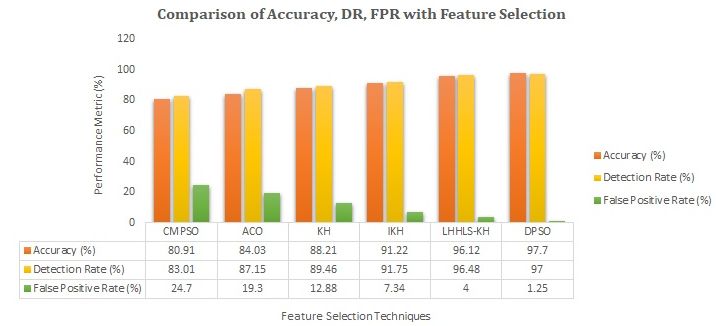
8038

5.2. Detection time analysis

 The detection time was compared for further evaluation. Table 5 shows the detection time when
applied to different techniques. The detection time represents the time taken from inputting the optimal
subset of features into the classifier till the end of detection.

 Table 5. Detection time of different feature selection techniques (NSL_KDD dataset).
 Feature Selection Techniques Detection Time (Sec)
 CMPSO [20] 41.36
 ACO [20] 41.39
 KH [20] 37.78
 IKH [20] 36.99
 LNNLS-KH [20] 34.40
 DPSO 41.56

 Table 5 shows the time taken to detect the intrusion when different bio-inspired feature selection
techniques are applied. The features selected by CMPSO, ACO, KH, IKH and LHHLS-KH are inputted
to the individual classifier. In the existing systems compared, ACO feature selection took the highest
detection time of 41.39 seconds with the accuracy of 84.03%, detection rate of 87.15% and false
positive rate of 19.30%. Now the selected features with DPSO feature selection technique when given
to a proposed hybrid classifier it took 41.56 seconds to detect the intrusion which is 0.41% higher than
ACO feature selection technique. Even though it took slightly longer detection time there is a
considerable increase in the performance. The DPSO detection accuracy is 97.7%, detection rate is 97%
and false positive rate is 1.25% which when compared to ACO yields 13.67, 9.85% increase in
accuracy, detection rate and 18.05% decrease in false positive rate.

5.3. Performance analysis of proposed classifier

 The experimental study was conducted using the proposed stacked autoencoder hoeffding tree
approach with and without feature selection. The proposed technique performance evaluation was
based on accuracy, sensitivity, specificity, false-positive rate and false-negative rate. The results
achieved with and without the feature selection of the proposed classification technique is given in
Table 6.

 Table 6. Performance comparison of the proposed technique with and without feature selection.
 Performance Metrics (%) SAE-HT without FS (41 SAE-HT with FS (28 Features)
 Features)
 Accuracy 55.93 97.7
 Sensitivity (TPR) 100 97
 Specificity (TNR) 28.57 98.75
 False Positive Rate (FPR) 71.43 1.25
 False Negative Rate (FNR) 0 3
 F1 Score 37.6 98

Mathematical Biosciences and Engineering Volume 18, Issue 6, 8024–8044.
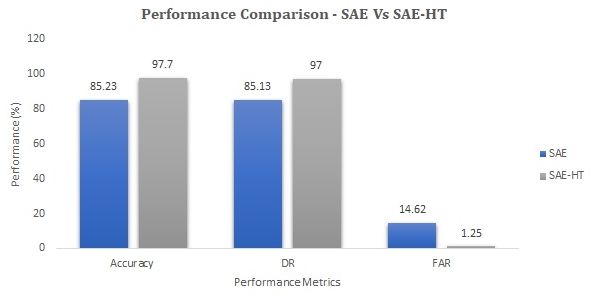
8039

 Figure 4. Performance comparison of the proposed technique with and without feature
 selection.

 The proposed SAE-HT was employed on the NSL_KDD dataset. Figure 4 demonstrates the
performance comparison of proposed technique with and without FS. First, the proposed classifier was
applied to all the 41 features of the dataset and found that the detection accuracy was only 55.93%.
Moreover, the false positive rate was 71.43% and false negative rate was almost 0%. Our aim was to
reduce the false positive rate to a greater extent and increase the accuracy as far as possible. Then
the study was made and found that less relevant and unimportant features affect the performance of
the proposed classifier. Second, the bio-inspired DPSO feature selection technique was applied and 28
important features that contributes to intrusion were selected. The selected features were given to the
stacked autoencoder to learn the features so as to yield good performance and the output from the
stacked autoencoder was given to hoeffding tree and found that the accuracy increased to 97.7%, false
positive rate decreased to 1.25% which is 43.77% higher than SAE-HT without FS. Same way the
false positive rate decreased by 70.18% when SAE-HT with FS was applied. Likewise, specificity was
97% and sensitivity rate was 98.75% when SEA-HT with FS was applied. Therefore, it proves that the
proposed classifier with feature selection provides a good detection accuracy with less FPR and FNR.

 Figure 5. Performance comparison: SAE Vs SAE-HT.

Mathematical Biosciences and Engineering Volume 18, Issue 6, 8024–8044.
8040

 The exact process is carried out for 29 features, and the accuracy is 97.3%. When applied to 30
features, the accuracy is 97.1%. From this, we conclude that the accuracy reaches saturation. There is
no drastic improvement in accuracy when we include more features. As we increase the number of
features once again, the accuracy starts decreasing. Therefore 28 features are the optimal features that
contribute to intrusion. As the accuracy increases the false positive rate started decreasing.
 Figure 5 depicts the performance of Stacked Autoencoder (SAE) and Stacked Autoencoder
Hoeffding Tree (SAE-HT). The stacked autoencoder by itself gives a good accuracy, detection rate of
85.23%, 85.13% and reduced false alarm rate of 14.62% but achieves much better results in terms of
accuracy, detection rate and false alarm rate when combined with the hoeffding tree. SAE-HT
technique when applied it gave the accuracy of 97.7%, Detection Rate of 97% which is 12.47, 11.87%
higher than SAE and false alarm rate of 1.25% which is decreased by 13.37% when compared to SAE.

5.4. Comparison with state-of-art techniques

 The proposed technique was compared with the state-of-Art techniques to prove its efficiency.
Table 7 show the comparison of proposed with other state-of-art techniques. We have compared
different conventional classification methods and deep leaning methods with our proposed technique.

 Table 7. Comparison of proposed technique with state-of-art techniques.
 Prediction Techniques Accuracy (%)
 VLSTM [8] 89.5
 AdaBoost [8] 84.8
 LSTM [8] 85.1
 CNN LSTM [8] 83.3
 SAE-SVM [10] 95.98
 SAE [11] 85.23
 SSAE [11] 86.02
 DAE [11] 86.92
 ContAE [11] 87.98
 CAE [11] 81.07
 SAE-DNN [12] 82.23
 SAAE-DNN [12] 87.74
 Hoeffding Tree [14] 93
 Restricted Hoeffding Trees [14] 92.15
 AUE2 with Buffer [14] 94.07
 AUE2 without Buffer [14] 94.06
 HAT + DDM + ADWIN [14] 92
 Hierarchical Clustering and SVM [17] 95.72
 Proposed SAE-HT 97.7

Mathematical Biosciences and Engineering Volume 18, Issue 6, 8024–8044.
8041

 The SAE-HT classifier with feature selection gives the overall detection accuracy of 97.7 % which
increases by 8.2, 12.9, 12.6, 14.4, 1.72, 12.47, 11.68, 10.78, 9.72, 16.7, 15.47, 9.96, 4.7, 5.55, 3.63,
3.64, 5.7 and 1.98% when compared to VLSTM, AdaBoost, LSTM, CNN LSTM, SAE-SVM, SAE,
SAAE, DAE, Cont AE, CAE, SAE-DNN, SAAE-DNN, Hoeffding tree, Restricted hoeffding tree,
AUE2 with buffer, AUE2 without buffer, HAT+DDM+ADWIN, Hierarchical Clustering and SVM.
 Compared with the state-of-the-art techniques in the related work, the proposed SAE-HT
classifier performs better in terms of accuracy, detection rate, and false alarm rate. Thus, proving that
it has met the significant challenges by giving high accuracy of 97.7% and detection rate of 97% and
well reduced false alarm rate of 1.25%.

6. Conclusions

 An effective intrusion detection system was developed using the stacked autoencoder hoeffding
tree technique for classification and the Darwinian particle swarm optimization method for feature
selection. Using DPSO feature selection, the optimal subset of features contributing to intrusions are
selected from the given intrusion dataset. The training and testing of data are given to our proposed
classification technique to classify the network attacks. The main goal of the stacked autoencoder
hoeffding tree technique is to increase the accuracy and reduce the false alarm rate. Moreover, we
evaluated our proposed work on the NSL_KDD intrusion dataset. The dataset is streamed in a Matlab
environment. Our proposed technique is applied and measures the classification performance using
accuracy, specificity, sensitivity, detection rate, false alarm rate, false-negative rate. This classification
performance is compared with other states of the art methods. The main challenge with the current
intrusion detection is that it cannot detect the new unknown attacks. We proved that our proposed
technique shows a robust significant amount of performance improvement in detection accuracy, thus
reducing the false alarm rate to a greater extent. The supervised learning technique mainly depends on
the predefined attack signatures that make new attacks goes undetected. The proposed stacked
autoencoder hoeffding tree detects known attacks and, at the same time, detects unknown attacks to a
greater extent. Results are compared with the state-of-art techniques and found that the SAE-HT
technique gives higher accuracy of 97.7%, which increases by 8, 12.9, 12.6, 14.4%, 1.72, 12.47, 11.68,
10.78, 9.72, 16.7, 15.47, 9.96, 4.7, 5.55, 3.63, 3.64, 5.7 and 1.98% when compared to VLSTM,
AdaBoost, LSTM, CNN LSTM, SAE-SVM, SAE, SAAE, DAE, Cont AE, CAE, SAE-DNN, SAAE-
DNN, Hoeffding tree, Restricted hoeffding tree, AUE2 with buffer, AUE2 without buffer, HAT + DDM
+ ADWIN, Hierarchical Clustering and SVM and higher detection rate of 97%. Thus, reducing the
false alarm rate to 1.25%. Further work can incorporate a study on a more effective method to improve
the IDS. For the attack with fewer samples, an adversarial learning method can be used to create similar
attacks, thus increasing the diversity of training examples that improve the detection accuracy.

Acknowledgments

 This Publication is an outcome of the R&D work under MeitY’s Visvesvaraya PhD Scheme,
Government of India, implemented by Digital India Corporation.

Mathematical Biosciences and Engineering Volume 18, Issue 6, 8024–8044.
8042

Conflict of interest

 The authors declare that they have no known competing financial interests or personal
relationships that could have appeared to influence the work reported in this paper.

Funding

 This research was supported by the Faculty of Management of Comenius University in Bratislava,
Slovakia.

References

1. S. Bhattacharya, S. R. Krishnan, P. K. R. Maddikunta, R. Kaluri, S. Singh, T. R. Gadekallu, et al.,
 A novel PCA-firefly based XGBoost classification model for intrusion detection in networks
 using GPU, Electronics, 9 (2020), 219.
2. I. Syarif, A. Prugel-Bennett, G. Wills, Unsupervised clustering approach for network anomaly
 detection, in International Conference on Networked Digital Technologies, (2012), 135–145.
3. P. Mishra, V. Varadharajan, U. Tupakula, E. S. Pilli, A detailed investigation and analysis of using
 machine learning techniques for intrusion detection, IEEE Commun. Surv. Tutorials, 21 (2018),
 686–728.
4. K. S. Desale, C. N. Kumathekar, A. P. Chavan, Efficient intrusion detection system using stream
 data mining classification technique, in 2015 International Conference on Computing
 Communication Control and Automation, (2015), 469–473.
5. P. K. Srimani, M. M. Patil, Mining data streams with concept drift in massive online analysis
 frame work, WSEAS Trans. Comput., 6 (2016), 133–142.
6. M. Kumar, M. Hanumanthappa, Intrusion detection system using stream data mining and drift
 detection method, in 2013 Fourth International Conference on Computing, Communications and
 Networking Technologies (ICCCNT), 2013.
7. X. Li, P. Yi, W. Wei, Y. Jiang, L. Tian, LNNLS-KH: a feature selection method for network
 intrusion detection, Secur. Commun. Networks Hindawi, 2021 (2021), 1–22.
8. X. Zhou, Y. Hu, W. Liang, J. Ma, Q. Jin, Variational LSTM enhanced anomaly detection for
 industrial big data, IEEE Trans. Ind. Inf., 17 (2021), 3469–3477.
9. T. H. Hai, N. T. Khiem, Architecture for IDS log processing using spark streaming, in
 International Conference on Electrical, Communication, and Computer Engineering (ICECCE),
 (2020), 1–5.
10. S. N. Mighan, M. Kahani, A novel scalable intrusion detection system based on deep learning, Int.
 J. Inf. Secur., 20 (2020), 387–403.
11. T. Vaiyapuri, A. Binbusayyis, Application of deep autoencoder as an one-class classifier for
 unsupervised network intrusion detection: a comparative evaluation, PeerJ Comput. Sci., 6 (2020),
 1–26.
12. C. Tang, N. Luktarhan, Y. Zhao, SAAE-DNN: Deep learning method on intrusion detection,
 Symmetry, 12 (2020), 1695.

Mathematical Biosciences and Engineering Volume 18, Issue 6, 8024–8044.
8043

13. A. D. Jadhav, V. Pellakuri, Intrusion detection system using machine learning techniques for
 increasing accuracy and distributed & parallel approach for increasing efficiency, in 5th
 International Conference on Computing, Communication, Control and Automation (lCCUBEA),
 (2019), 1–4.
14. A. Muallem, S. Shetty, J. W. Pan, J. Zhao, B. Biswal, Hoeffding tree algorithms for anomaly
 detection in streaming datasets: A survey, J. Inf. Secur., 8 (2017), 339–361.
15. G. Kim, S. Lee, S. Kim, A novel hybrid intrusion detection method integrating anomaly detection
 with misuse detection, Exp. Syst. Appl., 41 (2014), 1690–1700.
16. H. K. Sok, M. S. Chowdhury, M. P. Ooi, Y. C. Kuang, S. Demidenko, Using the ADTree for
 feature reduction through knowledge discovery, in 2013 IEEE International Instrumentation and
 Measurement Technology Conference (I2MTC), (2013), 1040–1044.
17. S. J. Horng, M. Y. Su, Y. H. Chen, T. W. Kao, R. J. Chen, J. L. Lai, et al., A novel intrusion
 detection system based on hierarchical clustering and support vector machines, Exp. Sys. Appl.,
 38 (2011), 306–313.
18. M. Tavallaee, E. Bagheri, W. Lu, A. A. Ghorbani, A detailed analysis of the KDD CUP 99 data
 set, IEEE Symp. Comput. Intell. Secu. Def. Appli., 2009 (2009), 1–6.
19. E. Jackson, R. Agrawal, Performance evaluation of different feature encoding schemes on
 cybersecurity logs, in 2019 SoutheastCon, (2019), 1–9.
20. K. Wankhade, S. Patka, R. Thool, An efficient approach for intrusion detection using data mining
 methods, in International Conference on Advances in Computing, Communications and
 Informatics (ICACCI), (2013), 1615–1618.
21. J. Tillett, R. Rao, F. Sahin, Cluster-head identification in ad hoc sensor networks using particle
 swarm optimization, in IEEE International Conference on Personal Wireless Communications,
 (2002), 201–205.
22. A. Ates, B. B. Alagoz, G. Kavuran, C. Yeroglu, Implementation of fractional order filters
 discretized by modified Fractional Order Darwinian Particle Swarm Optimization, Measurement,
 107 (2017), 153–164.
23. B. I. Seraphim, E. Poovammal, Adversarial attack by inducing drift in streaming data, Wireless
 Pers. Commun., 2021 (2021), 1–25.
24. G. Liu, H. Bao, B. Han, A stacked autoencoder-based deep neural network for achieving gearbox
 fault diagnosis, Math. Probl. Eng. Hindawi, 2018 (2018).
25. M. R. Mohamed, A. A. Nasr, I. F. Tarrad, S. R. Abdulmageed, Exploiting incremental classifiers
 for the training of an adaptive intrusion detection model, Int. J. Netw. Secur., 21 (2019), 275–289.
26. M. S. Pervez, D. M. Farid, Feature selection and intrusion classification in NSL-KDD cup 99
 dataset employing SVMs, in The 8th International Conference on Software, Knowledge,
 Information Management and Applications (SKIMA 2014), (2014), 1–6.
27. S. Krishnaveni, S. Sivamohan, S. S. Sridhar, S. Prabakaran, Efficient feature selection and
 classification through ensemble method for network intrusion detection on cloud computing,
 Cluster Comput., 2021 (2021), 1–19.
28. S. P. RM, P. K. R. Maddikunta, M. Parimala, S. Koppu, T. R. Gadekallu, C. L. Chowdhary, et al.,
 An effective feature engineering for DNN using hybrid PCA-GWO for intrusion detection in
 IoMT architecture, Comput. Commun., 160 (2020), 139–149.

Mathematical Biosciences and Engineering Volume 18, Issue 6, 8024–8044.
8044

29. S. M. Alqahtani, R. John, A comparative analysis of different classification techniques for cloud
 intrusion detection systems alerts and fuzzy classifiers, in 2017 Computing Conference, (2017),
 406–415.
30. A. Rehman, S. U. Rehman, M. Khan, M. Alazab, T. R. Gadekallu, CANintelliIDS: detecting in-
 vehicle intrusion attacks on a controller area network using CNN and attention-based GRU, IEEE
 Trans. Network Sci. Eng., 2021 (2021).

 ©2021 the Author(s), licensee AIMS Press. This is an open access
 article distributed under the terms of the Creative Commons
 Attribution License (http://creativecommons.org/licenses/by/4.0)

Mathematical Biosciences and Engineering Volume 18, Issue 6, 8024–8044.
You can also read