Snow Cover and Climate Change in the Cairngorms National Park: Summary Assessment
←
→
Page content transcription
If your browser does not render page correctly, please read the page content below
Snow Cover and Climate Change in the Cairngorms
National Park: Summary Assessment
Mike Rivington, Mike Spencer, Alessandro Gimona, Rebekka Artz, Douglas Wardell-Johnson and Jonathan Ball.
James Hutton Institute, November 2019

Executive summary
Snow cover is a key aspect of what defines the character of the Cairngorms National Park (CNP). It underpins
the ecology, hydrology and economy, which are all dependent on how much snow falls, and where and how
long it stays.
Modelling snow cover based on climate projections is challenging. We compared historic temperature and
precipitation data (1918-2018) with observed snow cover days (1969-2005) to identify how temperature
affects snow days. We then modelled future snow cover days using the best available data generated by the UK
Met Office to identify some possible trends for the Cairngorms National Park.
There is need for caution in interpreting the future projection results:
    1. The historical snow cover data is incomplete, and we have used single locations for weather and snow
       elevation analyses
    2. The modelling of future climate consequences on snow cover is based on the projections generated by
       the Met Office as part of UKCP 18. Scenarios have been generated for different temperature increases,
       but only the high emissions scenario (projecting warming of 8.5 W m-2, equivalent to a global
       temperature increase of 2.6 (2.0 to 3.2)°C by 2046-2065 and 4.3 (3.2 to 5.4)°C by 2081-2100 relative to
       1850-1900 temperatures) is currently available for analysis of daily data. More detailed analysis is
       required as further datasets are released. Representative Concentration Pathway (RCP) scenarios with
       lower climate forcing (RCP1.9. 2.6, 4.5 and 6.0), represent lower rates of warming and would be
       expected to have lower impacts on snow cover.
Bearing this in mind, our initial results show a reduction in snow cover as the observed warming trend
continues and accelerates. Successful global efforts to reduce emissions may moderate this impact, whilst even
higher emissions rates (e.g. due to ecosystem carbon releases) may further increase impacts.

Key findings
1) There has been an overall decline in observed snow cover in the Cairngorms National Park (1969-2005).
   This trend conforms to those seen across other mountain areas and the Arctic and is in keeping with the
   observed global warming trend. However, some variability can also be seen with significant snow events
   and a possible increase in snow cover in the last decade. The overall declining snow cover trend is
   projected to continue and accelerate in the future.
2) A warming trend has been observed at meteorological stations in the CNP since 1918 for both maximum
   and minimum temperature. There is variation between months:

ClimateXChange is Scotland’s Centre of Expertise on Climate Change, providing independent advice, research
and analysis to support the Scottish Government as it develops and implements policies on adapting to the
changing climate and the transition to a low carbon society
www.climatexchange.org.uk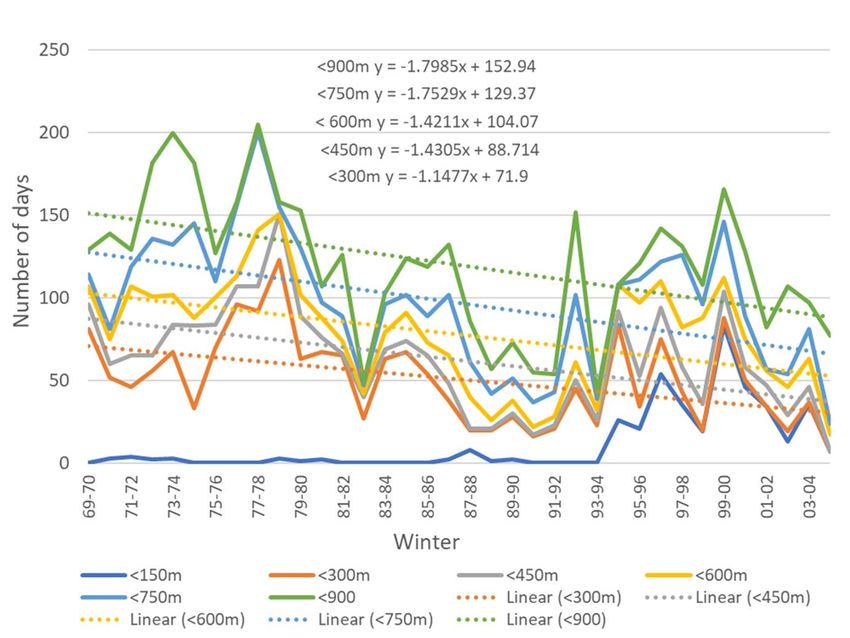
Snow Cover and Climate Change in the Cairngorms National Park: Summary Assessment

    a) October and November show approximately 1.6°C + maximum temperature and 0.8 °C minimum
       temperature rises. This may influence the likelihood of when seasonal snow forms and cover becomes
       established.
    b) March, April and May show a warming trend indicating likelihood of earlier onset of snow melting.
    c) Precipitation (measured as rainfall and snow or ice) per month is variable between years with no
       strong trend observed.
3) There is a clear observed decrease in the number of days of snow cover at all elevation levels over the 35
   winters between 1969/70 and 2004/05, with higher elevations having a larger proportional decrease.
4) In the near-term, our estimates indicate the potential for a continuation of snow cover at the current range
   of variation, but with a substantial decline from the 2040s. These findings are in line with results from the
   UK Meteorological Office and Inter-governmental Panel on Climate Change (IPCC 2019). There will be some
   years in the future when the weather conditions create snow and enable lying snow that may be
   comparable to the past, but such occasions will become fewer. This applies to all elevations, but with larger
   proportional decreases at higher levels. Results indicate a likelihood of some years with very little or no
   snow by 2080.
5) Snow is complex to model and predict, especially in temperate regions like Scotland with its strong
   maritime (Atlantic Ocean) climatic influence. Changes in seasonal variability will depend on how air flow
   over the UK (e.g. location of the jet stream) is affected by global scale ocean-atmosphere circulation
   processes. Our findings are a good indicator of future trends, but there remain substantial uncertainties
   and caveats that need to be considered in making a more detailed assessment of future snow cover.
6) The projected decreases in the spatial coverage and temporal duration of snow will have important
   consequences, for example on the ecology and hydrology of the Cairngorms National Park and surrounding
   areas. This may include changes to, for example, species composition and distribution, and thus
   biodiversity; the amount and temperature of groundwater, streams and rivers and flood risk due to rapid
   melting.

www.climatexchange.org.uk                                                                P a g e |2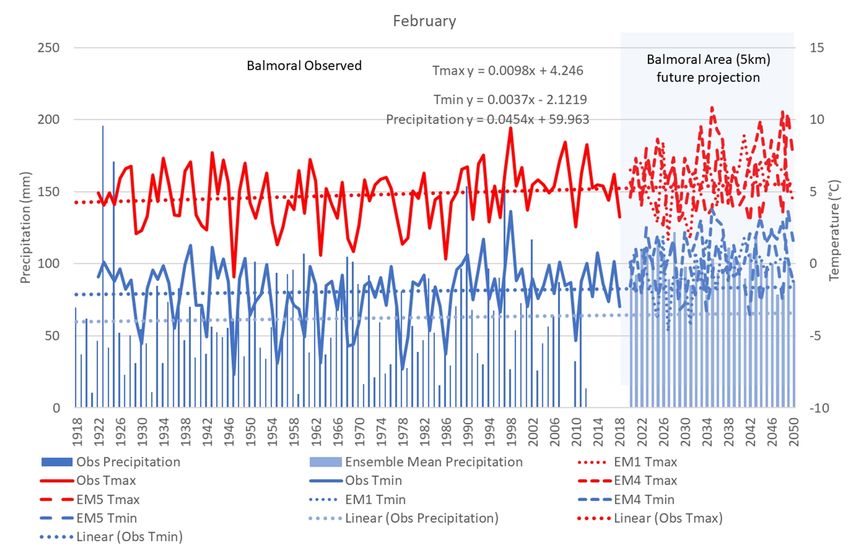
Snow Cover and Climate Change in the Cairngorms National Park: Summary Assessment

Contents
Executive summary...................................................................................................................................................1
Key findings ..............................................................................................................................................................1
Contents ...................................................................................................................................................................3
Introduction ..............................................................................................................................................................4
1.1      Analysing snow cover                                                                                                                            4
1.2      Previous studies of snow cover                                                                                                                  4
Analysis of past trends..............................................................................................................................................5
1.3      Temperature and precipitation                                                                                                                   5
1.4      Snow cover days                                                                                                                                 8
1.5      Appraisal of historical analysis                                                                                                                9
Future projections ................................................................................................................................................. 10
1.6      Temperature                                                                                                                                   10
1.7      Snow modelling                                                                                                                                11
Caveats and uncertainties ..................................................................................................................................... 15
Possible implications ............................................................................................................................................. 16
Conclusions ............................................................................................................................................................ 17
Next Steps .............................................................................................................................................................. 18
Acknowledgements ............................................................................................................................................... 19
Appendix A: Method.............................................................................................................................................. 19
Appendix B Historical climatic trends and future projections – Balmoral ............................................................ 21
Appendix C: Historical climatic trends and Whitehillocks snow cover and weather data comparison ................ 28
References ............................................................................................................................................................. 30

www.climatexchange.org.uk                                                                                                                P a g e |3
Snow Cover and Climate Change in the Cairngorms National Park: Summary Assessment

Introduction
1.1   Analysing snow cover
The spatial extent of snow cover, here defined as its duration (number of days per year snow is on the ground)
and its quantity (depth) is an essential part of the ecology and hydrology in the Cairngorms National Park
(CNP). It also influences greenhouse gas emissions and sink potential from peatlands. Whilst there has been
large inter-annual variation in the past, there are substantial concerns that, as a result of climate change, there
may be significant decreases in snow cover, quantity and spatial extent, in the future.
This initial scoping study explores the likelihood of these decreases in snow cover in the future. It does not
address snow depth. We first assessed past trends using observed weather for one site at Braemar and
snowline elevation data for a site in the eastern CNP. The aim was to identify possible correlations between
observed weather and snow cover trends. We then used climate model projections from the Met Office in a
snow model to estimate future snow cover responses.
We used the UKCP18 daily data projections for the RCP8.5 (current emissions rate – See Appendix A methods
Text Box 2 for further details). These are the only daily data released (the snow model used here needs daily
data), hence this is just one possible future scenario. Snow quantity is also important, but it is impossible to
model it effectively at this scale, and it is not considered here. There are many weather factors that determine
the creation of snow, how long it snows for and what happens to it once on the ground (e.g. movement by
wind). These are beyond the scope of this summary study and there are many uncertainties associated with
projecting future conditions (see section Caveats and Uncertainties).

1.2   Previous studies of snow cover
Snowfall varies considerably in Scotland and correlates with altitude. Both national and local scale climatic
factors are involved in the observed spatial and temporal patterns. Snow cover is highly sensitive to climatic
variations, globally (IPCC, Box 1), regionally (Brown 2019) and at specific locations (Trivedi at al 2007).
  Global Context
       •   Over the last decades, global warming has led to widespread shrinking of the cryosphere, with mass
           loss from ice sheets and glaciers (very high confidence), reductions in snow cover (high confidence)
           and Arctic sea ice extent and thickness (very high confidence), and increased permafrost
           temperature (very high confidence).
       •   Ice sheets and glaciers worldwide have lost mass (very high confidence).
       •   Arctic June snow cover extent on land declined by 13.4 ± 5.4% per decade from 1967 to 2018, a total
           loss of approximately 2.5 million km2, predominantly due to surface air temperature increase (high
           confidence).
       •   Permafrost temperatures have increased to record high levels (1980s-present) (very high
           confidence) including the recent increase by 0.29°C ± 0.12°C from 2007 to 2016 averaged across
           polar and high mountain regions globally.
       •   Between 1979 - 2018, Arctic sea ice extent has very likely decreased for all months of the year.
  Source: Intergovernmental Panel on Climate Change Special Report: The Ocean and Cryosphere in a
  Changing Climate. 24th September 2019.
Box 1. Global warming influences formation and longevity of global snow and ice-containing features.

www.climatexchange.org.uk                                                                  P a g e |4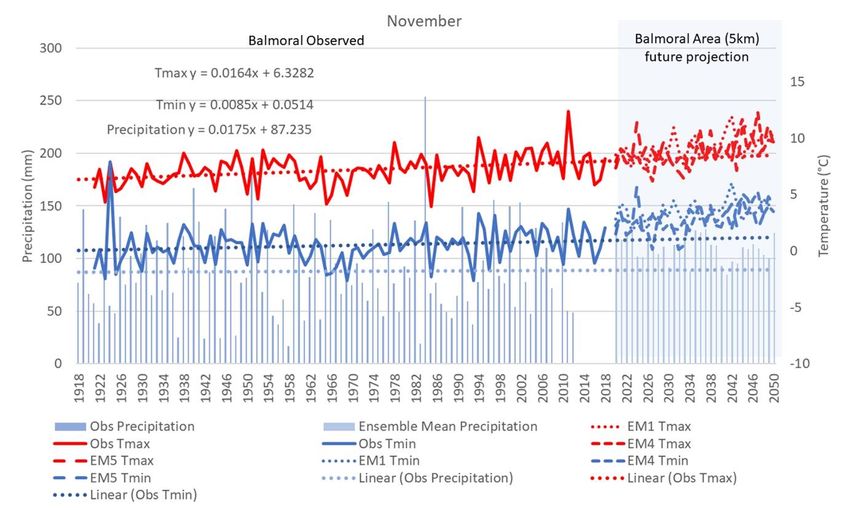
Snow Cover and Climate Change in the Cairngorms National Park: Summary Assessment

The UKCP18 Headline Findings states: By the end of the 21 Century, lying snow decreases by almost 100% over
much of the UK, although smaller decreases are seen over mountainous regions in the north and west (UKCP18
2019a).
In this study we use a well-established assumption that snow cover is more correlated to temperature than
precipitation, based on good evidence indicating temperature is a primary influencing factor as it influences
formation and controls depth and duration (Harrison et al 2001a, Beniston et al 2003, Trivedi et al 2007). A
study at the Ben Lawers National Nature Reserve found that snow cover duration at mid to upper altitudes
(600–900 m) responds most strongly to variation in mean daily temperature: a 1 °C rise in temperature can
correspond to a 15-day reduction in snow cover at 130 m and a 33-day reduction at 750 m (Trivedi et al 2007).
In the Arctic snow-cover extent has decreased by approximately 20% per decade during 1979–2013 (Blunden
and Arndt, 2014) whilst the timing of snowmelt onset has advanced 2 weeks on average across the Arctic area
since the start of the satellite era in 1979 (Tedesco et al., 2009).
Conversely, some location specific evidence for the western Cairngorms suggests an increased period of snow
duration associated with a later melting date, rather than onset of winter snow (Andrews et al 2016). Satellite
data shows that Scotland has areas with characteristic combinations of snowfall and melting cycles (Poggio and
Gimona, 2015). Some of these areas are characterised by large variability in the number of days of snow cover
(e.g. repeated accumulation followed by melting) especially at lower altitudes, while at higher altitudes the
pattern is more stable.
Such variability makes it difficult to interpret metrics such as the average snowline. A better metric is therefore
the number of days of snow cover during a given period (e.g. October to May), which result in a correlation
between snow depth and number of snow laying days. For this reason, in this study snow cover refers to the
number of days of lying snow. Note that the number of days of snow cover does not indicate snow persistence,
i.e. 50 days of snow cover in a year may not be 50 days of continuous cover.

Analysis of past trends
The analysis was split into two sections: firstly we assessed past trends examining data from a relevant
meteorological station (Balmoral); for future projections we then ran a model predicting snow cover across the
whole Cairngorm National Park. Further details of our approach can be found in Appendix A.

1.3   Temperature and precipitation
We examined daily weather data from Balmoral (as it has a long data record,1918-2018), to assess evidence of
the past trends for maximum and minimum air temperature and precipitation. These are shown as monthly
averages in Table 1. This site was chosen due to the length and quality of its climate record and location near
the centre of the CNP.
We analysed maximum and minimum air temperature to assess the change in range and potential
consequences of differences in rates of change and levels of variation between them. Temperature is seen as a
better indicator of snow responses than precipitation.
Table 1 (and Figures 7-12 in Appendix A) show there has been a substantial warming trend per month since
1918. The rate of increase is greater for maximum temperature (the winter average is 1.30°C) than for
minimum (average of 0.71°C). However, December minimum temperature has decreased by c. 0.34°C.
Substantial increases in maximum temperature has occurred in April (1.90°C), indicating an increase in melting
effects on snow. However average minimum temperatures have not increase as much as the maximum
temperatures. In respect of snow formation and duration on the ground, the lowest minimum temperatures
will have a key influence.

www.climatexchange.org.uk                                                                  P a g e |5
Snow Cover and Climate Change in the Cairngorms National Park: Summary Assessment

www.climatexchange.org.uk                                                           P a g e |6
Snow Cover and Climate Change in the Cairngorms National Park: Summary Assessment

                      Precipitation (mm)    Maximum Temperature (°C) Minimum Temperature (°C)

   November           ↑ 17                  ↑ 1.64                         ↑ 0.85

   December           ↓ -111                ↑ 0.64                         ↓ -0.34

   January            ↓ -24                 ↑ 1.34                         ↑ 1.20

   February           ↑ 45                  ↑ 0.98                         ↑ 0.37

   March              ↑ 47                  ↑ 1.23                         ↑ 1.28

   April              ↑ 33                  ↑ 1.90                         ↑ 0.82

   May                ↓ -117                ↑ 1.34                         ↑ 0.81

Table 1: Changes in monthly precipitation and temperature across all years between 1918 and 2018 for
Balmoral
The daily temperature range between maximum and minimum will also have an influence on snow creation
conditions and duration once on the ground. Temperatures below freezing will help prolong snow duration but
increasing number of days above will shorten it.
Precipitation has seen decreases in December, January and May, but increases in the other winter months; yet
it remains highly variable over time and between years. These changes are in line with global trends but may
be slightly lower than those seen for higher latitudes (which is probably due to the strong climatic effect of the
Gulf stream on Scotland’s climate).
Figure 3 shows that at Balmoral (November example), there has also been an increased warming of the highest
maximum and lowest minimum temperatures observed within the month. This tells us that for November:
    •      The severity of cold below freezing is decreasing: the lowest minimum temperatures have reduced
           (warmed to be closer to 0) by c. 2°C. Whilst these are still substantially below freezing, the trend
           indicates that the degree of freezing has reduced.
    •      The warmest minimum temperature (Max Tmin) has increased by c. 0.6°C.
    •      The lowest maximum temperature has not increased as much, c. 0.5°C.
    •      The warmest maximum temperature has increased by c. 2.0°C
These changes imply that there was less low temperature to cool the ground and help consolidate any existing
fallen snow.

www.climatexchange.org.uk                                                                   P a g e |7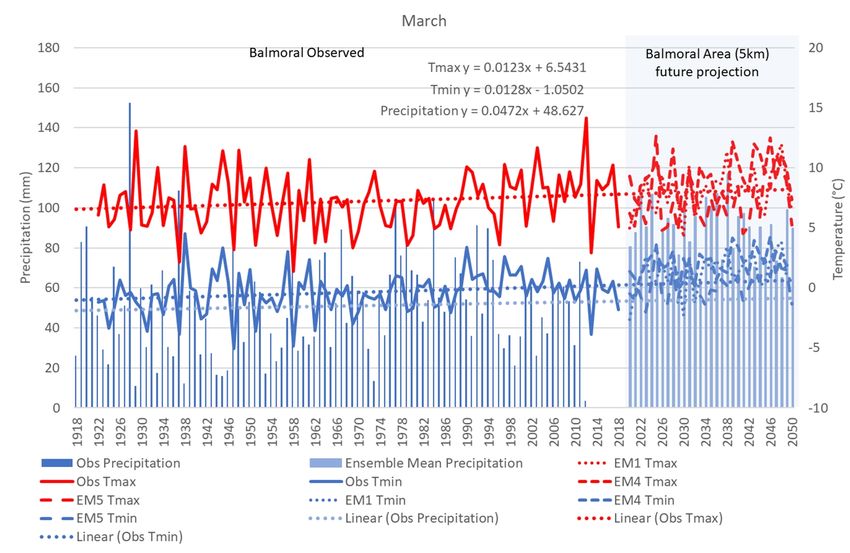
Snow Cover and Climate Change in the Cairngorms National Park: Summary Assessment

Figure 1: Changes in Balmoral’s highest and lowest values of daily maximum and minimum air
temperature and estimated trends for November.

1.4   Snow cover days
For snow cover duration, the Snow Survey of Great Britain (SSGB) site of Whitehillocks was used, as it has the
longest continuous temporal coverage for the CNP. The distance to Balmoral is 24km. The observation point of
Whitehillocks is a similar elevation (c. 250m) but the hills assessed for snow cover exceed 900m.
There has been substantial year-to-year variability in snow cover duration but a clear declining trend in the
number of days per year with snow cover at a range of elevations between the winters of 1969/70 to 2004/5 at
Whitehillocks (Figure 2). The mean decrease across all elevations was 52.8 days. The decrease in snow cover
days per year was steeper at higher altitudes.

www.climatexchange.org.uk                                                               P a g e |8
Snow Cover and Climate Change in the Cairngorms National Park: Summary Assessment

Figure 2: Number of days per year of snow cover at or below specific elevations and estimated trends
for Whitehillocks between 1969 and 2005.

1.5   Appraisal of historical analysis
Establishing a correlation between observed weather and snow elevation data is problematic. Matching the
two data types for one location over a sufficient length of time coverage was not possible. Here we have
analysed weather data from Balmoral (1918-2018) and snow elevation data from Whitehillocks (1969-2005),
which are 24km apart. Other locations had observed weather and snow elevation data, but for much shorter
time periods. Our assessment of data utility was that Balmoral provided good evidence of long-term climate
trends and overlapped well with the temporal records of snow elevation from Whitehillocks.
The individual location analyses are informative but there is a large assumption that the increased warming at
Balmoral is correlated to the change in snowline elevation at Whitehillocks. The mountains assessed for snow
elevation as part of the SSGB from the Whitehillocks observation point those closer to Balmoral. Our
interpretation is that whilst not ideal, the results gained from the comparison of the two locations are
indicative of overall trends.

www.climatexchange.org.uk                                                               P a g e |9
Snow Cover and Climate Change in the Cairngorms National Park: Summary Assessment

Future projections
1.6   Temperature
The temperature increases per month seen in Table 1 are projected to continue per month through to 2050
according to the UKCP18 climate projection data for the RCP8.5 scenario. As such the results presented here
are for one possible future, based on our current global rate which puts us on a trajectory towards the
higher temperature rise range (c. 3 to 4°C). Figure 3 shows warming trends at Balmoral since 1918 for both
monthly mean maximum and minimum temperature and how these are projected to continue through to 2050
(see Figures 7-12 in Appendix A for other winter months). Note: future temperature projections are shown for
three climate model simulations from the 12 available from the UKC18 Figure 3 also shows the observed and
monthly precipitation total (mm) and the future mean from all 12 UKCP18 climate model projections.

Figure 3: Weather data trends for November, mean monthly maximum and minimum temperature
and total precipitation for Balmoral 1918-2018 and estimated future 2020-2050 projection (RCP8.5)
Data presented in Figure 3 shows that there is an observed warming trend for all months, except minimum
temperature in December (see Appendix B for all other winter months). These are likely to continue in the
future. Precipitation however has remained highly variable but with no clear observed trend across all winter
months.
The estimated linear trend lines (dotted lines in Figure 3) have been extended to 2050 to show how the
observed trends relate to the future projections. In the November example above the maximum temperature
trend matches well to the climate modelled estimates. Here only three climate model estimates are shown
from the available 12, but these are representative of the range.
The projected future minimum temperature is greater than indicated by the observed trend. This may be due
to some climate model error, but research indicates that daily minimum temperature has and will continue to
increase more rapidly than maximum temperature in many parts of the world (e.g. IPCC 2014). For the other
winter months, the climate model estimates fit well to the extended observed trend lines.

www.climatexchange.org.uk                                                               P a g e | 10
Snow Cover and Climate Change in the Cairngorms National Park: Summary Assessment
These results imply an increasing probability of less favourable snow forming conditions and more rapid rates
of snow melting.
1.7 Snow modelling
To estimate future snow cover we ran a snow model over all the 5 km grid cells covering the National Park (226
cells in total, Figure 4). Input forecast data to the model were the UKCP18 climate projections (see Appendix A).
The model estimates snow cover based on daily temperature and precipitation. When temperature is below a
threshold, precipitation accumulates as snow and when temperature rises above the threshold the snow melts.
For more information on the model and calibration see Spencer 2016a.
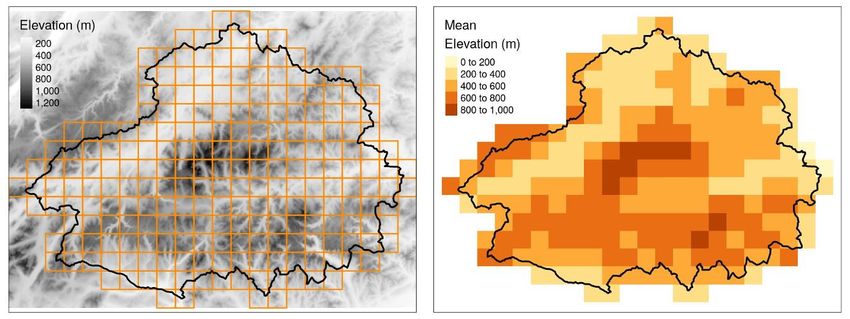
Figure 4: Map of Cairngorm National Park and model grid cells. Elevation is shown on a 50 m (left) and
5 km (right) grid. Contains Ordnance Survey data © Crown copyright and database right 2019
Output from each 5 km grid cell were collated based on the mean elevation of the cell. Elevations were
grouped into four bands, allowing us to compare what may happen to snow cover at different heights in the
national park. The results of this exercise are in Figure 5, and can be compared to the ski centre elevation
ranges:
• Cairngorm: 630 to 1150m
• Glenshee: 650 to 920m
• Lecht: 580 to 780m
Note the bulk of ski activity lies in the 600 - 800 m elevation range. The trend for the number of days of snow
cover below 400m and 400-600m elevation ranges simulated (Figure 5 1) all approach zero by 2080, but with
large variations between climate model ensemble members and years. At elevation ranges 600-800m and over
800m, the trend indicates a reduction by more than a half of the current number of days with snow cover, with
some climate projections indicating potential for very few days with snow cover even at higher elevations.
There is a great deal of uncertainty in snow modelling, but our results project a dramatic decline in the
duration of annual snow cover. Trends appear to remain consistent until ~ 2030, after which we estimate a
steeper decline in snow cover duration. This change is likely due to a threshold temperature being exceeded,
causing less snow to accumulate or persist. These declines are most noticeable for the highest elevations in the
national park, with elevations above 800 m estimated to have 30 – 40 days of snow cover on average each year
by 2080.
1
Estimated using a degree-day snow model with observed data from UKCP09 (1960 -2010) and 12 UKCP18 climate
projections (2020-2080).
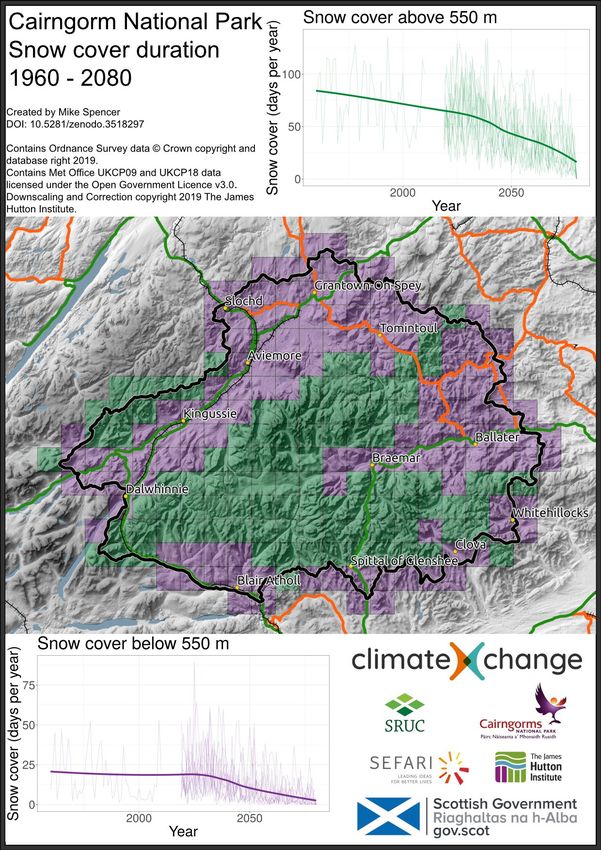
www.climatexchange.org.uk P a g e | 11Snow Cover and Climate Change in the Cairngorms National Park: Summary Assessment Figure 5: Annual snow cover (days per year) at four elevation ranges for the Cairngorms National Park. Light grey lines show individual model runs with the heavy black line indicating the smoothed average of these. www.climatexchange.org.uk P a g e | 12
Snow Cover and Climate Change in the Cairngorms National Park: Summary Assessment

Figure 6: Summary of the modelled spatial changes in snow cover 1960-2080. Locations above 550 m
(green) may have more severe decline in days with snow cover than areas at lower altitude (purple).
The future projections in Figure 5 are multiple snow model simulation results gained by using the 12 climate
model simulations available from the UKCP18 for the RCP8.5 emissions. This means the snow model was run

www.climatexchange.org.uk                                                               P a g e | 13
Snow Cover and Climate Change in the Cairngorms National Park: Summary Assessment

with 12 different data sets produced from 12 different runs of the Regional Climate Model used by the UK Met
Office. This helps capture some of the uncertainty in the climate modelling and enables us to present the
variability in likely scenarios. The average across this range (the heavy black line in Figure 5) indicates the
overall projected trend.
The results show that snow cover (days per year) may continue to be similar to the past for the next 1-2
decades but will decline substantially afterwards. This applies to all elevations, but with larger proportional
decreases at higher levels. These declines may be associated with passing a temperature threshold where
precipitation no longer falls as snow and any lying snow melts sooner. An overview timeline is approximately:
    •   2020-2030: similar amounts and level of annual variation of snow cover to the past at all elevations.
        Some years likely to be similar or even possibly greater snow cover than in the past.
    •   2030-2040: declining snow cover but with similar levels of annual variation to the past at all elevations.
        Some years likely to be similar to the past but not achieving the larger quantities or spatial coverage of
        snow cover, especially at the low- to mid-range elevations.
    •   2040-2050: rate of decline increases at all elevations to approximately half of historic long-term
        average snow cover. Average amounts of snow cover similar to the lowest levels seen in the past.
    •   2050-2080: continued increasing rate of decline particularly at higher elevations, approaching
Snow Cover and Climate Change in the Cairngorms National Park: Summary Assessment
Our results are consistent with other studies. Using a low emissions scenario, Trevidi et al (2007) modelled
projections of a 93% reduction in snow cover at 130m, 43% at 600m and 21% at 1060m. For a higher emissions
scenario they projected 100%, 68% and 32% for these elevations, respectively. The UKCP18 report a decrease
in both falling and lying snow across the whole UK for the period 2061-2080 (using the same climate model
data as our study). This decrease is smaller for the Scottish mountains, but still in the order of 20-60%
(snowfall) and 60-100% (lying snow) (UKCP18 2019b).
This study has used climate projection data derived from global and regional climate models (HadGEM3 and
HadRM3) using a high level of radiative forcing 2 (Representative Concentration Pathway 8.5) associated with
the current trajectory of greenhouse gas emissions. Thus, if mitigation efforts are successful in reducing
emissions, then the longer-term projections of snow cover decline may be less.
However, there will be some locked in climate change even if emissions ceased now, that will lead to further
warming for the next 3-4 decades.
Caveats and uncertainties
So far, the only daily data available from the Met Office is for the high emissions scenario. This means that we
cannot compare different emissions scenarios in our modelling.
The formation of snow, its Snow formation, quantity formed and duration on the ground is complex to assess
based on observations, and model under future climate conditions, so we need to use some important
assumptions. For our study the primary assumption that an increase in temperature has a negative effect on
snow cover. We have provided evidence here to support this assumption. There are also large uncertainties
associated with our understanding of emissions scenarios and consequences on climatic processes at the global
scale. These uncertainties, in relation to this study on snow cover, can be grouped as:
• The North Atlantic Oscillation (variations in the air pressure differences between Iceland low and
Azores high pressure systems) has a strong influence on Scottish (Spencer and Essery 2016) and UK
(Brown 2019) snow forming weather conditions. This is influenced by the speed and position of the jet
stream, which is influenced by the temperature differential between equatorial and high latitudes.
High rates of Arctic warming are leading to changes in the jet stream that are difficult to represent
within climate models. Similarly, other oceanic and atmospheric oscillations, such as El Nino events,
are also changing, influencing the UK weather.
• Study data utility: our study has used a limited range of observed data to assess past trends in relation
to historical snow cover. Due to time constraints we were not able to compile more location specific
(e.g. ski resort) data and undertake detailed weather-snow cover relationship analyses. We were
unable to utilise satellite data effectively, primarily due to limitations caused by cloud cover obscuring
snow ground cover.
• We have not included indirect influences of global warming i.e. changes in freeze-thaw regimes that
determine stability and longevity of snow pack during its formation. The resilience of snow to melting
varies depending on its structure (crystal size, shape and adherence to others) which is determined by
the patterns of warming and freezing.
• We have not considered snow cover influences beyond temperature e.g. snow distribution by wind,
localised topographic factors affecting accumulation etc.
2
Radiative forcing is a measure of the influence a factor has in altering the balance of incoming and outgoing energy in the
Earth-atmosphere system and is an index of the importance of the factor as a potential climate change mechanism.
www.climatexchange.org.uk P a g e | 15Snow Cover and Climate Change in the Cairngorms National Park: Summary Assessment
• We have not explored how as temperatures rise snow cover is less likely to be persistent through a
winter due to an increase in accumulation-melt cycles which will become more common. This may
mean that in the future it is more common for snow to lie for a few days at a time.
• We have not considered the changes in temperature on snow structure (how the ice crystals change
properties such as shape and ability to adhere to each other or melt and re-freeze) and how this might
alter movement or melting.
• Localised thermodynamics may influence snow accumulation; changes from white snow (reflecting
solar radiation) to darker vegetation, soil and rock will absorb more heat energy leading to warmer
surface temperatures. This may reduction snow settling and have effects on snow remnants at tail ends
of the seasons.
• Gridded data sets for snow cover produced by the UKMO tend to under-estimate days of lying snow at
higher altitudes (Spencer et al. 2014). This emphasis the need for appropriate evaluation of data prior
to use in analyses.
• The UKCP18 snow fall and snow lying projections need to be treated with caution due to an under-
estimation by the models of snowfall and snow lying. This emphasises the need for more localised
snow specific analyses.
• A single climate model is used for projections (HadRM3), thus the projections are not sampling the full
range of possible futures. Use of EURO-CORDEX 3 multiple model projections would help resolve this.
Possible implications
The scale of projected changes in snow cover and associated climate conditions are likely to have significant
implications across the CNP, examples of which may include:
• Snow accumulation can result in reduced river flows in winter, while snow melt can increase river flow,
thus affecting the variation of flows through the year and reducing the correlation between
precipitation and flow
• Snowmelt and snow fall modify water quantity and quality with implication for both humans and other
organisms. Water quantity is affected in terms of the seasonal mean flows, high flows (and, therefore,
risk of floods) and low flow.
o Snow cover can exacerbate freshwater pollution by concentrating the deposition of
atmospheric pollutants, such as nitrates and sulphates, with a potential impact on aquatic
communities (Helliwell et al., 1998).
o A decrease in snow cover changes river temperatures which affects the spawning of important
river species like salmon (Pohle et al 2019).
• In small upland catchments periods of snow accumulation cause very low, groundwater-based, flows in
winter, and high flows in spring due to a combination of snowmelt and rainfall (Soulsby et al.1997).
This pattern would change in these areas if precipitation were to fall as rain, altering the eco-
hydrological regime. Snowmelt is necessary to sustain summer flow in these types of catchment.
• A more sudden thawing of heavy snow may be positively related to the frequency of winter floods
(Harrison et al., 2001b).
• Snow albedo and snow melt influence local climatology through energy fluxes (Pomeroy and Brun,
2001). Snow also has an insulating effect and helps dampen variations in soil temperatures, thus
3
Multi-model regional climate model simulations, see www.euro-cordex.net
www.climatexchange.org.uk P a g e | 16Snow Cover and Climate Change in the Cairngorms National Park: Summary Assessment
decreasing the erosion associated with freeze–thaw cycles, and protects vegetation from frost damage
(Oke, 1987).
• A potential concern is that as the climate warms, weakening of the insulating effect of snow might
impair the soil's ability to store carbon and nutrients, and lead to increased losses of dissolved C and
nutrients due to leaching which would result in changes in nutrient cycling and ecosystem productivity.
However, this would a risk only in areas where increased freeze-thaw cycles would also be followed by
wet springs providing the rainfall needed to leach the mobilised nutrients (Wipf et al., 2015).
• Arctic alpine plant species are adapted to the local snow cover regime and rely on it for their life cycle
(e.g. Gottfried et al., 2011). Species adapted to over-winter under such protection might therefore
suffer if the variability of snow cover increases (and in particular snow-free periods).
• The consistency with which favourable snow conditions enable winter sports may be reduced.
Conversely an earlier onset of spring and later end of autumn may present other opportunities for
outdoor activities.
Conclusions
Using observed weather and snow elevation data to asses past trends and modelled future estimates of snow
cover, we found a decrease in snow cover for the Cairngorms National Park in the past 50 years that is
projected to continue and accelerate in the future. There appears to be a correlation between decreasing snow
cover and increasing temperature. This initial study shows that for Balmoral, as an indicator location in the
centre of the CNP, maximum temperature in the winter has risen by c. 1.30°C and minimum temperature by c.
0.71°C since 1918.
In the period 1969 to 2005, observed snow cover has declined at the Whitehillocks location by approximately
53 days across all observed snowline elevations, with steepest declines at higher altitudes. We have taken this
as indicative of the general situation across the CNP, recognising there will be localised variations. However,
more recently some evidence (Andrews et al 2016 and anecdotal) indicates snow cover may have increased in
some years.
The observed warming trend seen for Balmoral, which fits within the observed increases across the UK, is
projected to continue in keeping with the wider UK (UKCP18) and global climate projections (CMIP5 4).
Our modelled future estimates indicate a potential for snow cover in the next decade to continue at a similar
quantity to the recent past, with large inter-annual variability. However, from c. 2030-2040 there is likely to be
a substantial decline in the number of days of snow cover. By c. 2050 the trend seen in the past may have
continued to the extent that the number of days of snow cover is about half of the long-term observed
average. However, variations from year to year, both observed and modelled, suggests the potential that snow
cover in some future years may be comparable with past records. The long-term trend is towards greatly
reduced snow cover with the possibility of some years of very little to no snow by 2080.
Changes in snow cover will also influence the albedo (surface reflectance) and localised thermodynamics;
changes from white snow (reflecting solar radiation) to darker vegetation, soil and rock will absorb more heat
energy leading to warmer surface temperatures. The current global rate of emissions still puts the world
on a trajectory towards the higher temperature rise range (c. 3 to 4°C). This, combined with UKCP18
projections for high resolution spatial modelling only being available for the high emissions RCP8.5
scenario, means that our results are based on an assumption of a continued future of high fossil fuel
use in the absence of globally effective climate policies.
4
https://esgf-node.llnl.gov/projects/cmip5/
www.climatexchange.org.uk P a g e | 17Snow Cover and Climate Change in the Cairngorms National Park: Summary Assessment
Next Steps
Our study has shown the potential to better understand localised variations in the relationship between the
weather and snow cover, and spatially applied models to estimate future snow cover responses. This can be
extended to include more detailed modelling and analyses to better inform decision making for future climate
conditions. There are some substantial data gaps and discontinuities of time series that restrict potential
analyses. Possible next steps could include:
• Improve our understanding of the relationship between weather and snow spatial extent, quantity and
duration. For example, by:
o Developing an integrated spatial and temporal databased through compilation of observed
data to improve understanding of past snow cover creation.
o Use the UK Met Office HadUK-Grid 5 1km interpolated estimated historical data for lying snow
(from 1971) and temperature and precipitation to better assess historical spatial and temporal
patterns.
o Identify critical temperature thresholds for snow formation and probability of these being
exceeded in the future.
o Understand better how changes in temperature affect snow structure and consequences on
duration.
o Focus on key locations: e.g. SSGB data for Achnagoichan (1959-1981) then Aviemore (1984-
2001) coupled with observed weather data. There is good scope for using the analytical tools
from this study and re-using them with other locations’ data.
o Assess the snow model spatial data for individual locations (5km grid cells), by translating the
SSGB data into an elevation grid to map snow cover elevations. This would benefit greatly from
additional snow elevation data.
o Develop a data and location referenced photo record (e.g. using citizen science) that can be
analysed and converted into snow cover by elevation data (building on the Cairngorms Scenic
Photo Posts: https://cairngorms.co.uk/photo-posts/about/).
• Assess existing research to identify what a critical temperature threshold for snow duration, including a
review of literature review and place findings in context of the CNP.
• Improve the spatial resolution of analyses by running the snow model using data from new high
resolution (2.2.km) climate projections that have improved representation of localised cloud formation
and convection processes. This will improve the resolution and enable localised assessment.
• The outcomes of the above will support better research to understand the consequences on changes in
snow cover on biodiversity and hydrology.
o Develop potential snow maps based on past records to identify likely locations where snow
may persist under future climates.
o Estimate volume of water changes as input into streams and rivers: what will be the net
difference if precipitation falls as rain rather than snow? How will the timing of runoff and
stream flow differ, and could this lead to less or more likely flood events?
• Examine current state of knowledge on decision-making for business to better understand the
potential impacts of increasing variability and declining snow cover.
5
https://www.metoffice.gov.uk/research/climate/maps-and-data/data/haduk-grid/datasets
www.climatexchange.org.uk P a g e | 18Snow Cover and Climate Change in the Cairngorms National Park: Summary Assessment
o Examine the potential impact of a changing climate on land use patterns in the CNP and
surrounding areas, and how this relates to the Net-Zero strategy.
o Improve the communication of research findings by developing visualisation methods to put
future projections into context with past conditions to help stakeholders explore adaptation
strategies.
Acknowledgements
We would like to acknowledge the UK Meteorological Office for the use of the gridded observed weather data
and the UKCP18 climate projections. The capability to use the climate data and bias correct it to higher spatial
resolution has been developed under the Scottish Government’s RESAS Strategic Research Programme 2011-
2016 and 2016-2021.
Appendix A: Method
The analysis was split into two sections:
1. to assess past trends, we examined individual meteorological station observed records;
2. for future projections we ran a model predicting snow cover across the Cairngorm National Park.
Snow data are sparse in Scotland, but temperature is recognised as a control of snow cover. We initially
assessed individual UK Meteorological Office station records and selected Balmoral to establish past trends in
temperature, precipitation6 and Whitehillocks (Snow Survey of Great Britain, SSGB 7, Spencer 2014, Spencer
2016) to assess past snowline data.
Daily observed weather data were analysed and results aggregated to monthly summaries for Balmoral (due to
its long good quality record). Assessments were made of mean monthly precipitation, maximum and minimum
temperature (Figures 7-12) and the maximum and minimum individual daily observed temperatures (Figure 1).
Future probabilities for snow cover were estimated using a spatially applied degree-day snow model (Spencer
2019). Input data used to run the snow model were taken from UKCP09 for the period 1960 to 2010 and from
UKCP18 generated from HadRM3 8 for 2020 to 2080. The original HadRM3 future projection data were
estimated at a 12km spatial resolution, but here they have been downscaled and bias corrected 9 to 5km (based
on Rivington et al 2008). The future climate projection data are for the global rate of greenhouse gas emissions
we are currently on – see text Box 2 for summary.
6
The UKMO reported accumulation of rainfall is the sum of the amount of liquid precipitation plus the liquid equivalent of
any solid precipitation (that is the liquid obtained by melting snow or ice that has fallen).
http://artefacts.ceda.ac.uk/badc_datadocs/ukmo-midas/ukmo_guide.html#5.6
7
https://www.metoffice.gov.uk/research/library-and-archive/archive-hidden-treasures/snow-survey
8
HadRM3 is the model applied to produce the UK Met Office projections
9
Bias correction is a mathematical means of downscaling a spatial dataset to a finer resolution. Without bias correction,
critical variables, e.g. temperature, would under- or overestimate the actual observed temperature at locations at the
finer resolution. Bias correction uses many types of approaches beyond the scope of this publication.
www.climatexchange.org.uk P a g e | 19Snow Cover and Climate Change in the Cairngorms National Park: Summary Assessment
Climate projections and emissions pathways:
• The climate change research community has for many years developed a range of possible future
scenarios linking economic development pathways, called Shared Socio-economic Pathways (SSPs)
and greenhouse gas emissions pathways and their effect on radiative forcing (the amount of
‘greenhouse effect’) called Representative Concentration Pathways (RCPs). See Riahi et al 2017.
• There are 5 RCPs for which there are climate projections, ranging from RCP2.6 (low rates of
emissions) to RCP8.5 (high rates). Only the RCP 8.5 data is available at the correct resolution for
this work.
• The UKCP18 climate projections are produced by modelling using a global scale climate model
(HadGEM3) which in turn provides input into a Regional Climate Model (HadRM3). The HadRM3 is
run 12 times using slightly different parameterisations that aim to capture the range of uncertainty
associated with climate modelling. This creates a 12-member ensemble of climate projections.
• The UKCP18 climate projections cover the range of RCPs, with estimates of future climate
conditions presented as probabilities (e.g. temperature increase could be between 0.7°C to 4.4°C in
the winter by 2070 (at the 10% and 90% probability levels), depending on emissions scenario
(RCP2.6 to RCP8.5).
• However, the UK Met Office have only released daily data for the RCP8.5 simulations. The snow
model used in this study needed daily data.
• Even if emissions ceased now, there will still be some locked in warming leading to some further
climate change.
Box 2. Summary of the origins of the climate projections and greenhouse gas emissions rate scenarios.
www.climatexchange.org.uk P a g e | 20Snow Cover and Climate Change in the Cairngorms National Park: Summary Assessment
Appendix B Historical climatic trends and future projections –
Balmoral
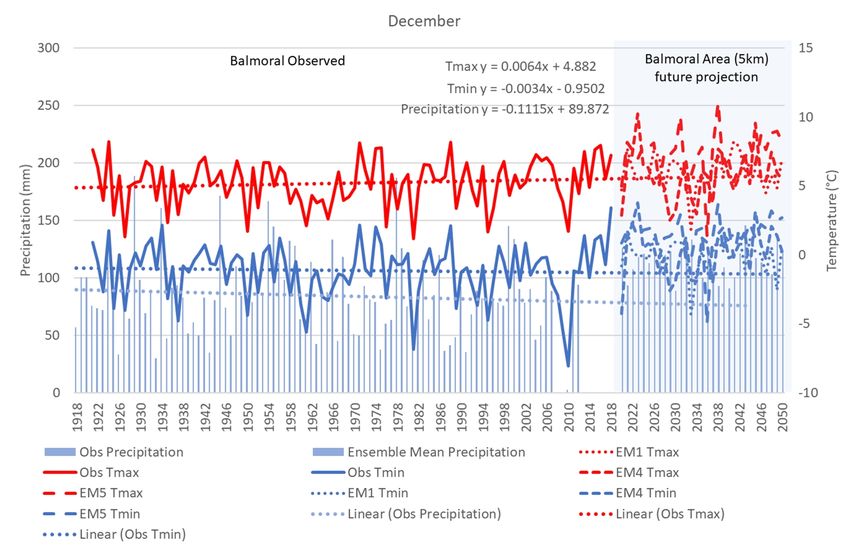
Past climatic trends per month for precipitation and temperature and future daily data are based on estimates
from three (EM1, 4 and 5) of the 12 ensemble members from the HadRM3 Regional Climate Model (used as
the basis for the UKCP18 climate projections) for the 8.5 Representative Concentration Pathway. Trend lines
from the historical data have been extended to 2050 to illustrate how these compare with the modelled future
projections. It should be noted that: the observed data is for a specific meteorological station (Balmoral)
whereas the future projections are for the 5km cell overall that covers the Balmoral site, hence there will be
some representation uncertainty (differences in scale); data for precipitation was not available after 2012 for
this meteorological station.
What the graphs show:
1. the average monthly maximum temperature (°C, red line),
2. mean average monthly minimum temperature (blue line),
3. monthly precipitation totals (mm, blue bars) for the observed period with trend lines extended to
2050 and
4. climate model projections (2020-2050, x3 ensemble member) for maximum (red dotted and
dashed lines) and minimum temperature (blue dotted and dashed lines), and the whole 12-
member ensemble mean for precipitation (blue bars).
Interpreting the graphs: The monthly temperature and precipitation data do not indicate directly a response in
terms of snow creation, quantity of fall or duration on the ground. However, the information the graphs
convey show the long-term trends and levels of inter-annual variation and future projection directions. Some
specific years provide indications of correlations between snow and other weather variables (e.g. December
2010, which showed low temperatures and precipitation but when there was a large snowfall).
www.climatexchange.org.uk P a g e | 21Figure 7: Weather data trends for December, Balmoral 1918-2018 and estimated future 2020-2050 (RCP8.5)
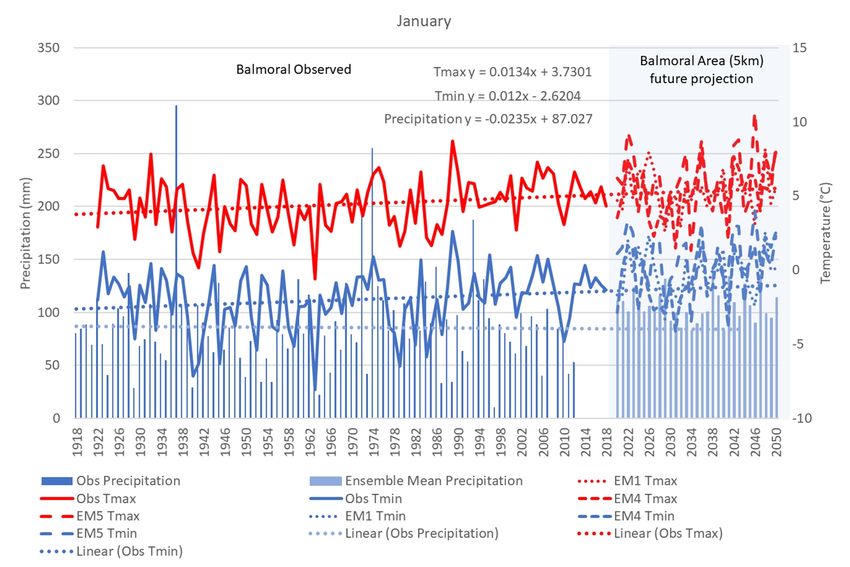
Future Snow Cover in the Cairngorms National Park due to Climate Change: summary assessment

Figure 8: Weather data trends for January, Balmoral 1918-2018 and estimated future 2020-2050 (RCP8.5)

www.climatexchange.org.uk                                                         P a g e | 23
Future Snow Cover in the Cairngorms National Park due to Climate Change: summary assessment

Figure 9: Weather data trends for February, Balmoral 1918-2018 and estimated future 2020-2050 (RCP8.5)

www.climatexchange.org.uk                                                         P a g e | 24
Future Snow Cover in the Cairngorms National Park due to Climate Change: summary assessment

Figure 10: Weather data trends for March, Balmoral 1918-2018 and estimated future 2020-2050 (RCP8.5)

www.climatexchange.org.uk                                                         P a g e | 25
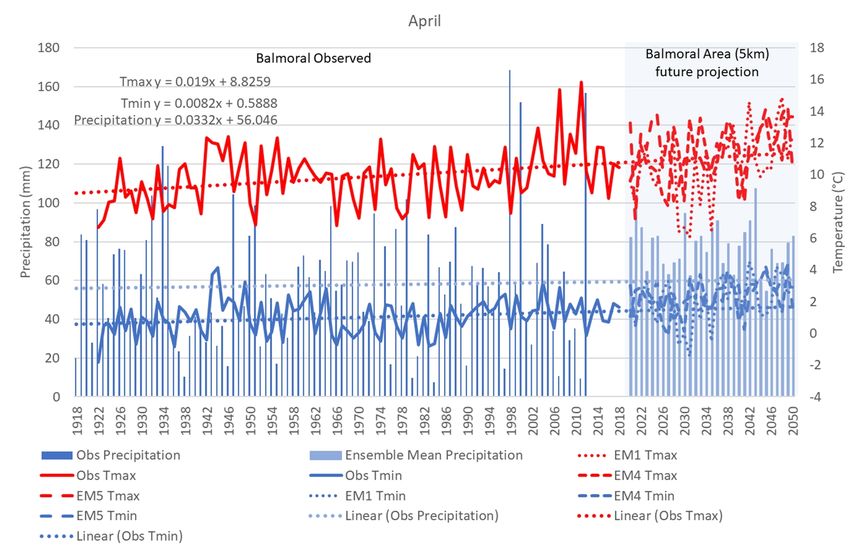
Future Snow Cover in the Cairngorms National Park due to Climate Change: summary assessment

Figure 11: Weather data trends for April, Balmoral 1918-2018 and estimated future 2020-2050 (RCP8.5)

www.climatexchange.org.uk                                                         P a g e | 26
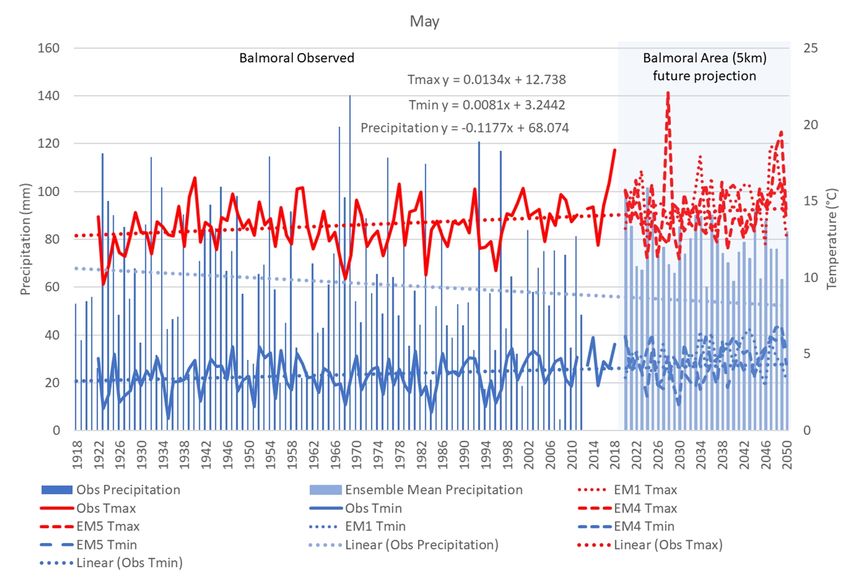
Future Snow Cover in the Cairngorms National Park due to Climate Change: summary assessment

Figure 12: Weather data trends for May, Balmoral 1918-2018 and estimated future 2020-2050 (RCP8.5)

www.climatexchange.org.uk                                                         P a g e | 27
Future Snow Cover in the Cairngorms National Park due to Climate Change: summary assessment

Appendix C: Historical climatic trends and Whitehillocks snow cover and weather data
comparison
In this illustration we show the precipitation, maximum and minimum temperature and snowline elevation for Whitehillocks in the winter 1969-70. This
shows the relationship between the weather variables and snowline: highlighted is a period in mid to late March when a period of warm weather
reduced the snowline from 300m to 900m, followed by a cold period with precipitation bringing the snowline back down to 300m.

www.climatexchange.org.uk                                                             P a g e | 28
Future Snow Cover in the Cairngorms National Park due to Climate Change: summary assessment

Figure 13: Relationship between maximum and minimum temperature and precipitation with snow cover elevation, Whitehillocks 1969-70.

www.climatexchange.org.uk                                                         P a g e | 29
References
Andrews C. Ives S. Dick J (2016) Long-term observations of increasing snow cover in the western Cairngorms.
Weather 71, No. 7. https://rmets.onlinelibrary.wiley.com/doi/epdf/10.1002/wea.2731
Beniston M. Keller F. Koffi, B.and Goyette S. (2003). Estimates of snow accumulation and volume in the Swiss
Alps under changing climatic conditions. Theoretical and Applied Climatology 76:125–140.
Brown I (2019) Snow cover duration and extent for Great Britain in a changing climate: Altitudinal variations
and synoptic-scale influences. Int J. climatology 2019: 1-16. DOI: 10.1002/joc.6090
Blunden, J. and Arndt, D. S. (2014) State of the climate in 2013. Bulletin of the American Meteorological
Society, 95(7): S1–S279.
Gottfried, M., Hantel, M., Maurer, C., Toechterle, R., Pauli, H. and Grabherr, G. (2011) Coincidence of the
alpine–nival ecotone with the summer snowline. Environmental Research Letters, 6, 014013.
Helliwell, R.C., Soulsby, C., Ferrier, R.C., Jenkins, A. and Harriman, R. (1998) Influence of snow on the hydrology
and hydrochemistry of the Allt a'Mharcaidh, Cairngorm mountains, Scotland. Science of the Total Environment,
21: 59– 70.
Harrison J. Winterbottom S. and Johnson R. (2001a) Climate change and changing snowfall patterns in Scotland
Edinburgh Scottish Executive Central Research Unit.
Harrison, S.J., Winterbottom, S.J. and Johnson, R.C. (2001b). A preliminary assessment of the socio-economic
and environmental impacts of recent changes in winter snow cover in Scotland. Scottish Geographical Journal,
117: 297-312
IPCC (2014) Fifth Assessment Report, Working Group II Chapter 22.
IPCC, 2019: Summary for Policymakers. In: IPCC Special Report on the Ocean and Cryosphere in a Changing
Climate [H.O.Pörtner,D.C. Roberts, V. Masson-Delmotte, P. Zhai, M. Tignor, E. Poloczanska, K. Mintenbeck, M.
Nicolai, A. Okem, J. Petzold, B. Rama, N. Weyer (eds.)] In press.
Oke, T.R. (1987). Boundary Layer Climates, 2nd edition. London: Methuen.
Poggio, L. and Gimona, A. (2105) Sequence-based mapping approach to spatio-temporal snow patterns from
MODIS time-series applied to Scotland. International Journal of Applied Earth Observation and
Geoinformation. 34: 122-135
Pohle I, Helliwell R, Aube C, Gibbs S, Spencer M, Spezia L (2019) Citizen science evidence from the past century
shows that Scottish rivers are warming. Science of the Total Environment 659, 53-65.
https://doi.org/10.1016/j.scitotenv.2018.12.325
Pomeroy, J.W. and Brun, E. (2001) Physical properties of snow. In: H.G. Jones , J.W. Pomeroy , D.A. Walker and
R.W. Hoham (Eds.) Snow Ecology. Cambridge: Cambridge University Press, pp. 45– 126.
Riahi K., D.P. van Vuuren, E. Kriegler, J. Edmonds, B.C. O’Neill, S. Fujimori, N. Bauer, K. Calvin, R. Dellink, O.
Fricko, W. Lutz, A. Popp, J.C. Cuaresma, Samir KC, M. Leimbach, L. Jiang, T. Kram, S. Rao, M. Tavoni (2017) The
Shared Socioeconomic Pathways and their energy, land use, and greenhouse gas emissions implications: An
overview. Global Environmental Change 42, 153-168. http://dx.doi.org/10.1016/j.gloenvcha.2016.05.009
Rivington M, Miller D, Matthews KB, Russell G, Bellocchi G, Buchan K (2008b) Downscaling regional climate
model estimates of daily precipitation, temperature and solar radiation data. Climate Research 35(3): 181-202
Soulsby C, Helliwell RC, Ferrier RC, Jenkins A and Harriman R. (1997). Seasonal snowpack influence on the
hydrology of a sub-arctic catchment in Scotland. Journal of Hydrology, 192: 17-32
Future Snow Cover in the Cairngorms National Park due to Climate Change: summary assessment

Spencer M, Essery R, Chambers L & Hogg S (2014) The Historical Snow Survey of Great Britain: Digitised Data
for Scotland, Scottish Geographical Journal, 130:4, 252-265, DOI: 10.1080/14702541.2014.900184
Spencer M and Essery R (2016) Scottish snow cover dependence on the North Atlantic Oscillation index.
Hydrology Research 47.3. doi: 10.2166/nh.2016.085
Spencer, M. (2016a). Reanalysis of Scottish mountain snow conditions. PhD Thesis, Edinburgh University.
http://hdl.handle.net/1842/25527
Spencer, M. (2016b). Snow Survey of Great Britain: transcribed data for Scotland, 1945 to 2007. NERC
Environmental Information Data Centre. https://doi.org/10.5285/caf989a5-82d7-4db7-b6ff-c0475fdae07e
Spencer M. (2019a, October 24). Cairngorm National Park snow cover duration 1960 - 2080. Zenodo.
http://doi.org/10.5281/zenodo.3518297
Spencer M. (2019b, October 25). Snow Cover and Climate Change in the Cairngorms National Park - model run,
analysis and plot creation (Version v1.0). Zenodo. http://doi.org/10.5281/zenodo.3519210
Tedesco, M., Brodzik, M., Armstrong, R., Savoie, M., and Ramage, J. (2009) Pan Arctic terrestrial snowmelt
trends (1979–2008) from spaceborne passive microwave data and correlation with the Arctic Oscillation.
Geophysical Research Letters , 36(21): L21402, doi http://dx.doi.org/10.1029/2009GL039672
Trivedi MR, Browne MK, Berry PM, Dawson TP and Morecroft MD (2007) Projecting Climate Change Impacts on
Mountain Snow Cover in Central Scotland from Historical Patterns. Arctic, Antarctic and Alpine Research 39,
488-499.
UKCP18 (2019a) UK Climate Projections: Headline Findings. Version 2. UK Meteorological Office.
https://www.metoffice.gov.uk/binaries/content/assets/metofficegovuk/pdf/research/ukcp/ukcp-headline-
findings-v2.pdfa
UKCP18 (2019b). UKCP18 Factsheet: Snow. UK Meteorological Office.
https://www.metoffice.gov.uk/binaries/content/assets/metofficegovuk/pdf/research/ukcp/ukcp18-factsheet-
snow.pdf
Wipf S., Sommerkorn M., Stutter M.I., Wubs E.R.J., van der Wal R. (2015) Snow cover, freeze-thaw, and the
retention of nutrients in an oceanic mountain ecosystem. Ecosphere 6: 6–16

©Published by The James Hutton Institute 2019 on behalf of ClimateXChange
All rights reserved. No part of this publication may be reproduced, stored in a retrieval system, or transmitted in any form or by any means,
electronic, mechanical, photocopying, recording or otherwise, without the prior written permission of the publishers. While every effort is made to
ensure that the information given here is accurate, no legal responsibility is accepted for any errors, omissions or misleading statements. The views
expressed in this paper represent those of the author(s) and do not necessarily represent those of the host institutions or funders.

www.climatexchange.org.uk                                                                                               P a g e | 31
You can also read