A Summary of Climate Change Risks for London - To coincide with the publication of the UK Climate Change Risk Assessment (CCRA) 2012
←
→
Page content transcription
If your browser does not render page correctly, please read the page content below
A Summary of Climate Change
           Risks for London
To coincide with the publication of the UK Climate
             Change Risk Assessment (CCRA) 2012

                                    Climate UK/ London   1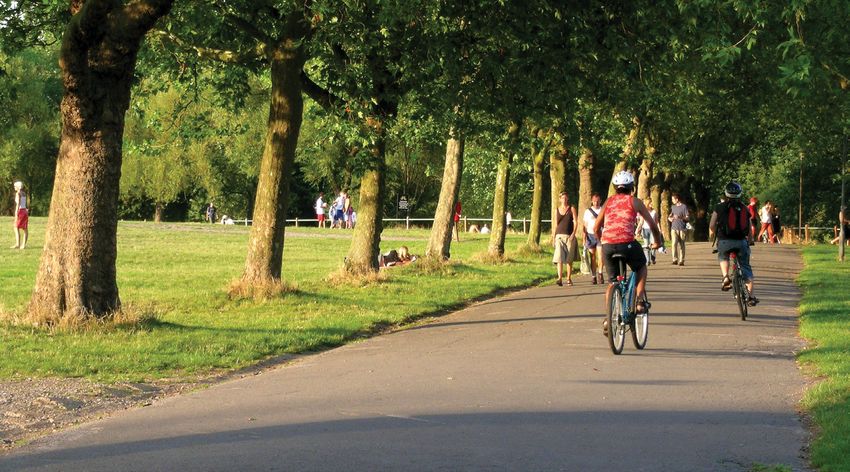
Introduction
    London, as a world city, a major transport hub and an         In October 2011, he released a climate change
    international centre of finance, politics and culture, is     adaptation strategy, which was produced in consultation
    crucial to the UK’s resilience as a whole. However, it is     with key players across London. This provides a
    one of the most vulnerable parts of the UK to climate         framework for collective action, identifying where
    change. This is because of a combination of factors:          the Mayor is uniquely placed to act and where other
    its population size and density; the ageing Victorian         organisations, and even Londoners themselves, can lead
    infrastructure that allows it to function; its sensitivity    or join in action.
    to the world economy; reliance on importing resources;        The UK Government’s national Climate Change Risk
    its location in the already hotter drier South East, with     Assessment (CCRA) provides a high-level appraisal of risk
    much of the city situated on former estuarial marsh land;     across the country, which provides a broader context for
    and its existing vulnerability to extreme weather.            the Mayor’s strategy for London. Using this work we are
    The London Climate Change Partnership (LCCP) recognises       able to compare the risks faced by London with the rest
    these vulnerabilities and has been working to increase        of the UK. The national CCRA is the first step towards a
    climate resilience within and between sectors in London       National Adaptation Programme (NAP), which will set
    for the last decade. The LCCP is comprised of public,         out recommended priority actions for increasing the
    private and voluntary sector organisations that have a        UK’s resilience. The actions set out in London’s Climate
    role to play in preparing London for extreme weather          Change Adaptation Strategy will be taken into account
    today and climate change in the future. The Mayor of          during the creation of the NAP. The Mayor and the
    London is part of this partnership, and has played a          London Climate Change Partnership will continue to work
    major role in assessing the risks and increasing resilience   with Government as the NAP is developed to ensure that
    to climate change in London.                                  the unique needs and opportunities that London presents
                                                                  are fully taken into account.

    UK Climate Change Risk Assessment
    The UK Climate Change Risk Assessment (CCRA) is an            The CCRA methodology has been developed through
    independent research project, funded by UK Government         a number of stages involving expert peer review.
    and Devolved Governments that analyses the main risks         The approach developed is a tractable, repeatable
    and opportunities to the UK, arising from climate change      methodology that is not dependent on changes in long
    over the coming years. It provides the underpinning           term plans between the 5 year cycles of the CCRA.
    evidence to inform discussions on adaptation action           The assessment considered population growth,
    needed in such areas as infrastructure, health,               where relevant, but did not quantify the impacts of
    environment and business. It will be updated every            other societal changes on future risks, for example
    five years taking account of new climate observations         due to economic growth, or developments in new
    and improved understanding of future climate change           technologies, or the full range of planned and potential
    and risks.                                                    future Government policies or private sector adaptation
    The CCRA methodology is novel in that it has allows for       investment plans.
    comparison of over 100 risks (prioritised from an initial     Excluding these factors from the analysis provides a more
    list of over 700) from a number of disparate sectors          robust ‘baseline’ against which the effects of different
    based on the magnitude of the impact and confidence in        plans and policies can be more easily assessed. However,
    the evidence base. A key strength of the analysis is using    when utilising the outputs of the CCRA, it is essential
    a consistent method and set of climate projections to         to consider that Government and key organisations
    look at current and future risks and opportunities.           are already taking action in many areas to minimise
                                                                  climate change risks and these interventions need to be
                                                                  considered when assessing where further action may be
                                                                  best directed or needed.

2   Climate UK/ London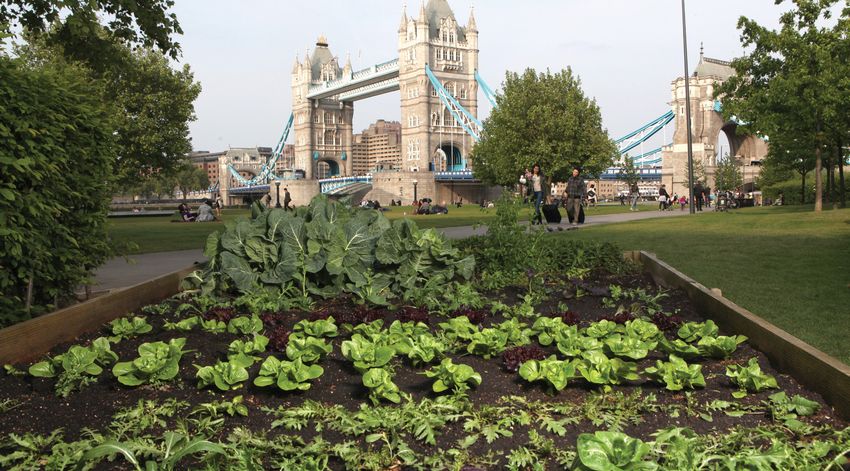
Key National Messages
Some key findings show why we must act now to prepare          This pack was commissioned to coincide with the
ourselves and our businesses for the future impact of          publication of the UK’s first Climate Change Risk
climate change. The research reveals that without action       Assessment. While drawing on the CCRA where there
we could see:-                                                 is regional or local information (which at times is
• Increases in the frequency of flooding affecting            limited due to lack of data) this pack presents a local
   people’s homes and wellbeing, especially for vulnerable     perspective of the CCRA risks and opportunities.
   groups (e.g. those affected by poverty, older people,       The pack offers an illustration of what climate change
   people in poor health and those with disabilities), and     means for people, businesses, community groups, local
   the operation of businesses and critical infrastructure     authorities, and other organisations across key sectors,
   systems. Annual damage to properties in England             at the local level, highlighting what is already happening
   and Wales, due to flooding from rivers and the sea,         and where there is a strong case for greater local action.
   rises from £1.2 billion to between £2.1 billion and         Detailed results from the CCRA are presented in:
   £12 billion by the 2080s. Without action, a range of        • An extensive and comprehensive UK CCRA Evidence
   important infrastructure such as roads and railways            Report;
   may be affected by a significantly increased risk of
                                                               • A suite of technical reports on 11 key sectors.
   flooding based on future population growth and if no
   adaptive action is taken.                                   • The UK CCRA: Government Report, which highlights
                                                                  actions already in place to manage the risk identified
• Summer overheating potentially contributing to
                                                                  in the CCRA, and outlines UK Government plans for the
   heat-related health problems. Premature deaths due
                                                                  future.
   to hotter summers are projected to increase (e.g. by
   between 580 and 5900 by the 2050s). This is likely          To read these publications, please visit: http://www.
   to place different burdens on National Health Service       defra.gov.uk/environment/climate/government/
   (NHS), public health and social care services.
   Other health risks that may increase include problems
   caused by ground-level ozone and by marine and
   freshwater pathogens.
• Reductions in water availability, particularly during the
   summer, leading to more frequent water use restrictions
   and, in the longer term, water shortages. The gap
   between demand and availability will potentially
   widen, impacting homes, businesses, schools and
   hospitals. By the 2050s, between 27 million and
   59 million people in the UK may be living in areas
   affected by water supply-demand deficits (based on
   existing population levels). Adaptation action will be
   needed to increase water efficiency across all sectors
   and decrease levels of water abstraction in the
   summer months.

                                                                                                       Climate UK/ London   3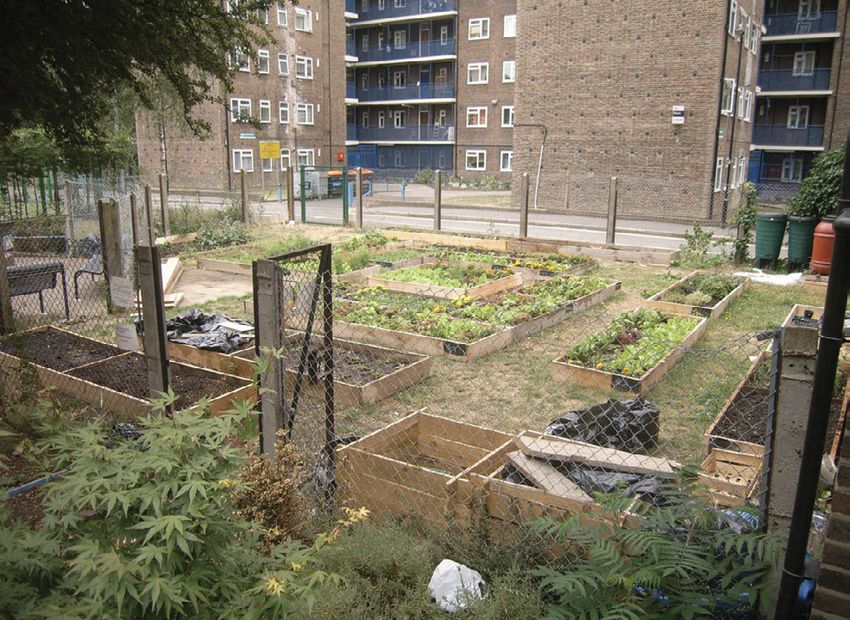
Key Risks and Implications
                            Some Key Regional Climate Implications

                             • London is a global centre for the financial sector, which means that impacts from global
                                extreme weather events, as well as local events, are likely to affect its businesses. This
                                provides opportunities as well as challenges for businesses.
                             • Tourism is expected to continue to increase in London, but its market share of UK
                                tourism is expected reduce as more people visit the North of England and Scotland.

           Business

                             • London has a high concentration of vulnerable groups, which are likely to be
                                disproportionately affected by the impacts of climate change.
                             • The impacts of climate change will not be equal or fair, and are likely to increase existing
                                inequalities unless we take action.
                             • London is expected to see an increase in deaths due to heat during the summer months,
                                but it is also likely to see a reduction in deaths due to cold in the winter.
     Health and Wellbeing

                             • Many of London’s vulnerabilities to climate impacts stem from its urbanisation, which
                                can reinforce climate impacts; for example by preventing the city from cooling off on
                                hot summer nights and increasing the rate of rainfall run-off, leading to flash flooding.
                             • A significant proportion of London’s critical infrastructure is already at risk of flooding
                                and/or overheating.
        Buildings and
        Infrastructure

                             • There is relatively little land in London used for commercial food production, although
                                community food-growing schemes may be affected.
                             • London’s tree stock is at risk from drought and higher summer temperatures, which
                                could impact on the cooling effect it provides. Future climate should be considered
                                in tree-planting schemes.
                             • More frequent summer droughts may reduce the success rate of newly planted trees and
                                put mature trees under stress, potentially shortening the lifespan of many of London’s
        Agriculture and         mature street trees.
           Forestry

                             • Hotter, drier summers and a growing population will put increasing pressure upon already
                                limited water resources, potentially leading to more frequent drought management
                                measures and negative impacts on the water environment.
                             • Increasing London’s green space can help to cool the urban environment, improve air
                                quality and help reduce surface water flood risk.
                             • London’s habitats and biodiversity are expected to change as a result of climate impacts.
     Natural Environment

4   Climate UK/ London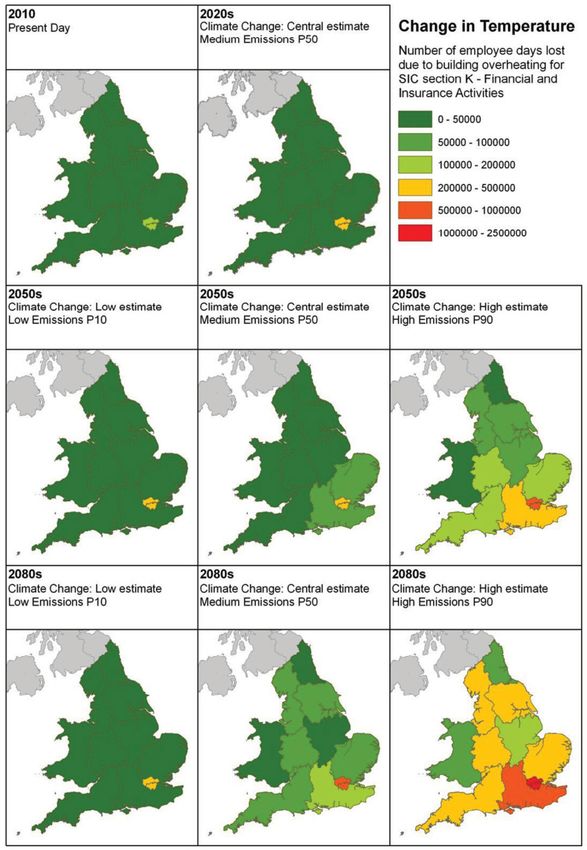
Key Risks and Implications
                                                Key National Risks from the UK CCRA 2012

• Climate change represents a potentially significant issue for all UK business sectors.
• Main climate challenges to businesses include flooding and coastal erosion, increased
   competition for water, and disruption of transport and communication links.
• The degree to which individual organisations are affected depends upon their level of
   vulnerability and adaptive capacity.
• There are potentially significant commercial and competitive advantages to be gained for
   those businesses taking on the challenge.
                                                                                                             Business

• Climate change could have significant implications for the health and wellbeing of the
   UK population.
• Implications affect public health, the continuity of health and social care services both
   within the NHS and beyond, the resilience of local emergency services, and the most
   socially vulnerable.
• There may be some welcome benefits, but these are likely to be outweighed by a range of
   negative effects.
                                                                                                        Health and Wellbeing

• The built environment and infrastructure are already vulnerable to extreme weather such as flood-
   ing, storms, heatwaves, and droughts.
• Most of today’s buildings were designed for the climate that existed when they were built and are
   not necessarily equipped to cope with current and future climates.
• Around 70% of buildings that will be in use in the 2050s already exist, but there may
   be opportunities for innovative building services and urban planning in the UK and overseas.
• The government has already prioritised the need to improve the long-term resilience of new
   and existing infrastructure networks in the energy, ICT, transport and water sectors.                   Buildings and
                                                                                                           Infrastructure

• Agriculture and forestry are sensitive to climatic conditions; changes in climate have a profound
   impact on productivity and economic viability.
• Climate change may alter the impact that agriculture and forestry have on the natural environment
   and the value of the ecosystem services provided.
• Warmer temperatures and carbon fertilisation may present some opportunities to increase yields,
   in the short term.
• Low water availability in the summer, increased flooding and coastal erosion, increased prevalence
   of pests diseases, and frequent wildfires may limit opportunities in the longer term.                  Agriculture and
                                                                                                             Forestry

• Climate change may exacerbate and/or alter the pressures placed on the natural
   environment, especially those caused by human activity.
• Heightened impacts may in turn affect the way humans are able to use the environment
   – for example growing crops or obtaining high quality drinking water.
• The natural environment is crucial to our ability to adapt, reducing flood risk, cooling
   cities and storing water.
                                                                                                        Natural Environment

                                                                                                         Climate UK/ London    5
Buildings and Infrastructure
Many of London’s vulnerabilities to climate impacts Fifteen per cent of the city’s surface area lies on the
stem from its urbanisation, which can reinforce climate floodplains of London’s rivers, although much of it
impacts; for example by preventing the city from cooling currently benefits from existing flood defences. This
off on hot summer nights and increasing the rate of means that an estimated 1.25 million people are at
rainfall run-off, leading to flash flooding. Because it is risk from flooding and nearly half a million properties.
densely populated and developed, London also needs to It is important to note that over 80 per cent of these
import a large percentage of its water, energy, workforce, properties are at ‘low’ flood risk (0.5 per cent or less
food, and other consumables from outside of the city, chance in any one year), but that there are over 83,000
making its supply chains more susceptible to disruption. properties at ‘moderate’ risk (between 0.5 and 1.3 per
Water supply, which is an important issue for London, cent chance in one year) or ‘significant’ risk (more than
is dealt with in more detail in the Natural Environment 1.3 per cent chance in any one year).
section. There is also a substantial proportion of the capital’s
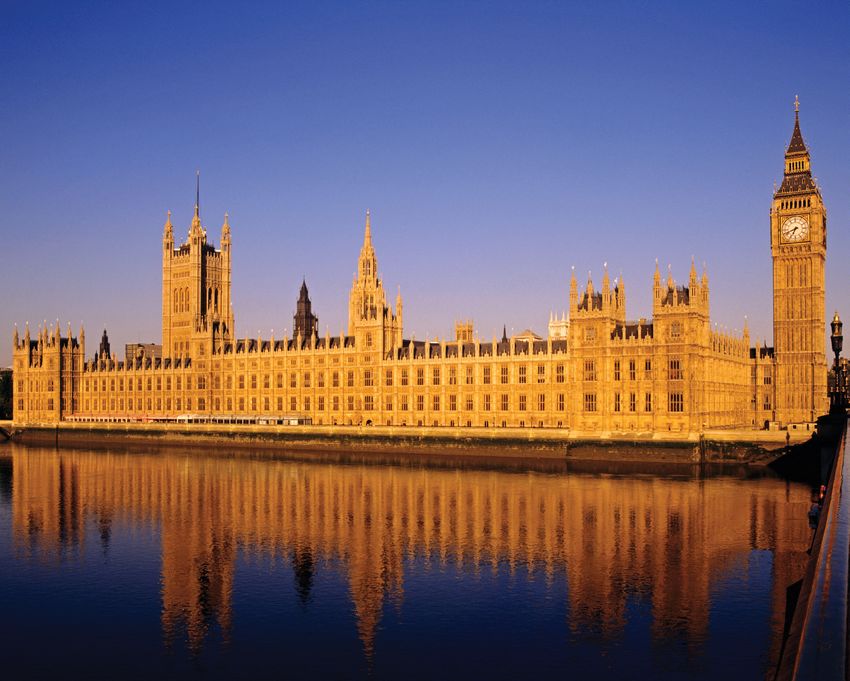
Flood schools, transport network, and emergency services that
London is currently very well protected against tidal are at risk from tidal and river flooding risk, although
flooding, but has a lower and much more variable most are well protected.
standard of protection against river flooding and a The CCRA identifies the two main climate drivers for
relatively low standard of protection against surface increased flooding in the UK as increases in rainfall and
water flooding. Both tidal and river flooding are sea level rise. Changes in levels of rainfall are expected
considered in the CCRA, although a lack of suitable data to impact on surface water flooding, sewer flooding and
meant that surface water flooding could not be analysed groundwater flooding. Surface water flooding occurs
UK-wide. However, there has been work done in London when heavy rainfall overcomes the drainage system. It is
to understand surface water flood risk. In the Thames an area of climate risk which is particularly increased in
Estuary, the tidal flood defences provide a higher level urban areas such as London because development reduces
of protection than elsewhere in the country. The Thames the amount of permeable surfaces where rainwater can
Barrier has been operational since 1982 and has been drain away. In London there are currently estimated to
closed over 100 times to protect London from flooding. be more than 800,000 properties at risk of surface water
In addition to stopping tidal surges from entering central flooding. The CCRA’s rainfall analysis suggests that heavy
London, closing the barrier can also ‘keep out the tide’ rainfall events will increase in intensity in London and
and provide additional space for high river flows after elsewhere and that this increase is most likely to occur
heavy rainfall in the upper Thames catchment to the west in winter months. Further development due to population
of London. increase in London is projected to place an additional
The Thames Estuary 2100 (TE2100) project was set up pressure on surface water drainage. London’s Built
by the Environment Agency to tackle tidal flood risk in Environment case study, Drain London, looks in more
London and the Thames Estuary for the 21st century. It detail at how surface water flood risks for London have
pioneered an approach to adaptation that assessed the been assessed.
thresholds for responding to different amounts of sea The results shown in Table 1 show the increase in
level rise. A large range of possible increases in extreme frequency of storms that exceed three different
water levels were investigated and this led to the thresholds (>20mm in 3 hours; >30mm in 6 hours;
development of flexible response options or ‘adaptation >40mm for the total storm). A value of 1.0 in the table
pathways’. The final plan is centred around the most means no change and a value of 2.0 means that the
likely scenario but can be adapted if the rate of sea level frequency has doubled. The results indicate that the
rise or linked factors change as the century progresses. frequency of heavy rainfall events could double by the
2080s leading to an increase in the frequency of surface
water flooding, with London particularly affected by the
>40mm for total storm events category.
6 Climate UK/ London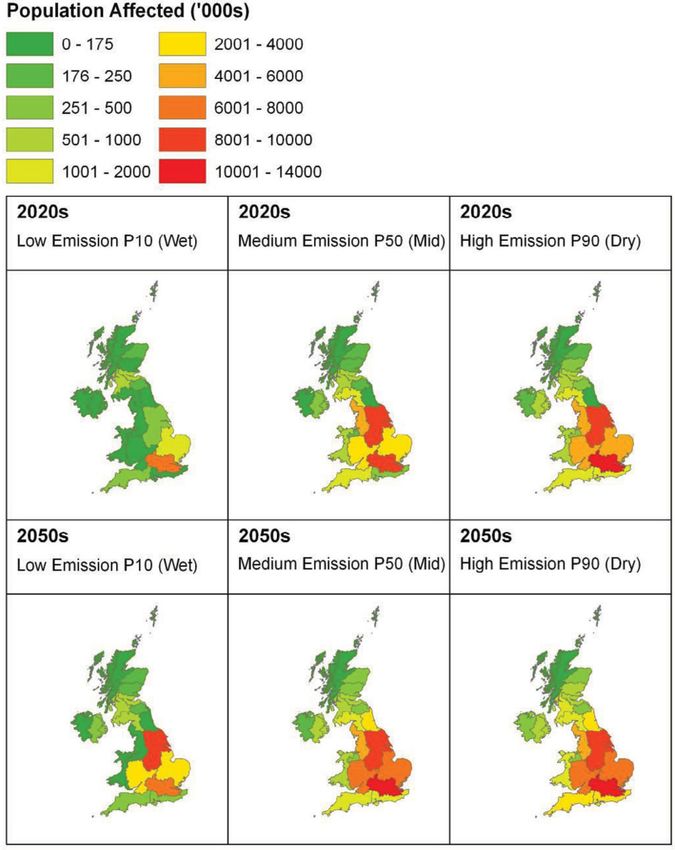
> 20mm Rainfall in 3 Hours             > 30mm Rainfall in 6 Hours        > 40mm Total Storm Rainfall
 Location
                                          P10          P50          P90          P10          P50         P90     P10        P50       P90

 London                                    0.9          1.2         1.5          1.6          2.0         2.1     3.0         2.1       2.4

 Cardiff                                   1.0          1.2         1.3          1.8          1.5         1.7     1.6         1.8       2.1

 Glasgow                                   1.3          1.4         1.7          3.5          3.0         2.2     1.9         1.9       2.0

 Belfast                                   1.3          1.4         1.5          1.6          1.8         1.6     1.5         1.5       1.6

 Average                                   1.1         1.3          1.5          2.1          2.1         1.9     2.0         1.8       2.0

Table 1 - Change in frequency of heavy rainfall events between 1961-90 and the 2080s. (UK CCRA 2012)

 Social infrastructure                                             Total in London Number at flood risk* (% of total)
 Schools                                                           3,049                        441 (14%)

 Hospitals                                                         111                          10 (9%)

 Civil infrastructure
 Police stations                                                   169                          46 (27%)

 Fire stations                                                     111                          20 (18%)

 Ambulance stations                                                63                           9 (19%)

 Prisons                                                           8                            1 (12.5) - Belmarsh

 Railway stations                                                  324                          49 (15%)

 London Underground stations (including DLR) 291                                                75 (26%)

 Bus depots                                                        84                           25 (29%)

 Airports                                                          2                            1 (50%) – City Airport

                          *defined as Flood Zone 3 (> 0.5% per annum tidal flood risk or >1% per annum fluvial flood risk)

Table 2 - Infrastructure in London at risk of tidal and river flooding (Greater London Authority, 2011)

                                                                                                                             Climate UK/ London   7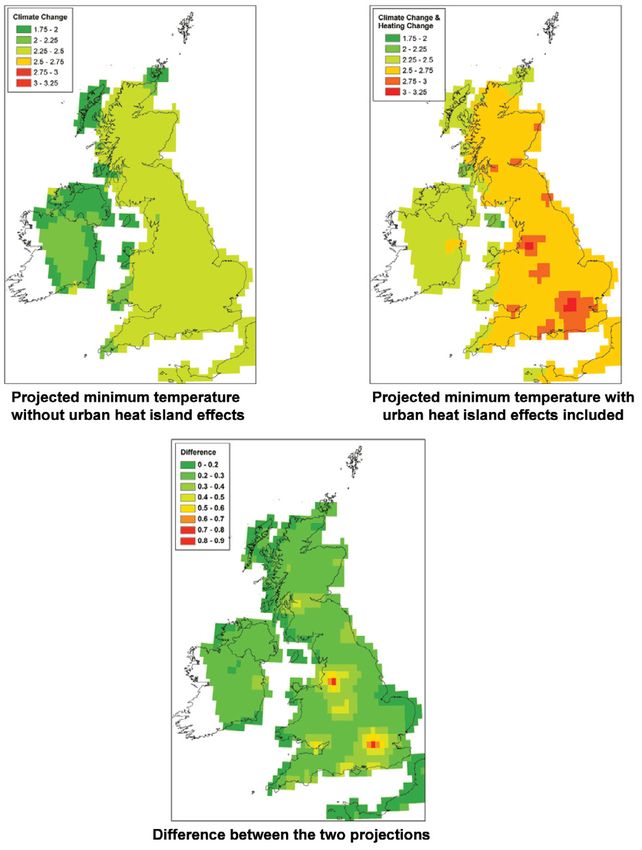
Heat
                                                           The temperature at the centre of a large city can be
                                                           several degrees higher at night than in the surrounding
                                                           rural areas, which is known as the Urban Heat Island
                                                           (UHI) effect. Several factors contribute to the
                                                           development of this urban microclimate, including:
                                                           greater absorption and storage of heat from the sun by
                                                           the urban fabric during the day; surface water being
                                                           drained away and therefore not available for evaporative
                                                           cooling; and anthropogenic heat emissions, such as
                                                           exhaust air from air-conditioning systems. The magnitude
                                                           of the UHI effect is dependent upon the interplay of
                                                           local conditions including land coverage, built form, wind
                                                           patterns, cloud cover and relative humidity. In the case
                                                           of London, the UHI effect on night-time temperatures
                                                           can be up to 10°C. The Tyndall Centre’s ARCADIA project
                                                           suggests that:
                                                           • By the 2050s, one third of London’s summer may
                                                              exceed the Met Office current heat wave temperature
                                                              threshold (Daytime temperature of 32°C and night-time
                                                              temperature of 18°C).
                                                           • A threefold increase in anthropogenic heat emissions
                                                              (e.g. from air conditioning) on top of climate
                                                              change has a negligible impact on maximum daytime
                                                              temperature, but would raise minimum night-time
    Increase in minimum temperature in period 2041-2050
                                                              temperatures by about 0.5°C which would aggravate
    (UK CCRA 2012)                                            heat stress.
                                                           Overheating of commercial and other properties can
                                                           arise due to a number of factors, but can be especially
                                                           acute in modern highly insulated lightweight buildings
                                                           and highly glazed buildings. The risk of overheating in
                                                           buildings is likely to increase as outdoor temperatures
                                                           increase. In London, the number of days per year when
                                                           overheating could occur is projected to rise from 18
                                                           days to between 22 and 51 days by the 2020s (central
                                                           estimate is 33 days).
                                                           London’s climate change adaptation strategy aims to
                                                           tackle overheating in the urban realm through four
                                                           interrelated aims:
                                                           1. Limiting the intensification of hot weather by
                                                               London’s UHI (discussed further in the Natural
                                                               Environment section).
                                                           2. Designing new, and adapting existing buildings and
                                                               infrastructure to minimise the need for cooling as far
                                                               as possible.
                                                           3. Ensuring that where cooling is still required, that low-
                                                               carbon, energy-efficient methods are used
    Areas of Shrink-Swell Clays in the UK (UK CCRA 2012)
                                                           4. Enhancing the emergency response to heatwaves.

8   Climate UK/ London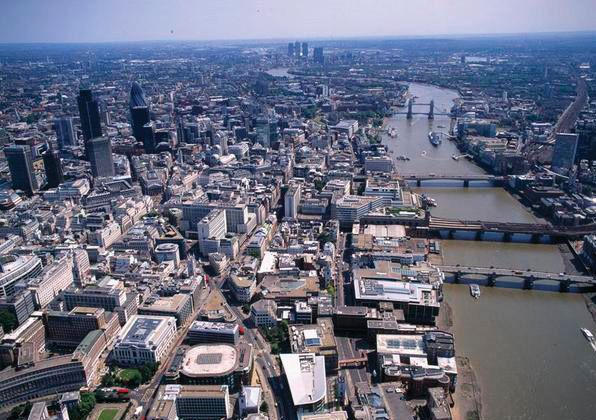
Energy Demand                                                  during hot weather some sections of the network can
The CCRA has found that the estimated number of                reach temperatures that may affect the wellbeing of
days above the temperature threshold where cooling is          vulnerable passengers.
required is projected to rise significantly, particularly in   As most of the London Underground was built before
the South East and London, and especially in towards the       air-conditioning was invented, and the tunnels were
end of the century. While currently residential properties     designed with just enough room for the trains, cooling
do not contribute significantly to cooling demand, they        the London Underground network is a highly complex
may do so in future as we see hotter summers and more          engineering problem. In addition, London Underground
frequent heatwave events. However, other factors such          is preparing to meet the rising demand by increasing
as household income and future housing design are also         passenger transport capacity on the network by 300,000
expected to play a large part in the uptake of domestic        passengers a day by 2016, with longer and more frequent
air conditioning. Cooling demand from commercial               trains. Together these will increase temperatures in the
properties is expected to continue to rise.                    network. London Underground has a cooling strategy for
As well as contributing to the Urban Heat Island effect,       the network in place, which involves a mix of measures.
the expected increase in use of air conditioning will have     A programme of retrofitting existing buses with white
an impact on our summer energy use. The CCRA reports1          painted roofs and automatic ventilation system is also
that under a high climate scenario cooling energy              underway to keep passengers cool.
demand is projected to rise from approximately 1.6TWh          The likelihood of delays arising from rail buckling is
(Terrawatt-hours) in 2004 to 2.5TWh by 2030 in London,         projected to increase somewhat, with the largest increase
and under a low climate scenario it is projected to rise       in numbers in London and the North West of England.
from approximately 1.6TWh to 2.2TWh, mostly driven by          Allthough this is only predicted to be a low magnitude
office cooling. (A terawatt hour is a million million Watt     impact up until the 2080s, of all of the impacts
hours – equivalent to leaving on a small hairdryer in          considered in the transport sector, rail buckling is one
every home in Britain, continuously, for 1.6 days).2           area where there are limited options available to users in
Using the current DECC guidance value of 6.8 pence/            an event to minimise delay.
kWh, 3 this equates to additional annual costs of £40−60       Subsidence
million/year. London currently represents around 11 per
cent of total UK cooling demand.                               In the UK, large numbers of properties are at risk of
                                                               subsidence. In 2009 there were about 30,000 notified
However, a positive aspect is that warmer winters are          domestic subsidence claims, with a total value of £175m.
projected to reduce our winter energy demands across
the UK. Heating degree days (HDD) are projected to             In particular, clay soils with high shrink-swell potential
decrease in step with changes in winter temperature            underlie much of the densely populated areas of
with immediate impacts in the short term. The south            London and the South East of England. Changes to the
of England, including London, will receive the greatest        present shrink-swell pattern may occur due to higher
benefit from this effect. In the long term (2080s) HDD in      temperatures and changes in rainfall patterns. This may
southern England are projected to be 50 per cent lower         also have a knock on effect on water supply leakage due
than the 1961–90 period, compared to 30 per cent lower         to damage to pipes, exacerbating water shortage issues
in Scotland.                                                   (see Natural Environment section). However, the range in
                                                               the projections is wide, reflecting the uncertainty in
Transport                                                      the projected changes in summer rainfall.
Heat stress and thermal comfort are likely to become
increasingly important issues as our climate changes,
particularly during times of heatwave. For much of the
transport infrastructure, the impact on passengers is
expected to be minimal because air conditioning units
are already becoming standard across modes. However,
one notable exception is the London Underground                1 - Citing Day et al, 2009.
system. Even in our present climate the Underground            2 - DECC, 2011.
network can be uncomfortably hot in the summer, and            3 - 2010 commercial costs, expressed in 2009 prices.

                                                                                                               Climate UK/ London   9
Natural Environment
     Whilst containing a densely populated urban area,                  Biodiversity
     London enjoys a remarkable amount of space for nature              Climate change in London could affect biodiversity
     with two-thirds of its area occupied by green spaces               in two distinct ways: direct effects, such as changes
     or water. Of this about a third is made up of private              in species composition due to higher temperatures;
     gardens, a third parks or sports grounds and the                   and ‘knock-on’ effects resulting from climate change
     remaining third a variety of habitats, including                   adaptation actions. These changes are likely to include:
     grassland, woodland and rivers.
                                                                        • Lack of water to irrigate sites of nature conservation
     As discussed in the Built Environment section, London                 importance and other green spaces.
     is more vulnerable to heat than its surrounding areas
                                                                        • Change in species composition due to more frequent
     due to the Urban Heat Island effect. There is evidence
                                                                           drought conditions and higher temperatures.
     that green space reduces the urban heat island impacts
     as evaporation and transpiration from plants, and their            • Increased pressures on biodiversity from people using
     shading effects, can cool the atmosphere. In London,                  open spaces for recreation in hot weather.
     monitoring of the urban heat island suggests that large            • Increase in the area of natural or vegetated
     parkland areas are typically 1˚C cooler than surrounding              surfaces in the urban environment due to climate
     built up areas. This issue is already being tackled                   change adaptation actions, which will provide with
     through the Mayor’s plans to enhance 1,000ha of green                 considerable flexibility to deliver biodiverse ‘greenery’.
     space in London by 2012, and to increase green cover               • Increased pollution of watercourses due to flooding of
     in central London by five per cent by 2030 and a further              sewers and Combined Sewerage Overflow spills during
     five per cent by 2050.                                                intense rainfall events.
                                                                        • Increased pollution of watercourses from wastewater
      City                                  Rainfall (mm/year)             discharges due to low river flows.
                                                                        • Change in habitats due to managed retreat and
      London                                590                            restoration of functional floodplains.
      Jerusalem                             597                         • Increase in algal blooms, some of which may be
      Istanbul                              629                            harmful to either biodiversity or humans if the food
                                                                           chain is affected.
      Mexico City                           662
                                                                        • Colonisation by new species from southern England
      Edinburgh                             664                            and continental Europe. However, London’s habitats
      Thames Region                         690                            are highly fragmented; it may be the case that
                                                                           otherwise suitable habitats cannot be colonised by
      Newcastle                             700                            new species because they are not able to disperse to
      Dublin                                740                            or through London.
      Rome                                  791
      Manchester                            809
      England and Wales                     897
      Sydney                                1226
     Table 3 - City rainfall data compiled by Waterwise from relevant
     country MET office websites.

10   Climate UK/ London
Water Supply The Mayor has developed a Water Strategy to tackle
London is already in an area of Serious Water Stress. the issues that London faces with managing water. One
The large population in the South East of England of the measures already being implemented to help
combined with the relatively low level of rainfall Londoners save water is a city-wide programme called
means that the amount of water available per person RE:NEW. The Greater London Authority is working with
is strikingly low in comparison to many hotter, drier the Boroughs, London Councils and the Energy Saving
countries. Trust to improve the water and energy efficiency of
Londoners’ homes with a free package of measures,
And while supply is short, demand is also
such as loft insulation and aerator showerheads, being
disproportionately high. Londoners now consume an
installed into people’s homes.
average of 167 litres per day, compared to the national
average of less than 150 litres per person per day. The Mayor has developed a Water Strategy to tackle
This increased consumption is primarily linked to the issues that London faces with managing water.
affluence (more water consuming devices per home) and One of the measures already being implemented to help
lower occupancy rates (smaller household units, such as Londoners save water is a city-wide programme called
flats, each with water consuming devices). An additional RE:NEW. The Greater London Authority is working with
factor is that only one in four households in London has the Boroughs, London Councils and the Energy Saving
a water meter, and thus the majority have no incentive Trust to improve the water and energy efficiency of
to save water and no opportunity to save money on their Londoners’ homes with a free package of measures,
water bills. such as loft insulation and aerator showerheads, being
installed into people’s homes.
Another reason for London’s increasing shortage of water
is that nearly 600 million litres a day, a quarter of all
the water distributed to London customers, is lost in
leakage. This is the equivalent to an additional person’s
demand in every home in London. This is because: much
of London’s mains water network dates back to the
Victorian era; subsidence and heave cause the pipes and
joints to break (the climate change projections for this
are discussed further in the Built Environment section);
and London clay is particularly corrosive and weakens the
pipes.
Climate change is expected to affect water availability
by:
• Reducing river flows.
• Reducing groundwater replenishment (‘recharge’)
• Increasing evaporation.
• Increasing loss from broken water mains due to
increasing subsidence.
• Increasing demand for water from people and wildlife.
In the long term (2080s), estimates of the supply-
demand deficit are very large (several times the total
supply of the UK’s largest water company), indicating
that major demand and supply-side measures could be
required to maintain supplies in London at today’s level
of risk.
Population affected by a supply-demand deficit due to climate change
(UK CCRA 2012)
Climate UK/ London 11Agriculture and Forestry
©GLA
Climate change impacts, both positive due to warmer Climate change is recognised as a serious threat
weather and negative due to drought and flood, are likely to the presence of trees in urban areas in London.
to have only small impacts on agriculture within London In particular, drought may influence the health,
itself, mainly due to the fact that there is relatively little growth and productivity of London’s tree stock. This
land in London used for commercial food production. can ultimately cause tree mortality, often when in
More noticeably for Londoners, prolonged climate combination with other stresses such as pests and
change impacts felt outside London (in the UK and pathogens, which may also increase.
internationally) could have an impact on the price More frequent summer droughts may reduce the success
of food consumed in London. rate of newly planted trees and put mature trees under
There is potential for community urban growing projects stress, potentially shortening the lifespan of many of
in London to be affected adversely by extreme weather, London’s mature street trees. This may have an adverse
but a warmer climate may also provide opportunities for impact on the cooling effect of urban tree-planting
them to grow new crops. programmes if drought resistant types are not used.
The main impacts in the case of flooding are likely The changing climate could mean that London’s green
to be disruption to the logistics of transporting and space becomes suitable for different tree species.
distributing food in the capital. London’s supply chains The Mayor of London produced the Right Trees in a
operate in a highly complex way, which means that they Changing Climate tool, which was designed to aid
are vulnerable to interruption. decision-making in planting regimes by incorporating
projected climate change. This tool is currently being
transferred to the Forestry Commission’s Forest
Research website, where users will be able to find
it from early 2012.
12 Climate UK/ London©Alamy
Trees in the right place, like other vegetation, intercept
rainwater and reduce the rate and scale of eventual run-
off. As a consequence, this reduces the risk of localised
storm water flooding. The sponginess of leaf litter
beneath broadleaved woodland can also improve water
retention and infiltration.
The role of trees in soil shrinkage and subsidence, and
the adequacy or otherwise of building foundations, needs
to be further understood and addressed, particularly
given the shrinkable nature of London Clay soils
(which is discussed further in the Built Environment
and Infrastructure section).
The CCRA reports that risk of wildfire is also expected
©GLA
to increase due to hotter, drier summers, particularly
towards the end of the century, and especially in the
south of the UK.
Climate UK/ London 13Health and Well-being
The impact of climate change on health can be looked at increase existing inequalities. In Table 1, some of the
under three headings: known health effects of weather are set out, which are
1. Direct impacts on health and health inequalities expected to be affected by climate change. 1
(positive and negative) Heat-related mortality currently accounts for around
2. Indirect impacts on health, affecting the wider 1,100 premature deaths (or deaths brought forward)
determinants of health (positive and negative) and per year in the UK, with London, followed by the South
health inequalities East, being the area worst affected. In our future climate
(without taking adaptation into account), heat-related
3. Direct effects on the delivery of health and social care
mortality and morbidity may increase more in large urban
services (including those people working within the
areas. This is partly as a result of the urban heat island
health and social care sector, and also the buildings
effect.
and infrastructure required to deliver these services).
Heat is also estimated to cause over 100,000 patient-
This report selects some examples from the first category
days in hospital per year. However, these figures can
of impacts for London. For a more detailed look at how
increase noticeably for exceptionally hot years such as
climate change is expected to impact on the health of
was experienced in 2003 and 2006, which may be the
Londoners, you can refer to the London Climate Change
norm by the 2050s.
Partnership’s report London’s Changing Climate: In
Sickness and in Health and the health section of the Premature deaths in London and the South East
Mayor’s Climate Change Adaptation Strategy. accounted for approximately one third of the total
number of premature deaths caused by heat in all
Climate change will have both positive and negative
of the scenarios that were considered by the CCRA.
effects on the health of Londoners. However, these
The differences are partially related to higher densities
impacts will not be distributed evenly, and are likely to
Health Outcome Known Effects of Weather/Climate
Heat stress, cold stress Deaths from heart- and lung-related diseases increase with hotter
and colder temperatures.
Heat-related illnesses (heat cramps, heat exhaustion and heat stroke) and
death increase during heatwaves.
Air pollution related morbidity Weather affects air pollution concentrations.
and mortality Weather affects the distribution, seasonality and production
of air-transported allergens.
Morbidity and mortality resulting Floods and windstorms cause direct effects (deaths and injuries), infectious
from weather disasters diseases, long-term mental health problems, and indirect effects (temporary
limitations on access to health and social care services).
Vector-borne diseases Higher temperatures shorten the development time of pathogens in vectors
and increase the potential transmission to humans.
Water- and food-borne diseases Risk of bacterial pathogens increases with rising temperature.
Increases in drought conditions may affect water availability and water
quality due to extreme low flows.
Extreme rainfall can affect transport of disease organisms into water supply.
Cataracts, skin cancers and sunburn More cloud-free days and higher temperatures may encourage potential risk
of over-exposure to UV radiation.
Table 4 - Health effects of weather/climate 2011 (LCCP/GLA)
14 Climate UK/ Londonof population in the south, although the main difference London has lower ground-level ozone concentrations
relates to generally higher temperatures in the more and related health impacts compared to its surrounding
southern regions. Relative to population size, the regions. This is because rural and suburban areas usually
mortality rate for London is approximately twice that experience higher concentrations of ozone than city
of the North East. centres. But despite lower levels of ozone in London,
The London Climate Change Partnership has been working a report by the Greater London Authority estimated
to tackle these issues through engaging with London’s that in 2008, around 4,300 deaths in London were
health and social care sector on the issue of adaptation, partly attributable to exposure to air pollution from
and the Mayor is implementing a strategy to cool the city other sources, an effect which is exacerbated by heat.
through urban greening (discussed further in the Natural In December 2010, the Mayor published an Air Quality
Environment section). Retrofitting of existing buildings Strategy to cut emissions from London’s transport
and heat-sensitive design of new buildings will also be network, homes and workplaces. These measures will
an important element in tackling the health impacts of significantly improve air quality in London.
rising temperatures in London. The CCRA reports that annual mean ozone concentrations
A positive aspect of climate change is that warmer in central London are expected to more than double
winters are expected to cause reductions in cold-related within the 2000-2050 period, mainly due to reductions
mortality and morbidity. These reductions are projected in projected NOx emissions. It is unclear what net effect
to be greatest in the South West and South East of this is likely to have on mortality and morbidity.
England, followed by London. UV exposure
Air Quality The CCRA reports that there is evidence that an increase
Climate change may reduce winter air pollution levels in UVB radiation flux associated with climate change,
but may increase summer air pollution. Wetter winters and potentially the incidence of skin cancers, may
will ‘wash’ the pollutants from the atmosphere. Higher be largest in southern England, with an increase in
summer temperatures, less rainfall and less cloud cover melanoma of up to 20 per cent possible by the 2080s.
are projected to increase the formation of ground level But despite solar UVB exposure associated with climate
ozone, and periods of little or no wind usually associated change being linked to melanoma skin cancer incidence
with heatwaves may mean that pollution in the city – and mortality, the relationship between future incidence
including particulate matter which is particularly harmful of skin cancer and environmental conditions is an
to health – will be less easily dispersed. extremely complex issue. Changes in social behaviour,
Higher concentrations of ground-level ozone are and changes in the stratospheric ozone layer, are also
produced during summer photochemical smog episodes, determinants of the level of risk.
which are caused by the interaction of oxides of nitrogen Flooding
(NOx) and volatile organic compounds in the presence of London’s increase in flood risk will also have health
sunlight. These can have detrimental effects on human impacts. The long-lasting health impacts of flooding,
health, leading to an increase in hospital admissions and including psychological stress, are well-documented and
premature deaths. can be very severe, especially when those affected are
displaced from their homes for long periods of time. 2
For people living in areas of high flood risk, there are
also likely to be social and economic impacts, which can
negatively affect the wider determinants of health.
1 - London Climate Change Partnership, 2010 and London Climate
Change Adaptation Strategy, 2011.
2 - London Climate Change Partnership, 2010.
Climate UK/ London 15Business
©Alamy
The main threats to business activity within London Loss of Productivity
are likely to be flooding and heat. Water shortage may As indicated in the figure on p17, London’s businesses
also affect the running of businesses reliant on making are likely to be particularly impacted by loss of
industrial water abstractions or discharges. Extreme productivity due to overheating. London’s businesses
weather is likely to cause disruption to supply chains, are also expected to face the greatest increase in energy
staff availability, increased damage to commercial costs for cooling as they try to counteract this trend (as
property and business continuity. As well as these discussed in the Built Environment section).
local impacts, London’s businesses are also likely to be
affected by global extreme weather events because it 1 - London and Partners, Key Visitor Statistics, 2010.
is a global centre for the financial sector. This provides 2 - Hamilton and Tol, 2007.
opportunities as well as challenges for businesses.
16 Climate UK/ LondonFlooding Impact on Mortgage Market
Climate change is expected to cause an increase in
likelihood of flooding to properties throughout the UK
from all sources. As the probability of flooding increases,
insurance for properties that flood relatively frequently
may be increasingly difficult or expensive to obtain.
If mortgage holders were unable to renew their buildings
insurance due to an increase in flood risk, it would leave
both lender and borrower exposed to an increased risk of
loss and potential invalidation of the mortgage. Whether
affordable flooding cover can be retained as a standard
aspect of buildings insurance is, therefore, extremely
important to the working of the mortgage market and
the wider housing market.
The Community Resilience to Extreme Weather (CREW)
project has also projected that an increase in flood risk
due to climate change could have a negative impact
on property prices. This may mean an increase in the
incidence of people in negative equity in areas that have
been badly flooded.
Tourism
London is a world tourism destination, which sees 26
million visitors annually, worth £11.2 billion to its
economy 1 (London & Partners, 2010). The CCRA cites
modelling2 which projects that increasing temperatures
may cause a shift in the regional distribution of tourists
(from both the UK and internationally) under future
climate change projections. By 2080, the general pattern
for both domestic and international tourists is that Regional Variation of the lost productivity due to overheating
(UK CCRA 2012)
the south of England will have a reduced market share,
whilst Scotland, the north of England and Wales will
have an increased market share. In the high scenario,
the drop in market share is disproportionately high for
London, compared to other UK regions. In absolute
terms, however, all regions are expected have increasing
numbers of tourists during the 21st century.
Climate UK/ London 17For further information please contact:
London Climate Change Partnership
City Hall
The Queen’s Walk
London
SE1 2AA
W: http://www.london.gov.uk/lccp
T: 0207 983 5781
E: juliette.daniels@london.gov.uk
This information pack was commissioned by the Department for Environment, Food and Rural Affairs (Defra) to
coincide with the publication of the UK CCRA 2012. The content of this pack represents the initial interpretation of
the London Climate Change Partnership drawing on the CCRA and other local evidence.
18 Climate UK/ LondonYou can also read