AGEING AND UNPREPARED: ENERGY IN NEW SOUTH WALES - CLIMATECOUNCIL.ORG.AU - Climate Council
←
→
Page content transcription
If your browser does not render page correctly, please read the page content below
AGEING AND
UNPREPARED:
ENERGY IN NEW
SOUTH WALES

CLIMATECOUNCIL.ORG.AU
Thank you for
supporting the
Climate Council.
The Climate Council is an independent, crowd-funded organisation
providing quality information on climate change to the Australian public.

We would like to thank the Australian Communities Foundation for their
support in producing this report.

    Published by the Climate Council of Australia Limited
    ISBN:    978-1-925573-87-9 (print)
             978-1-925573-86-2 (digital)
    © Climate Council of Australia Ltd 2019                                         Louis Brailsford
                                                                                    Researcher
    This work is copyright the Climate Council of Australia Ltd. All material
    contained in this work is copyright the Climate Council of Australia Ltd
    except where a third party source is indicated.
    Climate Council of Australia Ltd copyright material is licensed under the
    Creative Commons Attribution 3.0 Australia License. To view a copy of this
    license visit http://creativecommons.org.au.
    You are free to copy, communicate and adapt the Climate Council of
    Australia Ltd copyright material so long as you attribute the Climate Council   Dr Annika Dean
    of Australia Ltd and the authors in the following manner:                       Senior Researcher

    Ageing and Unprepared: Energy in New South Wales.
    Authors: Louis Brailsford, Annika Dean, Greg Bourne and Andrew Stock.
    We would like to thank Tim Buckley (IEEFA) and David Leitch (ITK Services)
    for their thorough reviews.

                                                                                    Greg Bourne
    —                                                                               Climate Councillor

    Cover image: ‘Bayswater power station vertical’ by Jeremy Buckingham
    licensed under CC BY 2.0.
    This report is printed on 100% recycled paper.

         facebook.com/climatecouncil                 info@climatecouncil.org.au     Professor Andrew Stock
                                                                                    Climate Councillor
         twitter.com/climatecouncil                  climatecouncil.org.au
CLIMATE COUNCIL                      i

Contents
Key Findings..................................................................................................................................................................................... ii

1.     New South Wales - From a leader to a laggard.................................................................................................................1

2.     New South Wales once led the world in climate action............................................................................................... 4

3.     Today, New South Wales is a climate laggard, heavily reliant on polluting coal...................................................7

4.     Policies to tackle climate change in New South Wales are falling short............................................................... 19

5.     Climate impacts in New South Wales.............................................................................................................................. 24

6.     Conclusion: New South Wales has some catching up to do..................................................................................... 29

References....................................................................................................................................................................................... 30

Image Credits................................................................................................................................................................................. 33
ii    AGEING AND UNPREPARED:
      ENERGY IN NEW SOUTH WALES

     Key Findings
     1            2
     New South Wales was once a world leader on          New South Wales is responsible for more
     climate action, but over the past five years it     greenhouse gas pollution than any other state
     has become a laggard.                               or territory and continues to rely on heavily
                                                         polluting coal and unreliable gas power
     ›› New South Wales introduced the world’s first     stations.
        emissions trading scheme in 2003, which over
        10 years reduced greenhouse gas pollution by     ›› New South Wales has Australia’s oldest coal
        an estimated 144 million tonnes. The scheme         fleet and is home to five operating coal power
        concluded in 2012.                                  stations; collectively they produced 82% of the
                                                            state’s electricity in 2017.
     ›› Over the past five years South Australia, the
        Australian Capital Territory and Tasmania have   ›› It is risky to rely on old coal power stations
        led the country on renewable energy progress,       because they become increasingly unreliable
        while New South Wales has consistently              with age.
        remained at the back of the pack.
                                                         ›› New South Wales has excellent wind and solar
     ›› New South Wales used to have strong emissions       resources; however, they account for just 6% of
        reduction targets to reduce greenhouse gas          the electricity generated in New South Wales.
        pollution but these targets were dropped; the
        state planned to introduce a renewable energy
        target, but it was never implemented.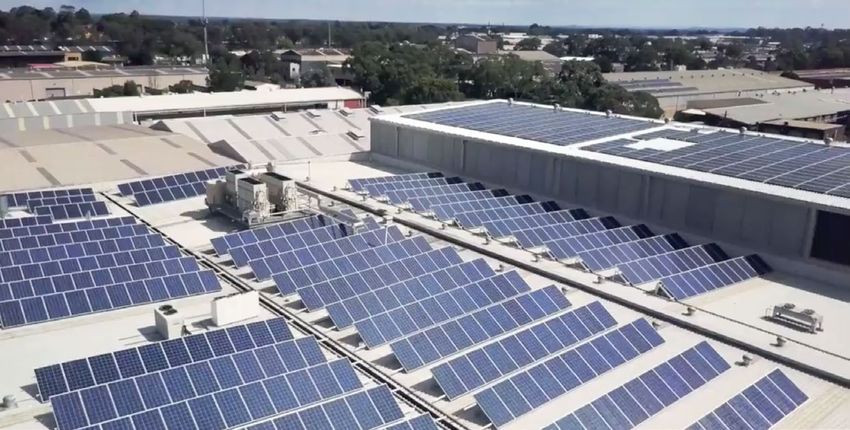
KEY FINDINGS    iii

3
Current climate policies in New South Wales
                                                      4
                                                      New South Wales is highly exposed to the
are inadequate, although local councils are           impacts of climate change.
stepping up in the face of state government
inaction.                                             ›› Climate change, driven by the burning of coal, oil
                                                         and gas, is already affecting New South Wales.
›› New South Wales does not have a comprehensive
   policy or target to encourage new renewable        ›› Extreme heatwaves led to a 10% increase in both
   energy generation, nor does it have policies to       deaths and ambulance callouts in New South
   enable the state to reach its net zero emissions      Wales between 2005 and 2015.
   target in 2050.
                                                      ›› Damages from extreme weather events cost New
›› In the past 12 months the state has taken some        South Wales $3.6 billion per year and this figure
   positive steps to encourage renewable energy          is likely to rise as these events, driven by climate
   and storage technologies, further action is           change, become more frequent and severe.
   required.
                                                      ›› The cheapest and fastest way for New South
›› There is massive potential in New South Wales         Wales to reduce its greenhouse gas pollution
   for new jobs and investment in a renewable            would be to progressively replace the state’s coal
   energy future.                                        power stations with renewable energy like wind
                                                         and solar, with storage.
›› Local councils like Lismore, Newcastle and
   Musswellbrook are all leaders on climate action.

                                                                                    climatecouncil.org.au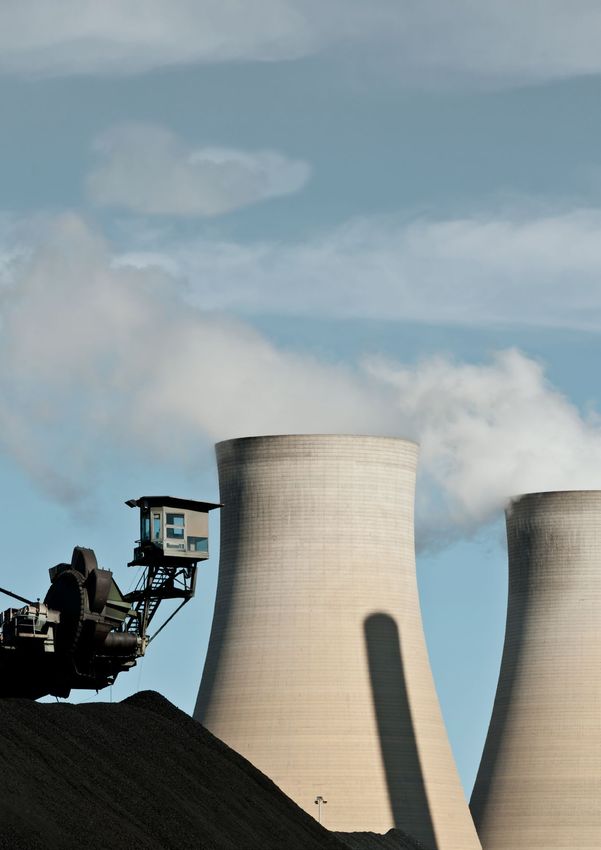
1   AGEING AND UNPREPARED:
    ENERGY IN NEW SOUTH WALES

    1.          New South Wales -
                From a leader to a
                laggard
                Over a decade ago, the state of New      Over the past five years, the Climate Council
                South Wales had world-leading climate    has been tracking the renewable energy
                policies. In 2003 New South Wales        progress of Australia’s states and territories.
                introduced the world’s first emissions   Some states and territories, like Tasmania
                trading scheme - the Greenhouse          and South Australia have led the pack over
                Gas Abatement Scheme – along with        this period, or even the world in the case
                mandatory emissions reduction targets    of South Australia. Others, like Victoria and
                (IPART 2013). These policies were        Queensland, have been catching up. New
                later replaced by Australia’s national   South Wales has remained consistently at the
                Carbon Pricing Mechanism when it         back of the pack, practically standing still as
                commenced operation in 2012.             the majority of states and territories raced
                                                         ahead (Climate Council 2018a).

                                                         New South Wales has fantastic renewable
                                                         energy resources (Department of Planning
                                                         and Environment 2018). Private investors
                                                         have recognised this, with New South Wales
                                                         home to a range of large-scale wind and
                                                         solar farms, including the Griffith solar farm
                                                         and the Silverton wind farm (Clean Energy
                                                         Regulator 2018b). In 2018, eight new wind
                                                         and solar farms began operating (Clean
                                                         Energy Regulator 2018b). Most of these new
                                                         wind and solar projects have been built as
                                                         part of the Federal Government’s renewable
                                                         energy target, which is expected to be met
                                                         by 2020. Other projects like the Crookwell
                                                         2 wind farm were contracted under the
                                                         Australian Capital Territory Government’s
                                                         100% renewable energy target (ACT
                                                         Government 2016).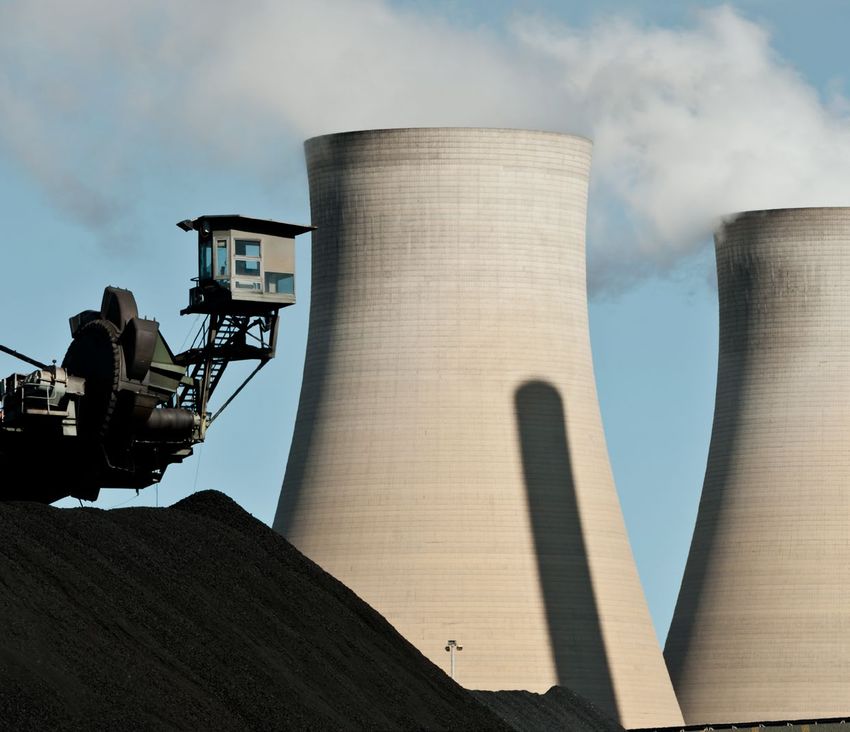
CHAPTER 01                 2
                                                                   NEW SOUTH WALES - FROM A LEADER TO A LAGGARD

New South Wales was once a
world leader on climate action.

The New South Wales public is very                     However, despite recent renewable energy
supportive of renewable energy, with 83%               investment, New South Wales risks being
wanting the state to generate more of its              left behind the other states and territories.
electricity with renewable energy (New South
Wales Government 2015). Local government               New South Wales is home to Australia’s
is also backing renewable energy, with more            oldest fleet of coal power stations and
than twenty local councils supporting new              has limited state government policies to
solar farms in the state to help reduce their          encourage more wind and solar projects in
power bills (refer to Figure 1).                       the state beyond 2020. There is a serious risk
                                                       that New South Wales will be caught short
                                                       as coal power stations close or unexpectedly
                                                       fail in extreme weather events.

Figure 1: The 100kW Lismore floating solar farm, the largest to-date in Australia. Lismore City Council and other councils in
New South Wales are backing renewable energy to help reduce their power bills and greenhouse gas pollution.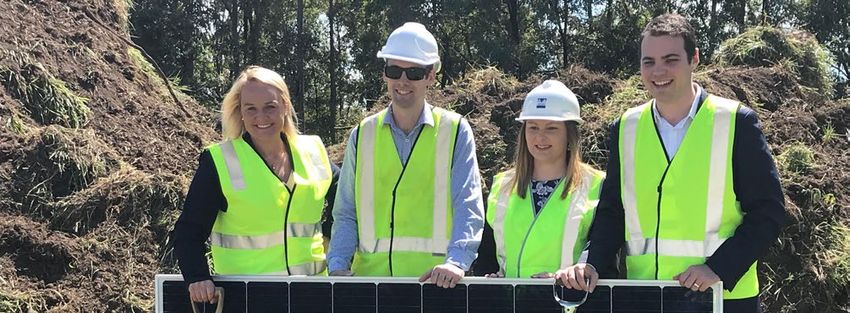
3   AGEING AND UNPREPARED:
    ENERGY IN NEW SOUTH WALES

    New South Wales has                                       State and territory leadership will continue to
                                                              be critical to supporting investment in new

    remained at the back                                      large-scale wind, solar and storage projects
                                                              in Australia. This is particularly important in

    of the pack for action                                    the absence of any credible national climate
                                                              and energy policy to succeed the Renewable

    on renewable energy                                       Energy Target from 2020. New South Wales
                                                              has an opportunity to catch up with other

    over the past five years.                                 states and territories but this would require
                                                              strong action. Otherwise New South Wales
                                                              could largely forfeit this opportunity to
                                                              Victoria, Queensland and South Australia,
                                                              missing out on the associated employment
                New South Wales is highly exposed to          and investment opportunities in the state.
                the impacts of climate change. Rising
                greenhouse gas pollution, primarily from      This report begins by reflecting on New South
                the burning of fossil fuels like coal and     Wales’ past climate leadership in the 2000s
                gas, is driving up global temperatures and    before taking stock of the current situation.
                worsening extreme weather events. In          In 2019 after almost a decade of stagnation,
                recent decades there has been an increase     New South Wales has an electricity sector still
                in extreme fire weather and a lengthening     dominated by ageing coal power stations and
                of the bushfire season across New South       unreliable gas power stations while wind and
                Wales (CSIRO and BoM 2018). Heatwaves         solar make up a relatively small proportion of
                have increased in duration, frequency         power generation.
                and intensity in parts of New South Wales
                (Climate Council 2017; OEH 2015).             The report then outlines current policies in
                                                              place to encourage investment in energy
                Extreme heatwaves have already led to a       storage and new transmission in New South
                10% increase in both deaths and ambulance     Wales.
                callouts in New South Wales between 2005
                and 2015 (Jegasothy et al. 2017). By 2030,    The next section outlines the vulnerability
                maximum temperatures are expected to rise     of New South Wales to climate change and
                by 0.7°C in New South Wales and continue      the climate impacts the state may face if
                to rise by 2.1°C by 2070 (compared to the     greenhouse gas pollution is not reduced. The
                baseline modelled climate between 1990 and    report concludes by encouraging New South
                2009) (NARCliM 2019). The impact of climate   Wales to rise to the challenge and lead with
                change will become even more intense in       strong policies to tackle climate change and
                coming decades if greenhouse gas pollution    scale-up renewable energy once again.
                is not reduced.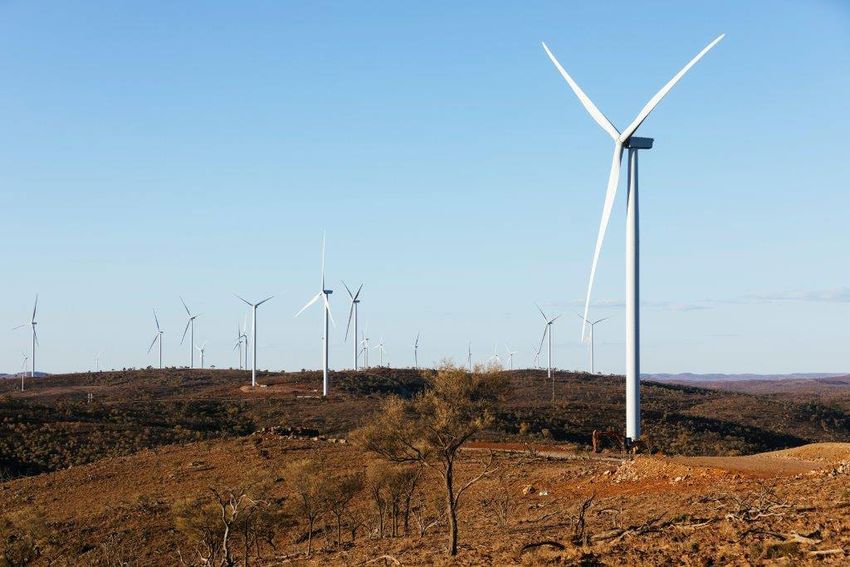
CHAPTER 02         4
                               NEW SOUTH WALES ONCE LED THE WORLD IN CLIMATE ACTION

2. New South Wales
   once led the world
   in climate action
      In 2003, New South Wales led the      Under this policy, mandatory emissions
      world by introducing the first        abatement targets were set and certificates
      mandatory emissions trading scheme    were available for activities such as
      in the world – the Greenhouse Gas     renewable energy generation, reduced
      Reduction Scheme (IPART 2013).        emissions from existing generators and large
                                            energy consumers, carbon sequestration or
                                            improved energy efficiency (IPART 2013).

                                            After operating for nearly a decade, the
                                            Greenhouse Gas Reduction Scheme was
                                            closed in 2012 when Australia’s national
                                            Carbon Pricing Mechanism commenced
                                            operation. However, no new carbon pricing
                                            initiatives have been proposed in New South
                                            Wales since the Carbon Pricing Mechanism
                                            was revoked. Over its ten years of operation,
                                            it is estimated the state’s Greenhouse Gas
                                            Reduction Scheme prevented around 144
                                            million tonnes of carbon dioxide from being
                                            emitted. Overall compliance with the scheme
                                            by electricity producers and consumers was
                                            very high (IPART 2013).

New South Wales introduced the world’s
first emissions trading scheme in 2003.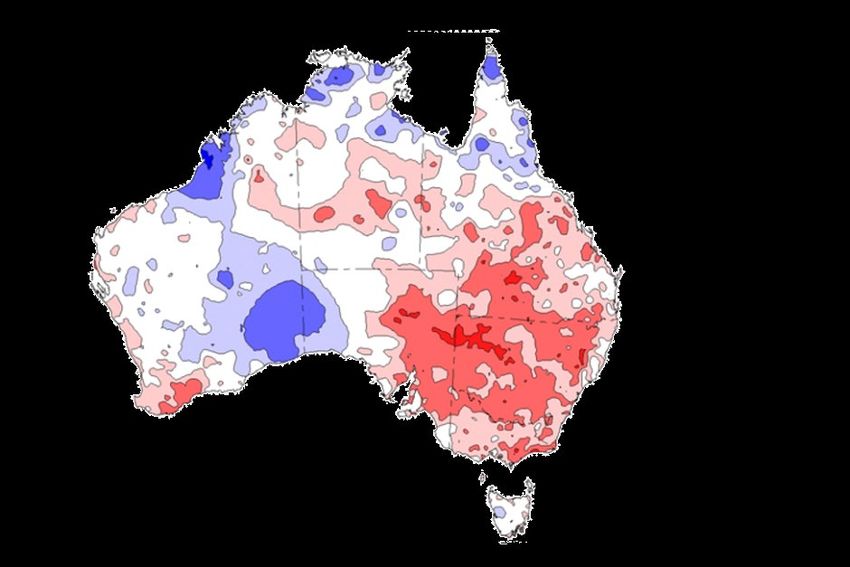
5   AGEING AND UNPREPARED:
    ENERGY IN NEW SOUTH WALES

    New South Wales used to have strong
    emissions reduction targets but these
    were dropped; it also planned to
    introduce a renewable energy target,
    but it was never implemented.

                The New South Wales state government        In 2006, the New South Wales Government
                also set targets to reduce greenhouse gas   also planned to introduce a state-wide
                pollution to 2000 levels by 2025 and 60%    renewable energy target requiring 10%
                below 2000 levels by 2050 (New South        of electricity consumed in the state to be
                Wales Government 2006). In 2010, these      generated by renewable energy by 2010 and
                emissions reduction targets were removed    15% by 2020 (New South Wales Government
                in the process of drafting the new State    2006). This target was not implemented, as
                Plan NSW 2021 (ABC 2010; New South          the Federal Government in 2009 extended
                Wales Government 2011).                     the national Renewable Energy Target to
                                                            2020 and increased the target to 41,000GWh
                                                            of renewable electricity (from large-scale
                                                            renewable energy, with the aim of achieving
                                                            at least 20% renewable energy; Clean Energy
                                                            Regulator 2016). In May 2015 this federal
                                                            target was scaled back to 33,000GWh by 2020.
CHAPTER 02 6
NEW SOUTH WALES ONCE LED THE WORLD IN CLIMATE ACTION
BOX 1: THE PEOPLE OF NEW SOUTH WALES SUPPORT RENEWABLE ENERGY
Four in every five people in New South Wales surveyed stated that New South Wales should
think the state should use more renewable be producing more electricity from renewable
energy, like wind and solar. energy, compared to just 3% who thought
they should use less and 11% who supported
In 2015, the News South Wales Government’s maintaining current levels of renewable
Office of Environment and Heritage released energy. Participants identified benefits to the
the results of a survey on community attitudes environment (80%) and lower cost (37%) as the
to renewable energy in the state. The survey main advantages of renewable energy (New
found that 91% of the 2,000 survey participants South Wales Government 2015). Since this
support the use of renewable energy to generate survey was conducted, the cost of renewable
electricity in New South Wales. 83% of people energy has more than halved.
83% of people in New South Wales want
the state to use more renewable energy.
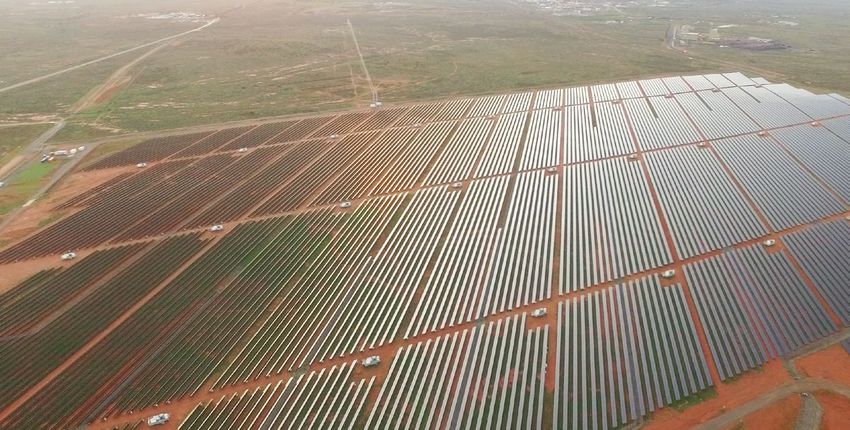
Figure 2: The people of New South Wales support renewable energy and want to see the state produce more electricity from
wind and solar, such as the Broken Hill solar farm.7 AGEING AND UNPREPARED:
ENERGY IN NEW SOUTH WALES
3. Today, New South
Wales is a climate
laggard, heavily reliant
on polluting coal
NEW SOUTH WALES’ ELECTRICITY per capita emissions were lower than
IS PREDOMINANTLY SUPPLIED FROM those of Western Australia, Queensland,
FOSSIL FUELS Northern Territory and Victoria, per capita
emissions were above South Australia,
New South Wales is Australia’s most Tasmania and the Australian Capital
populous state and is responsible for Territory (Department of the Environment
more greenhouse gas pollution than any and Energy 2018a), all of whom have been
other state or territory (Department of the renewable energy leaders under Climate
Environment and Energy 2018a). Council metrics (refer to Box 4).
In 2016, total emissions from New South The cheapest and quickest way for New
Wales were 144 million tonnes of carbon South Wales to reduce its greenhouse gas
dioxide, excluding land use emissions. pollution would be to progressively replace
Electricity generation produced 51.8 million the state’s ageing coal power stations with
tonnes of carbon dioxide or 36% of the state’s renewable energy like wind and solar, with
emissions (Department of the Environment storage (BNEF 2018), complemented by the
and Energy 2018a). While New South Wales’ state’s existing hydro generation.
New South Wales is responsible
for more greenhouse gas pollution
than any other state or territory.CHAPTER 03 8
TODAY, NEW SOUTH WALES IS A CLIMATE LAGGARD, HEAVILY RELIANT ON POLLUTING COAL
NEW SOUTH WALES HAS Table 1: New South Wales generated a greater
AUSTRALIA’S OLDEST COAL FLEET proportion of its electricity from coal than any of
Australia’s other coal producing states in 2017.
New South Wales is home to five operating Proportion of electricity
coal power stations. These five power generation from coal
stations collectively produced 82% of State power stations in 2017
New South Wales’ electricity in 2017 New South Wales 82%
(Department of the Environment and
Victoria 78%
Energy 2018b). This means New South
Wales generated a greater proportion of its Queensland 73%
electricity from coal than any other state Western Australia 27%
in 2017 (refer to Table 1).
Source: Department of the Environment and
Energy (2018b).
New South Wales also has some of
Australia’s oldest coal power stations.
The state is home to four of Australia’s six
oldest coal power stations (AEMO 2018b;
APH 2017). The Liddell coal power station
is 47 years old and scheduled to close by
2022 (refer to Figure 3). Three other coal
power stations – Vales Point, Eraring and
Bayswater – are also due to close within
the next 15 years (refer to Table 2; AEMO
2018b; APH 2017).
Figure 3: The Liddell power station (pictured) is the oldest coal power station in Australia. It is scheduled to close by 2022.9 AGEING AND UNPREPARED:
ENERGY IN NEW SOUTH WALES
New South Wales has up and down (AEMO 2017a). These power
stations cannot be depended upon to provide
Australia’s oldest fleet a reliable supply of electricity. Extreme
weather events will increase electricity supply
of coal power stations. risks. The New South Wales Chief Scientist
found that the ageing coal fired power
station fleet in New South Wales “poses risks
to reliability and security across the NEM…”
(NSW Chief Scientist & Engineer 2017).
Relying on a fleet of very old coal power Coal power stations are already breaking
stations to power Australia’s largest state down in warmer months. The Eraring,
is risky. Ageing coal power stations are Bayswater and Liddell power stations all
increasingly unreliable and prone to broke down at least once between December
breaking down in extreme weather events, 2018 and February 2019, with the Eraring
especially heatwaves. Coal power stations power station breaking down three times.
are slow to respond to changes in supply (The Australia Institute 2019).
and demand and struggle to quickly ramp
Table 2: New South Wales has five operating coal power stations. Four of these power stations are approaching the end of
their life as they become increasingly unreliable and unsafe to operate after 40 years of operation, increasingly prone to
unexpected failure.
Capacity Capacity Factor Emissions Intensity (2016-17)
Power Station (megawatt (MW)) Age in 20191 (2016-17) (t CO2-e/MWh)
Liddell 1,6802 47 49% 0.93
Vales Point 1,320 41 59% 0.85
Eraring 2,880 37 57% 0.86
Bayswater 2,640 37 56% 0.89
Mt Piper 1,400 26 53% 0.87
1
Where units at power stations were commissioned over several years, the age of the oldest unit has been listed.
2
Originally rated at 2,000MW, the Liddell power station has been de-rated to an effective capacity of 1,680MW due to its old age.
Source: APH (2017); Clean Energy Regulator (2018a); McConnell (2018).Figure 4: New South Wales has five operating coal power stations, which supply 82% of New South Wales’ electricity.
NEW SOUTH WALES’
AGEING COAL #1
CLUNKERS LIDDELL
Age 47
Capacity (MW) 1,680
Due to retire in1 2022
Breakdowns in 20182 11
#2
VALES POINT
Age 41
Capacity (MW) 1,320
Due to retire in 2028
Breakdowns in 2018 4
#3
ERARING
Age 37
Capacity (MW) 2,880
Due to retire in 2032
Breakdowns in 2018 3
#4
BAYSWATER
Age 37
Capacity (MW) 2,640
Due to retire in 2032
Breakdowns in 2018 3
#5
MT PIPER
Age 26
END OF THE LINE
Capacity (MW) 1,400
Due to retire in 2043
Breakdowns in 2018 1
New South Wales has an ageing fleet of
five coal power stations. Four are due
to retire in the next fifteen years.
1 Coal power stations reach the end of their design life after 50 years of operation. Coal power stations should be retired at this age.
2 Breakdowns refer to 'unit trips', where a unit at a power station suddenly stops generating electricity.11 AGEING AND UNPREPARED:
ENERGY IN NEW SOUTH WALES
BOX 2: HOW TO POWER INDUSTRY WITH RENEWABLE
ENERGY: NEW SOUTH WALES VERSUS SOUTH AUSTRALIA
The Tomago Aluminium smelter is New South In 2017, the GFG Alliance bought South Australia’s
Wales’ largest electricity consumer and reliant Whyalla Steelworks and has since developed a
on unreliable coal power stations for electricity. plan to power the steelworks on renewable energy.
Renewable energy and storage can provide GFG Alliance plans to increase the production
the Tomago smelter and other large industrial capacity of the steelworks to 1.8 million tonnes
users with a clean, affordable and reliable supply and potentially 10 million tonnes in the future.
of electricity, as will be demonstrated by the The initial expansion of the steelworks is
steelmakers GFG Alliance in South Australia. expected to cost $600 million and create 2,500
jobs (RenewEconomy 2018c). Underpinning
Due to its size, the Tomago Aluminium smelter this expansion is renewable energy and storage.
occasionally has its electricity supply reduced Construction will begin this year on the 280MW
when coal and gas power stations break down Cultana solar farm, with investments in more
causing a shortage of electricity in the state. solar, batteries and pumped hydro possible in the
On 10 February 2017, during a period of very future (RenewEconomy 2018c).
high electricity demand, the Australian Energy
Market Operator (AEMO) reduced electricity Wind and solar are the cheapest sources of new
supply to the Tomago smelter (AEMO 2017b). energy generation and far cheaper than building a
This was primarily due to problems at the state’s new coal power station (BNEF 2018). Coupled with
coal and gas power stations. The Colongra storage, these technologies can cost effectively
gas power station was unable to start when and securely power the significant energy
requested by AEMO and the Tallawarra gas requirements of heavy industry (ABC 2017).
power station experienced a fault that meant it
could not generate electricity when it was most
needed (AEMO 2017b). Figure 5: The Vales Point coal power station. The power
station is the second oldest in New South Wales and one
of four coal power stations scheduled to close in the
On another occasion in June 2018, the smelter
state by 2035.
shut down one of its potlines for an hour
on two different days due to outages at the
Liddell, Bayswater and Vales Point coal power
stations (The Newcastle Herald 2018). Three of
Bayswater’s four units were not operating and
the entire Vales Point power station was offline
(refer to Figure 5; The Newcastle Herald 2018).
The Tomago smelter could reduce its reliance
on unreliable coal and gas generation and
dramatically reduce the carbon intensity of its
electricity purchases by following the lead of
GFG Alliance in South Australia and Sun Metals
zinc refinery in Queensland, contracting for
new renewable energy and storage investments
(RenewEconomy 2018d).CHAPTER 03 12
TODAY, NEW SOUTH WALES IS A CLIMATE LAGGARD, HEAVILY RELIANT ON POLLUTING COAL
NEW SOUTH WALES HAS AN
UNRELIABLE GAS FLEET
Two gas power
New South Wales has four gas fired power
stations broke down
stations and another small power station
that runs on fuel oil (refer to Table 3).
or couldn’t start
These gas and oil power stations produce
significantly less electricity than coal, but in the February
New South Wales is heavily reliant on them
to supply electricity during periods of 2017 heatwave in
New South Wales,
very high electricity demand, such as hot
summer evenings.
Three of New South Wales’ gas power leading to blackouts.
stations were built ten years ago. Even so,
these power stations do not have a good
track record of providing a reliable supply of
electricity during heatwaves. The trebling
of domestic gas prices this decade has 2017b). This was primarily due to problems
also dramatically eroded the commercial at the state’s coal and gas power stations.
viability of these gas fired power stations. Gas power stations performed especially
poorly. Snowy Hydro’s Colongra gas power
On 10 February 2017 during a period of station, the largest in New South Wales,
very high electricity demand, AEMO was unable to start when requested by
reduced electricity supply to the Tomago AEMO and the Tallawarra gas power station
Aluminium smelter in New South Wales as experienced a fault that meant it could
there was a shortage of electricity available not generate electricity when it was most
to meet demand (refer to Box 2; AEMO needed (AEMO 2017b).
Table 3: New South Wales has four gas fired power stations and a small power station that runs on fuel oil. Although some of
these power stations are just 10 years old, they have proven to be unreliable in heatwaves.
Emissions Intensity
Power Stations Fuel Type/Technology Capacity (MW) Age in 2019 (2016-17) (t CO2-e/MWh)
Smithfield Energy Facility Gas, combined cycle 171 23 0.47
Colongra Gas, open cycle 724 10 0.66
Uranquinty Gas, open cycle 664 10 0.61
Tallawarra Gas, combined cycle 435 10 0.39
Hunter Valley Turbines Fuel oil, open cycle 50 ? 1.52
Source: AEMO (2018a); Clean Energy Regulator (2018a). Scheduled generation only.13 AGEING AND UNPREPARED:
ENERGY IN NEW SOUTH WALES
NEW SOUTH WALES HAS A New South Wales has globally significant
RELATIVELY LOW PROPORTION wind and solar resources of an excellent
OF WIND AND SOLAR quality (Department of Planning and
Environment 2018). Eight new renewable
New South Wales generated 16% of its energy plants began operation in New South
electricity from renewable energy in 2016-17 Wales in 2018, including five solar farms and
(Department of the Environment and Energy three wind farms (refer to Table 5 and Figure
2018b). The bulk of the state’s renewable 6; Clean Energy Regulator 2018b).
energy comes from old hydro power stations,
which provided almost 9% of the state’s A further 20,000MW of renewable energy
electricity in 2016-17. In contrast, wind and capacity has received or is awaiting planning
solar generated just 6% of New South Wales’ approval from the state government (New
electricity. The remainder was generated South Wales Government 2018a). This is
by biogas and biofuels (Department of the twice the capacity of the state’s entire fleet of
Environment and Energy 2018b). coal power stations. Ultimately many of these
projects will never be built as 20,000MW is
Over the five-year period from 2011-12 far more new capacity than New South Wales
to 2016-17, the share of wind and solar needs. In order for some of these projects
electricity generation increased by just 4% to be built, there must be clear policies to
(refer to Table 4). This is a smaller increase encourage renewable energy and enable
than other states like South Australia (20%), investment in new transmission and energy
Tasmania (8%) and Victoria (6%). storage capacity.
Wind and solar generate just 6% of
the electricity in New South Wales.
Table 4: New South Wales’ wind and solar generation share increased from just 2% to 6% between 2011-12 and 2016-17.
Wind and solar generation as Wind and solar generation as
a proportion of total electricity a proportion of total electricity Increase in wind and
State generation 2011-12 (%) generation 2016-17 (%) solar generation
South Australia 26 46 +20
Tasmania 4 12 +8
Victoria 3 9 +6
New South Wales 2 6 +4
Queensland 1 4 +3
Northern Territory ~0 3 +3
Western Australia 5 7 +2
Source: Department of the Environment and Energy (2018b).CHAPTER 03 14
TODAY, NEW SOUTH WALES IS A CLIMATE LAGGARD, HEAVILY RELIANT ON POLLUTING COAL
Table 5: Eight wind and solar farms in New South Wales began operating in 2018*.
Project Technology Capacity (MW) Month of Accreditation
Silverton wind farm Wind 199 May 2018
Coleambally solar farm Solar 189 September 2018
Bodangora wind farm Wind 113 August 2018
Crookwell 2 wind farm Wind 96 June 2018
Manildra solar farm Solar 56 May 2018
Griffith solar farm Solar 35 January 2018
South Keswick solar farm Solar 18 May 2018
Narromine solar farm Solar 11 April 2018
* As at 31st December 2018; table only includes projects with a capacity above 2MW.
Source: Clean Energy Regulator (2018b).
Figure 6: The Silverton wind
farm, owned by the Powering
Australian Renewables Fund
(PARF), is the largest of eight
wind and solar farms that
began operating in New
South Wales in 2018.15 AGEING AND UNPREPARED:
ENERGY IN NEW SOUTH WALES
Fewer renewable energy projects are being 2018). This is higher than Victoria (15.6%)
built in New South Wales than other states. but it is significantly lower than Queensland
In 2018, seventeen wind and solar farms and South Australia, where over 30% of
began operating in Queensland and eleven households have rooftop solar (APVI 2018).
wind and solar farms began operating in
Victoria, compared to just eight in New
South Wales (excluding projects below 2MW;
Clean Energy Regulator 2018b). Table 6: Despite having excellent wind and solar
resources, New South Wales has less committed
new wind and solar capacity than Queensland or
New South Wales also has less committed Victoria.
renewable energy capacity than these states
(this includes projects that have reached Capacity of committed wind
financial close or are under construction) State and solar projects (MW)
(Clean Energy Regulator 2018b). 2,050MW
Victoria 2,050
of renewable energy is committed in
Victoria and 1,133MW is committed in Queensland 1,133
Queensland, compared to 983MW in New New South Wales 983
South Wales (refer to Table 6; Clean Energy
Regulator 2018b). *As at 31st December 2018
Source: Clean Energy Regulator (2018b)
New South Wales could also do more to Note: Committed projects are large-scale
encourage rooftop solar. 17.8% of New South renewable energy projects that have received
all development approvals and reached a final
Wales households have rooftop solar (as investment decision according to the commercial
of October 2018; refer to Figure 7; APVI understanding of the term.
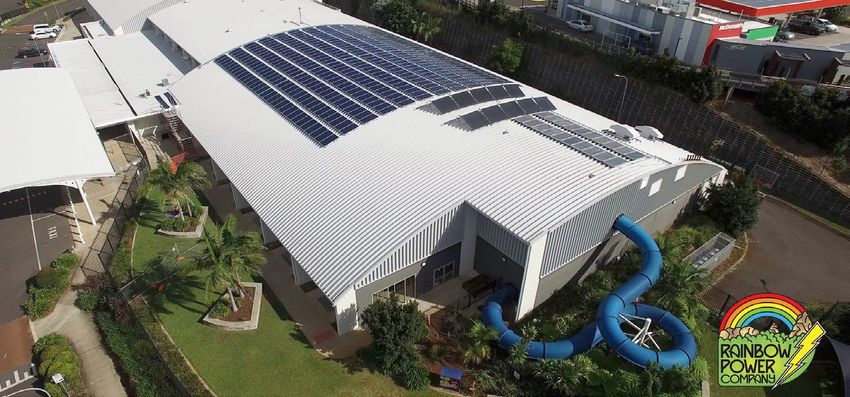
Figure 7: Households and businesses around Australia are installing rooftop solar to reduce their power bills. Bakers
Maison has installed a 100kW rooftop solar system on its business in Sydney (pictured).CHAPTER 03 16
TODAY, NEW SOUTH WALES IS A CLIMATE LAGGARD, HEAVILY RELIANT ON POLLUTING COAL
BOX 3: WHAT EFFECT WILL SNOWY 2.0 HAVE ON GREENHOUSE GAS POLLUTION?
Like all other storage technologies, pumped With such low efficiency, a significant amount
hydro is a net energy consumer – energy of the electricity supply for Snowy 2.0 needs
storage technologies consume more electricity to come from renewable energy for the project
from the grid than they give back. To deliver to be less polluting than a peaking gas plant.
on Australia’s Paris Agreement commitments However, New South Wales (where Snowy 2.0 is
to reduce greenhouse gas pollution in line proposed to be located) currently has very low
with keeping global temperatures well below levels of renewable energy and electricity supply
2°C, it is vital that the electricity that storage from renewable energy is highly unlikely to
technologies use from the grid is not generated reach 60% by the time Snowy 2.0 opens in 2025.
from polluting coal or gas power stations. This means Snowy 2.0 could be as polluting – if
not more so – than a gas peaking power station
Most conventional pumped hydro systems (because the electricity to pump the water
have a round-trip efficiency of around 80%. comes largely from coal at off peak times).
This means they use 20% more electricity than
they generate. This is because pumped hydro To reduce greenhouse gas pollution from
consumes electricity in order to pump the water the electricity sector, large-scale pumped
uphill again to recharge the system (ESA 2017) hydro should be constructed alongside
and friction and other energy losses occur major investments in new renewable energy.
when the water passes through pipes and Otherwise, pumped hydro could increase
pumps at high velocities. However, the Snowy energy demand leading to higher greenhouse
2.0 project, with a capacity of 2,000MW, has a gas pollution. For the Snowy 2.0 scheme,
far lower proposed round-trip efficiency at just this is only assured if New South Wales has a
67% at peak power. No adequate explanation much higher level of renewable energy than it
for this extremely inefficient design proposal currently does.
has been provided. This means Snowy 2.0
would use one third more electricity than
it would generate (Snowy Hydro 2017). This
doesn’t include losses from transmission,
which would reduce efficiency even further.17 AGEING AND UNPREPARED:
ENERGY IN NEW SOUTH WALES
BOX 4. THE RENEWABLE ENERGY RACE IN NEW SOUTH WALES
The Climate Council’s annual States Renewable
Energy Race report compares the states and
territories based on their performance across For more information on the 2018 scorecard,
a range of renewable energy metrics. These read the Climate Council’s report:
metrics include each state’s percentage
of renewable electricity, the proportion of
households with solar and policies that support ‘Powering Progress: States
renewable energy. Renewable Energy Race’.
New South Wales has consistently been at the
back of these scorecards. The state finished third
last in the renewable energy race in 2018, the
same spot as 2017.
2018 SCORECARD: NEW SOUTH WALES FAST FACTS
Percentage renewable power:
›› New South Wales had 12.6% renewable electricity in 2017 consisting mainly of large hydro,
decreasing from 17.5% in 2016.
Households:
›› 17.6% of households in NSW have rooftop solar.
Policy
›› Net zero emissions target by 2050 (albeit with no clear policy framework).
›› Renewable Energy Action Plan in place since 2013. Discontinued in 2018.
›› No renewable energy target.CHAPTER 03 18
TODAY, NEW SOUTH WALES IS A CLIMATE LAGGARD, HEAVILY RELIANT ON POLLUTING COAL
BOX 4. CONTINUED
2016 Score Card:
THE AUSTRALIAN
RENEWABLE ENERGY RACE:
2016 SCORE CARD
SA FRONT
RUNNERS
TAS
QLD
WA
CATCHING
UP
VIC
AT THE
NSW STARTING BLOCKS
2017 Score Card:
THE AUSTRALIAN
RENEWABLE ENERGY RACE:
2017 SCORE CARD
SA K
LEA DING THE PAC
ACT
MIDDLE OF THE
PACK FRONT RUNNERS
LAGGING BEHIND
TAS
SA
QLD CATCHING
UP
TAS
VIC QLD
NSW WA
WA
AT THE
VIC
STARTING BLOCKS
NT
NSW
State / Territory NT WA NSW VIC QLD TAS ACT SA
Overall Score
2018 Score Card:
THE AUSTRALIAN
Renewable
Electricity (%)
2 7 17 12 7 92 22 47
RENEWABLE ENERGY RACE:
Capacity Per Capita
(kw/cap) (excluding
large hydro)
0.1 0.2 0.1 0.2 0.2 0.6 0.4 0.9
Solar
Households (%)
2018 SCORE CARD
11% 25% 15% 15% 32% 13% 14% 31%
Renewable
Electricity Targets
50% by 2030 - - 25% by 2020
40% by 2025
50% by 2030
TAS
100% by
2022
100% by
2020
50% by 2025
FRONT
Net zero
emissions targets
- - Net zero
emissions
by 2050
Net zero
emissions
by 2050
Net zero
emissions
by 2050
ACT
Net zero
emissions
by 2050
Net zero
emissions
by 2050
RUN zero S
Net NER
emissions
by 2050
Progress
since 2016
Expert panel
and
Largest
increase in
Continued
policy
Legislating
Renewable
Initial
response to
SA
New
renewable
Final
reverse
SA Energy
Plan.
VIC
consultation rooftop support. Energy Renewable energy auction. 100MW
on approach solar in Largest Target. Energy target and Battery
to Renewable
Energy
2016. capacity of
new projects CATC
Target.
HING
Largest no.
zero net
emissions
announce-
ment.
UP
QLD
Target. under of new target.
construc- projects No new
tion. under projects
construc- added in
tion. 2016.
2016 Scores - NSW C D C C B - A
AT THE
NT STARTING BLOCKS
WA19 AGEING AND UNPREPARED:
ENERGY IN NEW SOUTH WALES
4. Policies to tackle
climate change in
New South Wales
are falling short
New South Wales has few policies However, in the past twelve months, New
in place to encourage investment in South Wales has taken some positive steps
renewable energy. The state does not to encourage renewable energy and storage
have a renewable energy target or a technologies. While these incremental
reverse auction program to support policies are a step forward, and are being
renewable energy (unlike Victoria designed in consultation with AEMO to
and Queensland). ensure consistency with the National
Electricity Market (NEM) overall, they must be
backed up with further action (AFR 2018a).
NEW DISPATCHABLE CAPACITY
In October 2018, the New South Wales
Government announced that the state
government would provide $55 million
to support the construction of new large-
scale dispatchable electricity capacity.
Dispatchable capacity could include
renewable energy with energy storage, such
as battery storage or pumped hydro, or a
new gas power station. Projects can receive
grants of up to $10 million and feasibility
studies can receive up to $500,000. All
projects must have an ‘emissions intensity’
of below 0.5tCO2/MWh. This means a project
must produce less than 0.5 tonnes of carbon
dioxide for every megawatt hour of electricity
generation. This rules out any new coal
power station from receiving grants but it
does not rule out new gas power stations
(New South Wales Government 2018b).CHAPTER 04 20
POLICIES TO TACKLE CLIMATE CHANGE IN NEW SOUTH WALES ARE FALLING SHORT
The state government supported
large-scale solar farms under its
now discontinued Renewable
Energy Action Plan.
RENEWABLE ENERGY ACTION PLAN TRANSMISSION STRATEGY
In 2013, the state government launched the In October 2018, the New South Wales
New South Wales Renewable Energy Action Government released its Transmission
Plan. This plan included 3 goals and 24 Infrastructure Strategy to guide the
actions with the aim of increasing the amount development of new transmission projects
of renewable energy generation in the state (New South Wales Government 2018a).
(New South Wales Government 2018c). Transmission lines transport electricity over
long distances from generators to consumers.
Under this plan, the state government New transmission is needed to connect new
provided funding to a number of large scale wind and solar farms plus pumped hydro
solar farms in the state and supported a storage to the electricity grid, which in
number of community energy projects and some cases are located long distances from
businesses to invest in renewable energy. existing transmission built to accommodate
coal-fired power generation.
This plan was discontinued in December
2018 upon completion of the plan’s 24 The strategy identified four priority projects,
actions (New South Wales Government including a new interconnector with South
2018c). The New South Wales Government Australia and interconnection expansions
has not announced a new plan to replace it. with Victoria and Queensland. The strategy
also prioritises the development of three
renewable energy zones in the New England,
Central-West and South-West regions of New
South Wales (New South Wales Government
2018a). Once built, these projects should
help unlock significant renewable energy
investment by increasing the capacity of the
electricity network.21 AGEING AND UNPREPARED:
ENERGY IN NEW SOUTH WALES
FUNDING FOR BATTERY STORAGE The state government is also providing
AND ROOFTOP SOLAR $20 million to install 900 battery systems
alongside rooftop solar across state schools
New South Wales has announced support and hospitals (RenewEconomy 2018b).
for a “virtual power plant” that could include
installing rooftop solar and batteries In February 2019, the state government
on 40,000 households and businesses. announced a ten year program to provide
Although these solar and storage systems no-interest loans of up to $9,000 for
will be located on different households, households to install battery storage and up
the systems will be controlled by the same to $14,000 for a solar and battery system.
software. This enables the generation, The program could save a household with a
charge and discharge of energy to be quarterly electricity bill of $500 around $285
coordinated, so that all the systems a year. This could help 300,000 households
effectively operate as one power station – reduce their electricity bills and add
hence the name “virtual power plant”. 3,000MWh of battery storage to the energy
system (Berejiklian 2019).
The $50 million program involves
households installing rooftop solar and
battery storage to form a 200MW virtual
power plant, which could save households
up to $1,000 a year (RenewEconomy 2018a).
New South Wales is creating a virtual
power plant across 40,000 households.
Figure 8: The Goonellabah community solar farm was supported by the Lismore City Council as part of its plan to be
powered entirely by renewable energy by 2023.CHAPTER 04 22
POLICIES TO TACKLE CLIMATE CHANGE IN NEW SOUTH WALES ARE FALLING SHORT
PUMPED HYDRO ROADMAP New South Wales
The state government has released a
pumped hydro roadmap that identifies
has a target of net
7,000MW of potential pumped hydro
capacity across 24 WaterNSW sites. Pumped
zero emissions by
hydro is the world’s dominant form of
electricity storage. Pumped hydro involves 2050 but no plan to
storing electricity by pumping it up to a
higher reservoir when there is excess or reach this target.
cheap electricity in the grid (this can come
from any source of electricity - wind, solar
or coal). The stored water can then quickly
generate electricity as needed when the
water flows down to a lower reservoir MORE ACTION IS NEEDED TO
through a turbine. This effectively operates ENCOURAGE WIND AND SOLAR
like a battery. In electricity grids with a
large amount of wind and solar generation, New South Wales does not have a
pumped hydro can help stabilise the grid and comprehensive policy to encourage new
reduce reliance on fossil fuel power stations. renewable energy generation, nor does it
have policies in place to enable the state to
The roadmap is intended to guide private reach its net zero emissions target in 2050.
sector investment in pumped hydro (New
South Wales Government 2018d). The New South Wales state government support
state government is also supportive of the for new dispatchable capacity, investments in
Federal Government’s Snowy 2.0 pumped energy storage and a transmission strategy
hydro project, which involves the proposed acknowledge that the state will be powered
construction of 2,000MW of pumped hydro by renewable energy in the future. However,
capacity and associated expansion of grid these actions are not a substitute for adopting
transmission (refer to Box 3; New South a policy to encourage renewable energy.
Wales Government 2018e).
Investment in energy storage like batteries
and pumped hydro is important if New South
NET ZERO EMISSIONS TARGET Wales is to transition to very high levels
of wind and solar, but currently the state
Since 2016, New South Wales has had a net generates just 6% of its electricity from wind
zero emissions target by 2050 (New South and solar (Department of the Environment
Wales Government 2016). However, there is and Energy 2018b). With such low levels of
currently no plan, policies or interim targets wind and solar generation, it is possible that
or trajectories on how the state will achieve large energy storage projects will end up
this target. underutilised or instead use coal generation
when they are ‘charging’ (refer to Box 3;
Snowy Hydro 2018).
Without a policy to encourage investment in
renewable energy once the Federal renewable
energy target ends in 2020, it is likely that
New South Wales will continue to fall further
behind other states like Victoria, Queensland
and South Australia.23 AGEING AND UNPREPARED:
ENERGY IN NEW SOUTH WALES
BOX 5: NEW SOUTH WALES COUNCILS PICKING UP THE SLACK
Local government has been filling the void Treatment plant (refer to Figure 1; Lismore
left by state government inaction, with strong City Council 2018). The Goonellabah solar
action by metropolitan and regional councils to plant provides 15% of the aquatic centre’s
support renewable energy in New South Wales. power needs, while the floating solar farm
provides 12% of the treatment plant’s energy
In 2018, the Southern Sydney Regional requirements (Lismore City Council 2018).
Organisation of Councils, representing twenty
councils in Sydney, announced that it will soon Muswellbrook Shire Council is supporting a
receive 35% of its power needs from renewable new pumped hydro project in the Hunter Valley
energy. These councils have signed a 15-year by signing a deed with AGL. The pumped hydro
power purchase agreement with Origin Energy facility is estimated to cost $300 million and
to purchase 14MW of electricity from the 56MW have 250MW of capacity. It will be able to power
Moree solar farm (AFR 2018b). These councils every house in the Hunter region for up to 8
include Bayside, Campbelltown, Canada Bay, hours (The Newcastle Herald 2019).
Canterbury-Bankstown, Georges River, Hunters
Hill, Inner West, Ku-ring-gai, Lane Cove, The City of Newcastle is collaborating with the
Liverpool, Mosman, North Sydney, Parramatta, Clean Energy Finance Corporation to build a
Randwick, Ryde, Singleton, Sutherland Shire, 5MW solar farm in the region (refer to Figure 9).
Waverley, Willoughby and Woollahra. The council hopes the Summerhill solar farm
will significantly reduce the council’s annual
The Lismore City Council developed an $4 million electricity bill, after it doubled over
ambitious Renewable Energy Master Plan in the past two years. It is estimated that the
2014 with the aim of generating all its electricity solar farm will save $9 million over 30 years
from renewable energy by 2023. This includes (Newcastle Herald 2018).
the construction of two 100kW solar farms: a
rooftop solar farm at the Goonellabah Sports Local government action will continue to be
and Aquatic Centre (refer to Figure 8) and a critical to Australia’s transition to renewable
floating solar farm at the east Lismore Sewage energy into the future.
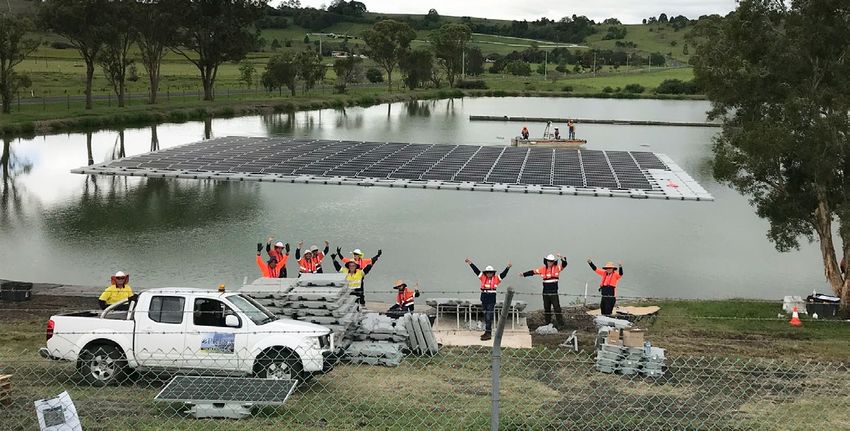
Figure 9: Construction on the Summerhill Waste Management Centre’s solar farm began in November 2018
(pictured), supported by the City of Newcastle.CHAPTER 05 24
CLIMATE IMPACTS IN NEW SOUTH WALES
5. Climate impacts in
New South Wales
New South Wales is highly exposed The state is already experiencing the
to the impacts of climate change. impacts of climate change. In 2018, New
Greenhouse gas pollution must be South Wales saw its hottest year on record
reduced to keep global temperatures for mean temperature - 1.68°C above
under 2°C to prevent dangerous the 1961-1990 average. Mean maximum
climate change and worsening temperatures were also the hottest on
extreme weather events in New record for New South Wales – 2.13°C above
South Wales. the 1961-1990 average (BoM 2019). New
South Wales also suffered from rainfall that
was significantly below average during
2018 (refer to Figure 10). Annual rainfall for
the year over the state was the sixth lowest
on record (since 1900). The dry conditions
during 2018 over eastern Australia were
driven by a combination of climate change
and natural variability (BoM 2019).25 AGEING AND UNPREPARED:
ENERGY IN NEW SOUTH WALES
Figure 10: Rainfall in New South Wales was significantly below average in 2018. This is part of a long term trend, with rainfall
declining by 11% in southeast Australia since the 1990s.
AUSTRALIAN RAINFALL DECILES 1 JANUARY TO 31 DECEMBER 2018
Rain decile ranges
Highest on
record
Very much
10
above average
8-9 Above average
4-7 Average
2-3 Below average
Very much
1
below average
Lowest on
record
Source: Bureau of Meteorology (2019).
The unusually warm and dry conditions led August 15 until near the end of September,
to debilitating drought and high fire danger destroying two homes and 19,000 hectares
throughout 2018. Bushfires burned in New of bushland (BoM 2019).
South Wales in all but two months of the year.
In March, a bushfire on the south coast of These events are part of a long-term trend.
New South Wales at Tathra destroyed more There has been an increase in the frequency,
than 70 homes and damaged a further 39 intensity and duration of heatwaves in
homes (BoM 2019). Many local government New South Wales since 1911. Increases
areas in New South Wales were declared in in heatwave intensity (the maximum
the bushfire danger period in late winter – temperatures reached in a heatwave) have
the earliest on record. Between 80 and 100 been strongest along the Great Dividing
active bushfires burned across New South Range and the far west of the state. The
Wales in August alone. Another fire – the far west and the eastern seaboard have
Bega Valley fire at Bemboka – burned from experienced increases in the frequencyCHAPTER 05 26
CLIMATE IMPACTS IN NEW SOUTH WALES
Climate change, driven by the
burning of fossil fuels, is already
affecting New South Wales.
of heatwaves, and the far west and southern By 2030, maximum temperatures are
coastal areas have experienced increases expected to rise by 0.7°C in New South
in the duration of heatwaves. For example, Wales and continue to rise by 2.1°C by 2070
there are 18 more heatwave days per year in (compared to the baseline modelled climate
the south-east of New South Wales now than between 1990 and 2009). The greatest
in the beginning of the 20th Century (OEH increases are projected in north-western New
2015). Extreme heatwaves have already led to South Wales (NARCliM 2019)1.
a 10% increase in both deaths and ambulance
callouts in New South Wales between 2005 By 2030, the number of hot days (with
and 2015 (Jegasothy et al. 2017). a maximum temperature above 35°C) is
projected to increase by an average of nine
There has also been a decline in April- across the state (compared to the baseline
October rainfall since the 1990s, with modelled climate between 1990 and 2009)
rainfall in southeast Australia declining (NARCliM 2019). North-western New South
by 11% over this period (BoM 2019). More Wales will experience the greatest increase,
hot days and heatwaves and reduced cool with an additional 10-20 hot days by 2030
season rainfall have contributed to an and over 40 additional hot days by 2070.
increase in extreme fire weather days over This region currently experiences 50-80
most of New South Wales, and a lengthening hot days, meaning that some parts of north-
of the bushfire season (Climate Council western New South Wales (e.g. the region
2017; CSIRO and BoM 2018). around Bourke) will experience temperatures
above 35°C for about one third of the year
The impact of climate change will become by 2070. New South Wales is also expected
more intense in the coming decades if to experience an increase in average fire
greenhouse gas pollution is not reduced. By weather, and days rated as severe or above
2030, New South Wales will experience on (as measured using the McArthur Forest
average an additional one to two heatwaves Fire Danger Index or FFDI)2 . Fire danger is
each year. The longest heatwave is projected expected to increase most in spring and
to last an average 1.5 to 3.5 more days in summer in the coming decades, with the
most regions of New South Wales by 2030 western half of the state most heavily affected.
(NSW Chief Scientist & Engineer 2017).
1
Based on modelled temperatures. Maximum temperatures are rising faster than expected and in many cases, temperatures are
already reaching what was projected for 2030.
2
Forest Fire Danger Index (FFDI) values below 12 indicate low to moderate fire weather, 12-25 high, 25-49 very high, 50-74
severe, 75-99 extreme and above 100 catastrophic. The Bureau of Meteorology issues Fire Weather Warnings when the FFDI is
forecast to be over 50.27 AGEING AND UNPREPARED:
ENERGY IN NEW SOUTH WALES
North-western New South Wales will
experience an extra 40 days above 35
degrees by 2070 if greenhouse gas
pollution is not reduced.
This will have numerous impacts,
including on human health, ecosystems,
infrastructure and the economy. Climate For more information on the effects of
change is projected to increase deaths climate change in New South Wales, read
and illnesses related to heat stress, and the following Climate Council reports:
potentially increase food and water
borne illnesses (OEH 2016). Climate ‘2017: Another record-
change is also emerging as a serious breaking year for heat
threat to ecosystems, posing challenges and extreme weather’.
to conservation (OEH 2016). The costs
associated with damages from extreme
weather events is also likely to rise as
their severity and/or frequency increases,
with disasters already costing New South
Wales $3.6 billion per year (Deloitte Access ‘Earlier, more frequent,
Economics 2017). more dangerous: Bushfires
in New South Wales’.
Extreme weather events will also affect the
electricity system, especially heatwaves
and flooding. Electricity demand increases
during heatwaves and large coal and gas
power stations are less reliable in extreme
hot weather (NSW Chief Scientist &
Engineer 2017). Extreme storms can cause
damage to power lines and substations,
leading to power outages. Flooding can
also affect rail transport of coal to power
stations in the state and may cause
landslides in coal mines (NSW Chief
Scientist & Engineer 2017).CHAPTER 05 28
CLIMATE IMPACTS IN NEW SOUTH WALES
Climate change is driving more
frequent heatwaves, making coal
power stations less reliable.
Figure 11: The Bayswater coal power station. As heatwaves become more intense as a result of climate change, ageing coal
power stations will become increasingly unreliable.29 AGEING AND UNPREPARED:
ENERGY IN NEW SOUTH WALES
6. Conclusion: New
South Wales has some
catching up to do
After almost a decade of policy There is massive potential for new jobs
stagnation, New South Wales can and investment in New South Wales in
show leadership on climate change a renewable energy future. The Climate
once again by adopting ambitious Council’s Renewable Energy Jobs report
renewable energy policies. By (2016b) found that New South Wales would
reconfiguring the transmission experience the highest jobs growth of any
network and embracing both rooftop state with a 50% renewable energy target,
solar and storage as well as large with the creation of 11,000 jobs. 20,000MW
scale renewable energy and storage, of renewable energy capacity has received
New South Wales can sustainably or is awaiting planning approval – twice
reduce greenhouse gas pollution and the capacity of the state’s entire fleet of coal
electricity prices while ensuring the power stations. But without clear policies,
state continues to have a secure and many of these projects will never be built.
reliable supply of electricity.
In 2003 New South Wales led the world in
climate policy. Today New South Wales is
supporting investment in new dispatchable
technologies, energy storage and new
transmission. However, with a heavily
polluting electricity grid dominated by an
ageing fleet of coal power stations, this is
not enough.
Embracing renewable energy
would create jobs and drive
investment in New South Wales.REFERENCES 30
References
ABC (Australian Broadcasting Corporation) (2010) APVI (Australian Photovoltaic Institute) (2018)
Questions over NSW’s commitment to reducing emissions. Mapping Australian Photovoltaic installations. 25
The World Today. 26 March 2010. Accessed at: https://www. October 2018. Accessed at: http://pv-map.apvi.org.au/
abc.net.au/radio/programs/worldtoday/questions-over- historical#4/-26.67/134.12
nsw-governments-commitment-to/382698
Berejiklian G (2019) Extra bill relief with solar energy &
ABC (2017) Whyalla steelworks owner Sanjeev Gupta battery roll out. 10 February 2019. Accessed at: https://
buys majority stake in renewable firm Zen Energy. 20 nsw.liberal.org.au/candidates/gladys-berejiklian/
September 2017. Accessed at: http://www.abc.net.au/ news/articles/EXTRA-BILL-RELIEF-WITH-SOLAR-
news/2017-09-20/sanjeev-gupta-buys-controlling-stake- ENERGY?_ga=2.26187578.647025708.1549932823-
in-renewablesfirm/8964448 1742903155.1539047526
ACT Government (2016) Wind farms final piece in 100% BNEF (Bloomberg New Energy Finance) (2018) Levelised
by 2020 plan. 23 August 2016. Accessed at: https://www. Cost of Energy Analysis.
cmtedd.act.gov.au/open_government/inform/act_
BoM (Bureau of Meteorology) (2019) Annual Climate
government_media_releases/corbell/2016/wind-farms-
Statement - Temperature. Accessed at: http://www.bom.
final-piece-in-100-by-2020-plan
gov.au/climate/current/annual/aus/#tabs=Overview
AEMO (Australian Energy Market Operator) (2017a) 2017
City of Newcastle (2018) Summerhill solar farm to be built
Electricity Statement of Opportunities. Accessed at: http://
with CEFC finance. 7 March 2018. Accessed at: http://
www.aemo.com.au/Electricity/National-Electricity-
newcastle.nsw.gov.au/Council/News/Latest-News/CEFC-
Market-NEM/Planning-and-forecasting/NEM-Electricity-
finance-to-build-Newcastle-s-solar-farm
Statement-of-Opportunities/2017-NEM-ESOO
Clean Energy Regulator (2016) History of the scheme.
AEMO (2017b) System Event Report New South Wales,
30 November 2016. Accessed at: http://www.
10 February 2017. 22 February 2017. Accessed at: https://
cleanenergyregulator.gov.au/RET/About-the-Renewable-
www.aemo.com.au/-/media/Files/Electricity/NEM/
Energy-Target/History-of-the-scheme
Market_Notices_and_Events/Power_System_Incident_
Reports/2017/Incident-report-NSW-10-February-2017.pdf Clean Energy Regulator (2018a) Electricity sector
emissions and generation data 2016-17. 24 September
AEMO (2018a) Generation Information Page. 2 November
2018. Accessed at: http://www.cleanenergyregulator.
2018. Accessed at: https://www.aemo.com.au/Electricity/
gov.au/NGER/National%20greenhouse%20and%20
National-Electricity-Market-NEM/Planning-and-
energy%20reporting%20data/electricity-sector-
forecasting/Generation-information
emissions-and-generation-data/electricity-
AEMO (2018b) Integrated System Plan. Accessed at: https:// sector-emissions-and-generation-data-2016-
www.aemo.com.au/-/media/Files/Electricity/NEM/ 17?Paged=TRUE&p_Title=Broome%20LNG%20Power%20
Planning_and_Forecasting/ISP/2018/Integrated-System- Station&p_ID=575&View=%7b14EFC728-3B4A-49C8-BFA7-
Plan-2018_final.pdf BACFD39B7323%7d&PageFirstRow=51
AFR (Australian Financial Review) (2018a) NSW Clean Energy Regulator (2018b) Large-scale Renewable
turbocharges grid to tap wind and solar power surge. 12 Energy Target supply data. 17 January 2019. Accessed at:
November 2018. Accessed at: https://www.afr.com/news/ http://www.cleanenergyregulator.gov.au/RET/About-the-
nsw-turbocharges-grid-to-tap-wind-and-solar-power- Renewable-Energy-Target/Large-scale-Renewable-Energy-
surge-20181108-h17oaf Target-market-data/large-scale-renewable-energy-target-
supply-data#Power-stations-and-projects-by-status
AFR (2018b) Sydney councils go solar in Origin deal as Visy
signs $30m for waste recycling. 2 October 2018. Accessed Climate Council (2014) The Australian Renewable
at: https://www.afr.com/news/sydney-councils-go- Energy Race: Which States are Winning or Losing?
solar-in-deal-with-origin-as-visy-wins-30m-for-waste- Accessed at: http://www.climatecouncil.org.au/uploads/
recycling-20181002-h164q3 ee2523dc632c9b01df11ecc6e3dd2184.pdf
APH (Parliament of Australia) (2017) Electricity markets and Climate Council (2016a) Game On: The Australian
the role of coal fired power stations. Accessed at: https:// Renewable Energy Race. Accessed at: http://www.
www.aph.gov.au/Parliamentary_Business/Committees/ climatecouncil.org.au/uploads/2acac0b824742ec83f99676
Senate/Environment_and_Communications/Coal_fired_ 255ae5a81.pdf
power_stations/~/media/Committees/ec_ctte/Coal_fired_
Climate Council (2016b) Renewable Energy Jobs:
power_stations/Final%20Report/c02.pdf
Future Growth in Australia. Accessed at: https://www.
climatecouncil.org.au/uploads/7b40d7bbefbdd94979ce4de
2fad52414.pdfYou can also read