Energy Data Collection in Tonga - Processes, challenges and opportunities - United Nations ESCAP
←
→
Page content transcription
If your browser does not render page correctly, please read the page content below
Energy Data Collection in Tonga – Processes, challenges
                  and opportunities

                             Development Account Tranche 10
 Evidence-based policies for the sustainable use of energy resources in Asia and the Pacific
                           Consultancy Report – Tonga Phase 1

                                                                Author: Dr. Kaoru Yamaguchi

                                                                                               1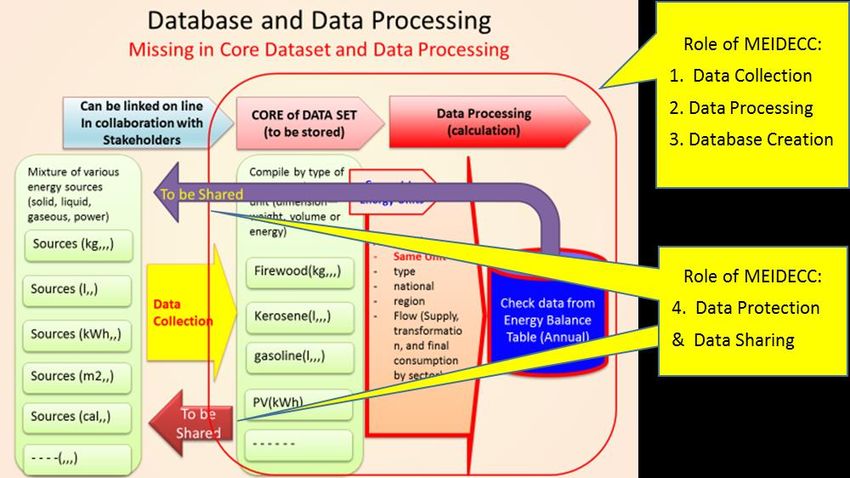
Table of Contents
Introduction/Background ................................................................................................................ 5
1     Current energy data collection ................................................................................................. 5
    1.1     Identification of data required from the needs ................................................................. 5
      National Needs ........................................................................................................................ 5
      Energy data and the collection path required .......................................................................... 6
      Current data availability (available data and collection flow) ................................................. 7
      Needs beyond the energy market............................................................................................. 7
      Differences in classifications and interpretations .................................................................... 8
    1.2     Identification of key stakeholders .................................................................................... 9
      Key Stakeholders ..................................................................................................................... 9
      Who has? Who collects? Who stores? For Whom? And for What purpose? ........................ 11
    1.3     Legal and regulatory framework .................................................................................... 12
      Role of Ministries/Governmental Agencies and their regulatory responses ......................... 12
      Experiences in other countries ............................................................................................... 13
    1.4     From Data collection to creation of database ................................................................. 13
      Overview: Process of data preparation and the current status (missing process) .................. 14
      Process of data collection ...................................................................................................... 14
      Who is responsible for data collection? ................................................................................. 15
      How often (monthly, annual, or else)? .................................................................................. 15
      Who checks? .......................................................................................................................... 15
      Cost of data collection ........................................................................................................... 15
    1.5     Data Base and Information Sharing (Storage of energy data and utilization of energy data)
            16
      Information Sharing (Utilization of Energy Data) ................................................................ 17
    1.6     Summary: Flowchart of findings: Options of data collection ........................................ 18
      Options of data collection (Supply side) ............................................................................... 18
      Options of data collection (Demand side) ............................................................................. 19
      Flowchart of data collection and the role of DOE, MEIDECC ............................................. 19
    1.7     Conclusion: Gaps and challenges in current system ...................................................... 20

                                                                                                                                             2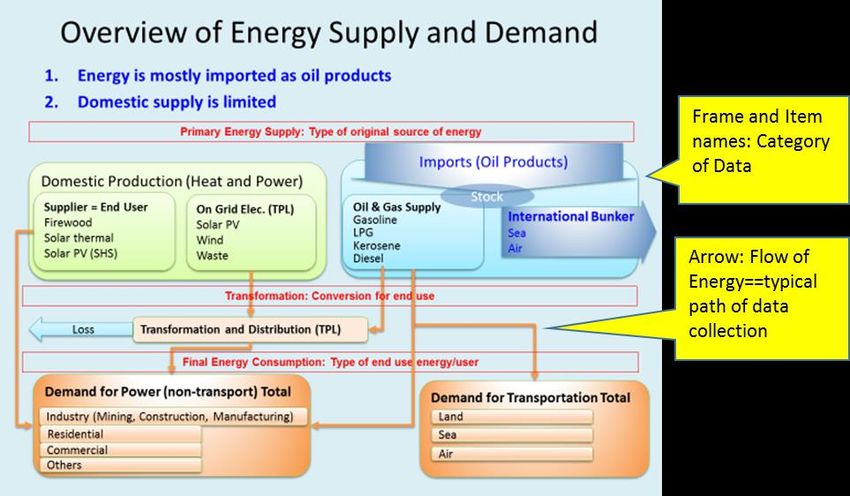
Required data and the available data ..................................................................................... 20
      Stakeholders and the regulatory framework .......................................................................... 20
      Data collection ....................................................................................................................... 20
      Database and data sharing ..................................................................................................... 20
      Challenges and recommendations ......................................................................................... 20
2     Review of Tonga Energy Road Map ..................................................................................... 21
    2.1     Review of the progress ................................................................................................... 21
    2.2     Emerging problems and opportunities ........................................................................... 23
    2.3     Needs of information to capture the emerging national needs ....................................... 23
3     Important regional/international databases: Relevance and potential ................................... 24
    3.1     Example of the use of PRDR as ONE STOP SEARCH ................................................ 24
    3.2     Example of the use of APEP .......................................................................................... 26
4     Data requirements for demand and supply forecasts ............................................................. 27
    4.1     Trial estimates of relationship between demand and the drivers ................................... 27
    4.2     Trial forecast .................................................................................................................. 29
    4.3     Computer Software for database and data analysis ........................................................ 29
5     Conclusions ........................................................................................................................... 30
    5.1     Findings .......................................................................................................................... 30
    5.2     Energy Balance Table .................................................................................................... 31
    5.3     Proposed Changes .......................................................................................................... 31
    5.4     Policy Development ....................................................................................................... 32
    5.5     Public relation/dissemination ......................................................................................... 33

                                                                                                                                                3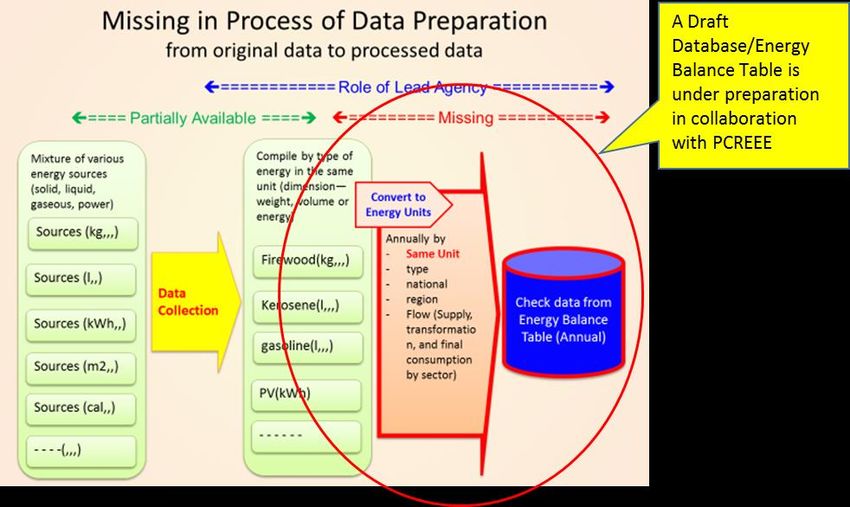
List of Figures
Figure 1 - Energy Supply and Demand........................................................................................... 7
Figure 2 - Data Availability ............................................................................................................ 7
Figure 3 - Overview: Process of Data Preparation and the Current Status (Missing Process) ..... 14
Figure 4 - Options of Data Collection (Supply Side) ................................................................... 18
Figure 5 - Options of Data Collection (Demand Side) ................................................................. 19
Figure 6 - Flowchart of Data Collection and the Role of DOE, MEIDECC ................................ 19
Figure 7 - Phases of TERM 2010-2020 ........................................................................................ 21
Figure 8 - Power consumption per capita in Asia-Pacific sub-region (left) ................................. 27
Figure 9- Power consumption per capita including Tonga (right) ................................................ 27
Figure 10 - Electricity Demand Forecast (Left) ............................................................................ 29
Figure 11- Motor Gasoline Forecast (Right) ................................................................................ 29

List of Tables
Table 1 - Role of Key Stakeholders ................................................................................................ 9
Table 2 - Data sources, collection and purpose ............................................................................ 11
Table 3 - Costs of Data Collection ................................................................................................ 15
Table 4 - Progress of RE implementation ..................................................................................... 22
Table 5- Petroleum fuels use by type (Litres), 2010–2012 ........................................................... 23
Table 6 - Petroleum fuels use by type (‘000 kcal), 2010–2012 .................................................... 24
Table 7 - Data sample from PRDR database ................................................................................ 25
Table 8 - Regression results 1 ....................................................................................................... 26
Table 9 - Regression results 2 ....................................................................................................... 26

                                                                                                                                         4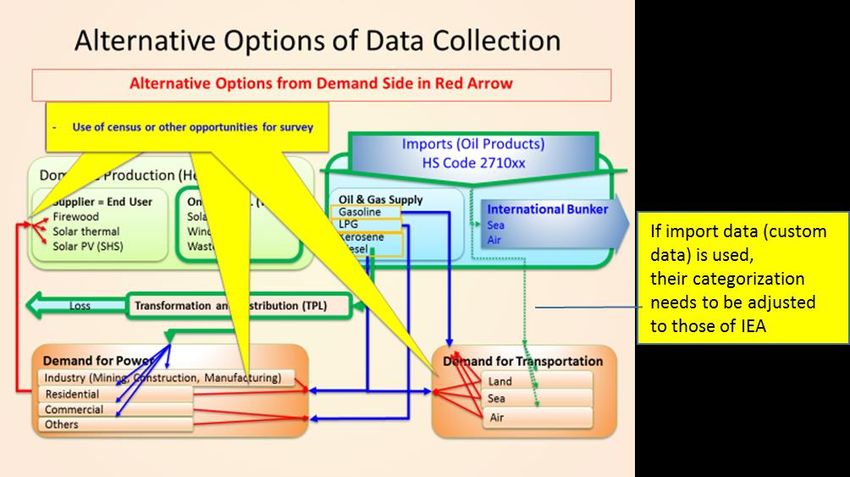
Introduction/Background
Tonga belongs to the Small Island Developing States (SIDS). The UN General Assembly (UNGA)
adopted a resolution on the outcome document of the Third International Conference on Small
Island Developing States (SIDS), the ‘SIDS Accelerated Modalities of Action (SAMOA) Pathway’
(A/69/L.6). “The Samoa Pathway” using SAMOA as an example of SIDS, recognizes the adverse
impacts of climate change and the rise of sea-levels on SIDS’ efforts to achieve sustainable
development.
Improvement of energy security through sustainable channels is one of such efforts in Tonga for
achieving economic prosperity. According to “Tonga Country Energy Security Indicator Profile
2009” prepared by the SPC, the total electrification rate was 89% and rural energy access to
modern forms of energy was still at 73%. The electricity tariff in 2009 amounted to USD 0.36/kWh
in 2009 as the household energy burden averaged 14%. This data is based on the census of 2006.
Taking the case of electrification rate, the improvement has reached 97% in the latest census of
2016.
Another important issue to be considered in the improvement of energy security is the role of
renewables. According to Tonga Power Limited (“Combined Utilities Business Plan 2018-2022”),
the current share of fuel cost in the electricity tariff is about 48% (41.51 seniti/kWh) of the total
(85.86 seniti/kWh – about 0.38 USD/kWh). This part can be reduced by using domestic renewables
such as solar power to replace imported diesel fuels. Thus, the contribution of renewable PV to
energy security and energy access is significant. But how significant?
To understand the significance of the role of various aspects of energy on national economy and
national security, data is of critical importance. Particularly quantitative data that enables
‘evidence-based practices’. It also helps to think about substantive measures in mitigating
associated risks. Without quantitative data on energy supply and demand, it is difficult to identify
the sources of these risks and their impact on welfare. By the same token, if data is available, there
are chances to mitigate and improve the status of energy security using appropriate policy
responses and ensuring that the country meets the “Tonga Energy Road Map” and “Sustainable
Development Goals”.

1     Current energy data collection

1.1    Identification of data required from the needs

National Needs
The national needs of energy data in Tonga are particularly strong for concerns on 1) energy
security, 2) future energy planning, and 3) trade balance from energy imports/exports.

                                                                                                    5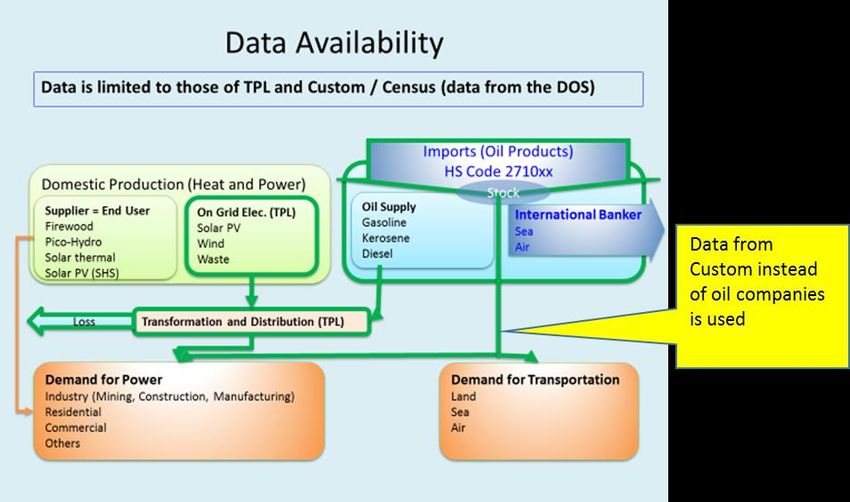
To analyze these concerns, capturing the national energy flow and constructing the energy balance
are critical first steps. The problem starts here implying huge improvements are needed for data
collection. For example, the most fundamental numbers are total energy supply and consumption
in energy equivalent units (ex. kcal, toe, joule etc.). Neither of these indicators can be found in any
official publications, domestically or internationally, even in the “Tonga Energy Road Map 2010-
2020”.
The energy flow explains in terms of quantity 1) who (sector) consumes what type of end use
energy, 2) what types of sources are used and lost (ex. wasted to convert from diesel oil to electric
power) to transform to the end use energy (particularly electric power—diesel oil to electric power),
and 3) what types of energy sources are produced, imported, or exported as primary energy sources.
Using this information, we can see who wants what type of energy, the needs of energy importation
and the outcomes and risks associated with energy security as well as the contributors of CO2
emission from the point of consumers.
Roughly speaking, nearly 100% of energy or primary energy supply is imported as oil products.
One third is used for power generation from diesel oil. Other data on the use of firewood and
increased generation by renewables is scattered and not clear in terms of energy balance and flow.
There are three basic problems of note. Firstly, units are not unified in energy equivalent terms
(toe or kcal), but in original physical units (kl, kWh, or ton). This lack of unification by energy
units makes it difficult to capture the whole national energy flow. Secondly, data preparation is
neither standardized nor systemized for capturing national issues such as energy security (ex.
dataset in the format of energy balance table). Finally, the required data is also not accumulated
and/or summarized within a centralized agency/place such as DOE or MEIDECC.
In this context, the required data for national needs is suggested to create the energy balance table
– energy flows by energy products/type in DOE, MEIDECC. As a reference, the IEA Energy
Balance Table – an internationally known framework – is used to identify the required data in
Tonga.
Tonga’s energy data collection and the availability of energy data and information fairs relatively
well on the supply side of the power sector. The challenges lie with non-power data, particularly
on the demand side – final consumption by sector for both power and non-power (particularly oil
products) sectors. Final energy consumption data (by sector) can illustrate consumer preferences
and thus, is very important to understand the future of energy utilization by types of energy. While
TERM focuses on power, the analysis of non-power use is considered to be comparably difficult
because of the lack of reliable data.

Energy data and the collection path required
The required data and the collection paths are shown below based on the flow of energy balance.

                                                                                                     6
Figure 1 - Energy Supply and Demand
Overview of Energy Supply and Demand
Current data availability (available data and collection flow)
The following figure indicates available data and its flow (green frame and arrow). Available data
is limited to those of TPL for power and custom (import) for oil products. The demand side is
based on the data of household income expenditure from the Department of Statistics.
Figure 2 - Data Availability
Needs beyond the energy market: Future planning (ex. TERM) and regional (PRDR)/international
(APEP) requirements
7Decision-making in the energy sector takes into consideration data beyond the energy market. One
type is socio-economic, particularly to be used as potential driver of the economy of Tonga and
changes in energy consumption. This data includes demographics of population, labour, value
added by sector –industry, services (particularly tourism is the largest source of foreign currency),
agriculture, and fishery. Data of national accounts, income per household, number of cars for
transportation among others are also important data as indicators of economic activities that rely
on energy consumption. This data becomes important to estimate future energy demand and to
develop supply plans such as the TERM.
International databases dedicated to energy such as the Asia Pacific Energy Portal (APEP)
managed by ESCAP and the Pacific Regional Data Repository (PRDR) managed by SPC also
emphasize socio-economic data. The former is a quantitative database based on standardized
categorization. The latter is a database of individual report, survey, and project information the
unit of each record in the database is not numeric data, but electronic file in the format of pdf and
excel sheet.
The additional data required from APEP includes data on energy trade, price of electricity, fuels,
subsidies, and foreign/domestic investments as a reflection of international needs. Given Tonga’s
energy context, the most important trade data required is within the oil sector. Also, there are no
price subsidies, but the retail prices of oil products and power are regulated in Tonga (Price and
Wage Control Act of 1988 for oil products and Electricity Act 2007 for concession agreement of
electricity tariff). On the other hand, indicators of energy access and related data on investment
can be important in terms of international contribution to the promotion of renewable energy in
Tonga. There are other required data categories, such as energy efficiency, environment (CO2 and
other emissions), and energy self-sufficiency, which can be estimated using other data such as the
consumption of fossil fuels for estimating CO2 emissions. The requirement of data on the energy
reserve can be neglected in case of Tonga. The last category of “socioeconomic context” is very
important as explained later to be utilized as primary driver of the future energy demand, that
should be considered for future energy planning.
The data of PRDR is categorized into five. They are 1) Economic and demographic data, 2)
Petroleum and transport data, 3) Utility data, 4) Resource monitoring data, and 5) Renewable
energy project data. The first three categories are compatible with the required numeric data for
Tonga’s national needs and APEP. However, utility and resource monitoring data are new, but are
not yet subjected to data collection, rather a record keeping of non-periodical projects and surveys.
The needs of these categories in PRDR could be solved, for example, by preparing a data record
of electronic links to these documents in the electronic database of Tonga national energy in DOE,
MEIDECC.
Differences in classifications and interpretations
The names, classification and categorization of energy related products are not necessarily
harmonized with internationally defined standards such as the International Recommendations for
8Energy Statistics (IRES). Such differences are typically found in products supplied in different
blends and products produced domestically such as unleaded and premium gasoline for automotive
gasoline. Thus, the categories and names used in the Department of Statistics, which follows
international standards, can be different from the one used in the domestic market. In case of Tonga,
categories and names of oil products such as kerosene, gasoline, diesel oil can be different from
those of international standards.
It should be noted that even within accepted international standards, there are different ways to
categorize the data (for example biogas is categorized into subcategories such as landfill and
sewage in IRES, while it does not have subcategories at the IEA). IRES of the United Nations is
leading the coordination of such differences. From Tonga’s perspective, the disaggregation of
biogases is not necessary at this stage.
1.2 Identification of key stakeholders
Key Stakeholders
The most important key stakeholder of energy data on the supply side is DOE of MEIDECC. The
other important stakeholders of the supply side are TPL, petroleum companies (PE SWP/Total),
and retailers of petroleum products as the source of original data of power and petroleum products.
Socio-economic data is related to energy demand/consumption such as activity of transportation
and energy consuming industries. Thus, the stakeholders of these socio-economic activities should
be listed as key stakeholders as in the table below:
Table 1 - Role of Key Stakeholders
Stakeholders Current and potential role
Government ministries Current role
1.Ministry of Meteorology, Energy, -Department of Energy, MEIDECC has the role of
information, Disaster Management, preparation of TERM
Environment, Climate change and -But required role of collection of energy data
Communication (MEIDECC): collection is not legally empowered
Department of Meteorology -The availability of data is limited to the supply side
Department of Energy (DOE) of electricity collected from Tonga Power Limited
Department of Information -Rough energy data as a part of socio-economics is
Department Environment collected, compiled, and stored by the Department
Department of Climate change of Statistics, MFNP
Department of Communication
2.Ministry of Land and Natural Resources Potential role
(MLNR) -DOE, MEIDECC is expected to be the center of
3.Ministry of Public Enterprises (MPE) energy data
94.Mnistry of Infrastructure (MI) -Demand side data sources can be the same as those
5.Ministry of Labor Commerce and of socio-economic data. Collection of such data as
Industries (MLCI) the consumption of kerosene in household,
6.Ministry of Agriculture Fishery Food commercial, industries needs cooperation with the
and Forest (MAFFF) Department of Statistics, and other Ministries like
7 Ministry of Tourism (MT) Ministry of Agriculture, Fishery, Food and Forest
8 Ministry of Finance and National -Similarly, transportation data as domestic
Planning (MFNP)9. Ministry of Revenue navigation, road transportation needs cooperation
and Customs with the Ministry of Infrastructure (data of
9 Ministry of Health transportation)
10. Department of Statistics (DOS)
Public enterprises and government Current role
agencies -Tonga Power Limited is the primary source of
electric power supply and sales
1.Tonga Power Limited (TPL)
2.Tonga Electric Commission (TEC) Potential role
3.Tonga Water Board (TWB) -Port Authority of Tonga can be one source of
4.Port Authorities Tonga (PAT) domestic navigation
5.Tonga Water Authority (WA)
6. Tonga Gas Limited
Community, church, schools (SSC) Currently no role, but colleges could be a partner
for potential needs of a survey for demand side
1.Tonga College data—use of petroleum of residential, commercial,
2.Tuppu College and industries
3.Beulah College
4.Liahona College
5.Tailulu College
Civil society (CS) Currently no role, but important source of demand
side data for the residential sector
1.Residential Households
2.Business community
3.Public in general
Private enterprises (PE) Currently petroleum companies of Pacific Energy
and Total are the primary sources of petroleum, but
1.Petroleum Companies supply side only.
2.Shopping malls
3.Hotels Potential role of petroleum companies is important
4.Vehicle sales dealers as a source of both supply and demand (sales data)
5.Tourist Companies of petroleum products. Similarly, private
106.Manufacturing factories organizations are the important sources of demand
7.Industry Associations side data
From the point of data collection, most of the data is stored at the source. The table below shows
candidates in consideration of national needs of data.
Who has? Who collects? Who stores? For Whom? And for What purpose?
Table 2 - Data sources, collection and purpose
Type of data Data source Who collects and For whom for what purpose
(Who has = Who stores) stores? (national needs)?
Primary energy Electricity DOE, MEIDECC For national government to
supply - TPL With collaboration make national planning
- Residential (PV) with DOS, MFNP - To see the total needs
Oil Products for Residential PV, of energy in Tonga)
- Pacific Energy Solar thermal and
- TOTAL others (biomass)
- Ministry of
Revenue and
Customs for import
custom data
Others
- Solar thermal
- Firewood/Charcoal
Transformation - TPL (Electricity) TPL For national government to
DOE, MEIDECC make national planning
- To see the efficiency
and loss in power
generation
- To see the magnitude
of loss of fossil fuels in
total energy demand
and supply
Final energy - Industry DOE, MEIDECC For national government to
consumption (Manufacturing, Collaboration with make national planning
Mining, - DOS, MI for - To see the driver of
Construction) data of energy demand
- Residential Residential, - To see the needs of
- Commercial commercial, energy by type and by
- Agriculture/Forestry user
11- Transportation and
transportation
- MRC for data of
imported oil
products
- M. of
Infrastructure
for data of
Construction
- MAFFF for
data of
agriculture,
fishery, and
forestry
1.3 Legal and regulatory framework
Currently, there is no legal framework for data collection focused on the energy sector in Tonga.
Data is scattered on both the supply and demand side, with supply-side data collection mainly
limited to the electricity sector and the demand side data limited to socio-economic data surveys
conducted by the Department of Statistics.
Collection and analyses of energy data and information are clearly needed to support national
interests. In terms of the institution where these tasks should be based, the Department of Energy
in MEIDECC is the most important agency as it was established in 2014 to institutionalize the
implementation of TERM.
The most notable characteristic in terms of energy data and information availability is the lack of
integration of the transport sector into the framework of energy data and information, particularly
on the demand side.
Role of Ministries/Governmental Agencies and their regulatory responses
Among government ministries and agencies, the Department of Statistics is the only agency which
has the legal responsibility and budgetary capacity to execute data collection and storage. As
mentioned before, the primary focus is on socio-economic data. Data on energy consumption is
very limited, however, data on energy access and demand side indicators such as household
expenditure on utility bills such as electricity and fuel can be obtained through census surveys.
Census of manufacturing can be used as a rough indicator of energy consumption in industry sector.
12Experiences in other countries
The system of data collection/preparation differs by country. Philippines for example, is one of the
first countries to prepare such a regulatory framework, dedicated to petroleum data. In 1992, the
responsibility of the submission of data was assigned to the ‘Department of Energy’ under the
‘Department of Energy (DOE) act of 1992’. Petroleum companies submit data to DOE, based on
a format that include sales volume and sales value, disaggregated by fuel and by sector (large
industry only). Demand side data, however, needs to be surveyed separately with the help of the
Philippines Statistics Authority. For the power sector, because it is fully liberalized in the
Philippines, DOE added circular law (No. DC2015-04-0002) in their power to collect data.
In the case of Malaysia, data reporting is mandated through the ‘Electricity Supply Act 2015’ for
electricity data and the ‘Gas Supply Act 2015’ for gas supply data. Other data is based on voluntary
submission and questionnaire via online, email, fax and postage. For final energy demand, they
also use surveys for manufacturing, residential and commercial sectors.
In Indonesia, PUSDATIN (Pusat Data dan Informasi—Center of Data and information) of
Ministry of Energy and Mineral Resources has the responsibility of collection, compilation and
storage. Although, legal empowerment is currently in preparation, their data collection is based on
voluntary submissions. Besides, the data source is limited to the stakeholders on the supply side,
namely petroleum companies and governmental agencies.
Similarly, in the case of Papua New Guinea, there is no law or regulation that mandates data
collection. Although a data preparation mechanism is under development, currently there are no
organizations that prepare the data. Voluntary submissions are also limited.
As such, the difficult part with data is the disaggregation by type of sector/consumer for example
for power, industry, transportation, residential, commercial, agriculture and fishery. Generally
speaking, rough disaggregation of data is the responsibility of petroleum companies. But further
disaggregation of demand side data is the task of the government. To estimate consumption or to
disaggregate data, the data of utilization (output from power generation, number of cars,
output/value added of the industry) is used.
1.4 From Data collection to creation of database
There are basically three processes of data collection 1) data collection from original source, 2)
data compilation/aggregation based on the same category and the same physical unit, and 3)
creation of database/energy balance table.
Currently, data collection and processing is partially in progress as mentioned in the previous
sections. The third part (creation of energy database/balance table) is tried for occasional needs for
research, but not in a sustainable way. Under a trial, a draft version of the energy balance table is
now prepared with the help of Secretariat of the Pacific Community (PCREEE, Pacific Center for
Renewable Energy and Energy Efficiency) and the Georesources and Energy Programme (GEM).
13Figure 3 - Overview: Process of Data Preparation and the Current Status (Missing Process)
Process of data collection
Data must be collected in its raw form and compiled into a useful format. Data collection methods
vary based on who needs to collect the data and from whom, in addition to cost constraints and the
availability of alternative sources. The collection methods can be categorized as follows:
1) CASE 1: Number of data sources are few and easy to access. Typical cases include supply
of petroleum products and power generation/distribution. In these cases, data can be collected
directly from the sources through voluntary or mandatory submission.
2) CASE 2: Data is widespread among a large number of sources and is difficult to reach.
Typical cases include data on final energy consumption. The household consumption of kerosene,
charcoal, firewood, PV are one such example. In this case, periodical sample survey (interview by
direct visit, mail, telephone interview, fax or else) or the use of census survey is necessary.
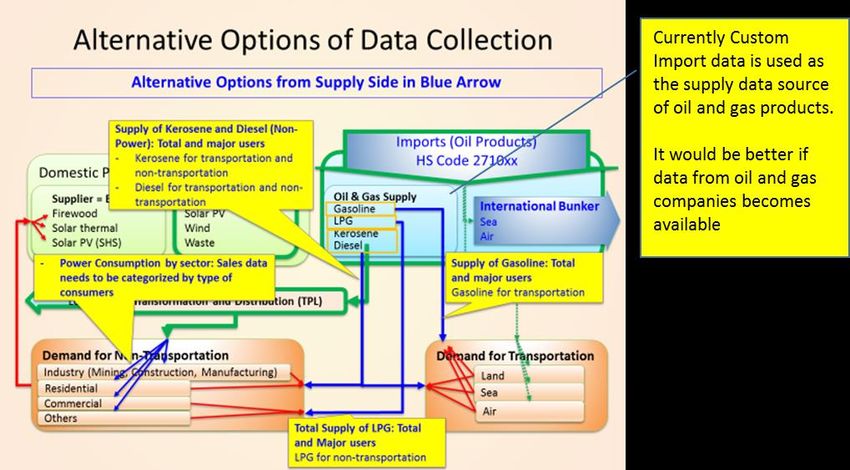
3) CASE 3: Data is difficult to obtain and/or its availability is not clear. However, alternative
data sources that are available and easily accessible can be used to estimate the original required
data. For example, if imported capacity of PV module for residential use can be obtained from the
import/export data (trade data at custom/port), the installed capacity of rooftop PV capacity and
the outputs for residential sector can be estimated. Similarly, in Tonga, data of importation of oil
products can substitute the sales data of oil companies. This substitution can be effective if the
category of domestic supply and demand can be linked directly to the category of import data.
14Who is responsible for data collection?
The responsibility of data collection and its categorization is not yet clear in Tonga – although
certainly of national interest. Considering that DOE, MEIDECC is responsible for energy policy,
DOE should be the center of the energy data and its collection. Data related to electricity is
prepared and stored in TPL. Although some aggregated data is available, disaggregated data by
sector and by type of generation would be necessary. Data related to petroleum and Tonga’s socio-
economic landscape needs a well-defined coordinated effort that could take the form of voluntary
submissions or be mandated through regulation. Other data needs to be estimated using alternative
data as indicated in the examples above.
How often (monthly, annual, or else)?
The answer depends on the purpose of data utilization. At the very least, an annual data collection
cycle is needed to support long-term evidence-based energy planning of 10 years or more for
example in the case of TERM. Quarterly and/or monthly data would be helpful if the seasonal
variation in energy supply and demand is large. Given that seasonal variation in Tonga is minimal,
preparation of annual data would be the first step.
Who checks?
Input mistakes are common if the numbers are prepared manually. Also, changes in units and
categorization can cause inconsistencies in the data. These mistakes should be checked by an actor
independent of the ones involved in preparation of the data such as SPC and GEM.
Cost of data collection
If the data collection process is systemized, MEIDECC’s responsibilities will mainly include
organization, unit conversion, and storage in electronic file. If the disaggregation of demand side
data is required, additional estimation techniques need to be employed. In consideration of the
types of data required in case of Tonga, the required cost depends on the methods. Below is the
summary table that show the differences by collection methods and the applicable sources.
Table 3 – Costs of Data Collection
Type of data Data source Collection methods Cost
(options and applicable
sources)
Primary energy Electricity Volunteer/Mandatory Low (requires
supply - TPL - TPL volunteer/legal
- Residential (PV) - Pacific Energy arrangement)
Oil/Gas Products - TOTAL
- DOE, MEIDECC - Tonga Gas
- Pacific Energy - DOE, MEIDECC
- TOTAL - Customs High (requires
- Tonga Gas Surveys collaboration with
15- Customs - Residential PV DOS and other
Solar thermal and - National census, stakeholders)
Firewood/Charcoal - Tonga Household
- National census, Income and Low (requires
- Tonga Household Expenditure Survey alternative sources,
Income and (HIES), low reliability)
Expenditure Survey - Post Disaster survey
(HIES), - Others
- Post Disaster Estimates
survey - Residential PV
- Others
Transformation TPL (Electricity) Volunteer/Mandatory Low (requires
volunteer/legal
arrangement)
Final energy Industry Volunteer/Mandatory Low (requires
consumption (Manufacturing, (Large industry only) volunteer/legal
mining, construction) - TPL arrangement)
Residential - Pacific Energy
Commercial - TOTAL
Agriculture/Forestry - Tonga Gas
Transportation Surveys
- All or selected High (requires
sources collaboration with
Estimates DOS and other
- All or selected stakeholders)
sources Low (requires
alternative sources,
low reliability)
1.5 Data Base and Information Sharing (Storage of energy data and utilization of energy data)
Database (storage of energy data)
Here storage refers to electronically accessible files and/or documents, which contain data.
Database (or database management system) means a computer software to manipulate the
electronically stored data. Currently, there is no storage of energy data in Tonga, which contains
both supply and demand side data except a draft database prepared last year by PCREEE and DOE
for trial – although many missing parts of the table need to be filled. Institutional roles and
empowerment are to be clarified and improved to complete and maintain such database. Thus, to
design an energy database including storage in Tonga, in addition to technology and cost,
16institutional design becomes critically important. The following items should be considered to
prepare the energy database.
a. Institutional: The role of DOE has to be clarified, particularly the definition and the
boundary of data and information that DOE has to prepare, store and maintain.
b. Technology: Database linked to internet and intranet in electronic file and applications
using cloud computing technologies are becoming increasingly common and cost
efficient. Traditional paper-based data/information could also be used in parallel as
protection against system failure.
c. Database: The database must support functions such as the storage of data, function of
data receipt, access, submission, and compilation of aggregation and disaggregation.
Among these functions, security is particularly important for storage from the point of
risk control and efficiency. It is worth noting here that some data should be protected from
access.
i. One typical system is to collect original data from various sources and store it in one
place. Then the original data can be compiled to construct useful formats such as an
energy balance table.
ii. If DOE and its data sources can share data and information through an on-line system,
then DOE need not store the original data of outside sources—the data can be
electronically linked.
d. Cost of maintenance: The cost of maintenance can be minimized through an on-line data
system and can be further reduced by systemizing the compilation of data including
aggregation, disaggregation, and creation of energy balance table.
Information Sharing (Utilization of Energy Data)
Tonga’s dependence on imported petroleum products makes data such as diesel power generation,
number of cars and industrial activities that use petroleum products particularly important. The
point is that these data belong to socio-economic data, not energy data. Without them it is difficult
to estimate the demand side if there is no direct way to collect data from the consumers. Given the
importance of socio-economic data in estimation of demand side energy data, co-operation and
information sharing with the collectors and custodians of this data is necessary. In Tonga’s case,
the relevant entities include Department of Statistic, Department of Transportation, Central Bank,
and Department of Tourism. Here are the findings of the current system.
i. Institutional mechanism: There is systematic communication between TPL and the
Department of Energy because of the need to oversee the progress of the TERM. Also,
systematic communication is available with petroleum companies because of the
Petroleum Act. However, the communication on the data with TPL is limited within
the current regulatory framework.
ii. Efficiency (for example, shared through direct contact or web cloud or else?):
Currently the data sharing is limited to electricity. But the data is not systematized to
17be used for TERM and other analysis. If the data could be available through internet,
particularly in the format of a spreadsheet, then data sharing would be much more
efficient.
iii. Frequency of information sharing: Information sharing is neither regular, nor
periodical
1.6 Summary: Flowchart of findings: Options of data collection
Figure 4 - Options of Data Collection (Supply Side)
18Figure 5 - Options of Data Collection (Demand Side)
Figure 6 - Flowchart of Data Collection and the Role of DOE, MEIDECC
191.7 Conclusion: Gaps and challenges in current system
Required data and the available data
Tonga depends largely on oil products including for power generation. The data related to TPL,
namely the use of diesel oil for power generation and the outputs of the power (GWh) is available.
Most of the other data is very limited in terms of availability.
Stakeholders and the regulatory framework
Key stakeholders include Department of Energy, Department of Statistics, TPL, and oil companies.
Among all, the role of DOE is the most important for data collection at the national level, storage,
and utilization. Currently, however, a regulatory framework to empower DOE for data collection
is missing. Agreements for voluntary data submission or other alternative ways have to be used if
mandatory submission of the data is difficult.
Data collection
Currently, there is no clear system of data collection focused on energy. There are many ways of
data collection including voluntary submission and mandatory submission for supply side, sample
survey, use of census and use of alternative data for estimation. Institutional roles need to be
clarified to select the most effective method of data collection that is implementable within
resource and institutional constraints.
Database and data sharing
Currently there is no database (except a draft version by SPC), which covers the whole flow of
energy, from its supply to consumption. The design and construction of database in parallel to data
collection is very important to take advantage of the existing data as well as to share information
with other stakeholders.
Challenges and recommendations
There is a large gap between the current and the ideal status of data preparation (IEA’s requirement
as an example). Achieving this ideal status will require a practical step-by-step approach, as listed
in the example below:
- Set priority of data based on needs;
- Explore various options for data collection subject to feasibility constraints:
➢ Seek agreements for voluntary (or mandatory) submission of data from oil companies
and TPL (supply side);
➢ Seek cooperation from DOS to use census survey for residential and commercial data;
➢ Explore the use of sample survey to find the use of oil products for each sector;
➢ Explore the options of alternative data for estimation of data such as rooftop PV and the
use of firewood.
- Construct a database and energy balance table using currently available system for example
excel spreadsheet (recommended), which can be easily upgraded to a sophisticated software
20later. The expansion and refinement of the draft database currently in preparation by SPC are
highly recommended;
- Assignment of expert staff for the database. It is strongly recommended to support the current
expert of MEIDEC/PCREEE to strengthen data collection and the creation of database.
2 Review of Tonga Energy Road Map
2.1 Review of the progress
Tonga Energy Road Map (TERM) 2010-2020 is a 10-year action plan that aims to address
concerns on energy security and other national interests. The roadmap outlines actions for the
Government of Tonga, development partners and entities such as Tonga Power Limited. This
includes achievements of targets of renewable energy (RE), efficiency (EE), and institutional
reform. The evaluation of RE and EE targets is not possible without quantitative data. To this
respect, TERM is currently under review with a focus on quantitative achievements.
Generally speaking, significant progress has been made in Phase 0, but the achievement by 2020
seems very difficult – the actual implementation is behind the schedule.
Phase 0: Big steps include the establishment of DOE and preparation of Petroleum Act 2.
Phase 1: Focused on information and experiences. Many projects of training and trial
implementation are in progress. Data collection based on the national needs is also critical, as
shown in this report.
Phase 2: Focused on data analysis and institutionalization of data collection system. Full scale
development of IPP of renewables.
Currently, the progress of each phase is in parallel and the achievements are late Phase 1 or early
Phase 2 (see below chart).
Figure 7 – Phases of TERM 2010-2020
21The TERM identifies a clear and quantifiable target of achieving 50% electricity generation from
RE by 2020. Tonga Power Limited shows indicators of 1) accumulated fuel displacement (amount
of estimated use of diesel oil for the total power generation replaced by renewables in %), and 2)
Accumulated tariff reduction (%) due to RE, and 3) RE penetration (%) in its annual report. The
accumulated fuel displacement is 6% against a target of 20% in 2017. The penetration of
renewables is 11%, short of the 25% target in the same year.
The accumulated tariff reduction is better than the target. However, the tariff is regulated and can
be changed depending on the price of diesel oil. If diesel oil prices rise, the accumulated tariff
reduction can be large.
The TERM specifies an efficiency target of 4.0 kWh/l. This is equivalent to a thermal efficiency
of 37.3% (assuming 9200kcal/liter of diesel oil). This efficiency is determined by the specification
of the generator and the pattern of operation. An efficiency of 37% is usually satisfactory for small-
scale generators (for large scale generators 5 kWh/l or more should be the target). However, as the
use of PV increases, the operational pattern of diesel generators may need to be adjusted at the
cost of efficiency to optimize the use of renewables and fossil fuels.
In summary, although the progress is slow, achievements are emerging gradually.
Table 4 - Progress of RE implementation
Strategic 2011 2012 2013 2014 2015 2016 2017 2018 2019 2020
measures Actual Actual Actual Actual Actual Actual Actual Target Target Target
/Target /Target
Accumulated 8 6 30 40 50
fuel /12 /20
displacement
(%)
Accumulated 6 10 8 10 12
tariff reduction /4 /5
(%) due to RE
RE penetration 8.9 10 11 40 50 60
(%) /15 /25
Fuel efficiency 4.13 3.95 3.99 4.06 4.11 4.15 4.1 4.0 4.0 4.0
(kWh/l) /4.15 /4.0 /4.0
Generation 53,159.6 523,91.5 53,312.9 54,560.7 55,404.6 60,037.2
(GWh)
Sales(GWh) 46,388.3 49,165.2 47,817.8 53,341.9
Fuel
12,871.6 13,263.7 13,361.6 13,438.6 13,480.4 14,466.8
consumption (kl)
Cost of fuel 22,535.4 22,132.9 23,583.0 19,768.4 15,347.5 19,197.1
(000$)
No. customers 20,773 20,758 20,498 20,580 20,633 21,385
Sales (000$) 44,512.5 40,513.2 41,955.5 44,302.8 44,864.7
Average tariff 87.3 85.3 92.6 84.1
(Senitil/kWh)
Source: Annual Report of TPL
222.2 Emerging problems and opportunities
The challenges that TERM faces can be categorized into 1) internal/domestic and 2)
external/foreign. While the former can be solved through domestic efforts, those efforts fall short
in formulating solutions against external/foreign challenges. Internal or domestic would include
institutional challenges, regulation, tariffs, energy access, and public-private partnerships. These
matters fall into the hands of private and public entities including the government of Tonga. The
prices of oil products are an external factor and most importantly, the required technologies and
finance for renewables are also heavily dependent on foreign countries.
As far as the target of renewables is low, and the scale is small, donor countries can afford to
contribute, but it will be relatively difficult once a full-scale renewable energy implementation
becomes the target. Although the challenges at the current stage are rather domestic as in Phase 0
and 1, the future for the Phase 2 and beyond can be even more difficult as the source of finance is
expected to be external. To make the renewable energy investment in Tonga sustainable, financing
needs to be internalized and private sector involvement will be critical for the full-scale
development of renewable energy projects on an Independent Power Producer (IPP) basis.
The good news is that the costs of PV and related technologies such as battery storage are
decreasing rapidly, while the prices of oil products are not expected to decrease in the future.
TERM was prepared in 2010 and the assumptions made then for the development of RE may no
longer hold and require updating. The most notable change is the reduction in PV module costs.
The possibility of Solar House Systems (SHS) or PV based micro-grid for community level can
be a realistic option if compared to the use of diesel generators. Private ownership of PV for
personal use and connection to grid for the surplus can contribute to the daytime activity of each
household. This can contribute particularly to the welfare and working style of women, who stay
in house during daytime. Data on the activity of households, particularly women (gender specific
data) could help the emerging importance of private ownership or own use of PV in TERM.
2.3 Needs of information to capture the emerging national needs
Currently, Tonga meets most of its energy needs through importation of oil products. Oil products
have different characteristics by type. Particularly to be noted is that the usable amount of energy
is different by type of fuel. The table below shows the measure of oil products in “litre” and in
“kcal”. The share of power in the total energy supply increased from 45.3% (12776489/28176274)
to 47.6% (117543699/246794898) in 2012.
Table 5- Petroleum fuels use by type (Litres), 2010–2012
Fuel type and usage 2010 2011 2012
Aviation gasoline (Avgas) used for in- 115,000 226,782 115,000
country flights
Jet fuel used for in-country flights 1,611,266 1,224,587 1,069,944
23Diesel fuel used for electricity generation 13,086,288 13,105,889 12,776,489
Diesel fuel used for land and sea transport 14,001,342 13,170,987 14,214,841
Total 28,813,896 27,728,245 28,176,274
Source: IRENA Pacific Lighthouses
Table 6 - Petroleum fuels use by type (‘000 kcal), 2010–2012
Fuel type and usage 2010 2011 2012
Aviation gasoline (Avgas) used for in- 966,000 1,904,969 966,000
country flights (8400kcal/l)
Jet fuel used for in-country flights 13,373,508 10,164,072 8,880,535
(8300kcal/l)
Diesel fuel used for electricity generation 120,393,850 120,574,179 117,543,699
(9200kcal/l)
Diesel fuel used for land and sea transport 117,611,273 110,636,291 119,404,664
(8400kcal/l)
Total 252,344,630 243,279,511 246,794,898
Energy from oil products can be measured in terms of physical dimensions such as weight and
volume. On the contrary, energy from renewables such as PV cannot be measured except as output
in the form of power in kWh (or equivalent caloric value). Thus, an energy balance table should
be constructed based on comparable energy units (e.g. kcal) for all sources of energy.
3 Important regional/international databases: Relevance and potential
The review of the required data structure and available data for Tonga for databases of both PRDR
and APEP was prepared in chapter 1. This section focusses on the value of relevance in regional
(PRDR) and international (APEP) context. They have distinguished characteristics as international
database for Asia-Pacific countries for the case of APEP and as a regional data base of the
community of SIDS in the case of PRDR. They are particularly useful for comparison among the
members of the community. For example, comparison of supply and demand data to see the
differences in energy efficiency, penetration of REs, energy prices etc. can suggest the way to
reach to improve and plan the energy supply and demand. Essentially, these databases are an
accumulation of data to learn from other countries.
3.1 Example of the use of PRDR as ONE STOP SEARCH
PRDR is a useful source for learning and comparing information across SIDs. However, given that
the data structure is not unified, and the level of data collection differs by country, it is difficult to
design a database that hosts standardized quantitative data. Rather, PRDR is very well designed
24for ease of submission and access using an electronic file as one unit to represent a focused group
of information.
Table 7 – Data sample from PRDR database
Sample by 1) Consumption 2) Income 3) Price
island/country
MWh/capita- 2012 GDP/capita (USD 2011 Tariff (USD cost for
const.) 200 kWh/month--
2011)
Am Samoa 2.79 10442.73 86.81
Chuuck 0.46 2961.79 112.4
Samoa 0.58 3634.57 86.52
Fiji 0.96 3719.89 32.47
Kosrae, FSM 0.12 2961.79 77.6
Niue 1.86 5800 99.86
Nauru 2.19 5469.16 20.65
Palau 4.41 9439.07 68.2
Kiribati 0.21 1471.55 82.87
Solomon 0.16 1428.86 176.16
Cook Is 1.93 12900 117.71
Tuvalu 0.62 3219.36 93.75
Tonga 0.51 3631.54 99.47
Vanuatu 0.26 2932.87 175.24
Source: MWh/Capita from http://prdrse4all.spc.int/data/content/pacific-utilities-2012-electricity-tariff-table-ppa-
benchmarking, Tariff from http://prdrse4all.spc.int/data/content/regional-power-utilities-basic-information-2011,
GDP (2011) from WDI and CIA Fact Book (Niue -2003 and Cook Island – median of 2005 and 2016 data)
For example, the above table is a set of cross-country data to estimate the elasticity of income and
price on the power demand. The data for power demand and tariff was retrieved from the PRDR
database. GDP and population statistics are from the World Development Indicators and the CIA
Fact book. The example’s cross-sectional variables are 1) Consumption, 2) Income, and 3) Price
using the data of these countries. The purpose is to formulate regression models to explain
consumption as variable using income and price as explanatory variables. In this case, linear
regression models “Y=β0 + β1 x [X1] + β2 x [X2]” and log transformed “LN(Y)=β0 + β1 x
LN[X1] + β2 x LN[X2]” are used by using Consumption for Y, Income for X1, and Price for X2.
The results of the regression analysis are shown below:
Linear model: RSquare 0.67, [Consumption] = 0.57(tStat .91) +.00027(tStat 4.47) x
[Income]-.0075(tStat -1.53) x [Price]
25Table 8 – Regression results 1
Variable Constant Income (GDP per Capita) Price (Tariff)
Coefficient 0.57 0.00027 -0.0075
t-value 0.91 4.47 -1.53
Double Log model: RSquare 0.82, LN[Consumption]=-10.03(tStat -4.19)+1.41(tStat 6.32) x
LN[Income]-.46(tStat -1.79) x LN[Price]
Table 9– Regression results 2
Variable Constant Income (GDP per Capita) Price (Tariff)
Coefficient -10.03 1.41 -0.46
t-value -4.19 6.32 -1.79
Both models show significant impacts of income and price on power demand, particularly in the
double log model. Both income and price elasticity are represented by the coefficients. In the
double-log model, income elasticity is 1.45 and price elasticity is -0.45. The strong positive impact
of income on power demand and the negative response to tariff are clearly indicated within these
results for the pacific region in the years 2011 and 2012.
The limitation is that the data is not updated, and the dataset is not from the government, but from
the Pacific Power Association. Timely and reliable data from the government could contribute to
the reliability of this kind of analysis.
3.2 Example of the use of APEP
ESCAP’s APEP is the most comprehensive energy and energy policy database available for the
Asia and the Pacific region, offering an interface for research, analysis and decision-making. The
portal consists of 200+ integrated datasets, 3000+ policy documents and 6100+ mapped power
plants. Comparisons across ESCAP member states and other world regions can be conducted as
shown in the following figures. The indicator used is ‘power consumption per capita (kWh)’.
Due to a lack of data, a comparison with Tonga is unavailable. However, a hypothetical
comparison has been constructed in this report (as shown in the following figure to visualize a
possible comparison. There are other important indicators missing for Tonga, such as ‘primary
energy supply’ and ‘final energy consumption’. However, these can be easily derived after the
creation of an energy balance table.
Data related to energy is in the menu “Energy and Natural Resources”. The first two items; are
considered highly important.
26Figure 8 - Power consumption per capita in Asia-Pacific sub-region (left)
Figure 9- Power consumption per capita including Tonga (right)
Tonga data
hypothetically
added
Source: ESCAP Source: ESCAP and Tonga from TPL
4 Data requirements for demand and supply forecasts
4.1 Trial estimates of relationship between demand and the drivers
The starting point for any energy related future planning is knowing the future demand. This
requires identifying the drivers of demand and formulating their numeric relationship. Since
energy consumption is a result of socio-economic activity, econometric analysis is one of the most
popular techniques for doing this.
This section offers a ‘trial analysis’ and selects two types of energy products 1) electric power and
2) motor gasoline, to represent the transport sector. These energy products are regarded as
commodities and are thereby influenced by two drivers: 1) income as a driver of use and 2) price.
Both these drivers are prepared to quantify their impacts on demand.
Variables:
Electric power consumption: annual total consumption of Tonga (kWh)
Motor gasoline: annual total consumption of motor gasoline (liter)
Income: GDP in constant USD (inflation adjusted)
Price of electric power: annual average electric power tariff (average of all 12 month). The tariff
was adjusted by the price deflator. Typically, the price deflator is CPI (consumer price index), but
in consideration that the dominant energy prices to be compared is the prices of oil products, crude
oil price, not CPI, was used as the index for deflation.
27Price of motor gasoline: Crude oil price in constant USD. Although, actual market) sales prices
are preferable, the availability is limited. Thus, crude oil price data (inflation adjusted constant
USD) from the BP statistics was used as the fuel prices and crude oil prices are closely linked.
Regression results: formulation of the relationships—1) linear and 2) double log
There are various formulations in the regression model. The selection of the formulation starts
typically from the simplest form. To represent simple formulations, two types of 1) linear and 2)
double log (or growth model) are prepared. The first model is the simplest in the form of Y=β0 +
β1 X1+ β2 X2…….+ βn Xn. The second model is the simplest in the form of Y=β0 x X1^β1x
X2^β2…….x Xn^βn. The latter can be transformed to LN(Y)= LN(β0) + β1 LN(X1) + β2
LN(X2)…….+ βn LN(Xn). The selection of model will be followed through the interpretation of
the various statistical properties, which will be explained in the next phase of the project. In this
trial case, two major indicators, ‘R-square’ and ‘t-statistic’ is also analyzed. The former represents
the fitness of the whole equation and the latter represent the fitness of each coefficient.
CASE of electric power demand 1: Explanatory variable - GDP only – t-values are followed in “()”
after the coefficient.
1) 1995-2015: R.767; [Power Consumption (kWh)] =-44178200(-4.26) +.23815(7.91) * GDP
2) 1995-2015: R.798; LN[Power Consumption (kWh)] =-26.975(-5.26)+2.259(8.66) * LN(GDP)
CASE of electric power demand 2: Explanatory variable - GDP and price
1) 1995-2015: R.743; [Power Consumption (kWh)] =-35710300(-2.31) +.23052(5.97) GDP-
594045000(-1.32) [Tariff/Crude oil price]
2) 1995-2015: R.779; LN[Power Consumption (kWh)] =-25.96(-4.03)+2.1629(6.44)
LN(GDP)-.19(-1.55) LN(Tariff/Crude oil price)
CASE of motor gasoline 1: Explanatory variable - GDP only
1) 2004-2016: R.301; [MOGAS Consumption (liter)]=-13005700(-1.07)+.071866(2.18) GDP
2) 2004-2016: R.245; LN[MOGAS Consumption (liter)]=-16.106(-.94)+1.6481(1.89) LN(GDP)
CASE of motor gasoline 2: Explanatory variable - GDP and price
1) 2004-2016:R.503;[MOGAS Consumption (liter)]=-7560150(-.681)+.067128(2.29) GDP-
43372(-2.02) [Crude oil price]
2) 2004-2016: R.450; LN[MOGAS Consumption (liter)]=-10.503(-.67)+1.417(1.79)
LN(GDP)-.2375(-1.93) LN(Crude oil price)
28You can also read